Zip Codes with the Highest Percentage of Not-for-profit Organizations in Gretna, LA
RELATED REPORTS & OPTIONS
Not-for-profit Organizations
Gretna
Compare Zip Codes
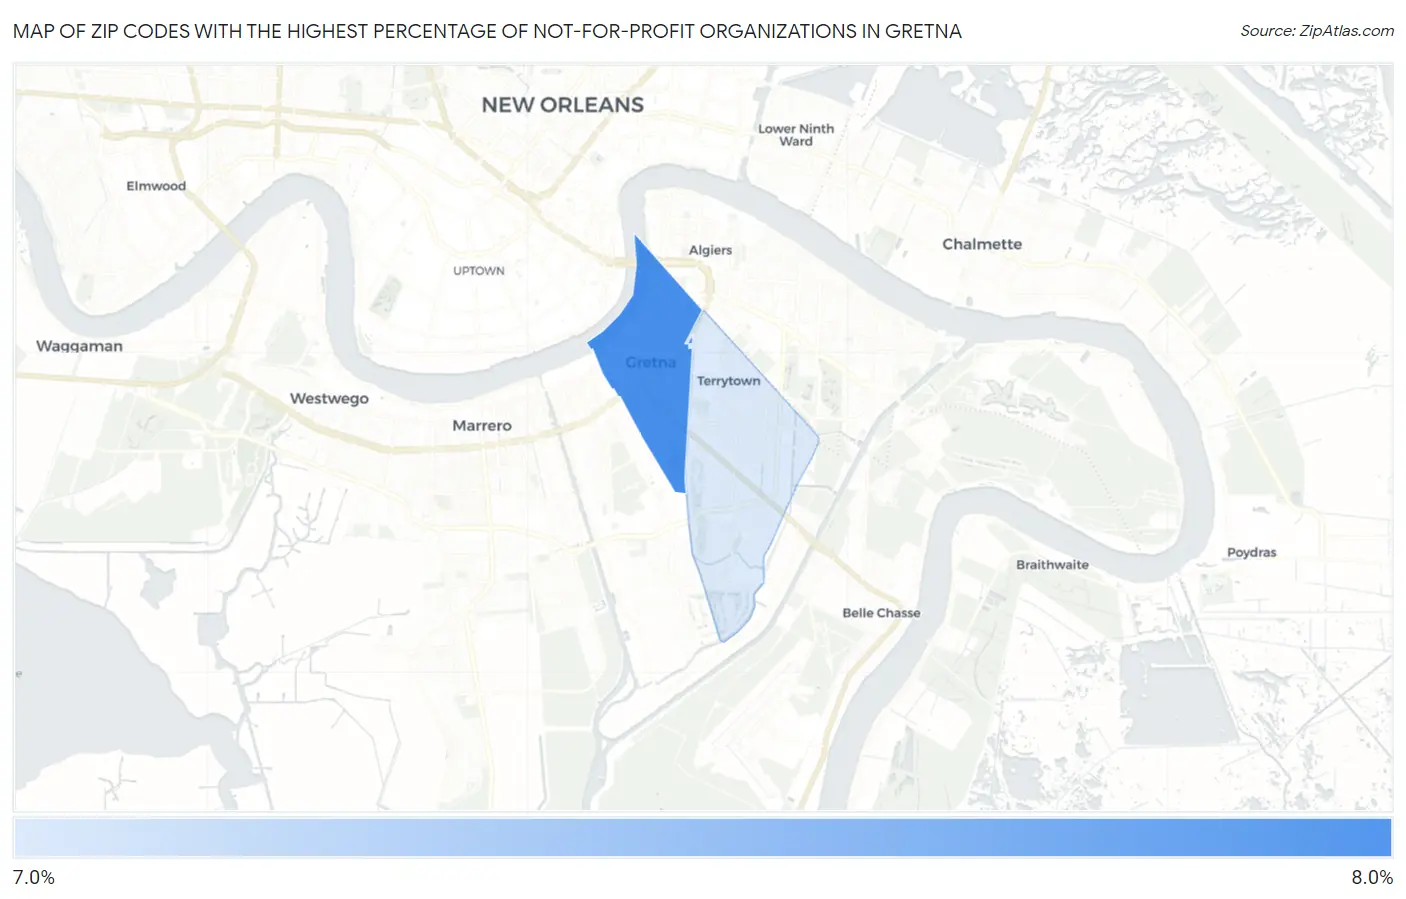
Map of Zip Codes with the Highest Percentage of Not-for-profit Organizations in Gretna
7.3%
7.5%
Zip Codes with the Highest Percentage of Not-for-profit Organizations in Gretna, LA
| Zip Code | % Employed in Not-for-profit | vs State | vs National | |
| 1. | 70053 | 7.5% | 7.0%(+0.496)#144 | 8.4%(-0.984)#15,195 |
| 2. | 70056 | 7.3% | 7.0%(+0.295)#154 | 8.4%(-1.19)#15,817 |
1
Common Questions
What are the Top Zip Codes with the Highest Percentage of Not-for-profit Organizations in Gretna, LA?
Top Zip Codes with the Highest Percentage of Not-for-profit Organizations in Gretna, LA are:
What zip code has the Highest Percentage of Not-for-profit Organizations in Gretna, LA?
70053 has the Highest Percentage of Not-for-profit Organizations in Gretna, LA with 7.5%.
What is the Percentage of Not-for-profit Organizations in Gretna, LA?
Percentage of Not-for-profit Organizations in Gretna is 7.2%.
What is the Percentage of Not-for-profit Organizations in Louisiana?
Percentage of Not-for-profit Organizations in Louisiana is 7.0%.
What is the Percentage of Not-for-profit Organizations in the United States?
Percentage of Not-for-profit Organizations in the United States is 8.4%.