Zip Codes with the Highest Percentage of Population Taking Taxi / Cab to Work in Gretna, LA
RELATED REPORTS & OPTIONS
Taxi / Cab
Gretna
Compare Zip Codes
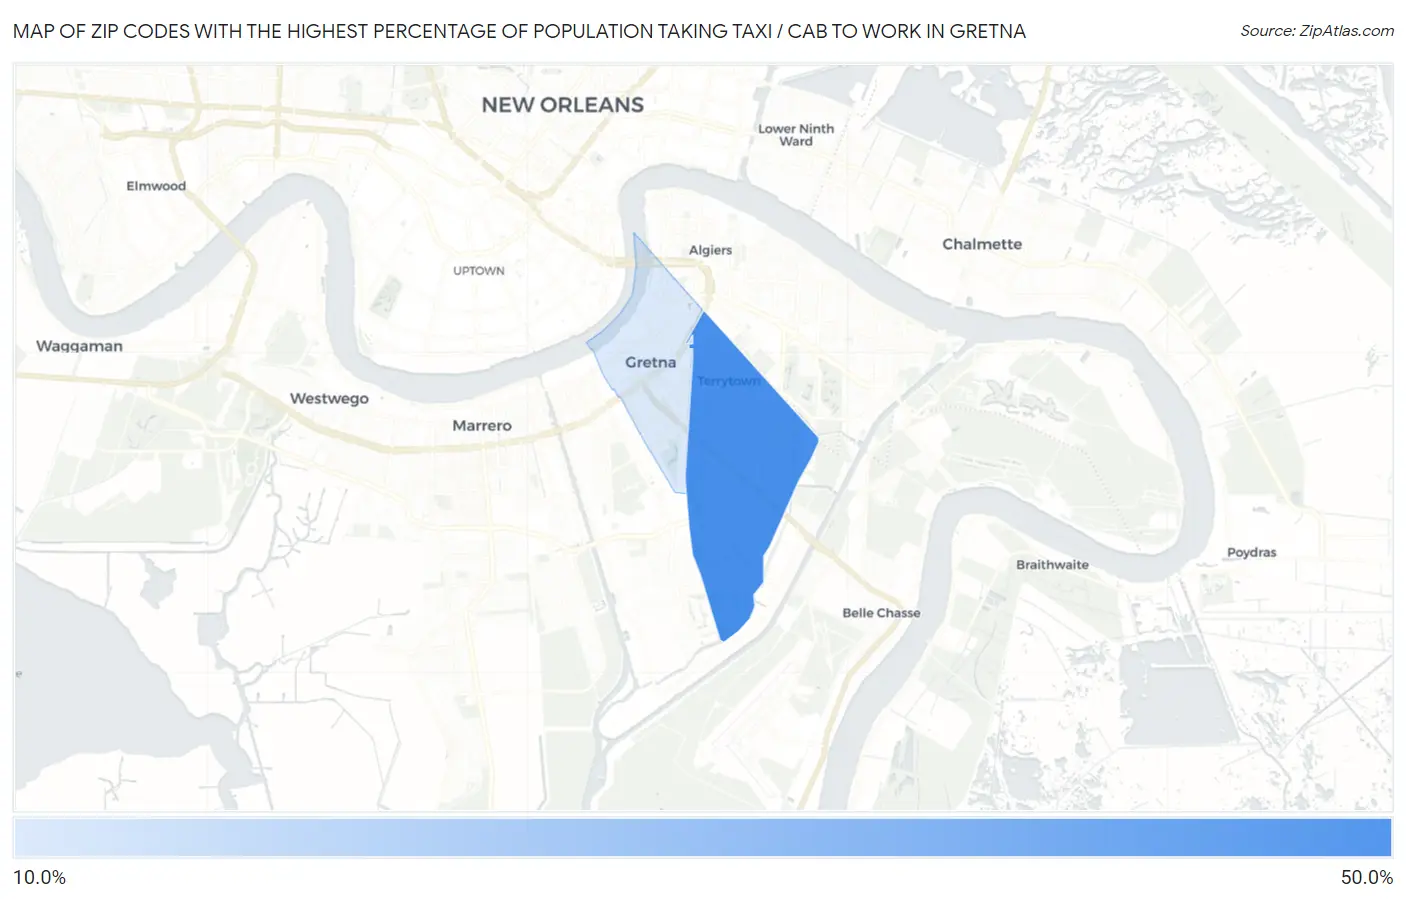
Map of Zip Codes with the Highest Percentage of Population Taking Taxi / Cab to Work in Gretna
19.7%
45.2%
Zip Codes with the Highest Percentage of Population Taking Taxi / Cab to Work in Gretna, LA
| Zip Code | % Take Taxi / Cab | vs State | vs National | |
| 1. | 70056 | 45.2% | 38.2%(+7.00)#58 | 38.2%(+7.00)#4,575 |
| 2. | 70053 | 19.7% | 38.2%(-18.5)#202 | 38.2%(-18.5)#13,080 |
1
Common Questions
What are the Top Zip Codes with the Highest Percentage of Population Taking Taxi / Cab to Work in Gretna, LA?
Top Zip Codes with the Highest Percentage of Population Taking Taxi / Cab to Work in Gretna, LA are:
What zip code has the Highest Percentage of Population Taking Taxi / Cab to Work in Gretna, LA?
70056 has the Highest Percentage of Population Taking Taxi / Cab to Work in Gretna, LA with 45.2%.
What is the Percentage of Population Taking Taxi / Cab to Work in Gretna, LA?
Percentage of Population Taking Taxi / Cab to Work in Gretna is 19.7%.
What is the Percentage of Population Taking Taxi / Cab to Work in Louisiana?
Percentage of Population Taking Taxi / Cab to Work in Louisiana is 38.2%.
What is the Percentage of Population Taking Taxi / Cab to Work in the United States?
Percentage of Population Taking Taxi / Cab to Work in the United States is 38.2%.