Zip Codes with the Highest Percentage of Population Employed in Legal Services & Support in Gretna, LA
RELATED REPORTS & OPTIONS
Legal Services & Support
Gretna
Compare Zip Codes
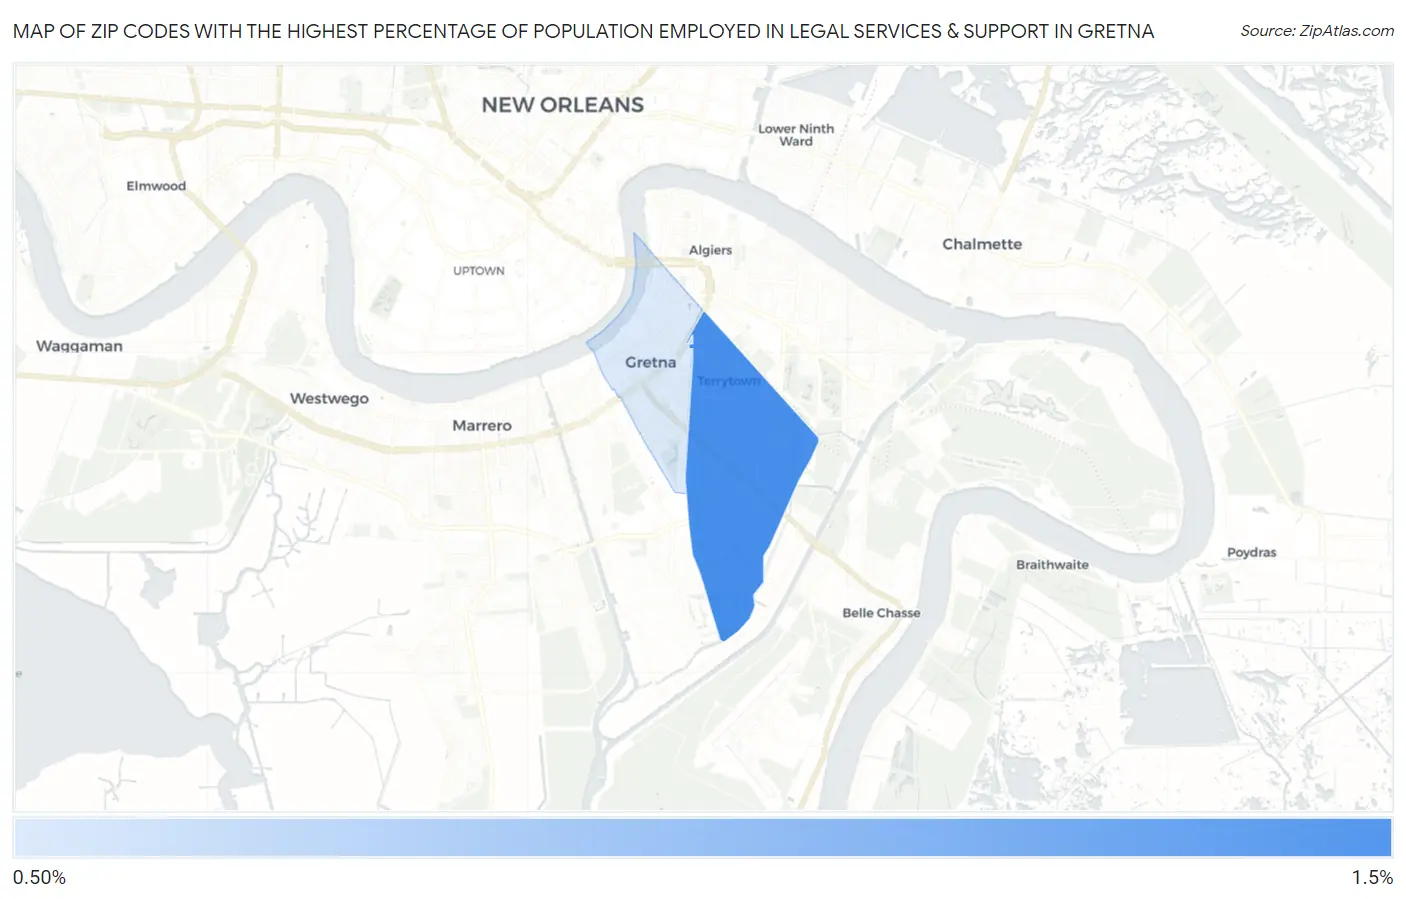
Map of Zip Codes with the Highest Percentage of Population Employed in Legal Services & Support in Gretna
1.4%
1.5%
Zip Codes with the Highest Percentage of Population Employed in Legal Services & Support in Gretna, LA
| Zip Code | % Employed | vs State | vs National | |
| 1. | 70056 | 1.5% | 1.3%(+0.146)#99 | 1.2%(+0.293)#5,140 |
| 2. | 70053 | 1.4% | 1.3%(+0.088)#103 | 1.2%(+0.234)#5,382 |
1
Common Questions
What are the Top Zip Codes with the Highest Percentage of Population Employed in Legal Services & Support in Gretna, LA?
Top Zip Codes with the Highest Percentage of Population Employed in Legal Services & Support in Gretna, LA are:
What zip code has the Highest Percentage of Population Employed in Legal Services & Support in Gretna, LA?
70056 has the Highest Percentage of Population Employed in Legal Services & Support in Gretna, LA with 1.5%.
What is the Percentage of Population Employed in Legal Services & Support in Gretna, LA?
Percentage of Population Employed in Legal Services & Support in Gretna is 1.3%.
What is the Percentage of Population Employed in Legal Services & Support in Louisiana?
Percentage of Population Employed in Legal Services & Support in Louisiana is 1.3%.
What is the Percentage of Population Employed in Legal Services & Support in the United States?
Percentage of Population Employed in Legal Services & Support in the United States is 1.2%.