Vietnamese vs Immigrants from Poland Wage/Income Gap

COMPARE

Vietnamese
Race
Ancestry
AfghanAfricanAlaska NativeAlaskan AthabascanAlbanianAleutAlsatianAmericanApacheArabArapahoArgentineanArmenianAssyrian/Chaldean/SyriacAustralianAustrianBahamianBangladeshiBarbadianBasqueBelgianBelizeanBermudanBhutaneseBlackfeetBolivianBrazilianBritishBritish West IndianBulgarianBurmeseCajunCambodianCanadianCape VerdeanCarpatho RusynCelticCentral AmericanCentral American IndianCherokeeCheyenneChickasawChileanChineseChippewaChoctawColombianColvilleComancheCosta RicanCreeCreekCroatianCrowCubanCypriotCzechCzechoslovakianDanishDelawareDominicanDutchDutch West IndianEastern EuropeanEcuadorianEgyptianEnglishEstonianEthiopianEuropeanFijianFilipinoFinnishFrenchFrench American IndianFrench CanadianGermanGerman RussianGhanaianGreekGuamanian/ChamorroGuatemalanGuyaneseHaitianHmongHonduranHopiHoumaHungarianIcelanderIndian (Asian)IndonesianInupiatIranianIraqiIrishIroquoisIsraeliItalianJamaicanJapaneseJordanianKenyanKiowaKoreanLaotianLatvianLebaneseLiberianLithuanianLumbeeLuxembourgerMacedonianMalaysianMalteseMarshalleseMenomineeMexicanMexican American IndianMongolianMoroccanNative HawaiianNavajoNepaleseNew ZealanderNicaraguanNigerianNorthern EuropeanNorwegianOkinawanOsageOttawaPaiutePakistaniPalestinianPanamanianParaguayanPennsylvania GermanPeruvianPimaPolishPortuguesePotawatomiPuebloPuerto RicanPuget Sound SalishRomanianRussianSalvadoranSamoanScandinavianScotch-IrishScottishSeminoleSenegaleseSerbianShoshoneSierra LeoneanSiouxSlavicSlovakSloveneSomaliSouth AfricanSouth AmericanSouth American IndianSoviet UnionSpaniardSpanishSpanish AmericanSpanish American IndianSri LankanSubsaharan AfricanSudaneseSwedishSwissSyrianTaiwaneseThaiTlingit-HaidaTohono O'OdhamTonganTrinidadian and TobagonianTsimshianTurkishU.S. Virgin IslanderUgandanUkrainianUruguayanUteVenezuelanVietnameseWelshWest IndianYakamaYaquiYugoslavianYumanYup'ikZimbabwean
Immigration
NonimmigrantsImmigrantsAfghanistanAfricaAlbaniaArgentinaArmeniaAsiaAustraliaAustriaBahamasBangladeshBarbadosBelarusBelgiumBelizeBoliviaBosnia and HerzegovinaBrazilBulgariaBurma/MyanmarCabo VerdeCambodiaCameroonCanadaCaribbeanCentral AmericaChileChinaColombiaCongoCosta RicaCroatiaCubaCzechoslovakiaDenmarkDominicaDominican RepublicEastern AfricaEastern AsiaEastern EuropeEcuadorEgyptEl SalvadorEnglandEritreaEthiopiaEuropeFijiFranceGermanyGhanaGreeceGrenadaGuatemalaGuyanaHaitiHondurasHong KongHungaryIndiaIndonesiaIranIraqIrelandIsraelItalyJamaicaJapanJordanKazakhstanKenyaKoreaKuwaitLaosLatin AmericaLatviaLebanonLiberiaLithuaniaMalaysiaMexicoMicronesiaMiddle AfricaMoldovaMoroccoNepalNetherlandsNicaraguaNigeriaNorth AmericaNorth MacedoniaNorthern AfricaNorthern EuropeNorwayOceaniaPakistanPanamaPeruPhilippinesPortugalRomaniaRussiaSaudi ArabiaScotlandSenegalSerbiaSierra LeoneSingaporeSomaliaSouth AfricaSouth AmericaSouth Central AsiaSouth Eastern AsiaSouthern EuropeSpainSri LankaSt. Vincent and the GrenadinesSudanSwedenSwitzerlandSyriaTaiwanThailandTrinidad and TobagoTurkeyUgandaUkraineUruguayUzbekistanVenezuelaVietnamWest IndiesWestern AfricaWestern AsiaWestern EuropeYemenZaireZimbabweAzores
Immigrants from Poland
Race
Ancestry
AfghanAfricanAlaska NativeAlaskan AthabascanAlbanianAleutAlsatianAmericanApacheArabArapahoArgentineanArmenianAssyrian/Chaldean/SyriacAustralianAustrianBahamianBangladeshiBarbadianBasqueBelgianBelizeanBermudanBhutaneseBlackfeetBolivianBrazilianBritishBritish West IndianBulgarianBurmeseCajunCambodianCanadianCape VerdeanCarpatho RusynCelticCentral AmericanCentral American IndianCherokeeCheyenneChickasawChileanChineseChippewaChoctawColombianColvilleComancheCosta RicanCreeCreekCroatianCrowCubanCypriotCzechCzechoslovakianDanishDelawareDominicanDutchDutch West IndianEastern EuropeanEcuadorianEgyptianEnglishEstonianEthiopianEuropeanFijianFilipinoFinnishFrenchFrench American IndianFrench CanadianGermanGerman RussianGhanaianGreekGuamanian/ChamorroGuatemalanGuyaneseHaitianHmongHonduranHopiHoumaHungarianIcelanderIndian (Asian)IndonesianInupiatIranianIraqiIrishIroquoisIsraeliItalianJamaicanJapaneseJordanianKenyanKiowaKoreanLaotianLatvianLebaneseLiberianLithuanianLumbeeLuxembourgerMacedonianMalaysianMalteseMarshalleseMenomineeMexicanMexican American IndianMongolianMoroccanNative HawaiianNavajoNepaleseNew ZealanderNicaraguanNigerianNorthern EuropeanNorwegianOkinawanOsageOttawaPaiutePakistaniPalestinianPanamanianParaguayanPennsylvania GermanPeruvianPimaPolishPortuguesePotawatomiPuebloPuerto RicanPuget Sound SalishRomanianRussianSalvadoranSamoanScandinavianScotch-IrishScottishSeminoleSenegaleseSerbianShoshoneSierra LeoneanSiouxSlavicSlovakSloveneSomaliSouth AfricanSouth AmericanSouth American IndianSoviet UnionSpaniardSpanishSpanish AmericanSpanish American IndianSri LankanSubsaharan AfricanSudaneseSwedishSwissSyrianTaiwaneseThaiTlingit-HaidaTohono O'OdhamTonganTrinidadian and TobagonianTsimshianTurkishU.S. Virgin IslanderUgandanUkrainianUruguayanUteVenezuelanWelshWest IndianYakamaYaquiYugoslavianYumanYup'ikZimbabwean
Immigration
NonimmigrantsImmigrantsAfghanistanAfricaAlbaniaArgentinaArmeniaAsiaAustraliaAustriaBahamasBangladeshBarbadosBelarusBelgiumBelizeBoliviaBosnia and HerzegovinaBrazilBulgariaBurma/MyanmarCabo VerdeCambodiaCameroonCanadaCaribbeanCentral AmericaChileChinaColombiaCongoCosta RicaCroatiaCubaCzechoslovakiaDenmarkDominicaDominican RepublicEastern AfricaEastern AsiaEastern EuropeEcuadorEgyptEl SalvadorEnglandEritreaEthiopiaEuropeFijiFranceGermanyGhanaGreeceGrenadaGuatemalaGuyanaHaitiHondurasHong KongHungaryIndiaIndonesiaIranIraqIrelandIsraelItalyJamaicaJapanJordanKazakhstanKenyaKoreaKuwaitLaosLatin AmericaLatviaLebanonLiberiaLithuaniaMalaysiaMexicoMicronesiaMiddle AfricaMoldovaMoroccoNepalNetherlandsNicaraguaNigeriaNorth AmericaNorth MacedoniaNorthern AfricaNorthern EuropeNorwayOceaniaPakistanPanamaPeruPhilippinesPolandPortugalRomaniaRussiaSaudi ArabiaScotlandSenegalSerbiaSierra LeoneSingaporeSomaliaSouth AfricaSouth AmericaSouth Central AsiaSouth Eastern AsiaSouthern EuropeSpainSri LankaSt. Vincent and the GrenadinesSudanSwedenSwitzerlandSyriaTaiwanThailandTrinidad and TobagoTurkeyUgandaUkraineUruguayUzbekistanVenezuelaVietnamWest IndiesWestern AfricaWestern AsiaWestern EuropeYemenZaireZimbabweAzores
Wage/Income Gap
Income
Poverty
Unemployment
Labor Participation
Family Structure
Vehicle Availability
Education Level
Disability

Wage/Income Gap Comparison

Vietnamese

Immigrants from Poland

Exceptional
Tragic
21.0%
WAGE/INCOME GAP
100.0/ 100
METRIC RATING
31st/ 347
METRIC RANK
26.7%
WAGE/INCOME GAP
8.9/ 100
METRIC RATING
219th/ 347
METRIC RANK

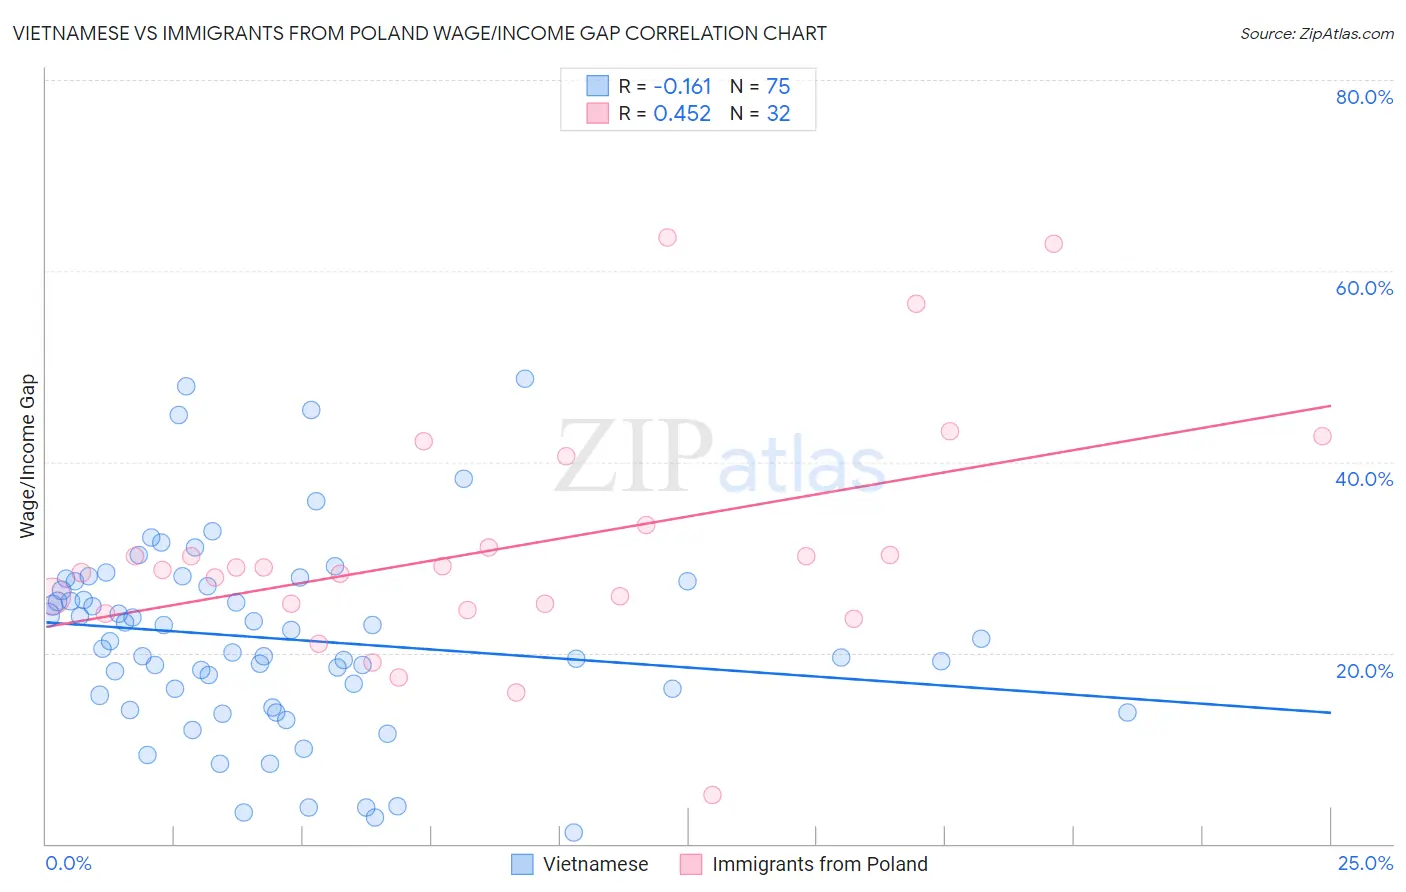
Vietnamese vs Immigrants from Poland Wage/Income Gap Correlation Chart

The statistical analysis conducted on geographies consisting of 170,722,757 people shows a poor negative correlation between the proportion of Vietnamese and wage/income gap percentage in the United States with a correlation coefficient (R) of -0.161 and weighted average of 21.0%. Similarly, the statistical analysis conducted on geographies consisting of 304,701,845 people shows a moderate positive correlation between the proportion of Immigrants from Poland and wage/income gap percentage in the United States with a correlation coefficient (R) of 0.452 and weighted average of 26.7%, a difference of 27.3%.
Vietnamese vs Immigrants from Poland Wage/Income Gap

Wage/Income Gap Correlation Summary

MeasurementVietnameseImmigrants from Poland
Minimum1.1%5.1%
Maximum48.7%63.5%
Range47.5%58.4%
Mean21.5%30.9%
Median21.2%28.8%
Interquartile 25% (IQ1)15.6%24.8%
Interquartile 75% (IQ3)27.5%32.3%
Interquartile Range (IQR)11.9%7.5%
Standard Deviation (Sample)10.1%12.5%
Standard Deviation (Population)10.0%12.3%

Similar Demographics by Wage/Income Gap

Demographics Similar to Vietnamese by Wage/Income Gap

In terms of wage/income gap, the demographic groups most similar to Vietnamese are Immigrants from Yemen (21.1%, a difference of 0.23%), Immigrants from Bahamas (21.1%, a difference of 0.25%), Immigrants from Bangladesh (20.9%, a difference of 0.28%), Immigrants from Senegal (20.9%, a difference of 0.49%), and Pima (21.1%, a difference of 0.53%).
DemographicsRating | RankWage/Income Gap
Dominicans
100.0
/100
|
#24
Exceptional
20.6%
Senegalese
100.0
/100
|
#25
Exceptional
20.7%
Pueblo
100.0
/100
|
#26
Exceptional
20.7%
Immigrants | Armenia
100.0
/100
|
#27
Exceptional
20.7%
Inupiat
100.0
/100
|
#28
Exceptional
20.8%
Immigrants | Senegal
100.0
/100
|
#29
Exceptional
20.9%
Immigrants | Bangladesh
100.0
/100
|
#30
Exceptional
20.9%
Vietnamese
100.0
/100
|
#31
Exceptional
21.0%
Immigrants | Yemen
100.0
/100
|
#32
Exceptional
21.1%
Immigrants | Bahamas
100.0
/100
|
#33
Exceptional
21.1%
Pima
100.0
/100
|
#34
Exceptional
21.1%
Somalis
100.0
/100
|
#35
Exceptional
21.2%
Belizeans
100.0
/100
|
#36
Exceptional
21.2%
Immigrants | Somalia
100.0
/100
|
#37
Exceptional
21.2%
Immigrants | Belize
100.0
/100
|
#38
Exceptional
21.3%

Demographics Similar to Immigrants from Poland by Wage/Income Gap

In terms of wage/income gap, the demographic groups most similar to Immigrants from Poland are Immigrants from Latvia (26.7%, a difference of 0.010%), Immigrants from Saudi Arabia (26.7%, a difference of 0.030%), Brazilian (26.7%, a difference of 0.050%), Immigrants from Spain (26.8%, a difference of 0.080%), and Immigrants from Portugal (26.7%, a difference of 0.11%).
DemographicsRating | RankWage/Income Gap
Iraqis
11.2
/100
|
#212
Poor
26.6%
Immigrants | Iraq
10.3
/100
|
#213
Poor
26.7%
Immigrants | China
10.3
/100
|
#214
Poor
26.7%
Yugoslavians
9.7
/100
|
#215
Tragic
26.7%
Immigrants | Portugal
9.5
/100
|
#216
Tragic
26.7%
Brazilians
9.2
/100
|
#217
Tragic
26.7%
Immigrants | Saudi Arabia
9.1
/100
|
#218
Tragic
26.7%
Immigrants | Poland
8.9
/100
|
#219
Tragic
26.7%
Immigrants | Latvia
8.9
/100
|
#220
Tragic
26.7%
Immigrants | Spain
8.5
/100
|
#221
Tragic
26.8%
Bolivians
8.3
/100
|
#222
Tragic
26.8%
Jordanians
8.0
/100
|
#223
Tragic
26.8%
Immigrants | Argentina
7.2
/100
|
#224
Tragic
26.8%
Immigrants | Ireland
6.5
/100
|
#225
Tragic
26.9%
Asians
5.9
/100
|
#226
Tragic
26.9%