Zip Codes with the Highest Percentage of Dutch Population in East Saint Louis, IL
RELATED REPORTS & OPTIONS
Dutch
East Saint Louis
Compare Zip Codes
Map of Zip Codes with the Highest Percentage of Dutch Population in East Saint Louis
0.035%
1.15%
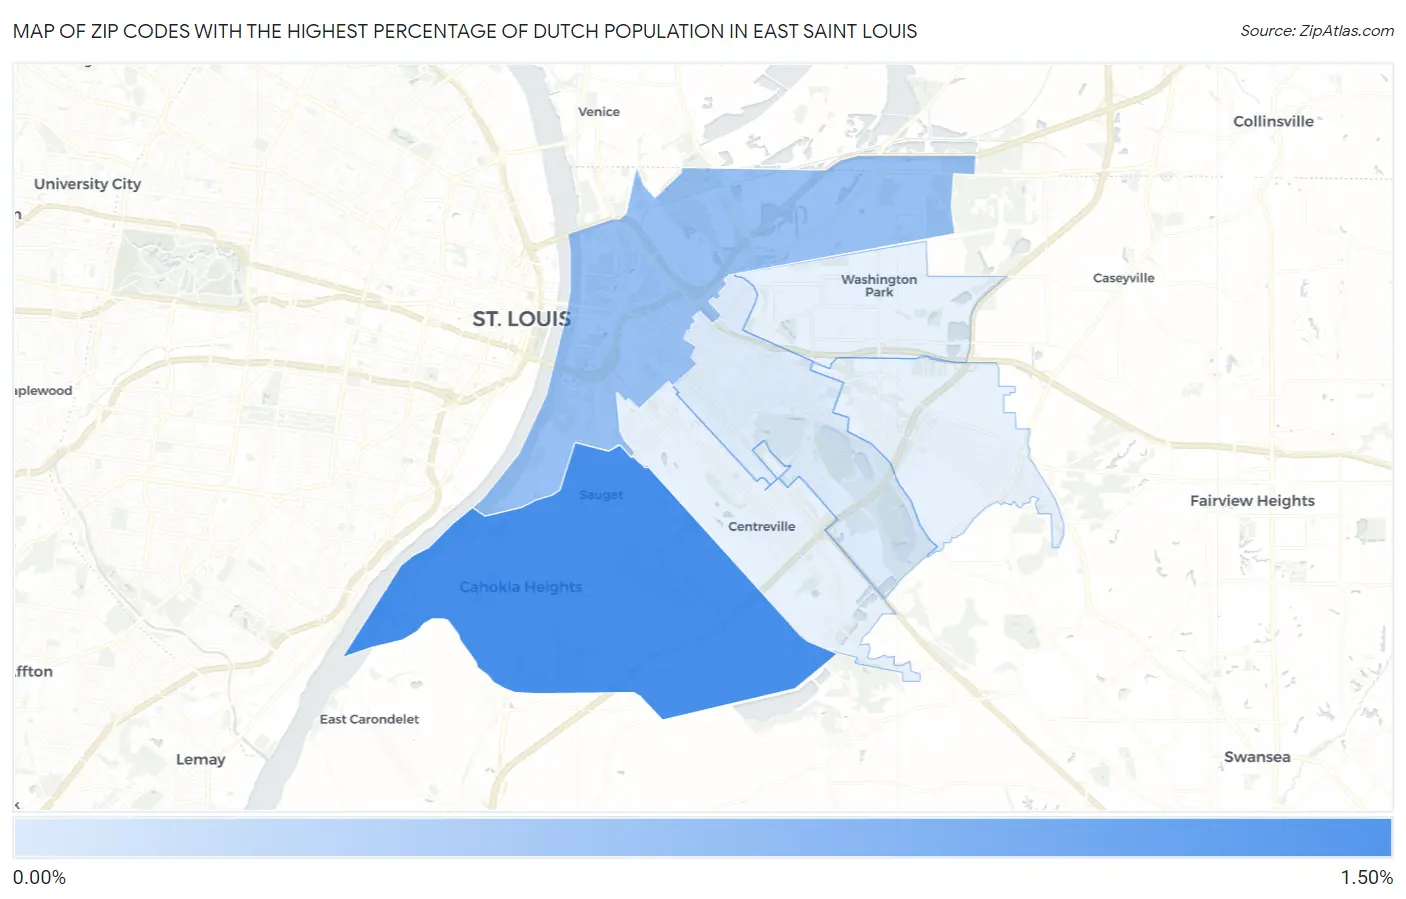
Zip Codes with the Highest Percentage of Dutch Population in East Saint Louis, IL
| Zip Code | Dutch | vs State | vs National | |
| 1. | 62206 | 1.15% | 1.04%(+0.111)#553 | 1.01%(+0.136)#11,055 |
| 2. | 62201 | 0.54% | 1.04%(-0.497)#887 | 1.01%(-0.472)#18,062 |
| 3. | 62205 | 0.035% | 1.04%(-1.00)#1,136 | 1.01%(-0.979)#24,586 |
1
Common Questions
What are the Top 5 Zip Codes with the Highest Percentage of Dutch Population in East Saint Louis, IL?
Top 5 Zip Codes with the Highest Percentage of Dutch Population in East Saint Louis, IL are:
What zip code has the Highest Percentage of Dutch Population in East Saint Louis, IL?
62206 has the Highest Percentage of Dutch Population in East Saint Louis, IL with 1.15%.
What is the Percentage of Dutch Population in Illinois?
Percentage of Dutch Population in Illinois is 1.04%.
What is the Percentage of Dutch Population in the United States?
Percentage of Dutch Population in the United States is 1.01%.