Zip Codes with the Highest Percentage of Households Without a Vehicle in East Saint Louis, IL
RELATED REPORTS & OPTIONS
Households without a Cars
East Saint Louis
Compare Zip Codes
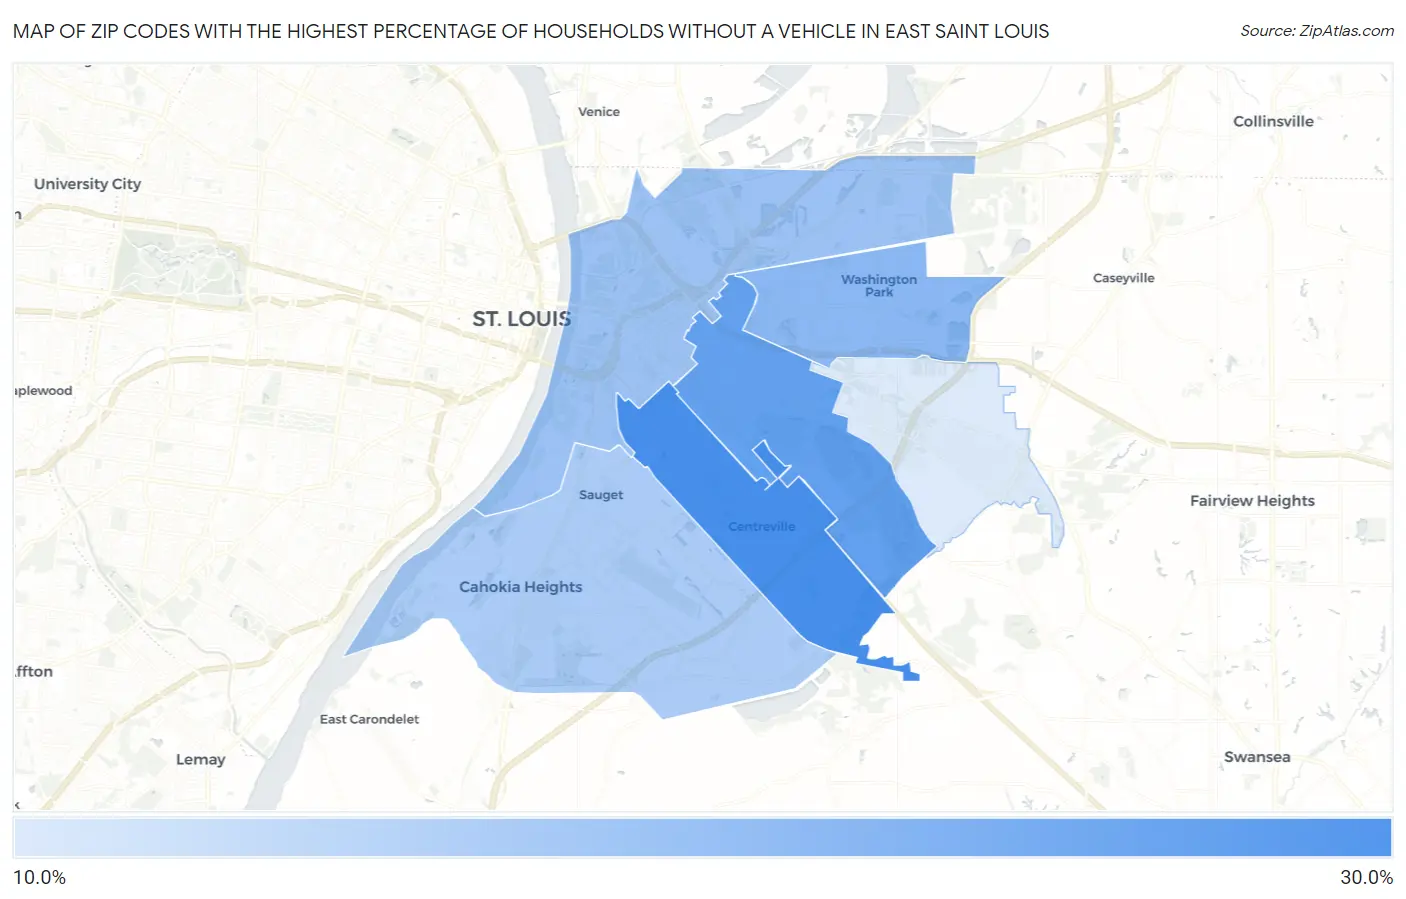
Map of Zip Codes with the Highest Percentage of Households Without a Vehicle in East Saint Louis
10.0%
29.5%
Zip Codes with the Highest Percentage of Households Without a Vehicle in East Saint Louis, IL
| Zip Code | Housholds Without a Car | vs State | vs National | |
| 1. | 62207 | 29.5% | 10.8%(+18.7)#40 | 8.3%(+21.2)#825 |
| 2. | 62205 | 25.8% | 10.8%(+15.0)#47 | 8.3%(+17.5)#1,019 |
| 3. | 62204 | 20.4% | 10.8%(+9.60)#64 | 8.3%(+12.1)#1,454 |
| 4. | 62201 | 18.4% | 10.8%(+7.60)#76 | 8.3%(+10.1)#1,728 |
| 5. | 62206 | 16.2% | 10.8%(+5.40)#83 | 8.3%(+7.90)#2,110 |
| 6. | 62203 | 10.0% | 10.8%(-0.800)#176 | 8.3%(+1.70)#4,882 |
1
Common Questions
What are the Top 5 Zip Codes with the Highest Percentage of Households Without a Vehicle in East Saint Louis, IL?
Top 5 Zip Codes with the Highest Percentage of Households Without a Vehicle in East Saint Louis, IL are:
What zip code has the Highest Percentage of Households Without a Vehicle in East Saint Louis, IL?
62207 has the Highest Percentage of Households Without a Vehicle in East Saint Louis, IL with 29.5%.
What is the Percentage of Households Without a Vehicle in Illinois?
Percentage of Households Without a Vehicle in Illinois is 10.8%.
What is the Percentage of Households Without a Vehicle in the United States?
Percentage of Households Without a Vehicle in the United States is 8.3%.