Zip Codes with the Highest Percentage of Population Employed in Security & Protection in East Saint Louis, IL
RELATED REPORTS & OPTIONS
Security & Protection
East Saint Louis
Compare Zip Codes
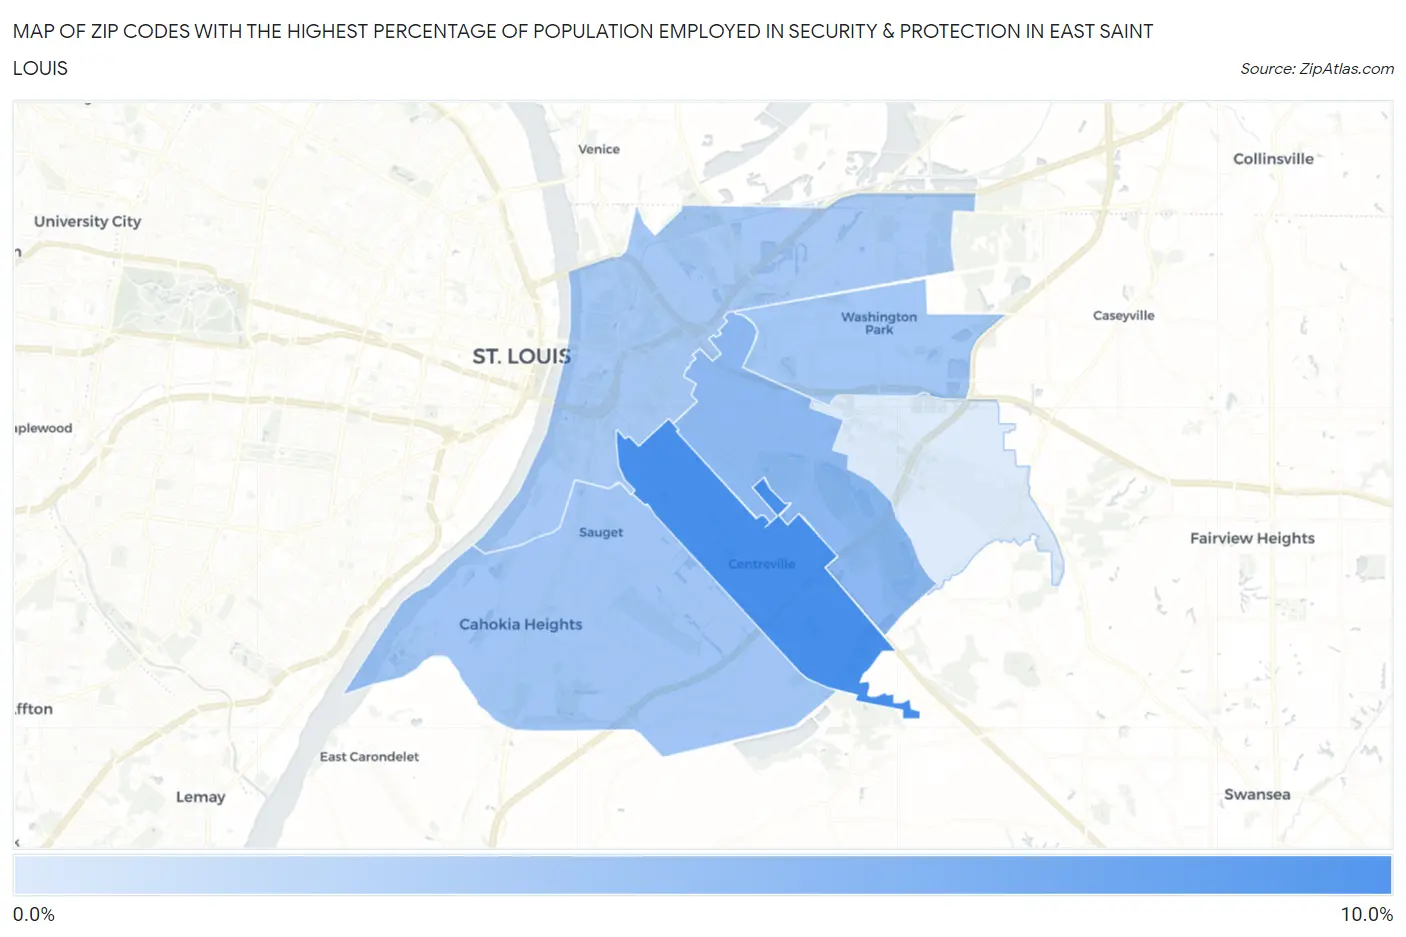
Map of Zip Codes with the Highest Percentage of Population Employed in Security & Protection in East Saint Louis
1.4%
9.7%
Zip Codes with the Highest Percentage of Population Employed in Security & Protection in East Saint Louis, IL
| Zip Code | % Employed | vs State | vs National | |
| 1. | 62207 | 9.7% | 2.2%(+7.54)#28 | 2.1%(+7.58)#802 |
| 2. | 62205 | 5.8% | 2.2%(+3.58)#86 | 2.1%(+3.63)#2,231 |
| 3. | 62206 | 4.7% | 2.2%(+2.48)#136 | 2.1%(+2.52)#3,340 |
| 4. | 62204 | 4.6% | 2.2%(+2.37)#143 | 2.1%(+2.41)#3,512 |
| 5. | 62201 | 4.5% | 2.2%(+2.26)#150 | 2.1%(+2.31)#3,680 |
| 6. | 62203 | 1.4% | 2.2%(-0.762)#726 | 2.1%(-0.719)#16,738 |
1
Common Questions
What are the Top 5 Zip Codes with the Highest Percentage of Population Employed in Security & Protection in East Saint Louis, IL?
Top 5 Zip Codes with the Highest Percentage of Population Employed in Security & Protection in East Saint Louis, IL are:
What zip code has the Highest Percentage of Population Employed in Security & Protection in East Saint Louis, IL?
62207 has the Highest Percentage of Population Employed in Security & Protection in East Saint Louis, IL with 9.7%.
What is the Percentage of Population Employed in Security & Protection in Illinois?
Percentage of Population Employed in Security & Protection in Illinois is 2.2%.
What is the Percentage of Population Employed in Security & Protection in the United States?
Percentage of Population Employed in Security & Protection in the United States is 2.1%.