Zip Codes with the Highest Percentage of Population Employed in Food Preparation & Serving in East Saint Louis, IL
RELATED REPORTS & OPTIONS
Food Preparation & Serving
East Saint Louis
Compare Zip Codes
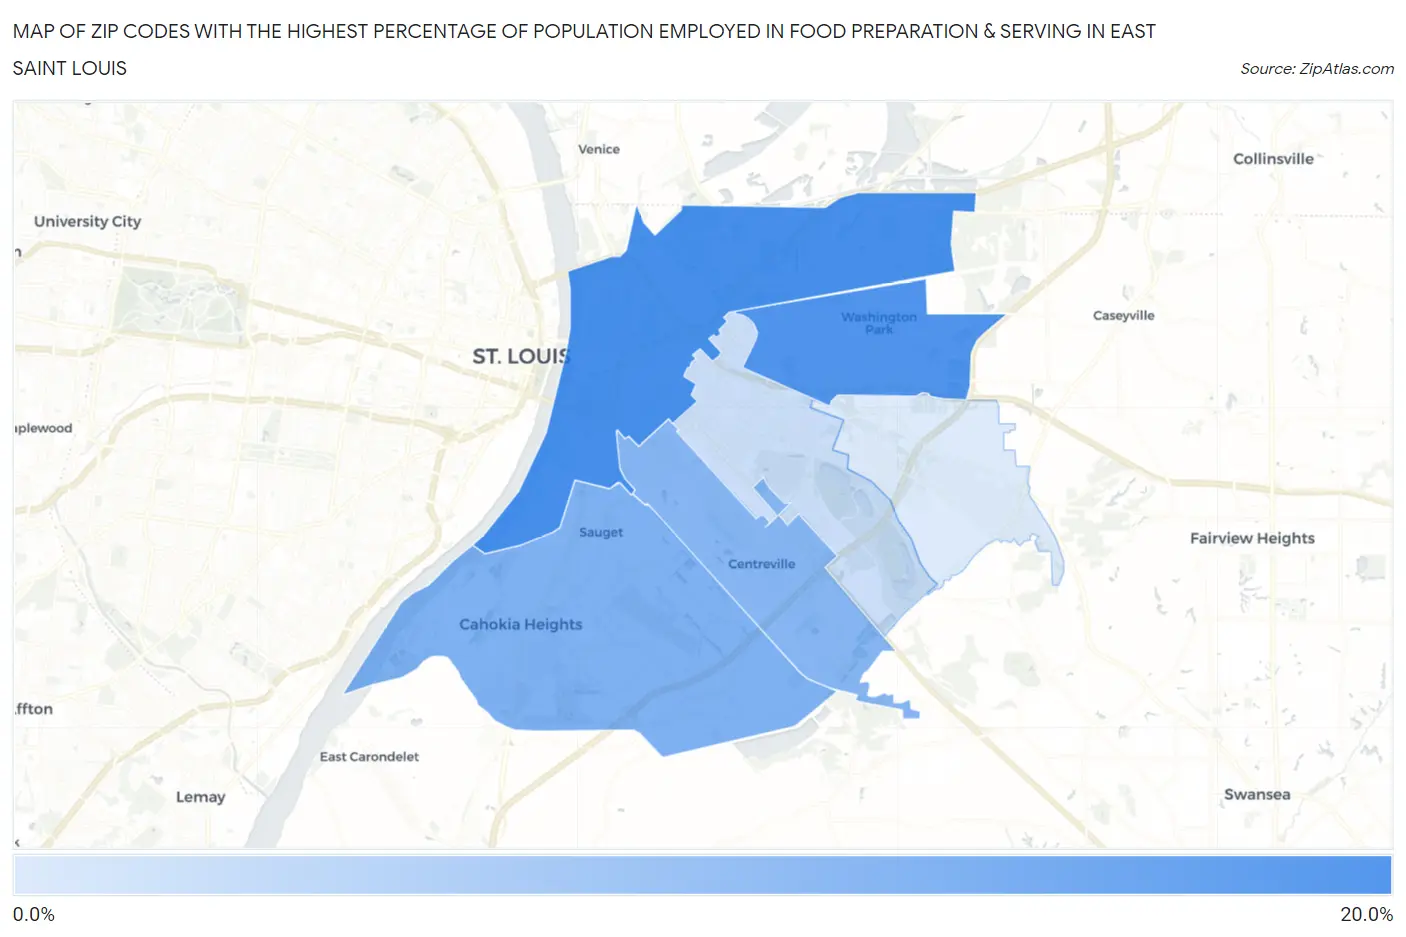
Map of Zip Codes with the Highest Percentage of Population Employed in Food Preparation & Serving in East Saint Louis
1.9%
15.6%
Zip Codes with the Highest Percentage of Population Employed in Food Preparation & Serving in East Saint Louis, IL
| Zip Code | % Employed | vs State | vs National | |
| 1. | 62201 | 15.6% | 5.0%(+10.5)#27 | 5.3%(+10.3)#907 |
| 2. | 62204 | 14.7% | 5.0%(+9.70)#35 | 5.3%(+9.45)#1,023 |
| 3. | 62206 | 10.3% | 5.0%(+5.29)#95 | 5.3%(+5.04)#2,409 |
| 4. | 62207 | 9.6% | 5.0%(+4.60)#116 | 5.3%(+4.35)#2,936 |
| 5. | 62205 | 3.4% | 5.0%(-1.59)#838 | 5.3%(-1.84)#19,432 |
| 6. | 62203 | 1.9% | 5.0%(-3.13)#1,108 | 5.3%(-3.38)#24,980 |
1
Common Questions
What are the Top 5 Zip Codes with the Highest Percentage of Population Employed in Food Preparation & Serving in East Saint Louis, IL?
Top 5 Zip Codes with the Highest Percentage of Population Employed in Food Preparation & Serving in East Saint Louis, IL are:
What zip code has the Highest Percentage of Population Employed in Food Preparation & Serving in East Saint Louis, IL?
62201 has the Highest Percentage of Population Employed in Food Preparation & Serving in East Saint Louis, IL with 15.6%.
What is the Percentage of Population Employed in Food Preparation & Serving in Illinois?
Percentage of Population Employed in Food Preparation & Serving in Illinois is 5.0%.
What is the Percentage of Population Employed in Food Preparation & Serving in the United States?
Percentage of Population Employed in Food Preparation & Serving in the United States is 5.3%.