Zip Codes with the Highest Percentage of Households With One or more Vehicles in East Saint Louis, IL
RELATED REPORTS & OPTIONS
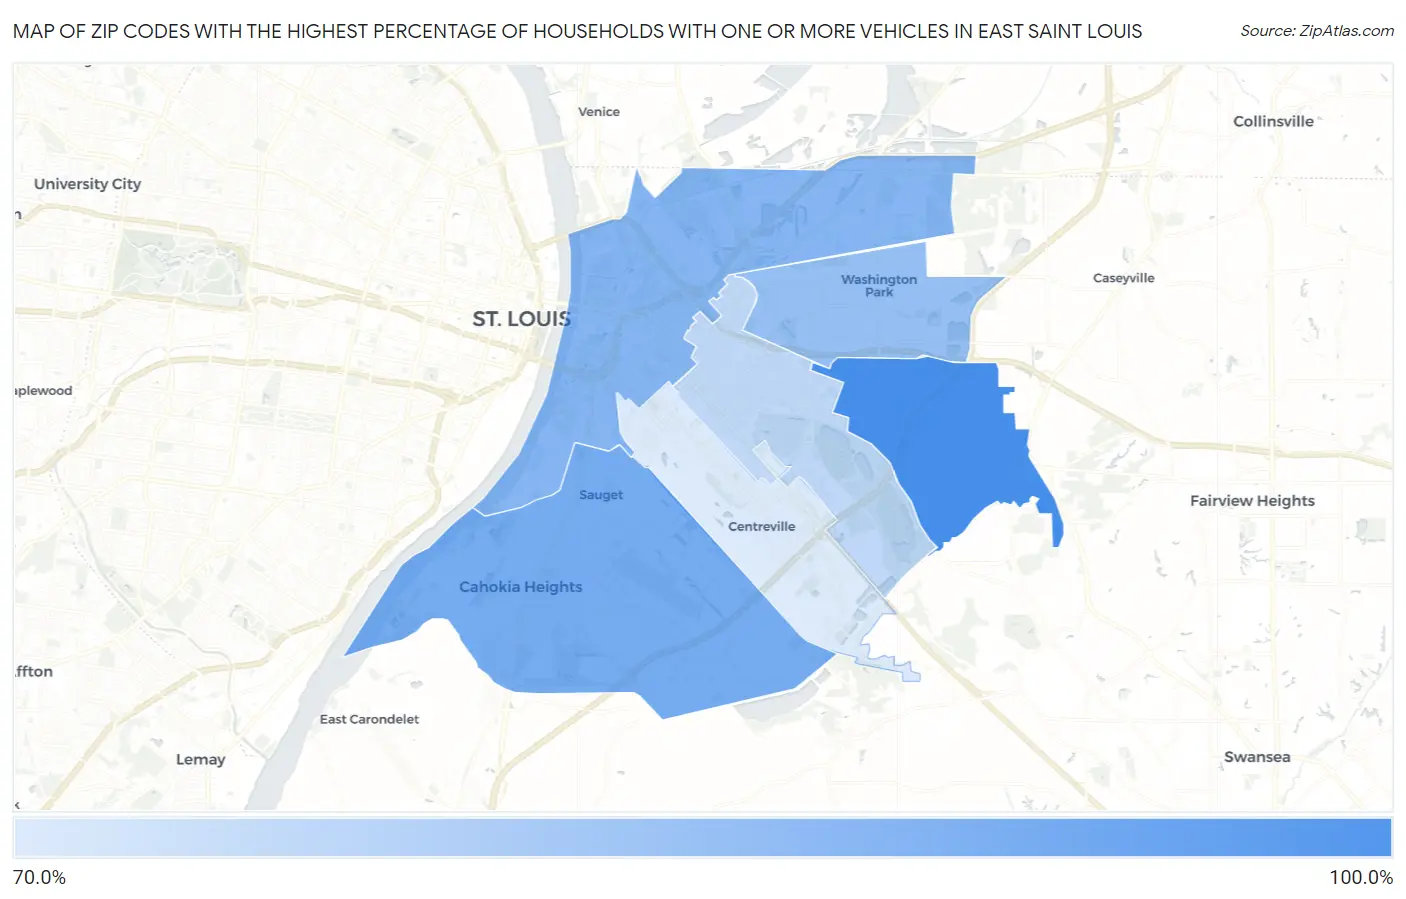
Households with 1 or more Cars
East Saint Louis
Compare Zip Codes
Map of Zip Codes with the Highest Percentage of Households With One or more Vehicles in East Saint Louis
70.5%
90.0%
Zip Codes with the Highest Percentage of Households With One or more Vehicles in East Saint Louis, IL
| Zip Code | Housholds With 1+ Cars | vs State | vs National | |
| 1. | 62203 | 90.0% | 89.2%(+0.800)#1,210 | 91.7%(-1.70)#27,941 |
| 2. | 62206 | 83.7% | 89.2%(-5.50)#1,303 | 91.7%(-8.00)#30,724 |
| 3. | 62201 | 81.6% | 89.2%(-7.60)#1,309 | 91.7%(-10.1)#31,093 |
| 4. | 62204 | 79.6% | 89.2%(-9.60)#1,321 | 91.7%(-12.1)#31,366 |
| 5. | 62205 | 74.1% | 89.2%(-15.1)#1,338 | 91.7%(-17.6)#31,811 |
| 6. | 62207 | 70.5% | 89.2%(-18.7)#1,345 | 91.7%(-21.2)#31,993 |
1
Common Questions
What are the Top 5 Zip Codes with the Highest Percentage of Households With One or more Vehicles in East Saint Louis, IL?
Top 5 Zip Codes with the Highest Percentage of Households With One or more Vehicles in East Saint Louis, IL are:
What zip code has the Highest Percentage of Households With One or more Vehicles in East Saint Louis, IL?
62203 has the Highest Percentage of Households With One or more Vehicles in East Saint Louis, IL with 90.0%.
What is the Percentage of Households With One or more Vehicles in Illinois?
Percentage of Households With One or more Vehicles in Illinois is 89.2%.
What is the Percentage of Households With One or more Vehicles in the United States?
Percentage of Households With One or more Vehicles in the United States is 91.7%.