Zip Codes with the Highest Percentage of Households with Income Above $200,000 in Dubuque, IA
RELATED REPORTS & OPTIONS
Household Income | $200k+
Dubuque
Compare Zip Codes
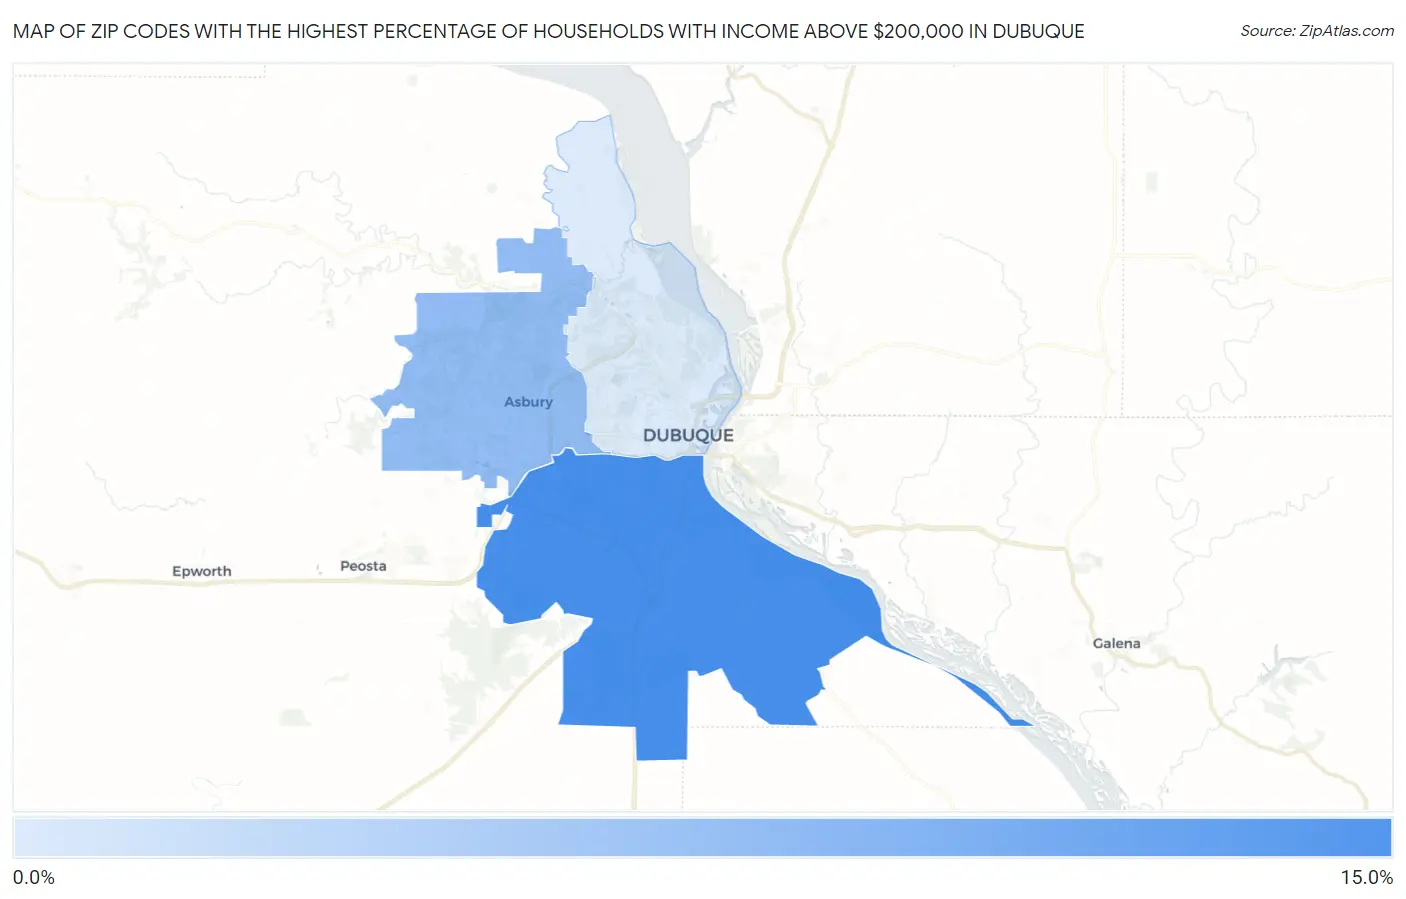
Map of Zip Codes with the Highest Percentage of Households with Income Above $200,000 in Dubuque
4.1%
12.8%
Zip Codes with the Highest Percentage of Households with Income Above $200,000 in Dubuque, IA
| Zip Code | Households with Income > $200k | vs State | vs National | |
| 1. | 52003 | 12.8% | 7.1%(+5.70)#82 | 11.4%(+1.40)#6,138 |
| 2. | 52002 | 8.4% | 7.1%(+1.30)#202 | 11.4%(-3.00)#9,883 |
| 3. | 52001 | 4.1% | 7.1%(-3.00)#486 | 11.4%(-7.30)#17,802 |
1
Common Questions
What are the Top Zip Codes with the Highest Percentage of Households with Income Above $200,000 in Dubuque, IA?
Top Zip Codes with the Highest Percentage of Households with Income Above $200,000 in Dubuque, IA are:
What zip code has the Highest Percentage of Households with Income Above $200,000 in Dubuque, IA?
52003 has the Highest Percentage of Households with Income Above $200,000 in Dubuque, IA with 12.8%.
What is the Percentage of Households with Income Above $200,000 in Dubuque, IA?
Percentage of Households with Income Above $200,000 in Dubuque is 5.0%.
What is the Percentage of Households with Income Above $200,000 in Iowa?
Percentage of Households with Income Above $200,000 in Iowa is 7.1%.
What is the Percentage of Households with Income Above $200,000 in the United States?
Percentage of Households with Income Above $200,000 in the United States is 11.4%.