Cities with the Highest Percentage of Population Driving Alone to Work in Iowa
RELATED REPORTS & OPTIONS
Drive | Alone
Iowa
Compare Cities
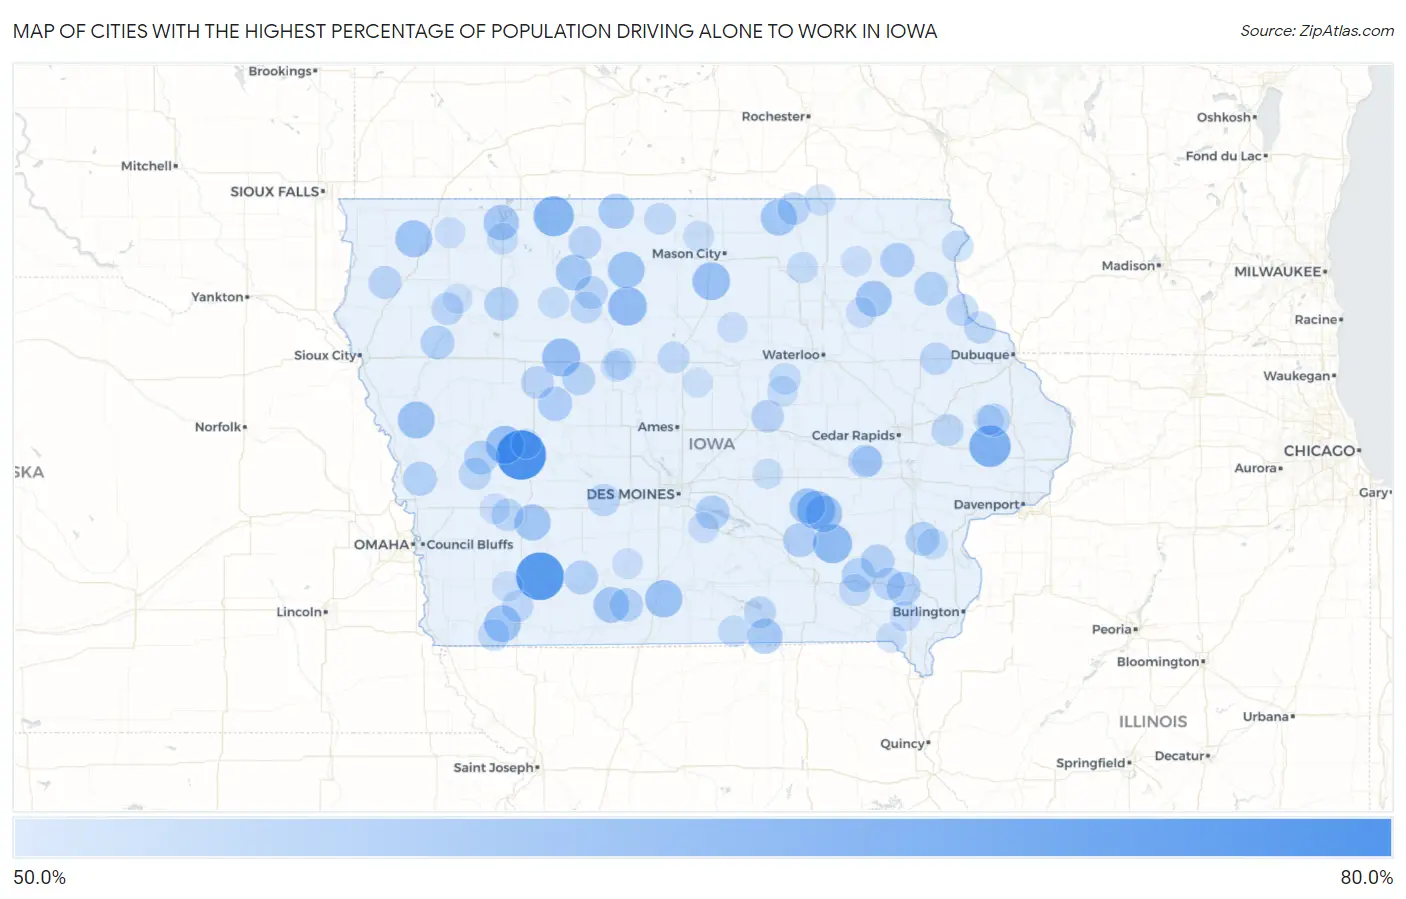
Map of Cities with the Highest Percentage of Population Driving Alone to Work in Iowa
0.0%
80.0%
Cities with the Highest Percentage of Population Driving Alone to Work in Iowa
| City | % Drive Alone | vs State | vs National | |
| 1. | Gray | 73.1% | 42.1%(+31.0)#1 | 42.1%(+31.0)#17 |
| 2. | Carbon | 71.2% | 42.1%(+29.1)#2 | 42.1%(+29.1)#30 |
| 3. | Toronto | 64.5% | 42.1%(+22.4)#3 | 42.1%(+22.4)#179 |
| 4. | Downey | 63.9% | 42.1%(+21.8)#4 | 42.1%(+21.8)#221 |
| 5. | Gruver | 63.2% | 42.1%(+21.1)#5 | 42.1%(+21.1)#270 |
| 6. | Sandusky | 63.0% | 42.1%(+20.9)#6 | 42.1%(+20.9)#283 |
| 7. | Hayesville | 61.9% | 42.1%(+19.8)#7 | 42.1%(+19.8)#384 |
| 8. | Hardy | 61.5% | 42.1%(+19.4)#8 | 42.1%(+19.4)#422 |
| 9. | Aspinwall | 61.0% | 42.1%(+18.9)#9 | 42.1%(+18.9)#493 |
| 10. | Twin Lakes | 60.9% | 42.1%(+18.8)#10 | 42.1%(+18.8)#498 |
| 11. | Gibson | 60.8% | 42.1%(+18.7)#11 | 42.1%(+18.7)#515 |
| 12. | Swaledale | 60.5% | 42.1%(+18.4)#12 | 42.1%(+18.4)#549 |
| 13. | Weldon | 60.2% | 42.1%(+18.1)#13 | 42.1%(+18.1)#614 |
| 14. | Castana | 59.9% | 42.1%(+17.8)#14 | 42.1%(+17.8)#657 |
| 15. | Matlock | 59.7% | 42.1%(+17.6)#15 | 42.1%(+17.6)#674 |
| 16. | Thornburg | 59.5% | 42.1%(+17.4)#16 | 42.1%(+17.4)#707 |
| 17. | St Benedict | 59.5% | 42.1%(+17.4)#17 | 42.1%(+17.4)#709 |
| 18. | Yorktown | 59.5% | 42.1%(+17.4)#18 | 42.1%(+17.4)#712 |
| 19. | Yarmouth | 59.3% | 42.1%(+17.2)#19 | 42.1%(+17.2)#762 |
| 20. | Wiota | 59.0% | 42.1%(+16.9)#20 | 42.1%(+16.9)#834 |
| 21. | Little Cedar | 59.0% | 42.1%(+16.9)#21 | 42.1%(+16.9)#837 |
| 22. | Randalia | 58.8% | 42.1%(+16.7)#22 | 42.1%(+16.7)#863 |
| 23. | Barnes City | 58.5% | 42.1%(+16.4)#23 | 42.1%(+16.4)#914 |
| 24. | Tingley | 58.5% | 42.1%(+16.4)#24 | 42.1%(+16.4)#916 |
| 25. | Rodman | 58.5% | 42.1%(+16.4)#25 | 42.1%(+16.4)#925 |
| 26. | West Okoboji | 58.2% | 42.1%(+16.1)#26 | 42.1%(+16.1)#996 |
| 27. | Ledyard | 58.0% | 42.1%(+15.9)#27 | 42.1%(+15.9)#1,050 |
| 28. | Exline | 57.8% | 42.1%(+15.7)#28 | 42.1%(+15.7)#1,077 |
| 29. | Castalia | 57.0% | 42.1%(+14.9)#29 | 42.1%(+14.9)#1,307 |
| 30. | Lanesboro | 57.0% | 42.1%(+14.9)#30 | 42.1%(+14.9)#1,311 |
| 31. | Keomah Village | 56.8% | 42.1%(+14.7)#31 | 42.1%(+14.7)#1,346 |
| 32. | Westwood | 56.7% | 42.1%(+14.6)#32 | 42.1%(+14.6)#1,368 |
| 33. | Maharishi Vedic City | 56.6% | 42.1%(+14.5)#33 | 42.1%(+14.5)#1,381 |
| 34. | Magnolia | 56.6% | 42.1%(+14.5)#34 | 42.1%(+14.5)#1,388 |
| 35. | Defiance | 56.5% | 42.1%(+14.4)#35 | 42.1%(+14.4)#1,422 |
| 36. | Rembrandt | 56.5% | 42.1%(+14.4)#36 | 42.1%(+14.4)#1,424 |
| 37. | Washta | 56.5% | 42.1%(+14.4)#37 | 42.1%(+14.4)#1,426 |
| 38. | St Olaf | 56.5% | 42.1%(+14.4)#38 | 42.1%(+14.4)#1,434 |
| 39. | Cromwell | 56.5% | 42.1%(+14.4)#39 | 42.1%(+14.4)#1,438 |
| 40. | Swan | 56.5% | 42.1%(+14.4)#40 | 42.1%(+14.4)#1,441 |
| 41. | Cotter | 56.5% | 42.1%(+14.4)#41 | 42.1%(+14.4)#1,445 |
| 42. | Oak Hills | 56.3% | 42.1%(+14.2)#42 | 42.1%(+14.2)#1,518 |
| 43. | Pleasant Plain | 56.3% | 42.1%(+14.2)#43 | 42.1%(+14.2)#1,522 |
| 44. | Sun Valley Lake | 56.2% | 42.1%(+14.1)#44 | 42.1%(+14.1)#1,556 |
| 45. | Baldwin | 56.0% | 42.1%(+13.9)#45 | 42.1%(+13.9)#1,614 |
| 46. | West Amana | 55.9% | 42.1%(+13.8)#46 | 42.1%(+13.8)#1,637 |
| 47. | Rinard | 55.7% | 42.1%(+13.6)#47 | 42.1%(+13.6)#1,689 |
| 48. | Maurice | 55.6% | 42.1%(+13.5)#48 | 42.1%(+13.5)#1,702 |
| 49. | Fenton | 55.5% | 42.1%(+13.4)#49 | 42.1%(+13.4)#1,744 |
| 50. | Green Mountain | 55.5% | 42.1%(+13.4)#50 | 42.1%(+13.4)#1,750 |
| 51. | Ottosen | 55.5% | 42.1%(+13.4)#51 | 42.1%(+13.4)#1,764 |
| 52. | Yetter | 55.5% | 42.1%(+13.4)#52 | 42.1%(+13.4)#1,765 |
| 53. | Delaware | 55.3% | 42.1%(+13.2)#53 | 42.1%(+13.2)#1,821 |
| 54. | Diamondhead Lake | 55.2% | 42.1%(+13.1)#54 | 42.1%(+13.1)#1,856 |
| 55. | Marne | 55.2% | 42.1%(+13.1)#55 | 42.1%(+13.1)#1,864 |
| 56. | Mcintire | 55.2% | 42.1%(+13.1)#56 | 42.1%(+13.1)#1,865 |
| 57. | Meriden | 55.1% | 42.1%(+13.0)#57 | 42.1%(+13.0)#1,905 |
| 58. | Lockridge | 55.0% | 42.1%(+12.9)#58 | 42.1%(+12.9)#1,924 |
| 59. | Westphalia | 55.0% | 42.1%(+12.9)#59 | 42.1%(+12.9)#1,936 |
| 60. | Moscow | 54.8% | 42.1%(+12.7)#60 | 42.1%(+12.7)#1,979 |
| 61. | North Buena Vista | 54.8% | 42.1%(+12.7)#61 | 42.1%(+12.7)#1,989 |
| 62. | Morley | 54.8% | 42.1%(+12.7)#62 | 42.1%(+12.7)#1,997 |
| 63. | Guttenberg | 54.7% | 42.1%(+12.6)#63 | 42.1%(+12.6)#2,007 |
| 64. | Rathbun | 54.7% | 42.1%(+12.6)#64 | 42.1%(+12.6)#2,036 |
| 65. | Coin | 54.5% | 42.1%(+12.4)#65 | 42.1%(+12.4)#2,107 |
| 66. | Blairsburg | 54.5% | 42.1%(+12.4)#66 | 42.1%(+12.4)#2,113 |
| 67. | Hepburn | 54.5% | 42.1%(+12.4)#67 | 42.1%(+12.4)#2,130 |
| 68. | Thompson | 54.4% | 42.1%(+12.3)#68 | 42.1%(+12.3)#2,152 |
| 69. | Libertyville | 54.4% | 42.1%(+12.3)#69 | 42.1%(+12.3)#2,155 |
| 70. | Bradgate | 54.4% | 42.1%(+12.3)#70 | 42.1%(+12.3)#2,165 |
| 71. | Harpers Ferry | 54.3% | 42.1%(+12.2)#71 | 42.1%(+12.2)#2,206 |
| 72. | Fostoria | 54.3% | 42.1%(+12.2)#72 | 42.1%(+12.2)#2,210 |
| 73. | Morrison | 54.3% | 42.1%(+12.2)#73 | 42.1%(+12.2)#2,216 |
| 74. | Coalville | 54.1% | 42.1%(+12.0)#74 | 42.1%(+12.0)#2,281 |
| 75. | Seymour | 54.0% | 42.1%(+11.9)#75 | 42.1%(+11.9)#2,324 |
| 76. | Havelock | 53.8% | 42.1%(+11.7)#76 | 42.1%(+11.7)#2,408 |
| 77. | Kingston | 53.8% | 42.1%(+11.7)#77 | 42.1%(+11.7)#2,415 |
| 78. | Columbus City | 53.7% | 42.1%(+11.6)#78 | 42.1%(+11.6)#2,446 |
| 79. | Bassett | 53.7% | 42.1%(+11.6)#79 | 42.1%(+11.6)#2,456 |
| 80. | Otho | 53.6% | 42.1%(+11.5)#80 | 42.1%(+11.5)#2,479 |
| 81. | Fertile | 53.6% | 42.1%(+11.5)#81 | 42.1%(+11.5)#2,482 |
| 82. | Chester | 53.5% | 42.1%(+11.4)#82 | 42.1%(+11.4)#2,554 |
| 83. | Lincoln | 53.5% | 42.1%(+11.4)#83 | 42.1%(+11.4)#2,561 |
| 84. | Sandyville | 53.5% | 42.1%(+11.4)#84 | 42.1%(+11.4)#2,575 |
| 85. | High Amana | 53.4% | 42.1%(+11.3)#85 | 42.1%(+11.3)#2,639 |
| 86. | Walnut | 53.3% | 42.1%(+11.2)#86 | 42.1%(+11.2)#2,660 |
| 87. | Lorimor | 53.3% | 42.1%(+11.2)#87 | 42.1%(+11.2)#2,678 |
| 88. | Melvin | 53.3% | 42.1%(+11.2)#88 | 42.1%(+11.2)#2,682 |
| 89. | Westgate | 53.3% | 42.1%(+11.2)#89 | 42.1%(+11.2)#2,690 |
| 90. | Jackson Junction | 53.3% | 42.1%(+11.2)#90 | 42.1%(+11.2)#2,700 |
| 91. | Stanton | 53.2% | 42.1%(+11.1)#91 | 42.1%(+11.1)#2,718 |
| 92. | Geneva | 53.1% | 42.1%(+11.0)#92 | 42.1%(+11.0)#2,794 |
| 93. | Farmington | 53.0% | 42.1%(+10.9)#93 | 42.1%(+10.9)#2,825 |
| 94. | Oakland Acres | 53.0% | 42.1%(+10.9)#94 | 42.1%(+10.9)#2,834 |
| 95. | Monmouth | 53.0% | 42.1%(+10.9)#95 | 42.1%(+10.9)#2,835 |
| 96. | Houghton | 53.0% | 42.1%(+10.9)#96 | 42.1%(+10.9)#2,839 |
| 97. | Radcliffe | 52.9% | 42.1%(+10.8)#97 | 42.1%(+10.8)#2,860 |
| 98. | Templeton | 52.8% | 42.1%(+10.7)#98 | 42.1%(+10.7)#2,909 |
| 99. | Larrabee | 52.8% | 42.1%(+10.7)#99 | 42.1%(+10.7)#2,920 |
| 100. | Lowell | 52.8% | 42.1%(+10.7)#100 | 42.1%(+10.7)#2,921 |
Common Questions
What are the Top 10 Cities with the Highest Percentage of Population Driving Alone to Work in Iowa?
Top 10 Cities with the Highest Percentage of Population Driving Alone to Work in Iowa are:
#1
73.1%
#2
71.2%
#3
64.5%
#4
63.2%
#5
61.9%
#6
61.5%
#7
61.0%
#8
60.9%
#9
60.8%
#10
60.5%
What city has the Highest Percentage of Population Driving Alone to Work in Iowa?
Gray has the Highest Percentage of Population Driving Alone to Work in Iowa with 73.1%.
What is the Percentage of Population Driving Alone to Work in the State of Iowa?
Percentage of Population Driving Alone to Work in Iowa is 42.1%.
What is the Percentage of Population Driving Alone to Work in the United States?
Percentage of Population Driving Alone to Work in the United States is 42.1%.