Harpers Ferry, IA Map & Demographics
Harpers Ferry Map
Harpers Ferry Overview
$30,228
PER CAPITA INCOME
$67,917
AVG FAMILY INCOME
$38,750
AVG HOUSEHOLD INCOME
0.44
INEQUALITY / GINI INDEX
236
TOTAL POPULATION
120
MALE POPULATION
116
FEMALE POPULATION
103.45
MALES / 100 FEMALES
96.67
FEMALES / 100 MALES
65.3
MEDIAN AGE
2.5
AVG FAMILY SIZE
1.9
AVG HOUSEHOLD SIZE
103
LABOR FORCE [ PEOPLE ]
48.8%
PERCENT IN LABOR FORCE
1.0%
UNEMPLOYMENT RATE
Harpers Ferry Zip Codes
Harpers Ferry Area Codes
Income in Harpers Ferry
Income Overview in Harpers Ferry
Per Capita Income in Harpers Ferry is $30,228, while median incomes of families and households are $67,917 and $38,750 respectively.
| Characteristic | Number | Measure |
| Per Capita Income | 236 | $30,228 |
| Median Family Income | 65 | $67,917 |
| Mean Family Income | 65 | $78,331 |
| Median Household Income | 127 | $38,750 |
| Mean Household Income | 127 | $55,702 |
| Income Deficit | 65 | $0 |
| Wage / Income Gap (%) | 236 | 0.00% |
| Wage / Income Gap ($) | 236 | 100.00¢ per $1 |
| Gini / Inequality Index | 236 | 0.44 |
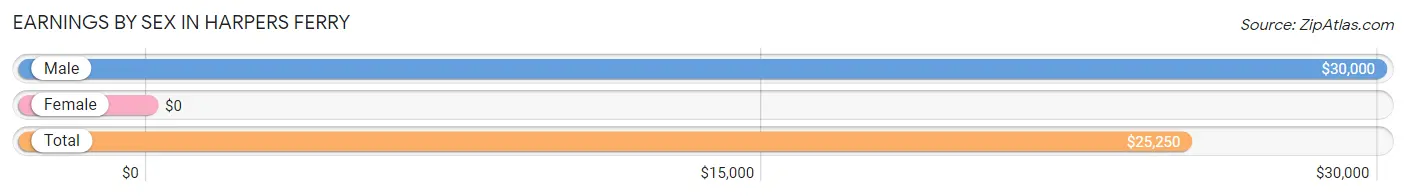
Earnings by Sex in Harpers Ferry
| Sex | Number | Average Earnings |
| Male | 60 (49.6%) | $30,000 |
| Female | 61 (50.4%) | $0 |
| Total | 121 (100.0%) | $25,250 |
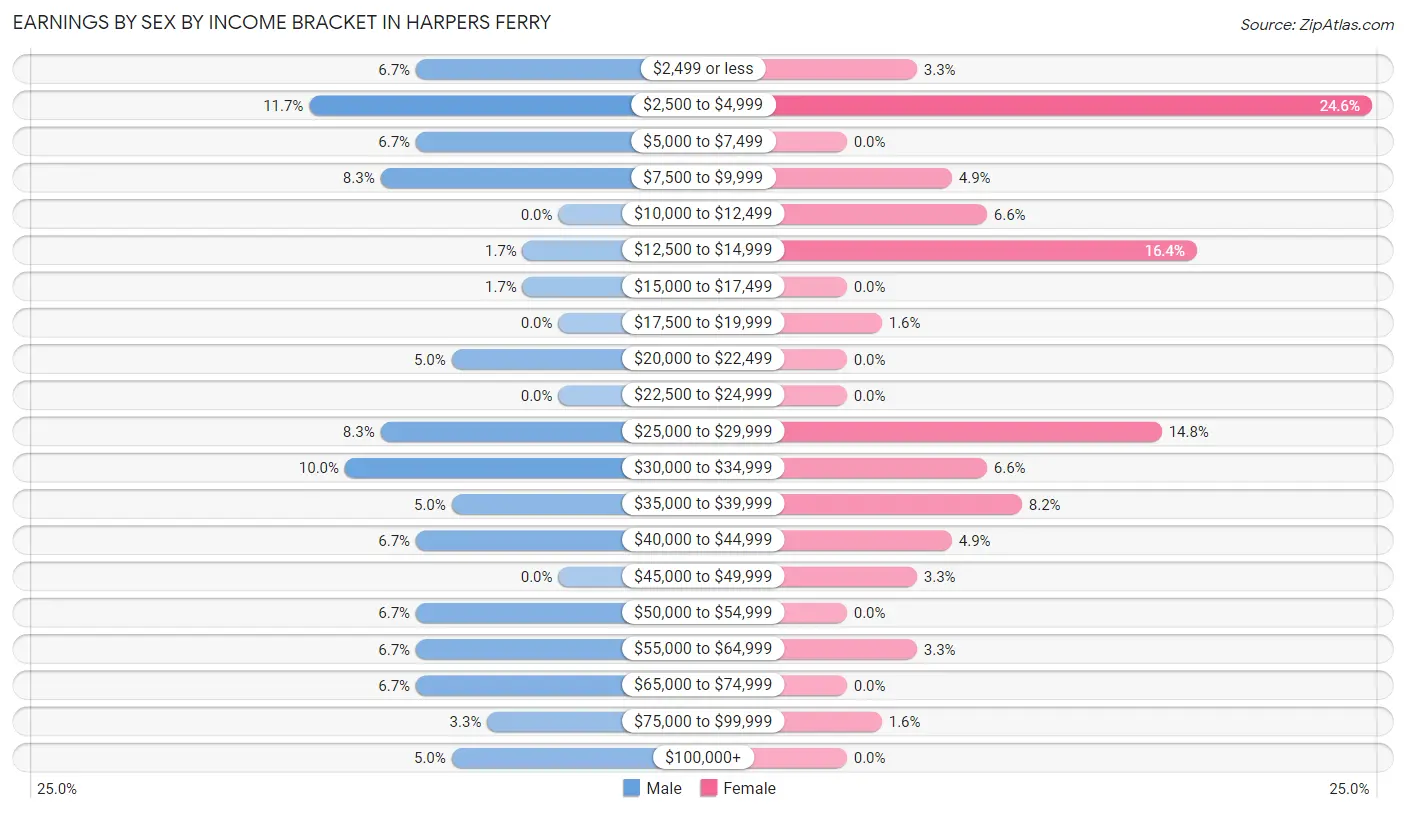
Earnings by Sex by Income Bracket in Harpers Ferry
The most common earnings brackets in Harpers Ferry are $2,500 to $4,999 for men (7 | 11.7%) and $2,500 to $4,999 for women (15 | 24.6%).
| Income | Male | Female |
| $2,499 or less | 4 (6.7%) | 2 (3.3%) |
| $2,500 to $4,999 | 7 (11.7%) | 15 (24.6%) |
| $5,000 to $7,499 | 4 (6.7%) | 0 (0.0%) |
| $7,500 to $9,999 | 5 (8.3%) | 3 (4.9%) |
| $10,000 to $12,499 | 0 (0.0%) | 4 (6.6%) |
| $12,500 to $14,999 | 1 (1.7%) | 10 (16.4%) |
| $15,000 to $17,499 | 1 (1.7%) | 0 (0.0%) |
| $17,500 to $19,999 | 0 (0.0%) | 1 (1.6%) |
| $20,000 to $22,499 | 3 (5.0%) | 0 (0.0%) |
| $22,500 to $24,999 | 0 (0.0%) | 0 (0.0%) |
| $25,000 to $29,999 | 5 (8.3%) | 9 (14.7%) |
| $30,000 to $34,999 | 6 (10.0%) | 4 (6.6%) |
| $35,000 to $39,999 | 3 (5.0%) | 5 (8.2%) |
| $40,000 to $44,999 | 4 (6.7%) | 3 (4.9%) |
| $45,000 to $49,999 | 0 (0.0%) | 2 (3.3%) |
| $50,000 to $54,999 | 4 (6.7%) | 0 (0.0%) |
| $55,000 to $64,999 | 4 (6.7%) | 2 (3.3%) |
| $65,000 to $74,999 | 4 (6.7%) | 0 (0.0%) |
| $75,000 to $99,999 | 2 (3.3%) | 1 (1.6%) |
| $100,000+ | 3 (5.0%) | 0 (0.0%) |
| Total | 60 (100.0%) | 61 (100.0%) |
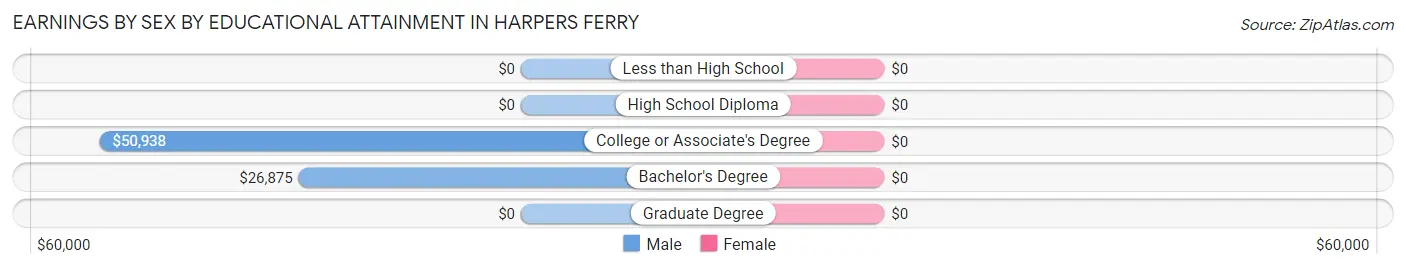
Earnings by Sex by Educational Attainment in Harpers Ferry
| Educational Attainment | Male Income | Female Income |
| Less than High School | - | - |
| High School Diploma | - | - |
| College or Associate's Degree | $50,938 | $0 |
| Bachelor's Degree | $26,875 | $0 |
| Graduate Degree | - | - |
| Total | $31,042 | $0 |
Family Income in Harpers Ferry
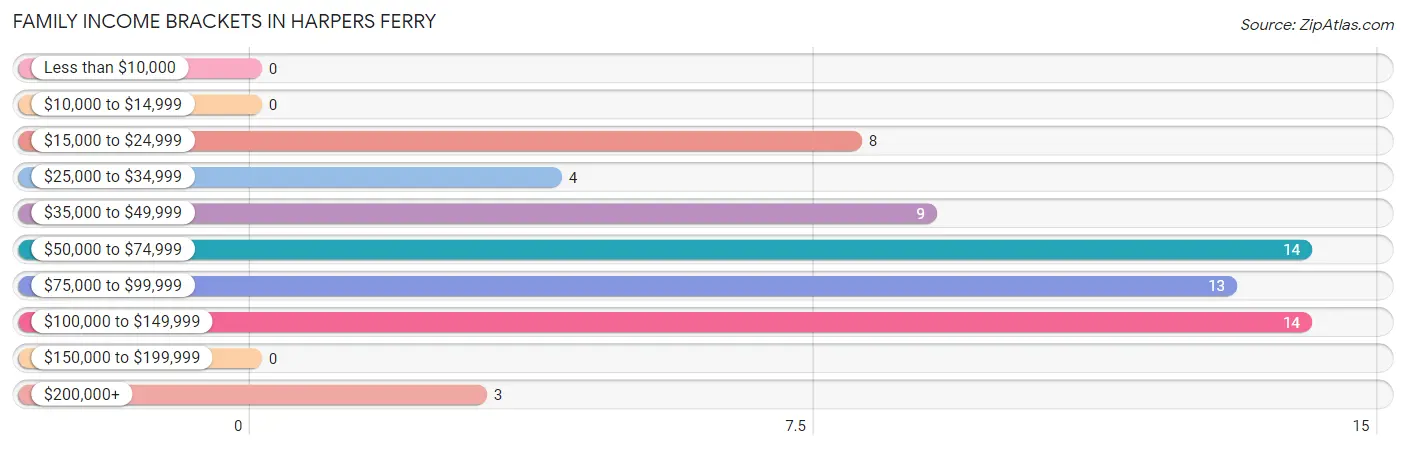
Family Income Brackets in Harpers Ferry
According to the Harpers Ferry family income data, there are 14 families falling into the $50,000 to $74,999 income range, which is the most common income bracket and makes up 21.5% of all families.
| Income Bracket | # Families | % Families |
| Less than $10,000 | 0 | 0.0% |
| $10,000 to $14,999 | 0 | 0.0% |
| $15,000 to $24,999 | 8 | 12.3% |
| $25,000 to $34,999 | 4 | 6.2% |
| $35,000 to $49,999 | 9 | 13.8% |
| $50,000 to $74,999 | 14 | 21.5% |
| $75,000 to $99,999 | 13 | 20.0% |
| $100,000 to $149,999 | 14 | 21.5% |
| $150,000 to $199,999 | 0 | 0.0% |
| $200,000+ | 3 | 4.6% |
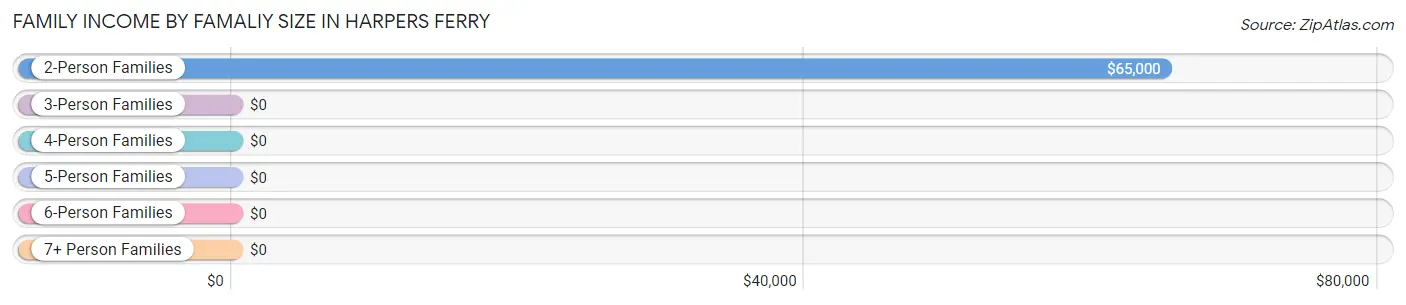
Family Income by Famaliy Size in Harpers Ferry
2-person families (52 | 80.0%) account for the highest median family income in Harpers Ferry with $65,000 per family, while 2-person families (52 | 80.0%) have the highest median income of $32,500 per family member.
| Income Bracket | # Families | Median Income |
| 2-Person Families | 52 (80.0%) | $65,000 |
| 3-Person Families | 8 (12.3%) | $0 |
| 4-Person Families | 2 (3.1%) | $0 |
| 5-Person Families | 3 (4.6%) | $0 |
| 6-Person Families | 0 (0.0%) | $0 |
| 7+ Person Families | 0 (0.0%) | $0 |
| Total | 65 (100.0%) | $67,917 |
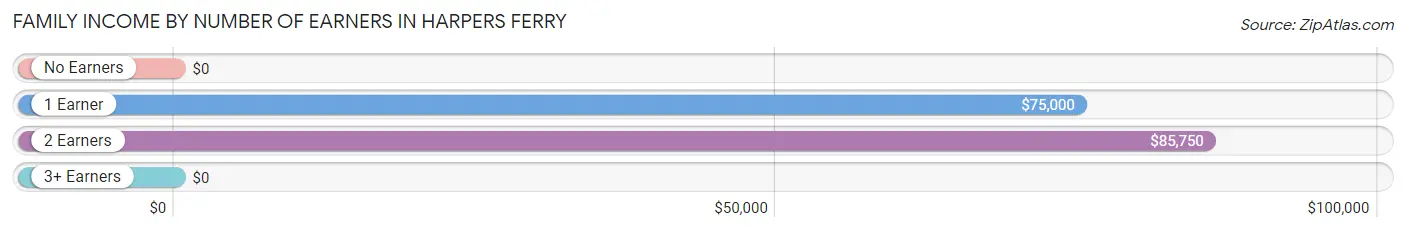
Family Income by Number of Earners in Harpers Ferry
| Number of Earners | # Families | Median Income |
| No Earners | 15 (23.1%) | $0 |
| 1 Earner | 20 (30.8%) | $75,000 |
| 2 Earners | 27 (41.5%) | $85,750 |
| 3+ Earners | 3 (4.6%) | $0 |
| Total | 65 (100.0%) | $67,917 |
Household Income in Harpers Ferry
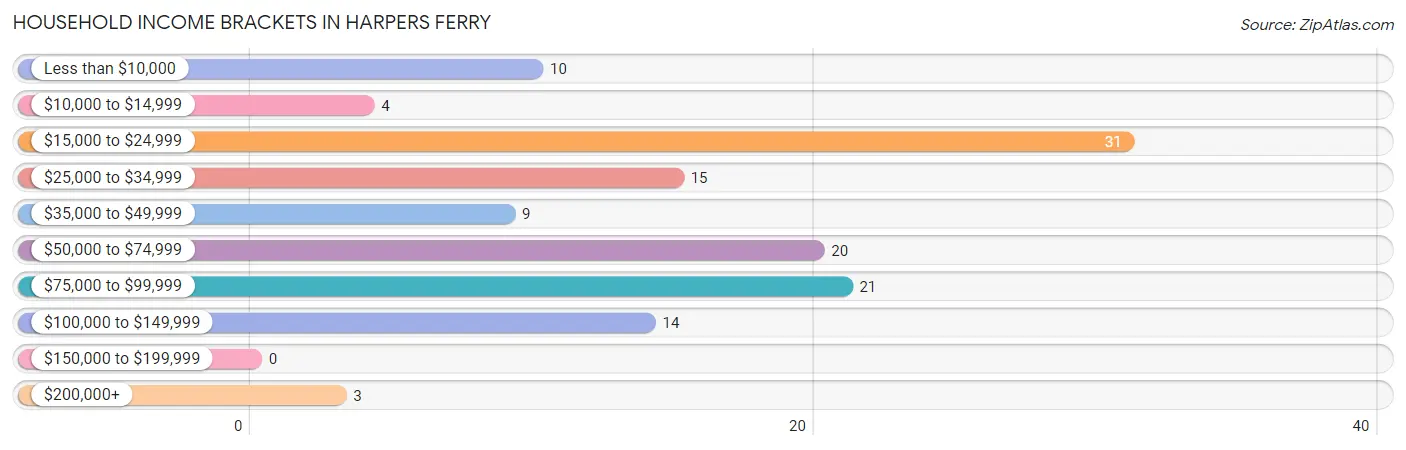
Household Income Brackets in Harpers Ferry
With 31 households falling in the category, the $15,000 to $24,999 income range is the most frequent in Harpers Ferry, accounting for 24.4% of all households.
| Income Bracket | # Households | % Households |
| Less than $10,000 | 10 | 7.9% |
| $10,000 to $14,999 | 4 | 3.1% |
| $15,000 to $24,999 | 31 | 24.4% |
| $25,000 to $34,999 | 15 | 11.8% |
| $35,000 to $49,999 | 9 | 7.1% |
| $50,000 to $74,999 | 20 | 15.7% |
| $75,000 to $99,999 | 21 | 16.5% |
| $100,000 to $149,999 | 14 | 11.0% |
| $150,000 to $199,999 | 0 | 0.0% |
| $200,000+ | 3 | 2.4% |
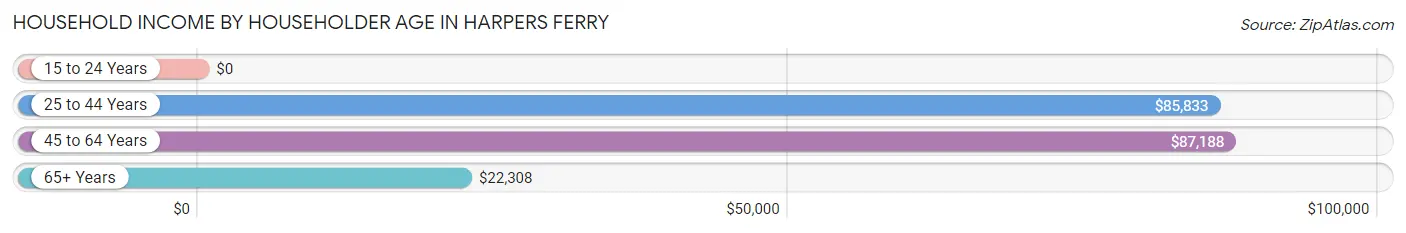
Household Income by Householder Age in Harpers Ferry
The median household income in Harpers Ferry is $38,750, with the highest median household income of $87,188 found in the 45 to 64 years age bracket for the primary householder. A total of 35 households (27.6%) fall into this category.
| Income Bracket | # Households | Median Income |
| 15 to 24 Years | 0 (0.0%) | $0 |
| 25 to 44 Years | 12 (9.5%) | $85,833 |
| 45 to 64 Years | 35 (27.6%) | $87,188 |
| 65+ Years | 80 (63.0%) | $22,308 |
| Total | 127 (100.0%) | $38,750 |
Poverty in Harpers Ferry
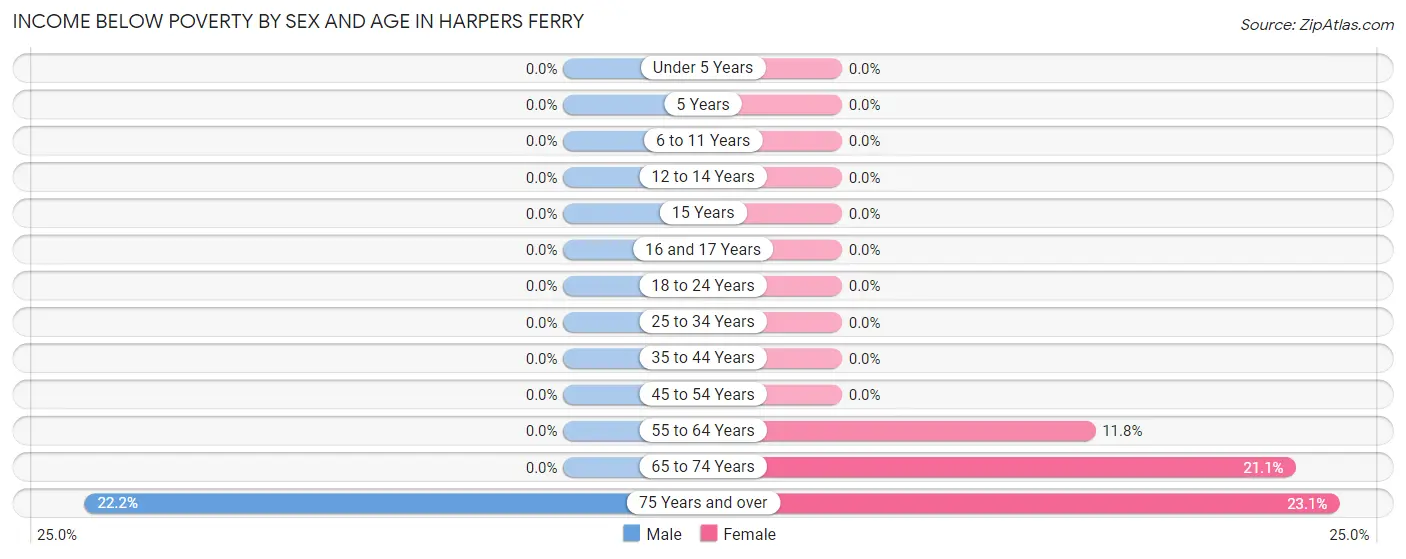
Income Below Poverty by Sex and Age in Harpers Ferry
With 3.3% poverty level for males and 14.7% for females among the residents of Harpers Ferry, 75 year old and over males and 75 year old and over females are the most vulnerable to poverty, with 4 males (22.2%) and 3 females (23.1%) in their respective age groups living below the poverty level.
| Age Bracket | Male | Female |
| Under 5 Years | 0 (0.0%) | 0 (0.0%) |
| 5 Years | 0 (0.0%) | 0 (0.0%) |
| 6 to 11 Years | 0 (0.0%) | 0 (0.0%) |
| 12 to 14 Years | 0 (0.0%) | 0 (0.0%) |
| 15 Years | 0 (0.0%) | 0 (0.0%) |
| 16 and 17 Years | 0 (0.0%) | 0 (0.0%) |
| 18 to 24 Years | 0 (0.0%) | 0 (0.0%) |
| 25 to 34 Years | 0 (0.0%) | 0 (0.0%) |
| 35 to 44 Years | 0 (0.0%) | 0 (0.0%) |
| 45 to 54 Years | 0 (0.0%) | 0 (0.0%) |
| 55 to 64 Years | 0 (0.0%) | 2 (11.8%) |
| 65 to 74 Years | 0 (0.0%) | 12 (21.0%) |
| 75 Years and over | 4 (22.2%) | 3 (23.1%) |
| Total | 4 (3.3%) | 17 (14.7%) |
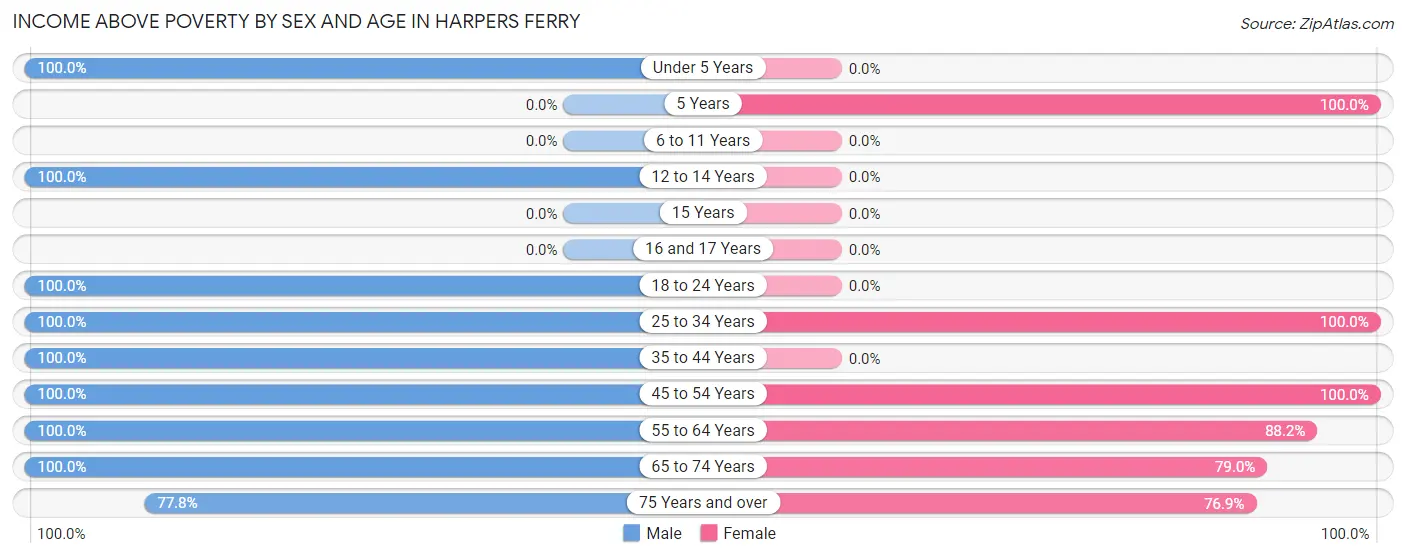
Income Above Poverty by Sex and Age in Harpers Ferry
According to the poverty statistics in Harpers Ferry, males aged under 5 years and females aged 5 years are the age groups that are most secure financially, with 100.0% of males and 100.0% of females in these age groups living above the poverty line.
| Age Bracket | Male | Female |
| Under 5 Years | 13 (100.0%) | 0 (0.0%) |
| 5 Years | 0 (0.0%) | 4 (100.0%) |
| 6 to 11 Years | 0 (0.0%) | 0 (0.0%) |
| 12 to 14 Years | 8 (100.0%) | 0 (0.0%) |
| 15 Years | 0 (0.0%) | 0 (0.0%) |
| 16 and 17 Years | 0 (0.0%) | 0 (0.0%) |
| 18 to 24 Years | 9 (100.0%) | 0 (0.0%) |
| 25 to 34 Years | 4 (100.0%) | 11 (100.0%) |
| 35 to 44 Years | 9 (100.0%) | 0 (0.0%) |
| 45 to 54 Years | 10 (100.0%) | 14 (100.0%) |
| 55 to 64 Years | 14 (100.0%) | 15 (88.2%) |
| 65 to 74 Years | 35 (100.0%) | 45 (78.9%) |
| 75 Years and over | 14 (77.8%) | 10 (76.9%) |
| Total | 116 (96.7%) | 99 (85.3%) |
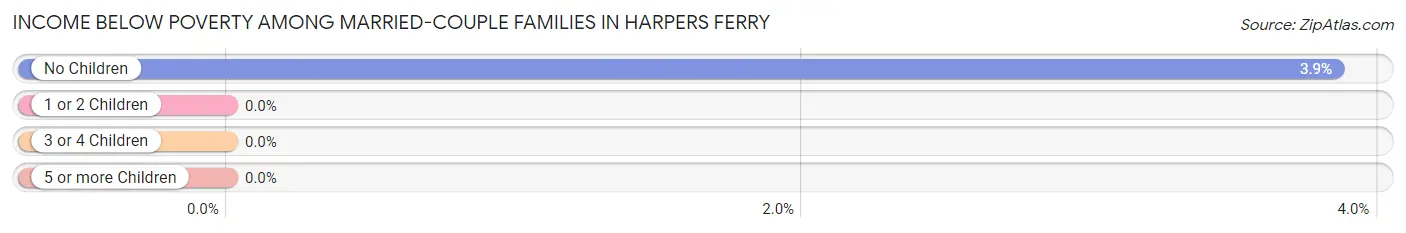
Income Below Poverty Among Married-Couple Families in Harpers Ferry
The poverty statistics for married-couple families in Harpers Ferry show that 3.2% or 2 of the total 62 families live below the poverty line. Families with no children have the highest poverty rate of 3.8%, comprising of 2 families. On the other hand, families with 1 or 2 children have the lowest poverty rate of 0.0%, which includes 0 families.
| Children | Above Poverty | Below Poverty |
| No Children | 50 (96.2%) | 2 (3.8%) |
| 1 or 2 Children | 7 (100.0%) | 0 (0.0%) |
| 3 or 4 Children | 3 (100.0%) | 0 (0.0%) |
| 5 or more Children | 0 (0.0%) | 0 (0.0%) |
| Total | 60 (96.8%) | 2 (3.2%) |
Income Below Poverty Among Single-Parent Households in Harpers Ferry
| Children | Single Father | Single Mother |
| No Children | 0 (0.0%) | 0 (0.0%) |
| 1 or 2 Children | 0 (0.0%) | 0 (0.0%) |
| 3 or 4 Children | 0 (0.0%) | 0 (0.0%) |
| 5 or more Children | 0 (0.0%) | 0 (0.0%) |
| Total | 0 (0.0%) | 0 (0.0%) |
Income Below Poverty Among Married-Couple vs Single-Parent Households in Harpers Ferry
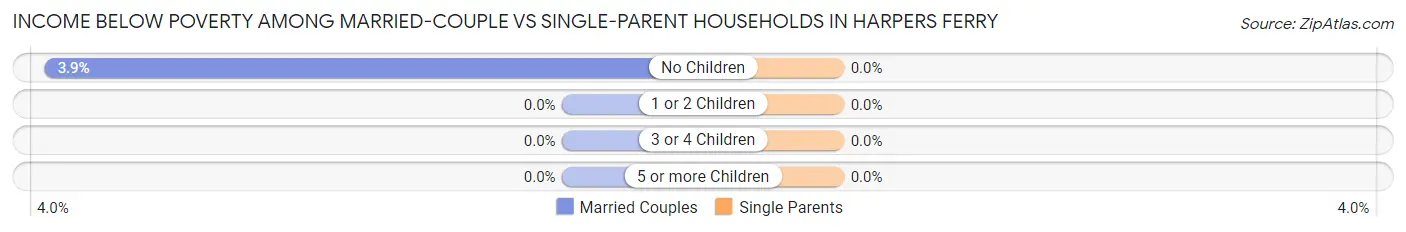
| Children | Married-Couple Families | Single-Parent Households |
| No Children | 2 (3.8%) | 0 (0.0%) |
| 1 or 2 Children | 0 (0.0%) | 0 (0.0%) |
| 3 or 4 Children | 0 (0.0%) | 0 (0.0%) |
| 5 or more Children | 0 (0.0%) | 0 (0.0%) |
| Total | 2 (3.2%) | 0 (0.0%) |
Race in Harpers Ferry
The most populous races in Harpers Ferry are White / Caucasian (232 | 98.3%), and Two or more Races (4 | 1.7%).
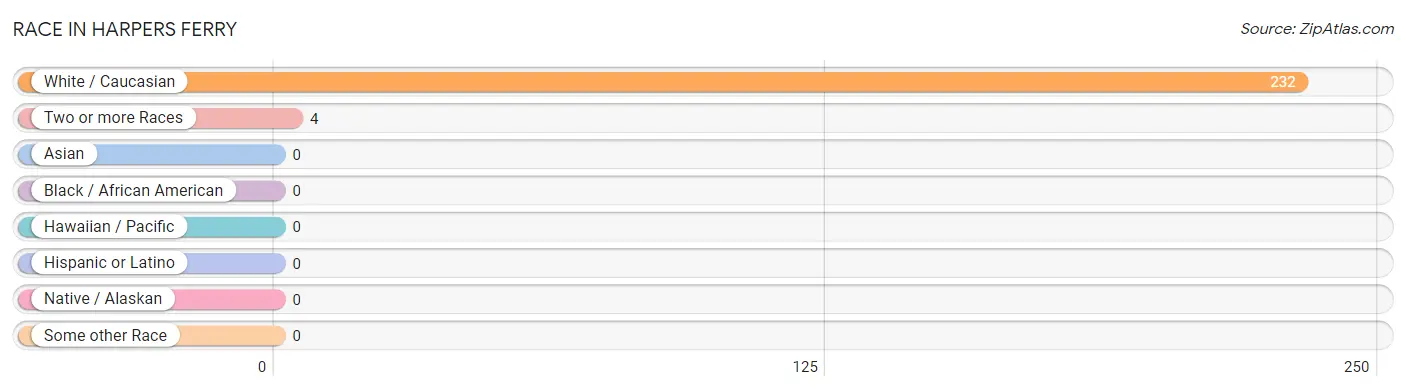
| Race | # Population | % Population |
| Asian | 0 | 0.0% |
| Black / African American | 0 | 0.0% |
| Hawaiian / Pacific | 0 | 0.0% |
| Hispanic or Latino | 0 | 0.0% |
| Native / Alaskan | 0 | 0.0% |
| White / Caucasian | 232 | 98.3% |
| Two or more Races | 4 | 1.7% |
| Some other Race | 0 | 0.0% |
| Total | 236 | 100.0% |
Ancestry in Harpers Ferry
The most populous ancestries reported in Harpers Ferry are German (99 | 41.9%), Irish (52 | 22.0%), Norwegian (32 | 13.6%), English (24 | 10.2%), and American (16 | 6.8%), together accounting for 94.5% of all Harpers Ferry residents.
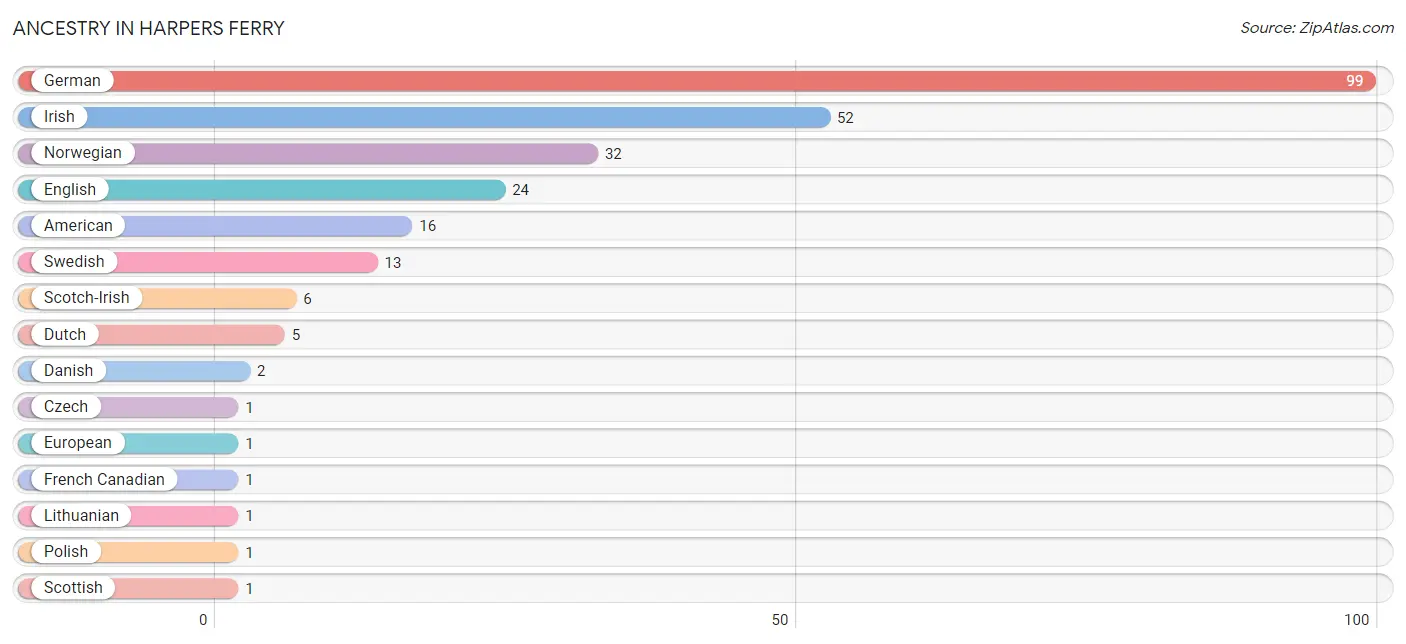
| Ancestry | # Population | % Population |
| American | 16 | 6.8% |
| Czech | 1 | 0.4% |
| Danish | 2 | 0.9% |
| Dutch | 5 | 2.1% |
| English | 24 | 10.2% |
| European | 1 | 0.4% |
| French Canadian | 1 | 0.4% |
| German | 99 | 41.9% |
| Irish | 52 | 22.0% |
| Lithuanian | 1 | 0.4% |
| Norwegian | 32 | 13.6% |
| Polish | 1 | 0.4% |
| Scotch-Irish | 6 | 2.5% |
| Scottish | 1 | 0.4% |
| Swedish | 13 | 5.5% | View All 15 Rows |
Immigrants in Harpers Ferry

| Immigration Origin | # Population | % Population | View All 0 Rows |
Sex and Age in Harpers Ferry
Sex and Age in Harpers Ferry
The most populous age groups in Harpers Ferry are 65 to 69 Years (24 | 20.0%) for men and 65 to 69 Years (42 | 36.2%) for women.
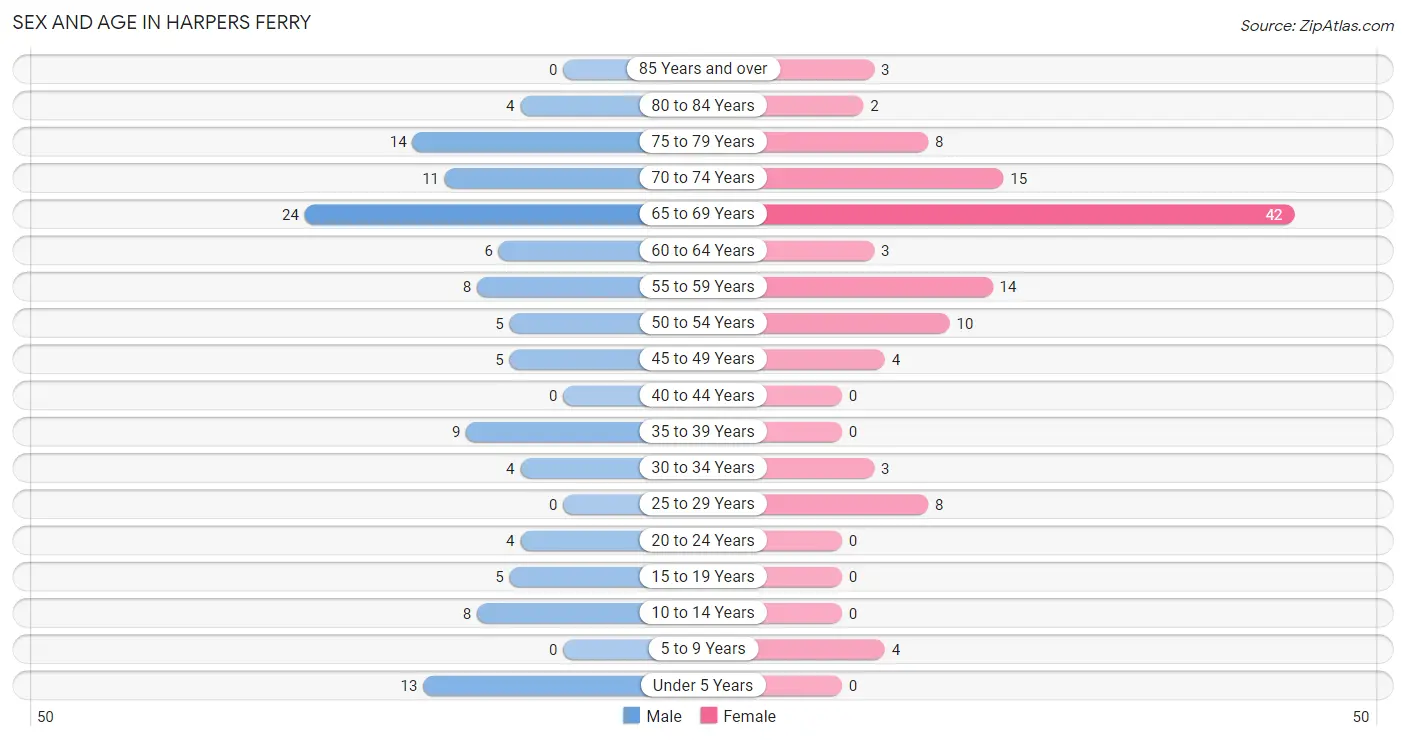
| Age Bracket | Male | Female |
| Under 5 Years | 13 (10.8%) | 0 (0.0%) |
| 5 to 9 Years | 0 (0.0%) | 4 (3.5%) |
| 10 to 14 Years | 8 (6.7%) | 0 (0.0%) |
| 15 to 19 Years | 5 (4.2%) | 0 (0.0%) |
| 20 to 24 Years | 4 (3.3%) | 0 (0.0%) |
| 25 to 29 Years | 0 (0.0%) | 8 (6.9%) |
| 30 to 34 Years | 4 (3.3%) | 3 (2.6%) |
| 35 to 39 Years | 9 (7.5%) | 0 (0.0%) |
| 40 to 44 Years | 0 (0.0%) | 0 (0.0%) |
| 45 to 49 Years | 5 (4.2%) | 4 (3.5%) |
| 50 to 54 Years | 5 (4.2%) | 10 (8.6%) |
| 55 to 59 Years | 8 (6.7%) | 14 (12.1%) |
| 60 to 64 Years | 6 (5.0%) | 3 (2.6%) |
| 65 to 69 Years | 24 (20.0%) | 42 (36.2%) |
| 70 to 74 Years | 11 (9.2%) | 15 (12.9%) |
| 75 to 79 Years | 14 (11.7%) | 8 (6.9%) |
| 80 to 84 Years | 4 (3.3%) | 2 (1.7%) |
| 85 Years and over | 0 (0.0%) | 3 (2.6%) |
| Total | 120 (100.0%) | 116 (100.0%) |
Families and Households in Harpers Ferry
Median Family Size in Harpers Ferry
The median family size in Harpers Ferry is 2.55 persons per family, with single female/mother families (1 | 1.5%) accounting for the largest median family size of 4 persons per family. On the other hand, single male/father families (2 | 3.1%) represent the smallest median family size with 2.00 persons per family.
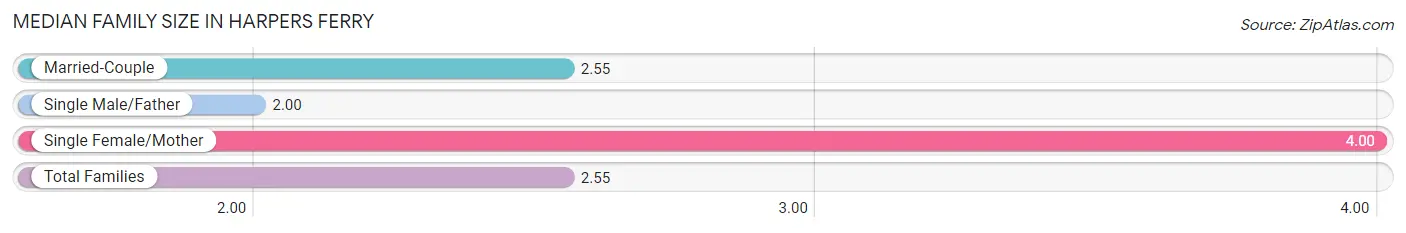
| Family Type | # Families | Family Size |
| Married-Couple | 62 (95.4%) | 2.55 |
| Single Male/Father | 2 (3.1%) | 2.00 |
| Single Female/Mother | 1 (1.5%) | 4.00 |
| Total Families | 65 (100.0%) | 2.55 |
Median Household Size in Harpers Ferry
The median household size in Harpers Ferry is 1.86 persons per household, with single female/mother households (1 | 0.8%) accounting for the largest median household size of 6 persons per household. non-family households (62 | 48.8%) represent the smallest median household size with 1.10 persons per household.
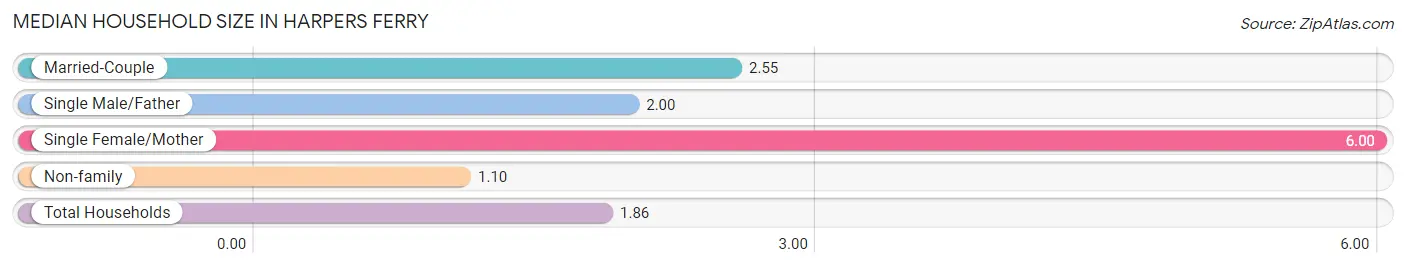
| Household Type | # Households | Household Size |
| Married-Couple | 62 (48.8%) | 2.55 |
| Single Male/Father | 2 (1.6%) | 2.00 |
| Single Female/Mother | 1 (0.8%) | 6.00 |
| Non-family | 62 (48.8%) | 1.10 |
| Total Households | 127 (100.0%) | 1.86 |
Household Size by Marriage Status in Harpers Ferry
Out of a total of 127 households in Harpers Ferry, 65 (51.2%) are family households, while 62 (48.8%) are nonfamily households. The most numerous type of family households are 2-person households, comprising 51, and the most common type of nonfamily households are 1-person households, comprising 56.
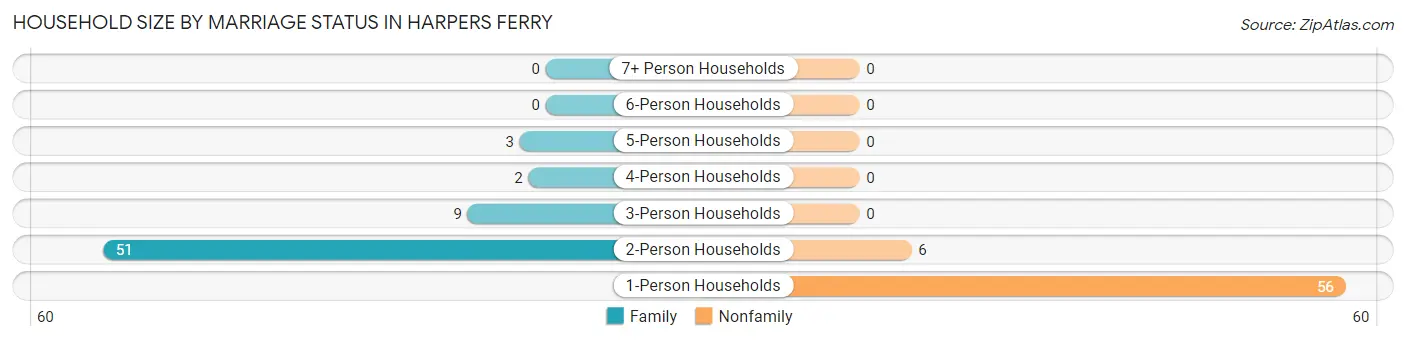
| Household Size | Family Households | Nonfamily Households |
| 1-Person Households | - | 56 (44.1%) |
| 2-Person Households | 51 (40.2%) | 6 (4.7%) |
| 3-Person Households | 9 (7.1%) | 0 (0.0%) |
| 4-Person Households | 2 (1.6%) | 0 (0.0%) |
| 5-Person Households | 3 (2.4%) | 0 (0.0%) |
| 6-Person Households | 0 (0.0%) | 0 (0.0%) |
| 7+ Person Households | 0 (0.0%) | 0 (0.0%) |
| Total | 65 (51.2%) | 62 (48.8%) |
Female Fertility in Harpers Ferry
Fertility by Age in Harpers Ferry
Average fertility rate in Harpers Ferry is 333.0 births per 1,000 women. Women in the age bracket of 35 to 50 years have the highest fertility rate with 500.0 births per 1,000 women. Women in the age bracket of 20 to 34 years acount for 60.0% of all women with births.
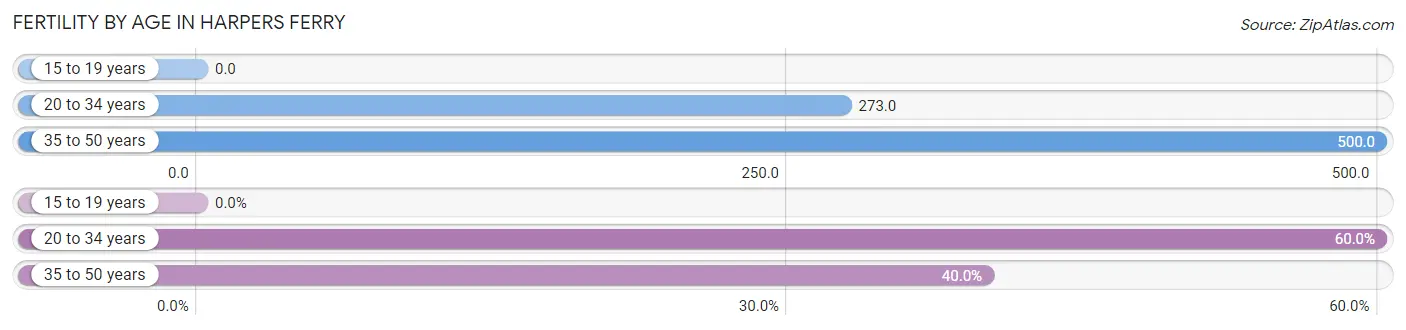
| Age Bracket | Women with Births | Births / 1,000 Women |
| 15 to 19 years | 0 (0.0%) | 0.0 |
| 20 to 34 years | 3 (60.0%) | 273.0 |
| 35 to 50 years | 2 (40.0%) | 500.0 |
| Total | 5 (100.0%) | 333.0 |
Fertility by Age by Marriage Status in Harpers Ferry
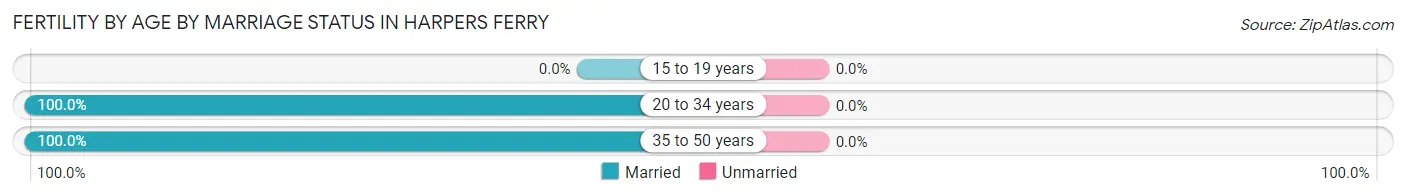
| Age Bracket | Married | Unmarried |
| 15 to 19 years | 0 (0.0%) | 0 (0.0%) |
| 20 to 34 years | 3 (100.0%) | 0 (0.0%) |
| 35 to 50 years | 2 (100.0%) | 0 (0.0%) |
| Total | 5 (100.0%) | 0 (0.0%) |
Fertility by Education in Harpers Ferry
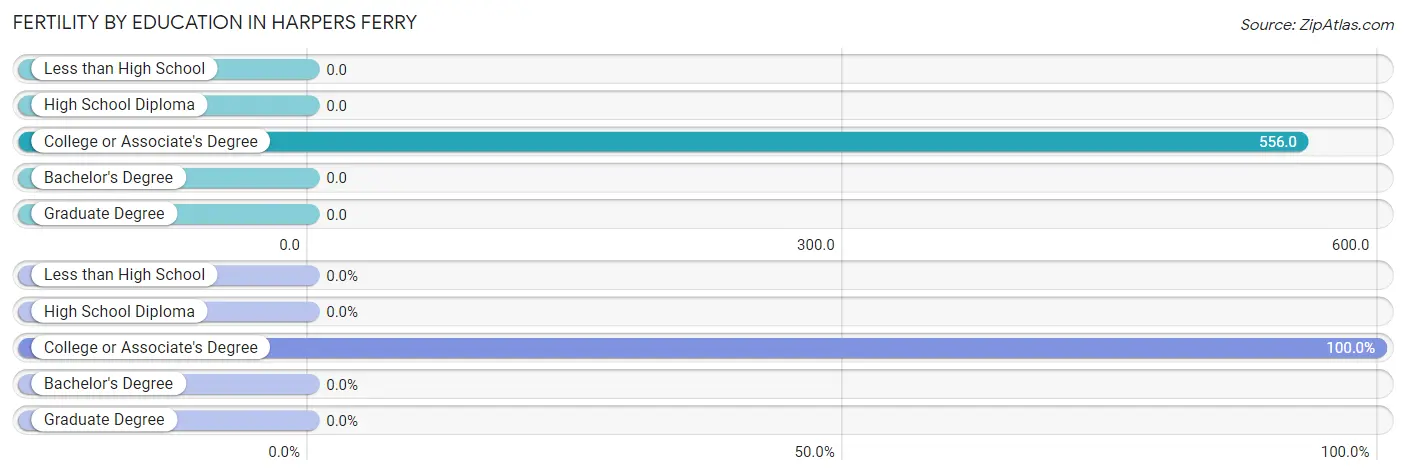
| Educational Attainment | Women with Births | Births / 1,000 Women |
| Less than High School | 0 (0.0%) | 0.0 |
| High School Diploma | 0 (0.0%) | 0.0 |
| College or Associate's Degree | 5 (100.0%) | 556.0 |
| Bachelor's Degree | 0 (0.0%) | 0.0 |
| Graduate Degree | 0 (0.0%) | 0.0 |
| Total | 5 (100.0%) | 333.0 |
Fertility by Education by Marriage Status in Harpers Ferry
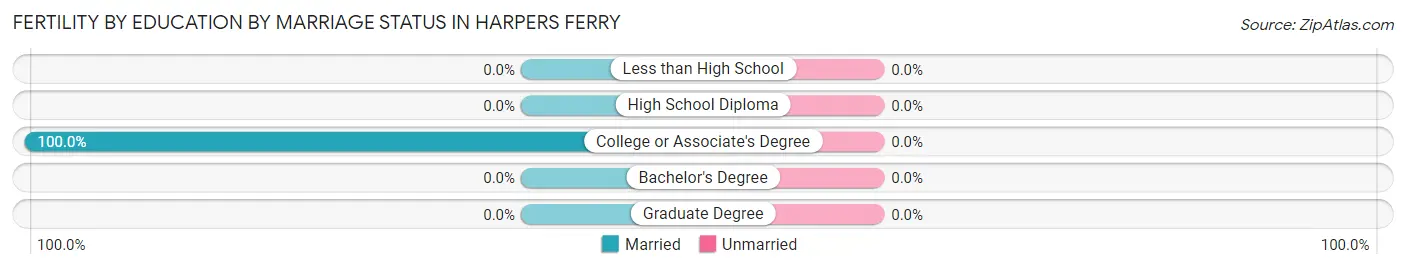
| Educational Attainment | Married | Unmarried |
| Less than High School | 0 (0.0%) | 0 (0.0%) |
| High School Diploma | 0 (0.0%) | 0 (0.0%) |
| College or Associate's Degree | 5 (100.0%) | 0 (0.0%) |
| Bachelor's Degree | 0 (0.0%) | 0 (0.0%) |
| Graduate Degree | 0 (0.0%) | 0 (0.0%) |
| Total | 5 (100.0%) | 0 (0.0%) |
Employment Characteristics in Harpers Ferry
Employment by Class of Employer in Harpers Ferry
Among the 98 employed individuals in Harpers Ferry, private company employees (55 | 56.1%), local government employees (17 | 17.3%), and state government employees (13 | 13.3%) make up the most common classes of employment.
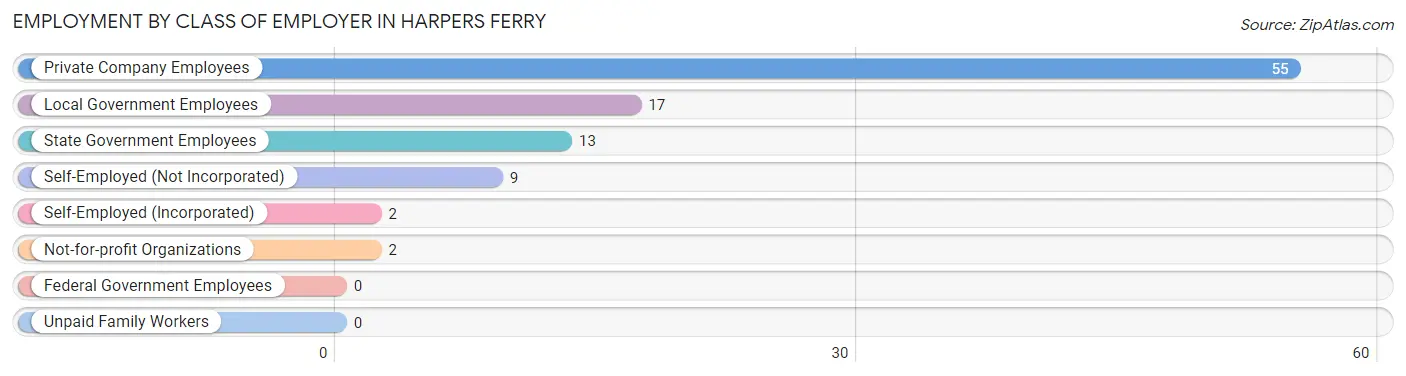
| Employer Class | # Employees | % Employees |
| Private Company Employees | 55 | 56.1% |
| Self-Employed (Incorporated) | 2 | 2.0% |
| Self-Employed (Not Incorporated) | 9 | 9.2% |
| Not-for-profit Organizations | 2 | 2.0% |
| Local Government Employees | 17 | 17.3% |
| State Government Employees | 13 | 13.3% |
| Federal Government Employees | 0 | 0.0% |
| Unpaid Family Workers | 0 | 0.0% |
| Total | 98 | 100.0% |
Employment Status by Age in Harpers Ferry
According to the labor force statistics for Harpers Ferry, out of the total population over 16 years of age (211), 48.8% or 103 individuals are in the labor force, with 1.0% or 1 of them unemployed. The age group with the highest labor force participation rate is 20 to 24 years, with 100.0% or 4 individuals in the labor force. Within the labor force, the 55 to 59 years age range has the highest percentage of unemployed individuals, with 5.9% or 1 of them being unemployed.
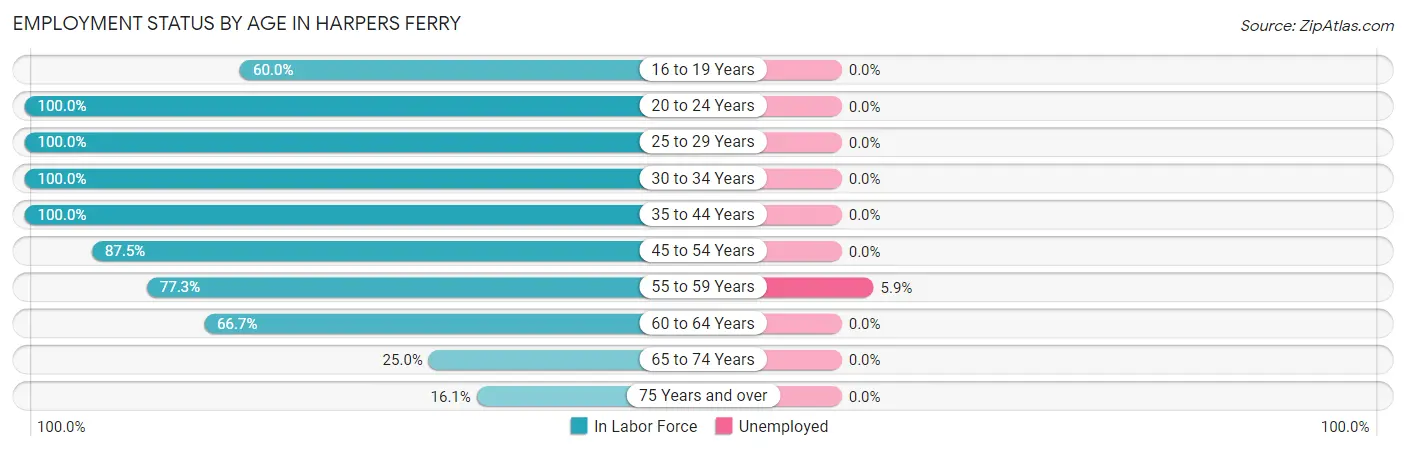
| Age Bracket | In Labor Force | Unemployed |
| 16 to 19 Years | 3 (60.0%) | 0 (0.0%) |
| 20 to 24 Years | 4 (100.0%) | 0 (0.0%) |
| 25 to 29 Years | 8 (100.0%) | 0 (0.0%) |
| 30 to 34 Years | 7 (100.0%) | 0 (0.0%) |
| 35 to 44 Years | 9 (100.0%) | 0 (0.0%) |
| 45 to 54 Years | 21 (87.5%) | 0 (0.0%) |
| 55 to 59 Years | 17 (77.3%) | 1 (5.9%) |
| 60 to 64 Years | 6 (66.7%) | 0 (0.0%) |
| 65 to 74 Years | 23 (25.0%) | 0 (0.0%) |
| 75 Years and over | 5 (16.1%) | 0 (0.0%) |
| Total | 103 (48.8%) | 1 (1.0%) |
Employment Status by Educational Attainment in Harpers Ferry
According to labor force statistics for Harpers Ferry, 86.1% of individuals (68) out of the total population between 25 and 64 years of age (79) are in the labor force, with 1.5% or 1 of them being unemployed. The group with the highest labor force participation rate are those with the educational attainment of college / associate degree, with 92.5% or 37 individuals in the labor force. Within the labor force, individuals with high school diploma education have the highest percentage of unemployment, with 5.6% or 1 of them being unemployed.
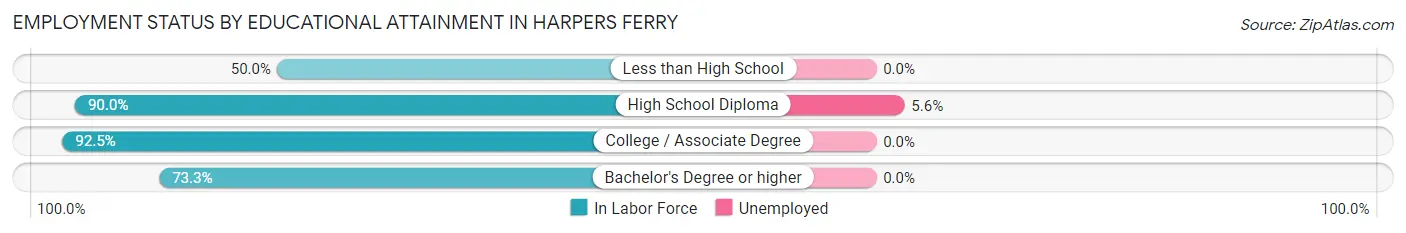
| Educational Attainment | In Labor Force | Unemployed |
| Less than High School | 2 (50.0%) | 0 (0.0%) |
| High School Diploma | 18 (90.0%) | 1 (5.6%) |
| College / Associate Degree | 37 (92.5%) | 0 (0.0%) |
| Bachelor's Degree or higher | 11 (73.3%) | 0 (0.0%) |
| Total | 68 (86.1%) | 1 (1.5%) |
Employment Occupations by Sex in Harpers Ferry
Management, Business, Science and Arts Occupations
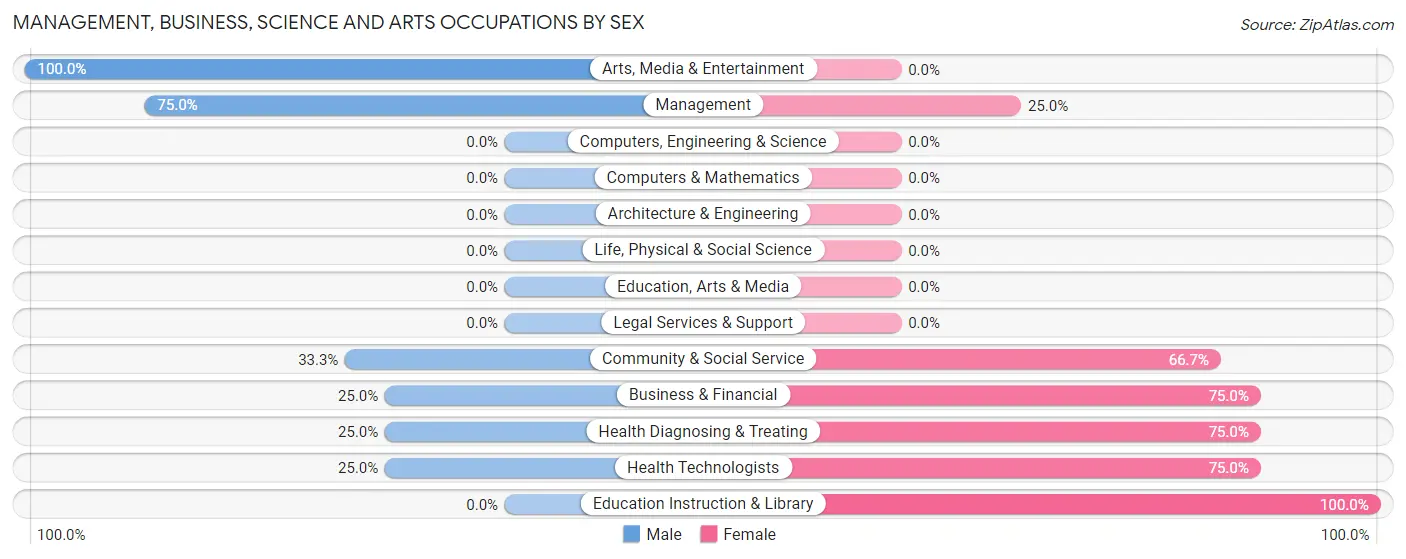
The most common Management, Business, Science and Arts occupations in Harpers Ferry are Management (8 | 7.8%), Business & Financial (8 | 7.8%), Health Diagnosing & Treating (8 | 7.8%), Health Technologists (8 | 7.8%), and Community & Social Service (3 | 2.9%).
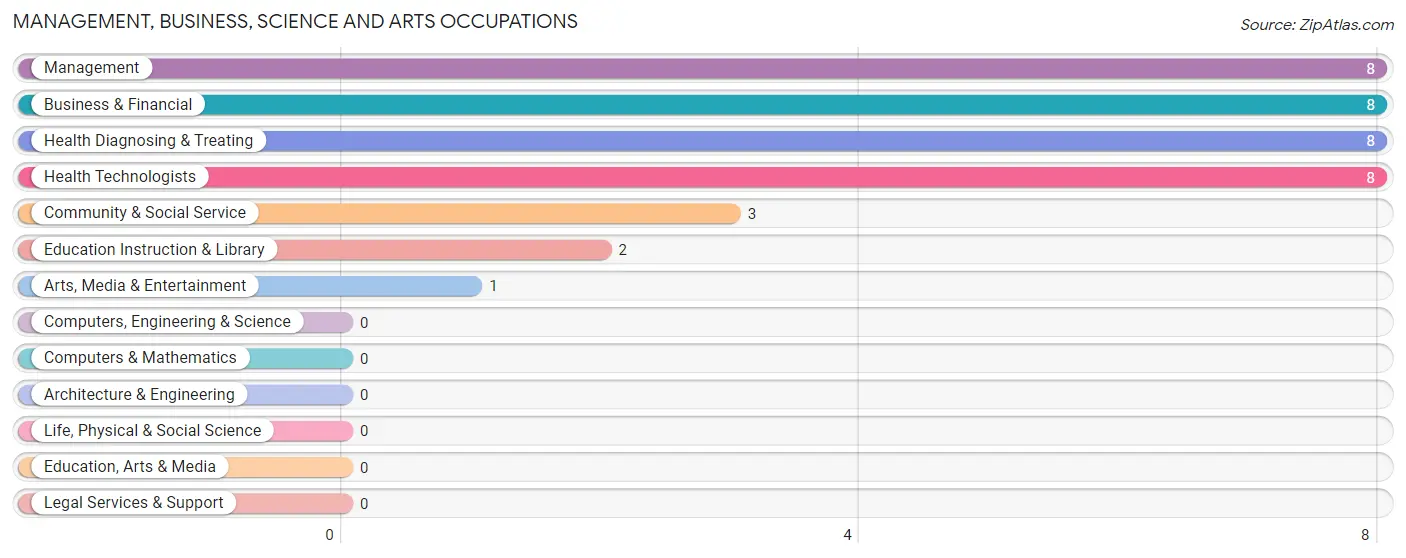
Management, Business, Science and Arts Occupations by Sex
Within the Management, Business, Science and Arts occupations in Harpers Ferry, the most male-oriented occupations are Arts, Media & Entertainment (100.0%), Management (75.0%), and Community & Social Service (33.3%), while the most female-oriented occupations are Education Instruction & Library (100.0%), Business & Financial (75.0%), and Health Diagnosing & Treating (75.0%).
| Occupation | Male | Female |
| Management | 6 (75.0%) | 2 (25.0%) |
| Business & Financial | 2 (25.0%) | 6 (75.0%) |
| Computers, Engineering & Science | 0 (0.0%) | 0 (0.0%) |
| Computers & Mathematics | 0 (0.0%) | 0 (0.0%) |
| Architecture & Engineering | 0 (0.0%) | 0 (0.0%) |
| Life, Physical & Social Science | 0 (0.0%) | 0 (0.0%) |
| Community & Social Service | 1 (33.3%) | 2 (66.7%) |
| Education, Arts & Media | 0 (0.0%) | 0 (0.0%) |
| Legal Services & Support | 0 (0.0%) | 0 (0.0%) |
| Education Instruction & Library | 0 (0.0%) | 2 (100.0%) |
| Arts, Media & Entertainment | 1 (100.0%) | 0 (0.0%) |
| Health Diagnosing & Treating | 2 (25.0%) | 6 (75.0%) |
| Health Technologists | 2 (25.0%) | 6 (75.0%) |
| Total (Category) | 11 (40.7%) | 16 (59.3%) |
| Total (Overall) | 48 (47.1%) | 54 (52.9%) |
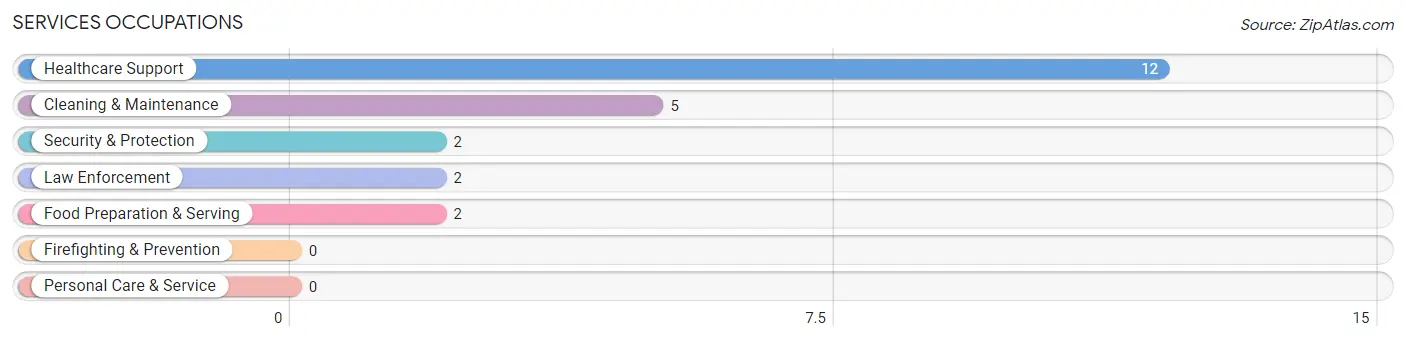
Services Occupations
The most common Services occupations in Harpers Ferry are Healthcare Support (12 | 11.8%), Cleaning & Maintenance (5 | 4.9%), Security & Protection (2 | 2.0%), Law Enforcement (2 | 2.0%), and Food Preparation & Serving (2 | 2.0%).
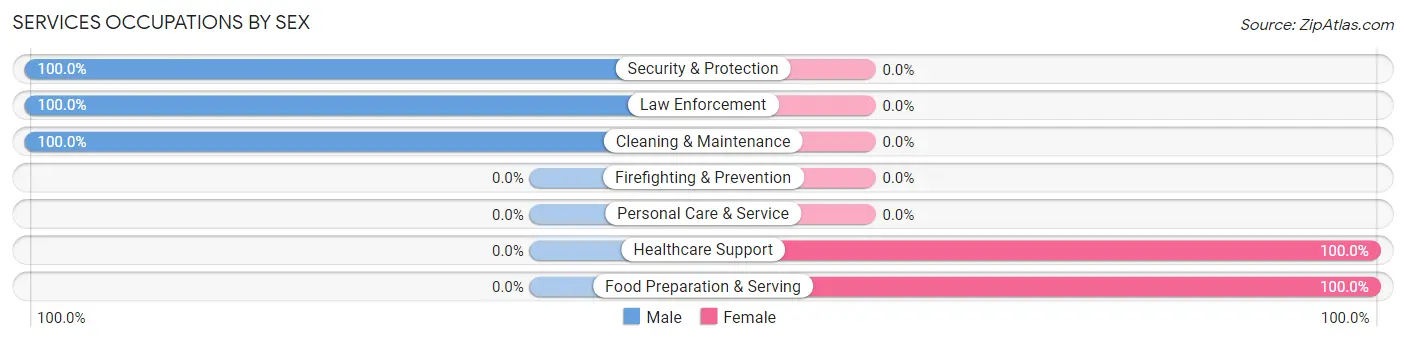
Services Occupations by Sex
Within the Services occupations in Harpers Ferry, the most male-oriented occupations are Security & Protection (100.0%), Law Enforcement (100.0%), and Cleaning & Maintenance (100.0%), while the most female-oriented occupations are Healthcare Support (100.0%), and Food Preparation & Serving (100.0%).
| Occupation | Male | Female |
| Healthcare Support | 0 (0.0%) | 12 (100.0%) |
| Security & Protection | 2 (100.0%) | 0 (0.0%) |
| Firefighting & Prevention | 0 (0.0%) | 0 (0.0%) |
| Law Enforcement | 2 (100.0%) | 0 (0.0%) |
| Food Preparation & Serving | 0 (0.0%) | 2 (100.0%) |
| Cleaning & Maintenance | 5 (100.0%) | 0 (0.0%) |
| Personal Care & Service | 0 (0.0%) | 0 (0.0%) |
| Total (Category) | 7 (33.3%) | 14 (66.7%) |
| Total (Overall) | 48 (47.1%) | 54 (52.9%) |
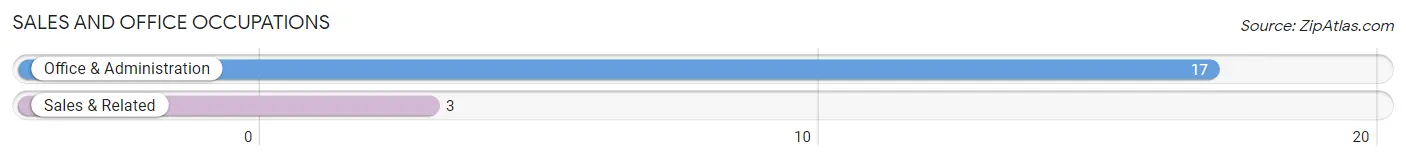
Sales and Office Occupations
The most common Sales and Office occupations in Harpers Ferry are Office & Administration (17 | 16.7%), and Sales & Related (3 | 2.9%).
Sales and Office Occupations by Sex
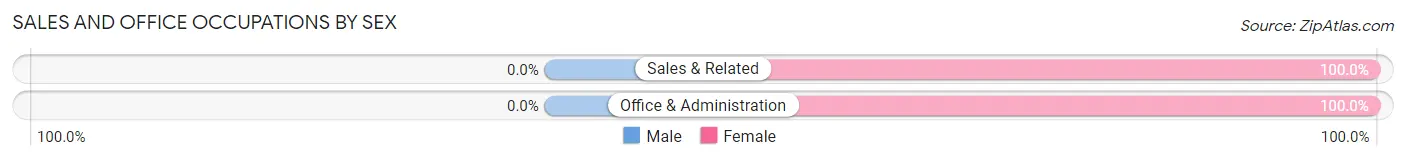
| Occupation | Male | Female |
| Sales & Related | 0 (0.0%) | 3 (100.0%) |
| Office & Administration | 0 (0.0%) | 17 (100.0%) |
| Total (Category) | 0 (0.0%) | 20 (100.0%) |
| Total (Overall) | 48 (47.1%) | 54 (52.9%) |
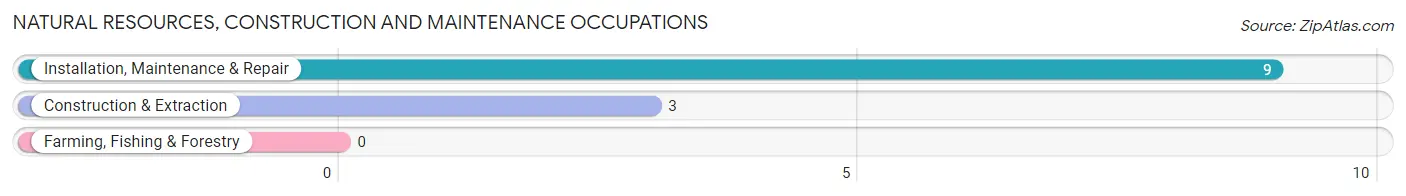
Natural Resources, Construction and Maintenance Occupations
The most common Natural Resources, Construction and Maintenance occupations in Harpers Ferry are Installation, Maintenance & Repair (9 | 8.8%), and Construction & Extraction (3 | 2.9%).
Natural Resources, Construction and Maintenance Occupations by Sex
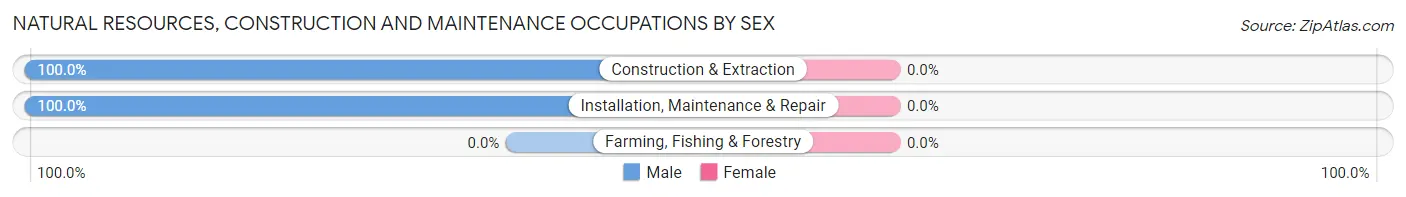
| Occupation | Male | Female |
| Farming, Fishing & Forestry | 0 (0.0%) | 0 (0.0%) |
| Construction & Extraction | 3 (100.0%) | 0 (0.0%) |
| Installation, Maintenance & Repair | 9 (100.0%) | 0 (0.0%) |
| Total (Category) | 12 (100.0%) | 0 (0.0%) |
| Total (Overall) | 48 (47.1%) | 54 (52.9%) |
Production, Transportation and Moving Occupations
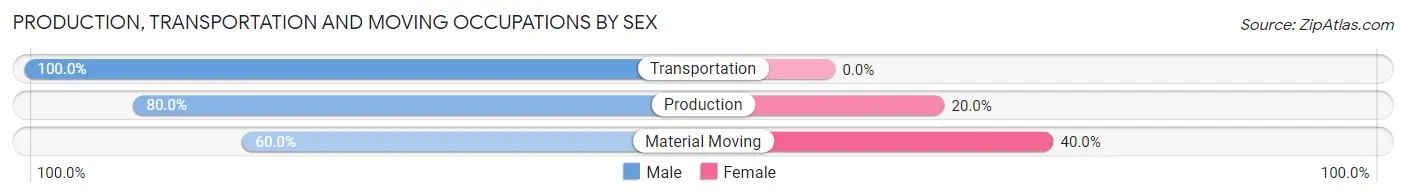
The most common Production, Transportation and Moving occupations in Harpers Ferry are Production (10 | 9.8%), Transportation (7 | 6.9%), and Material Moving (5 | 4.9%).
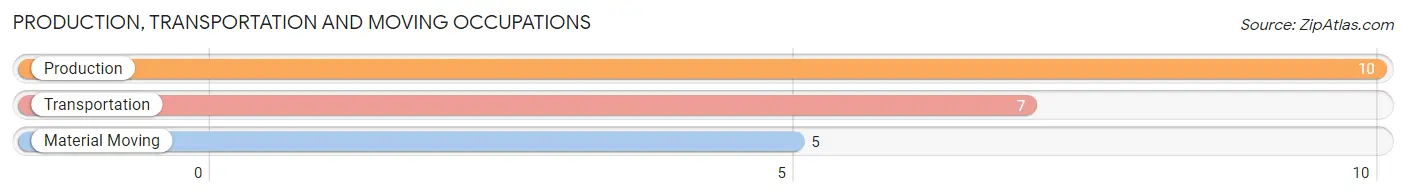
Production, Transportation and Moving Occupations by Sex
| Occupation | Male | Female |
| Production | 8 (80.0%) | 2 (20.0%) |
| Transportation | 7 (100.0%) | 0 (0.0%) |
| Material Moving | 3 (60.0%) | 2 (40.0%) |
| Total (Category) | 18 (81.8%) | 4 (18.2%) |
| Total (Overall) | 48 (47.1%) | 54 (52.9%) |
Employment Industries by Sex in Harpers Ferry
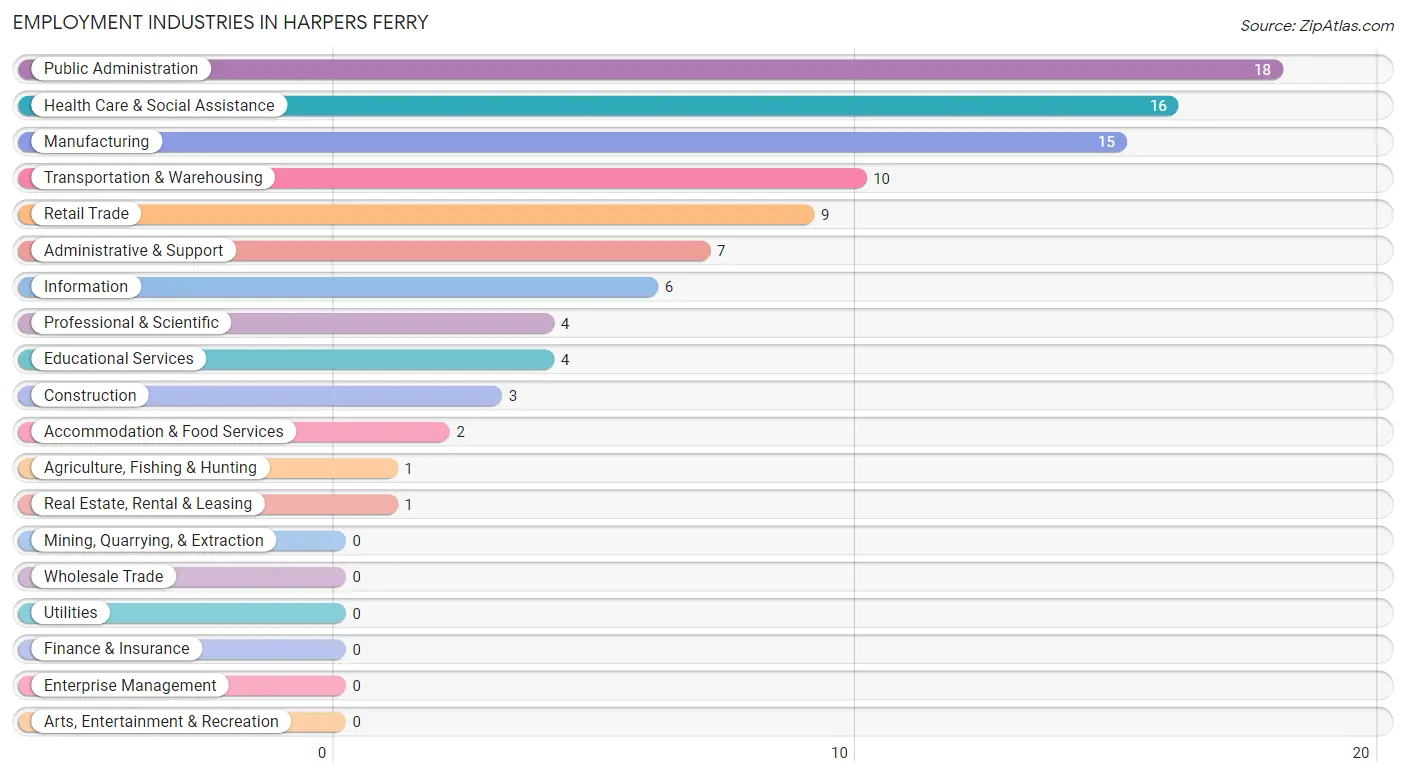
Employment Industries in Harpers Ferry
The major employment industries in Harpers Ferry include Public Administration (18 | 17.6%), Health Care & Social Assistance (16 | 15.7%), Manufacturing (15 | 14.7%), Transportation & Warehousing (10 | 9.8%), and Retail Trade (9 | 8.8%).
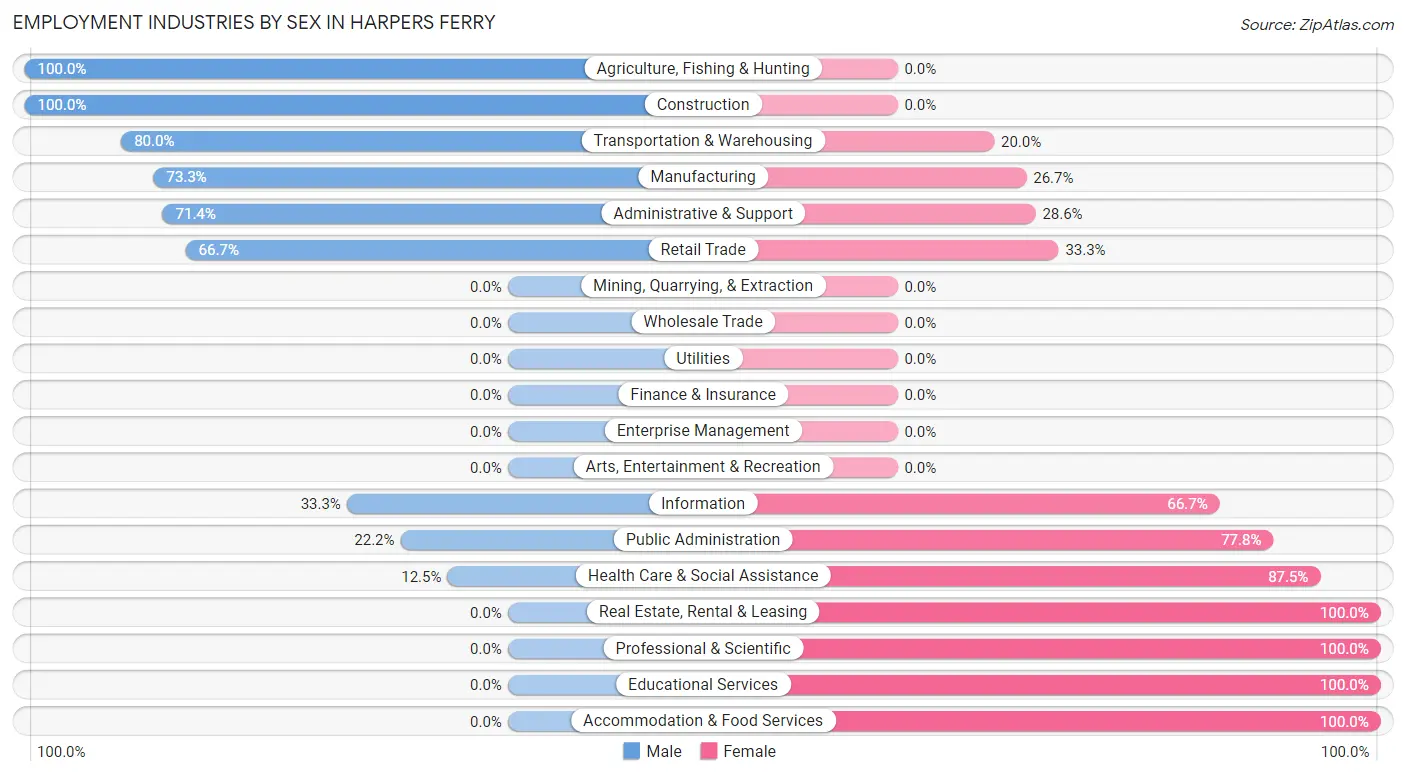
Employment Industries by Sex in Harpers Ferry
The Harpers Ferry industries that see more men than women are Agriculture, Fishing & Hunting (100.0%), Construction (100.0%), and Transportation & Warehousing (80.0%), whereas the industries that tend to have a higher number of women are Real Estate, Rental & Leasing (100.0%), Professional & Scientific (100.0%), and Educational Services (100.0%).
| Industry | Male | Female |
| Agriculture, Fishing & Hunting | 1 (100.0%) | 0 (0.0%) |
| Mining, Quarrying, & Extraction | 0 (0.0%) | 0 (0.0%) |
| Construction | 3 (100.0%) | 0 (0.0%) |
| Manufacturing | 11 (73.3%) | 4 (26.7%) |
| Wholesale Trade | 0 (0.0%) | 0 (0.0%) |
| Retail Trade | 6 (66.7%) | 3 (33.3%) |
| Transportation & Warehousing | 8 (80.0%) | 2 (20.0%) |
| Utilities | 0 (0.0%) | 0 (0.0%) |
| Information | 2 (33.3%) | 4 (66.7%) |
| Finance & Insurance | 0 (0.0%) | 0 (0.0%) |
| Real Estate, Rental & Leasing | 0 (0.0%) | 1 (100.0%) |
| Professional & Scientific | 0 (0.0%) | 4 (100.0%) |
| Enterprise Management | 0 (0.0%) | 0 (0.0%) |
| Administrative & Support | 5 (71.4%) | 2 (28.6%) |
| Educational Services | 0 (0.0%) | 4 (100.0%) |
| Health Care & Social Assistance | 2 (12.5%) | 14 (87.5%) |
| Arts, Entertainment & Recreation | 0 (0.0%) | 0 (0.0%) |
| Accommodation & Food Services | 0 (0.0%) | 2 (100.0%) |
| Public Administration | 4 (22.2%) | 14 (77.8%) |
| Total | 48 (47.1%) | 54 (52.9%) |
Education in Harpers Ferry
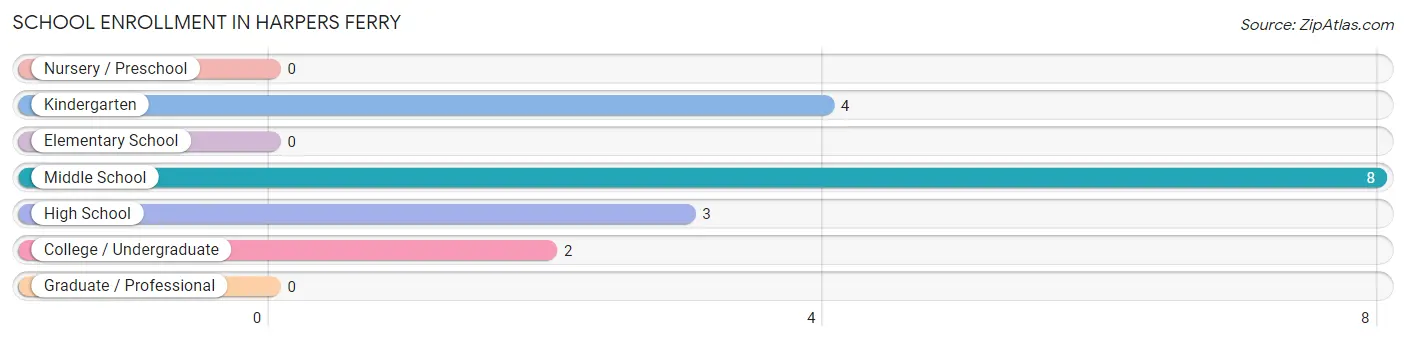
School Enrollment in Harpers Ferry
The most common levels of schooling among the 17 students in Harpers Ferry are middle school (8 | 47.1%), kindergarten (4 | 23.5%), and high school (3 | 17.6%).
| School Level | # Students | % Students |
| Nursery / Preschool | 0 | 0.0% |
| Kindergarten | 4 | 23.5% |
| Elementary School | 0 | 0.0% |
| Middle School | 8 | 47.1% |
| High School | 3 | 17.6% |
| College / Undergraduate | 2 | 11.8% |
| Graduate / Professional | 0 | 0.0% |
| Total | 17 | 100.0% |
School Enrollment by Age by Funding Source in Harpers Ferry
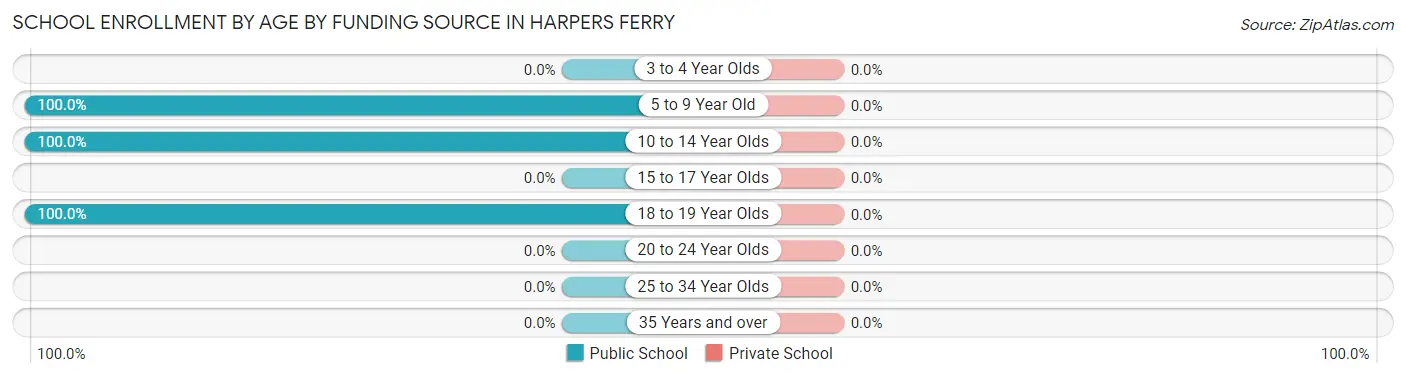
| Age Bracket | Public School | Private School |
| 3 to 4 Year Olds | 0 (0.0%) | 0 (0.0%) |
| 5 to 9 Year Old | 4 (100.0%) | 0 (0.0%) |
| 10 to 14 Year Olds | 8 (100.0%) | 0 (0.0%) |
| 15 to 17 Year Olds | 0 (0.0%) | 0 (0.0%) |
| 18 to 19 Year Olds | 5 (100.0%) | 0 (0.0%) |
| 20 to 24 Year Olds | 0 (0.0%) | 0 (0.0%) |
| 25 to 34 Year Olds | 0 (0.0%) | 0 (0.0%) |
| 35 Years and over | 0 (0.0%) | 0 (0.0%) |
| Total | 17 (100.0%) | 0 (0.0%) |
Educational Attainment by Field of Study in Harpers Ferry
Business (17 | 34.7%), education (7 | 14.3%), science & technology (6 | 12.2%), liberal arts & history (6 | 12.2%), and computers & mathematics (4 | 8.2%) are the most common fields of study among 49 individuals in Harpers Ferry who have obtained a bachelor's degree or higher.
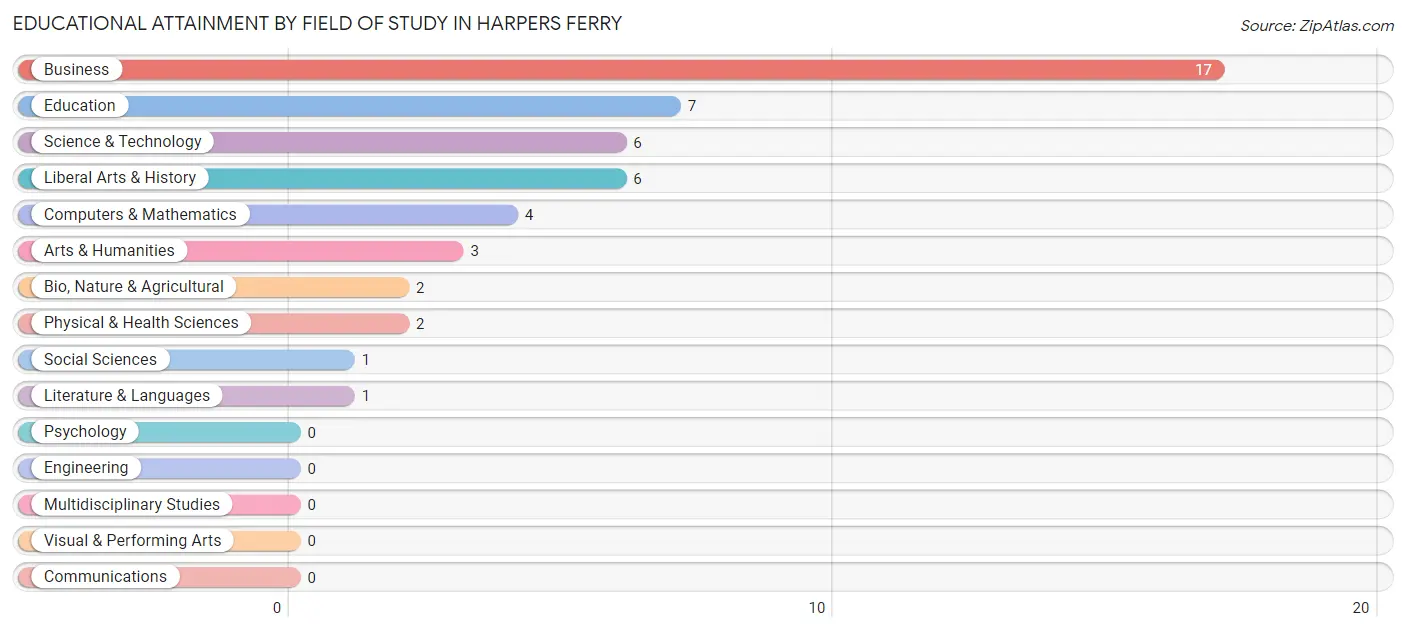
| Field of Study | # Graduates | % Graduates |
| Computers & Mathematics | 4 | 8.2% |
| Bio, Nature & Agricultural | 2 | 4.1% |
| Physical & Health Sciences | 2 | 4.1% |
| Psychology | 0 | 0.0% |
| Social Sciences | 1 | 2.0% |
| Engineering | 0 | 0.0% |
| Multidisciplinary Studies | 0 | 0.0% |
| Science & Technology | 6 | 12.2% |
| Business | 17 | 34.7% |
| Education | 7 | 14.3% |
| Literature & Languages | 1 | 2.0% |
| Liberal Arts & History | 6 | 12.2% |
| Visual & Performing Arts | 0 | 0.0% |
| Communications | 0 | 0.0% |
| Arts & Humanities | 3 | 6.1% |
| Total | 49 | 100.0% |
Transportation & Commute in Harpers Ferry
Vehicle Availability by Sex in Harpers Ferry
The most prevalent vehicle ownership categories in Harpers Ferry are males with 2 vehicles (18, accounting for 37.5%) and females with 2 vehicles (31, making up 36.0%).
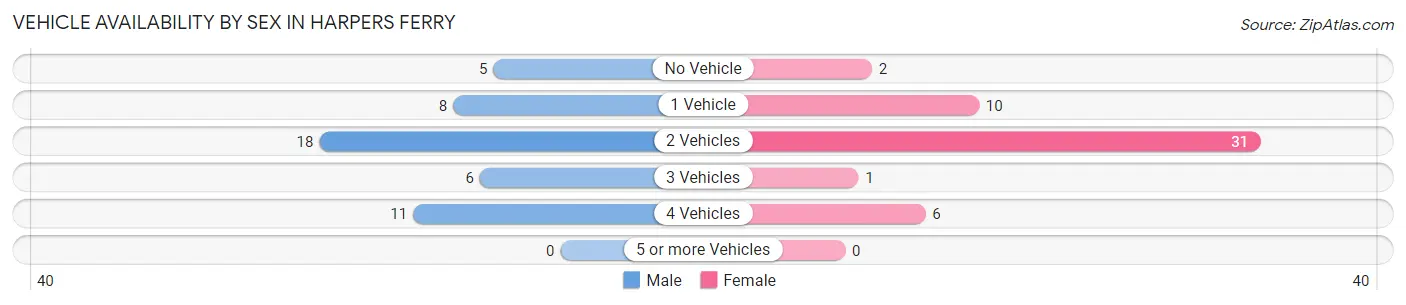
| Vehicles Available | Male | Female |
| No Vehicle | 5 (10.4%) | 2 (4.0%) |
| 1 Vehicle | 8 (16.7%) | 10 (20.0%) |
| 2 Vehicles | 18 (37.5%) | 31 (62.0%) |
| 3 Vehicles | 6 (12.5%) | 1 (2.0%) |
| 4 Vehicles | 11 (22.9%) | 6 (12.0%) |
| 5 or more Vehicles | 0 (0.0%) | 0 (0.0%) |
| Total | 48 (100.0%) | 50 (100.0%) |
Commute Time in Harpers Ferry
The most frequently occuring commute durations in Harpers Ferry are 30 to 34 minutes (24 commuters, 27.3%), 15 to 19 minutes (13 commuters, 14.8%), and 25 to 29 minutes (13 commuters, 14.8%).
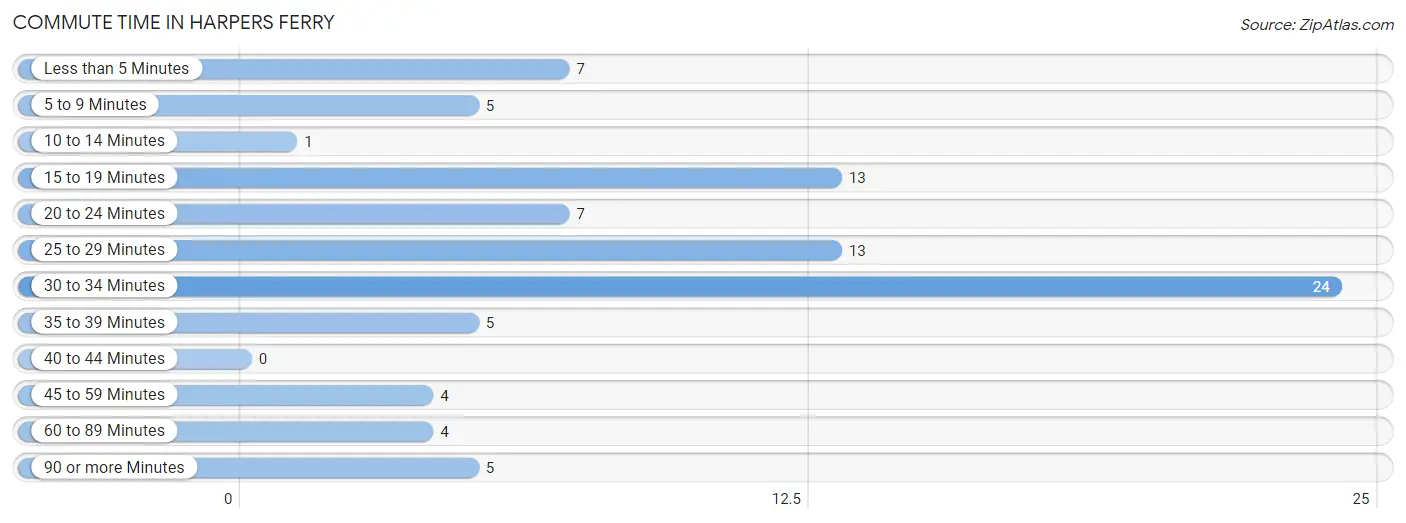
| Commute Time | # Commuters | % Commuters |
| Less than 5 Minutes | 7 | 8.0% |
| 5 to 9 Minutes | 5 | 5.7% |
| 10 to 14 Minutes | 1 | 1.1% |
| 15 to 19 Minutes | 13 | 14.8% |
| 20 to 24 Minutes | 7 | 8.0% |
| 25 to 29 Minutes | 13 | 14.8% |
| 30 to 34 Minutes | 24 | 27.3% |
| 35 to 39 Minutes | 5 | 5.7% |
| 40 to 44 Minutes | 0 | 0.0% |
| 45 to 59 Minutes | 4 | 4.5% |
| 60 to 89 Minutes | 4 | 4.5% |
| 90 or more Minutes | 5 | 5.7% |
Commute Time by Sex in Harpers Ferry
The most common commute times in Harpers Ferry are 30 to 34 minutes (18 commuters, 43.9%) for males and 25 to 29 minutes (11 commuters, 23.4%) for females.
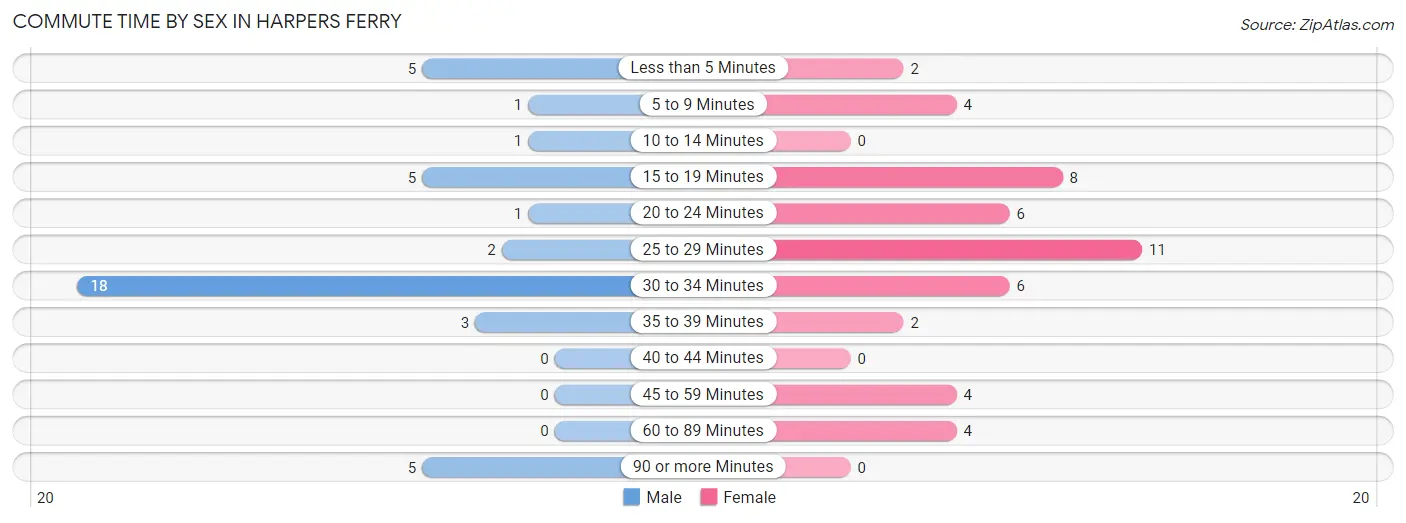
| Commute Time | Male | Female |
| Less than 5 Minutes | 5 (12.2%) | 2 (4.3%) |
| 5 to 9 Minutes | 1 (2.4%) | 4 (8.5%) |
| 10 to 14 Minutes | 1 (2.4%) | 0 (0.0%) |
| 15 to 19 Minutes | 5 (12.2%) | 8 (17.0%) |
| 20 to 24 Minutes | 1 (2.4%) | 6 (12.8%) |
| 25 to 29 Minutes | 2 (4.9%) | 11 (23.4%) |
| 30 to 34 Minutes | 18 (43.9%) | 6 (12.8%) |
| 35 to 39 Minutes | 3 (7.3%) | 2 (4.3%) |
| 40 to 44 Minutes | 0 (0.0%) | 0 (0.0%) |
| 45 to 59 Minutes | 0 (0.0%) | 4 (8.5%) |
| 60 to 89 Minutes | 0 (0.0%) | 4 (8.5%) |
| 90 or more Minutes | 5 (12.2%) | 0 (0.0%) |
Time of Departure to Work by Sex in Harpers Ferry
The most frequent times of departure to work in Harpers Ferry are 6:30 AM to 6:59 AM (13, 31.7%) for males and 7:00 AM to 7:29 AM (26, 55.3%) for females.
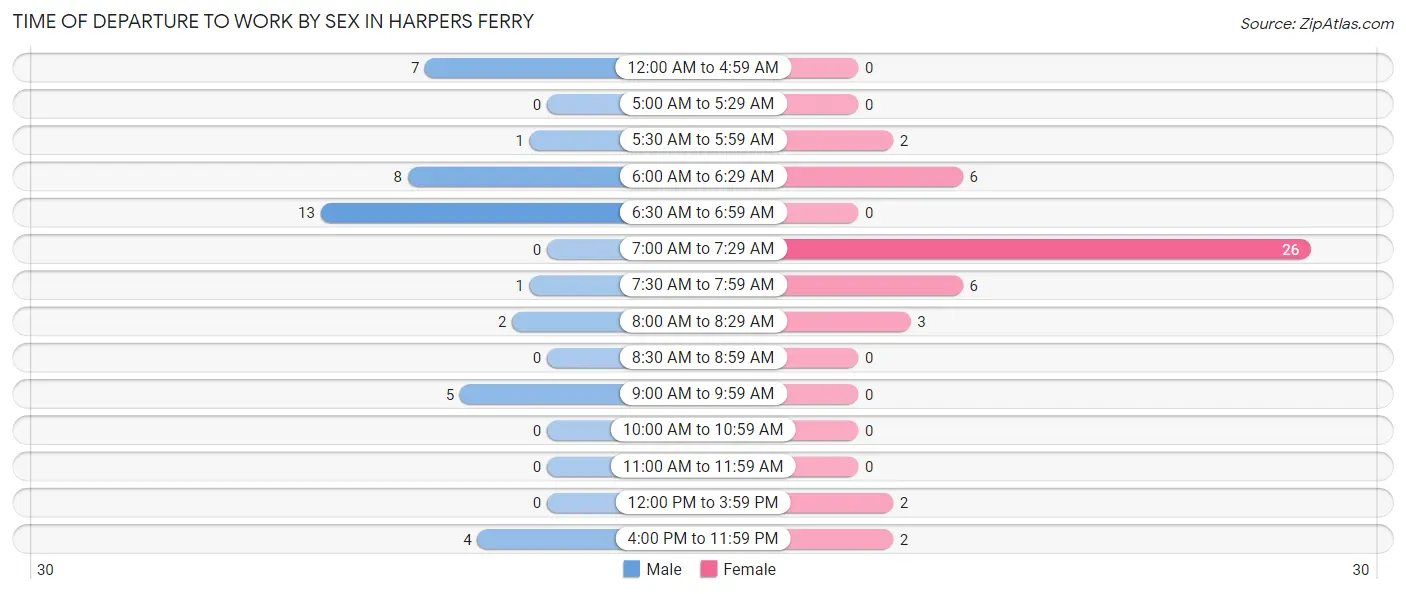
| Time of Departure | Male | Female |
| 12:00 AM to 4:59 AM | 7 (17.1%) | 0 (0.0%) |
| 5:00 AM to 5:29 AM | 0 (0.0%) | 0 (0.0%) |
| 5:30 AM to 5:59 AM | 1 (2.4%) | 2 (4.3%) |
| 6:00 AM to 6:29 AM | 8 (19.5%) | 6 (12.8%) |
| 6:30 AM to 6:59 AM | 13 (31.7%) | 0 (0.0%) |
| 7:00 AM to 7:29 AM | 0 (0.0%) | 26 (55.3%) |
| 7:30 AM to 7:59 AM | 1 (2.4%) | 6 (12.8%) |
| 8:00 AM to 8:29 AM | 2 (4.9%) | 3 (6.4%) |
| 8:30 AM to 8:59 AM | 0 (0.0%) | 0 (0.0%) |
| 9:00 AM to 9:59 AM | 5 (12.2%) | 0 (0.0%) |
| 10:00 AM to 10:59 AM | 0 (0.0%) | 0 (0.0%) |
| 11:00 AM to 11:59 AM | 0 (0.0%) | 0 (0.0%) |
| 12:00 PM to 3:59 PM | 0 (0.0%) | 2 (4.3%) |
| 4:00 PM to 11:59 PM | 4 (9.8%) | 2 (4.3%) |
| Total | 41 (100.0%) | 47 (100.0%) |
Housing Occupancy in Harpers Ferry
Occupancy by Ownership in Harpers Ferry
Of the total 127 dwellings in Harpers Ferry, owner-occupied units account for 109 (85.8%), while renter-occupied units make up 18 (14.2%).
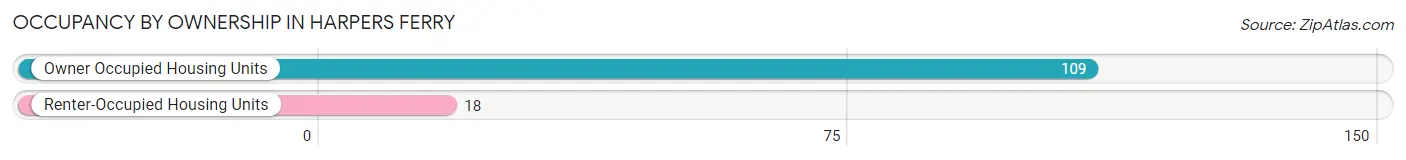
| Occupancy | # Housing Units | % Housing Units |
| Owner Occupied Housing Units | 109 | 85.8% |
| Renter-Occupied Housing Units | 18 | 14.2% |
| Total Occupied Housing Units | 127 | 100.0% |
Occupancy by Household Size in Harpers Ferry
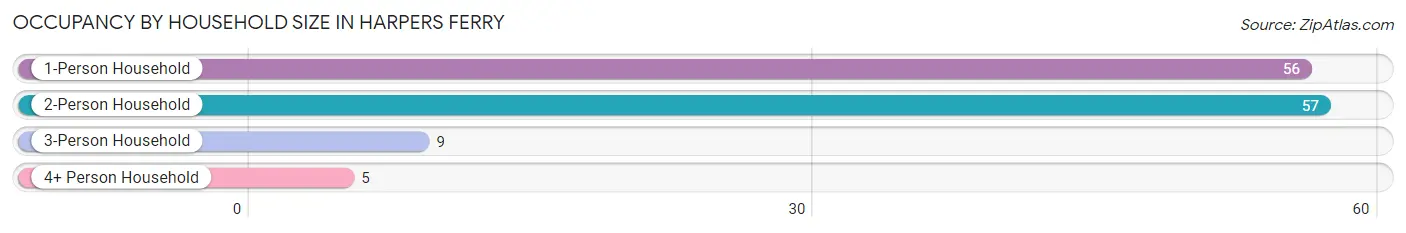
| Household Size | # Housing Units | % Housing Units |
| 1-Person Household | 56 | 44.1% |
| 2-Person Household | 57 | 44.9% |
| 3-Person Household | 9 | 7.1% |
| 4+ Person Household | 5 | 3.9% |
| Total Housing Units | 127 | 100.0% |
Occupancy by Ownership by Household Size in Harpers Ferry
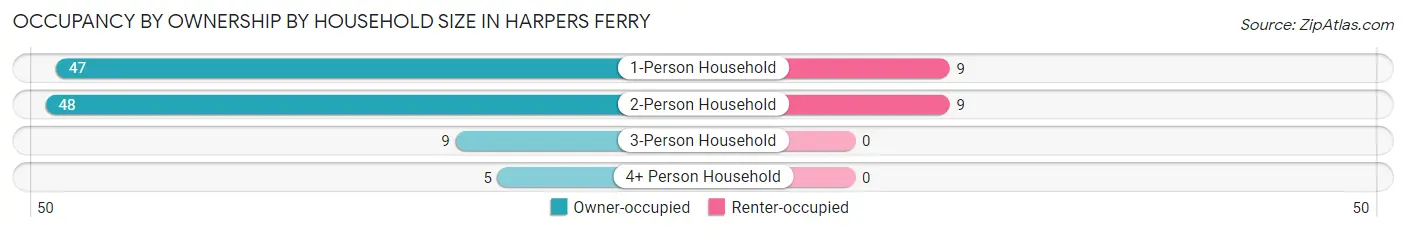
| Household Size | Owner-occupied | Renter-occupied |
| 1-Person Household | 47 (83.9%) | 9 (16.1%) |
| 2-Person Household | 48 (84.2%) | 9 (15.8%) |
| 3-Person Household | 9 (100.0%) | 0 (0.0%) |
| 4+ Person Household | 5 (100.0%) | 0 (0.0%) |
| Total Housing Units | 109 (85.8%) | 18 (14.2%) |
Occupancy by Educational Attainment in Harpers Ferry
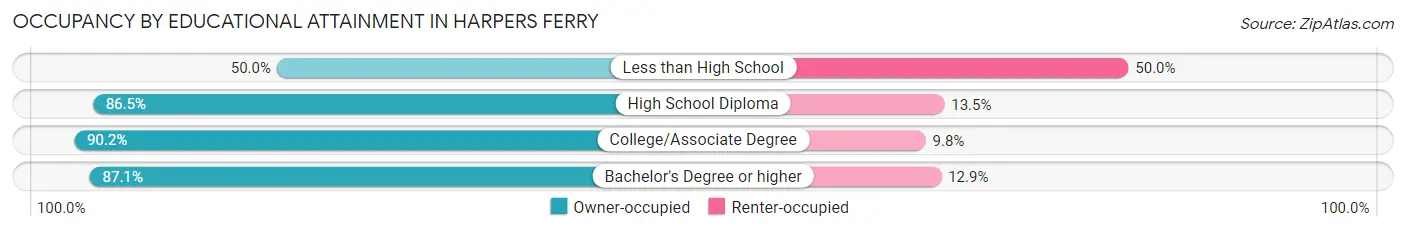
| Household Size | Owner-occupied | Renter-occupied |
| Less than High School | 4 (50.0%) | 4 (50.0%) |
| High School Diploma | 32 (86.5%) | 5 (13.5%) |
| College/Associate Degree | 46 (90.2%) | 5 (9.8%) |
| Bachelor's Degree or higher | 27 (87.1%) | 4 (12.9%) |
Occupancy by Age of Householder in Harpers Ferry
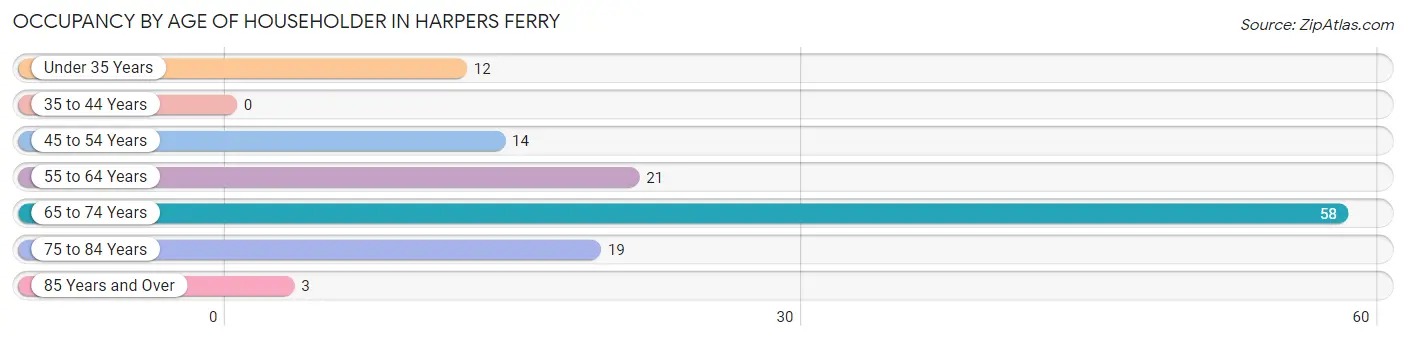
| Age Bracket | # Households | % Households |
| Under 35 Years | 12 | 9.5% |
| 35 to 44 Years | 0 | 0.0% |
| 45 to 54 Years | 14 | 11.0% |
| 55 to 64 Years | 21 | 16.5% |
| 65 to 74 Years | 58 | 45.7% |
| 75 to 84 Years | 19 | 15.0% |
| 85 Years and Over | 3 | 2.4% |
| Total | 127 | 100.0% |
Housing Finances in Harpers Ferry
Median Income by Occupancy in Harpers Ferry
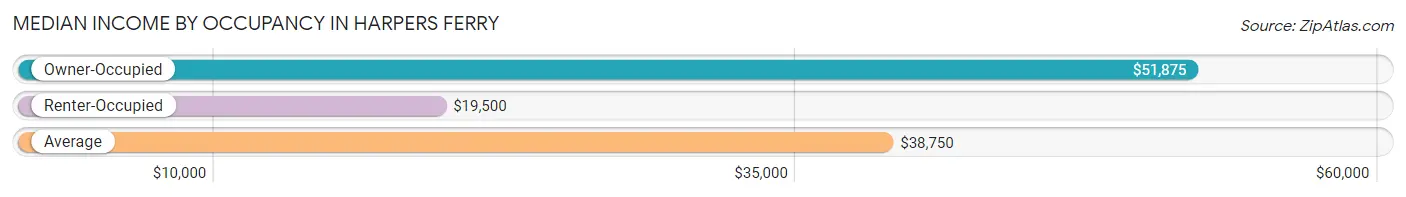
| Occupancy Type | # Households | Median Income |
| Owner-Occupied | 109 (85.8%) | $51,875 |
| Renter-Occupied | 18 (14.2%) | $19,500 |
| Average | 127 (100.0%) | $38,750 |
Occupancy by Householder Income Bracket in Harpers Ferry
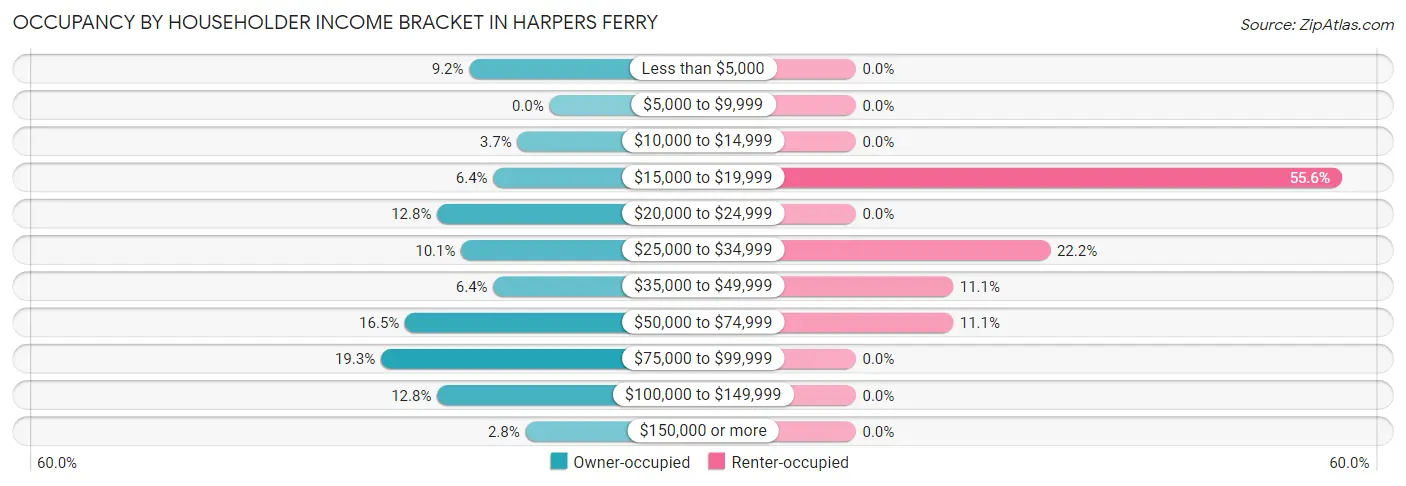
| Income Bracket | Owner-occupied | Renter-occupied |
| Less than $5,000 | 10 (9.2%) | 0 (0.0%) |
| $5,000 to $9,999 | 0 (0.0%) | 0 (0.0%) |
| $10,000 to $14,999 | 4 (3.7%) | 0 (0.0%) |
| $15,000 to $19,999 | 7 (6.4%) | 10 (55.6%) |
| $20,000 to $24,999 | 14 (12.8%) | 0 (0.0%) |
| $25,000 to $34,999 | 11 (10.1%) | 4 (22.2%) |
| $35,000 to $49,999 | 7 (6.4%) | 2 (11.1%) |
| $50,000 to $74,999 | 18 (16.5%) | 2 (11.1%) |
| $75,000 to $99,999 | 21 (19.3%) | 0 (0.0%) |
| $100,000 to $149,999 | 14 (12.8%) | 0 (0.0%) |
| $150,000 or more | 3 (2.8%) | 0 (0.0%) |
| Total | 109 (100.0%) | 18 (100.0%) |
Monthly Housing Cost Tiers in Harpers Ferry
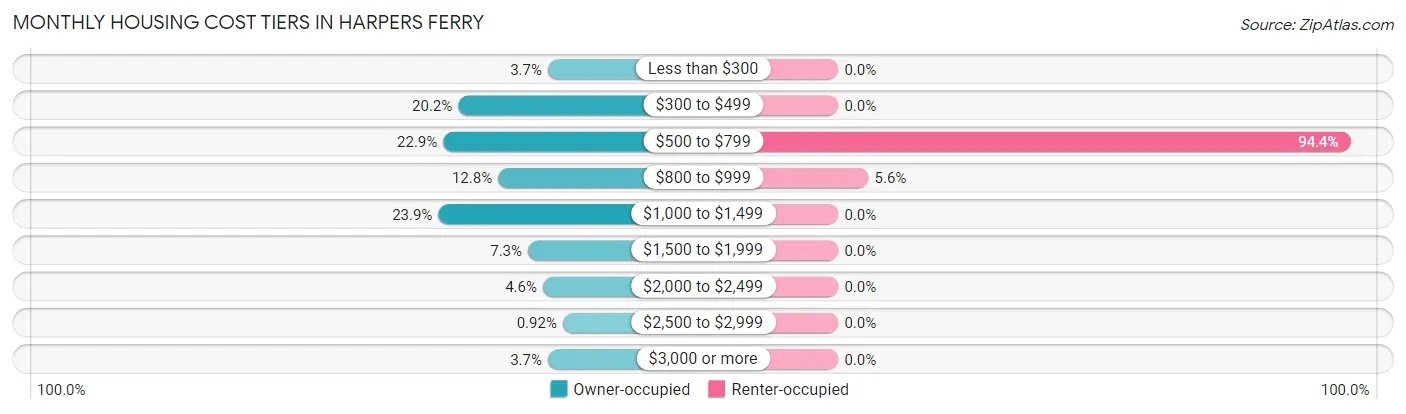
| Monthly Cost | Owner-occupied | Renter-occupied |
| Less than $300 | 4 (3.7%) | 0 (0.0%) |
| $300 to $499 | 22 (20.2%) | 0 (0.0%) |
| $500 to $799 | 25 (22.9%) | 17 (94.4%) |
| $800 to $999 | 14 (12.8%) | 1 (5.6%) |
| $1,000 to $1,499 | 26 (23.8%) | 0 (0.0%) |
| $1,500 to $1,999 | 8 (7.3%) | 0 (0.0%) |
| $2,000 to $2,499 | 5 (4.6%) | 0 (0.0%) |
| $2,500 to $2,999 | 1 (0.9%) | 0 (0.0%) |
| $3,000 or more | 4 (3.7%) | 0 (0.0%) |
| Total | 109 (100.0%) | 18 (100.0%) |
Physical Housing Characteristics in Harpers Ferry
Housing Structures in Harpers Ferry
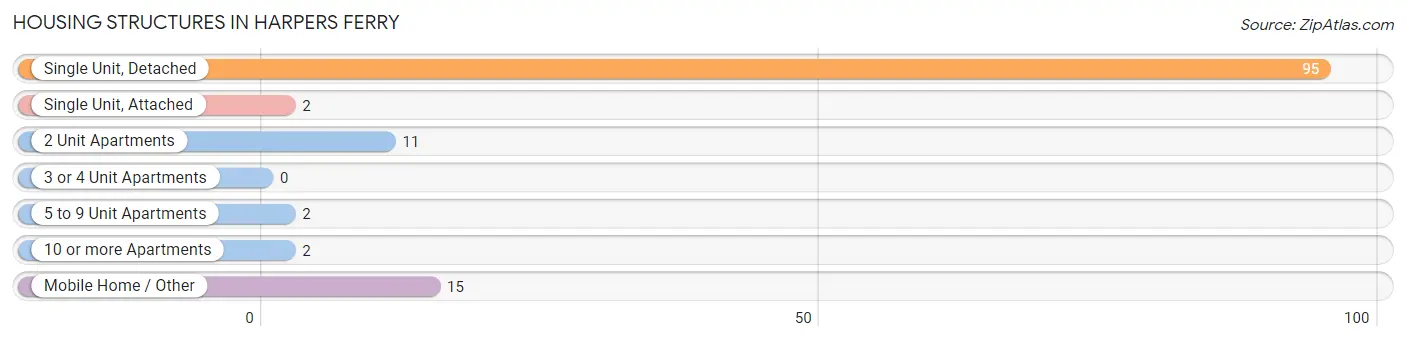
| Structure Type | # Housing Units | % Housing Units |
| Single Unit, Detached | 95 | 74.8% |
| Single Unit, Attached | 2 | 1.6% |
| 2 Unit Apartments | 11 | 8.7% |
| 3 or 4 Unit Apartments | 0 | 0.0% |
| 5 to 9 Unit Apartments | 2 | 1.6% |
| 10 or more Apartments | 2 | 1.6% |
| Mobile Home / Other | 15 | 11.8% |
| Total | 127 | 100.0% |
Housing Structures by Occupancy in Harpers Ferry
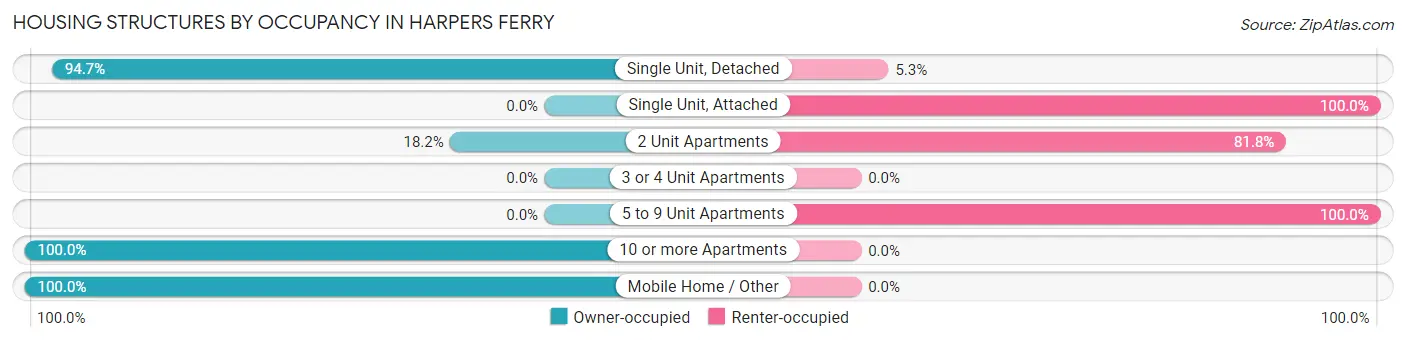
| Structure Type | Owner-occupied | Renter-occupied |
| Single Unit, Detached | 90 (94.7%) | 5 (5.3%) |
| Single Unit, Attached | 0 (0.0%) | 2 (100.0%) |
| 2 Unit Apartments | 2 (18.2%) | 9 (81.8%) |
| 3 or 4 Unit Apartments | 0 (0.0%) | 0 (0.0%) |
| 5 to 9 Unit Apartments | 0 (0.0%) | 2 (100.0%) |
| 10 or more Apartments | 2 (100.0%) | 0 (0.0%) |
| Mobile Home / Other | 15 (100.0%) | 0 (0.0%) |
| Total | 109 (85.8%) | 18 (14.2%) |
Housing Structures by Number of Rooms in Harpers Ferry
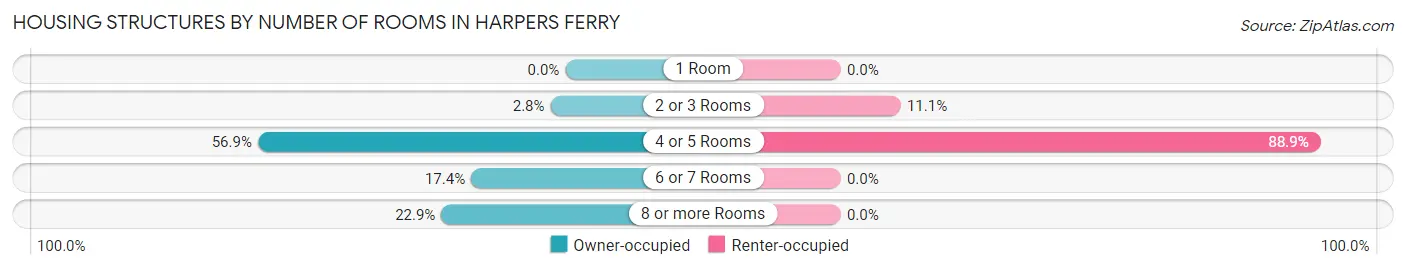
| Number of Rooms | Owner-occupied | Renter-occupied |
| 1 Room | 0 (0.0%) | 0 (0.0%) |
| 2 or 3 Rooms | 3 (2.8%) | 2 (11.1%) |
| 4 or 5 Rooms | 62 (56.9%) | 16 (88.9%) |
| 6 or 7 Rooms | 19 (17.4%) | 0 (0.0%) |
| 8 or more Rooms | 25 (22.9%) | 0 (0.0%) |
| Total | 109 (100.0%) | 18 (100.0%) |
Housing Structure by Heating Type in Harpers Ferry
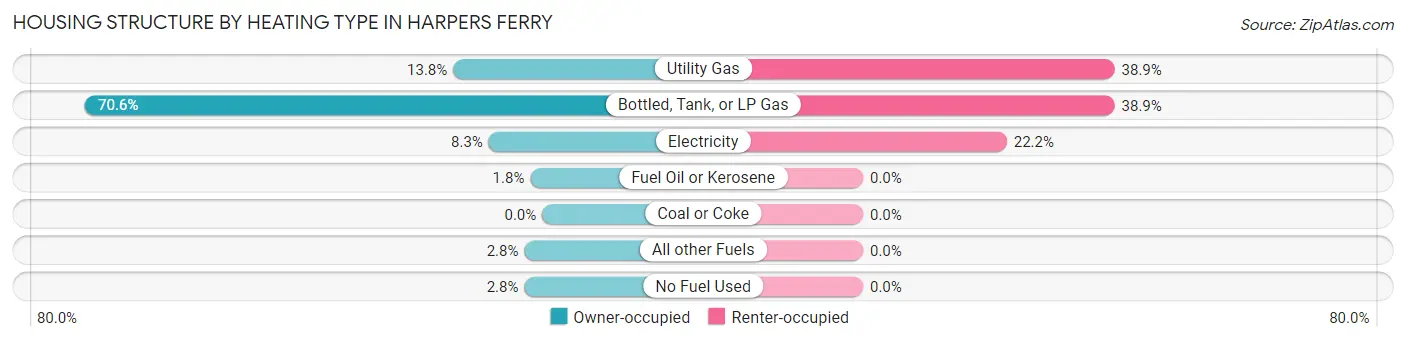
| Heating Type | Owner-occupied | Renter-occupied |
| Utility Gas | 15 (13.8%) | 7 (38.9%) |
| Bottled, Tank, or LP Gas | 77 (70.6%) | 7 (38.9%) |
| Electricity | 9 (8.3%) | 4 (22.2%) |
| Fuel Oil or Kerosene | 2 (1.8%) | 0 (0.0%) |
| Coal or Coke | 0 (0.0%) | 0 (0.0%) |
| All other Fuels | 3 (2.8%) | 0 (0.0%) |
| No Fuel Used | 3 (2.8%) | 0 (0.0%) |
| Total | 109 (100.0%) | 18 (100.0%) |
Household Vehicle Usage in Harpers Ferry
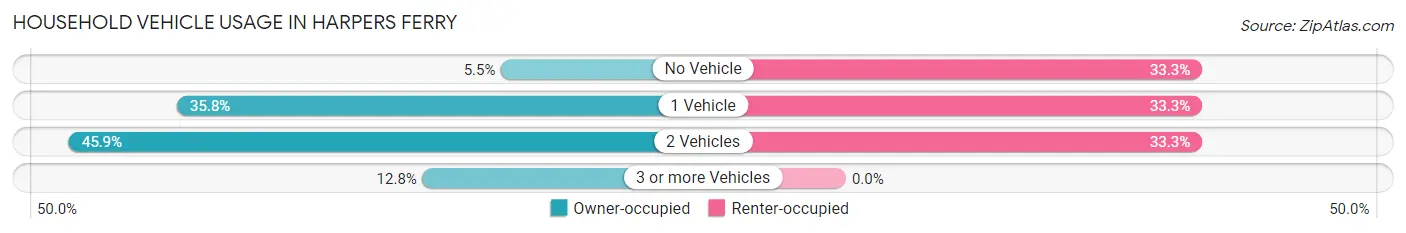
| Vehicles per Household | Owner-occupied | Renter-occupied |
| No Vehicle | 6 (5.5%) | 6 (33.3%) |
| 1 Vehicle | 39 (35.8%) | 6 (33.3%) |
| 2 Vehicles | 50 (45.9%) | 6 (33.3%) |
| 3 or more Vehicles | 14 (12.8%) | 0 (0.0%) |
| Total | 109 (100.0%) | 18 (100.0%) |
Real Estate & Mortgages in Harpers Ferry
Real Estate and Mortgage Overview in Harpers Ferry
| Characteristic | Without Mortgage | With Mortgage |
| Housing Units | 49 | 60 |
| Median Property Value | $124,300 | $171,200 |
| Median Household Income | $28,750 | $3 |
| Monthly Housing Costs | $470 | $4 |
| Real Estate Taxes | $1,859 | $0 |
Property Value by Mortgage Status in Harpers Ferry
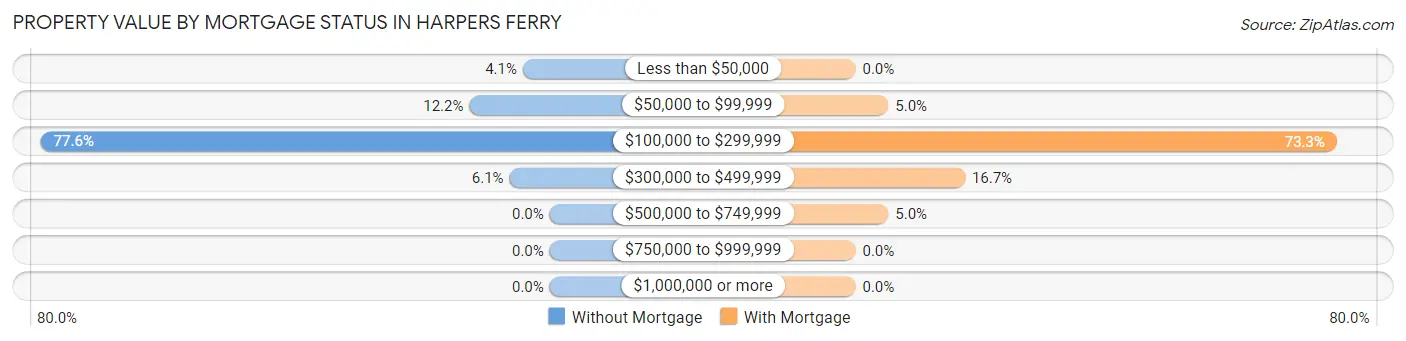
| Property Value | Without Mortgage | With Mortgage |
| Less than $50,000 | 2 (4.1%) | 0 (0.0%) |
| $50,000 to $99,999 | 6 (12.2%) | 3 (5.0%) |
| $100,000 to $299,999 | 38 (77.5%) | 44 (73.3%) |
| $300,000 to $499,999 | 3 (6.1%) | 10 (16.7%) |
| $500,000 to $749,999 | 0 (0.0%) | 3 (5.0%) |
| $750,000 to $999,999 | 0 (0.0%) | 0 (0.0%) |
| $1,000,000 or more | 0 (0.0%) | 0 (0.0%) |
| Total | 49 (100.0%) | 60 (100.0%) |
Household Income by Mortgage Status in Harpers Ferry
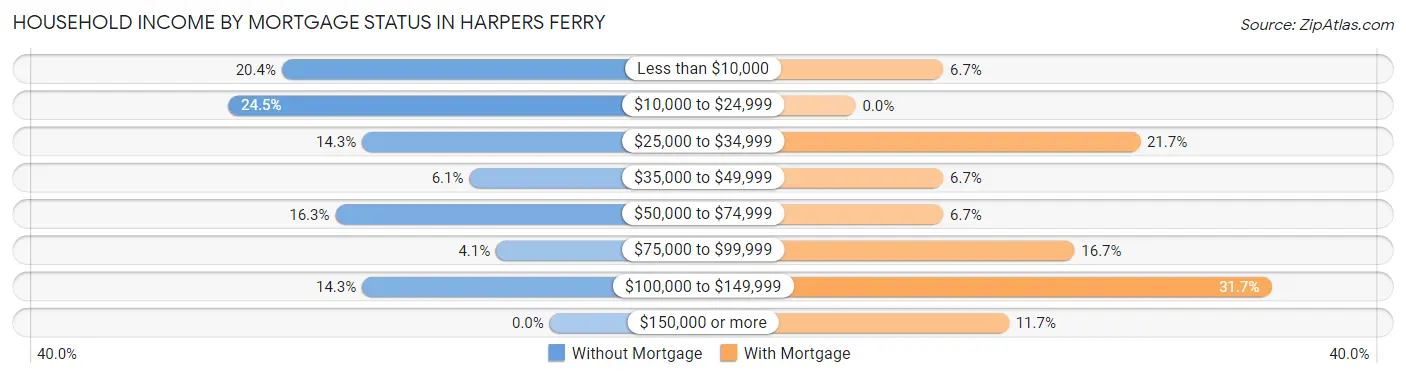
| Household Income | Without Mortgage | With Mortgage |
| Less than $10,000 | 10 (20.4%) | 4 (6.7%) |
| $10,000 to $24,999 | 12 (24.5%) | 0 (0.0%) |
| $25,000 to $34,999 | 7 (14.3%) | 13 (21.7%) |
| $35,000 to $49,999 | 3 (6.1%) | 4 (6.7%) |
| $50,000 to $74,999 | 8 (16.3%) | 4 (6.7%) |
| $75,000 to $99,999 | 2 (4.1%) | 10 (16.7%) |
| $100,000 to $149,999 | 7 (14.3%) | 19 (31.7%) |
| $150,000 or more | 0 (0.0%) | 7 (11.7%) |
| Total | 49 (100.0%) | 60 (100.0%) |
Property Value to Household Income Ratio in Harpers Ferry
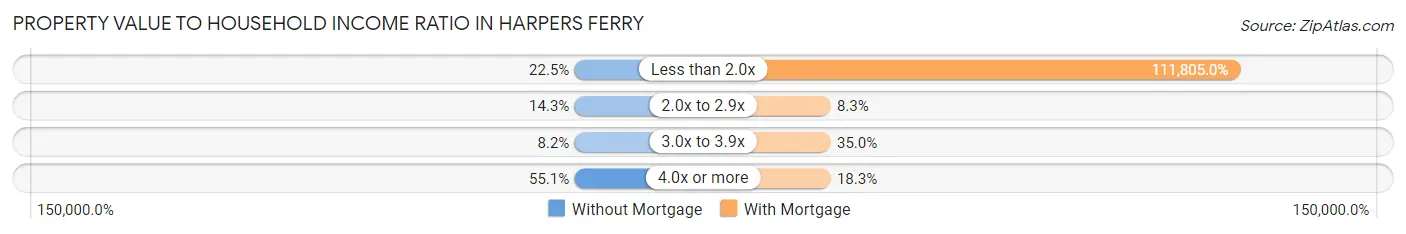
| Value-to-Income Ratio | Without Mortgage | With Mortgage |
| Less than 2.0x | 11 (22.5%) | 67,083 (111,805.0%) |
| 2.0x to 2.9x | 7 (14.3%) | 5 (8.3%) |
| 3.0x to 3.9x | 4 (8.2%) | 21 (35.0%) |
| 4.0x or more | 27 (55.1%) | 11 (18.3%) |
| Total | 49 (100.0%) | 60 (100.0%) |
Real Estate Taxes by Mortgage Status in Harpers Ferry
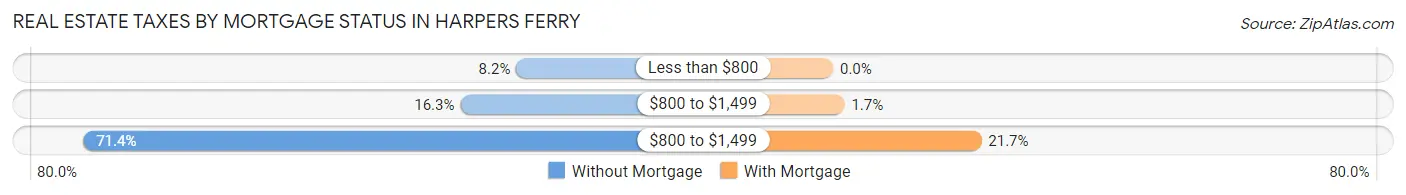
| Property Taxes | Without Mortgage | With Mortgage |
| Less than $800 | 4 (8.2%) | 0 (0.0%) |
| $800 to $1,499 | 8 (16.3%) | 1 (1.7%) |
| $800 to $1,499 | 35 (71.4%) | 13 (21.7%) |
| Total | 49 (100.0%) | 60 (100.0%) |
Health & Disability in Harpers Ferry
Health Insurance Coverage by Age in Harpers Ferry
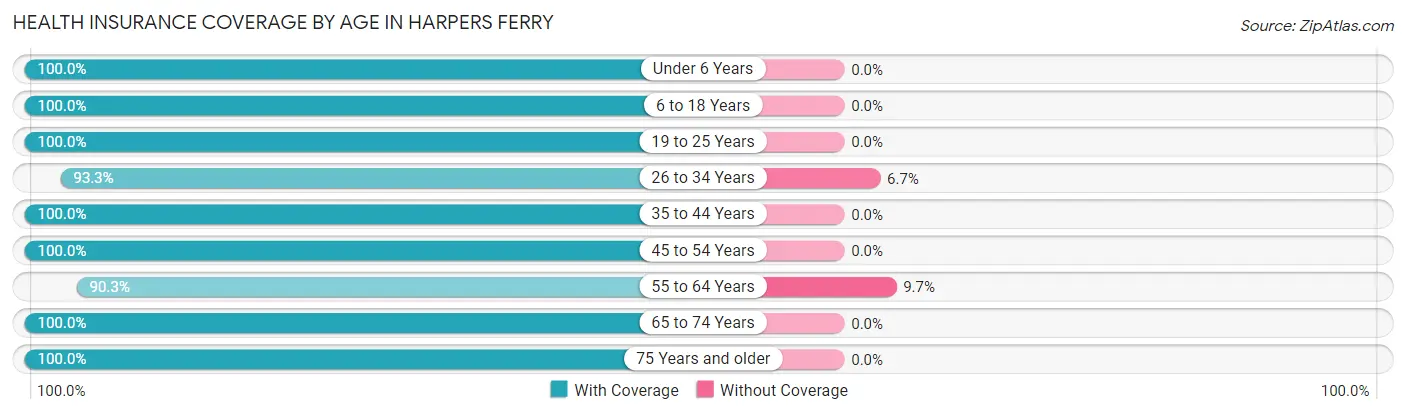
| Age Bracket | With Coverage | Without Coverage |
| Under 6 Years | 17 (100.0%) | 0 (0.0%) |
| 6 to 18 Years | 11 (100.0%) | 0 (0.0%) |
| 19 to 25 Years | 6 (100.0%) | 0 (0.0%) |
| 26 to 34 Years | 14 (93.3%) | 1 (6.7%) |
| 35 to 44 Years | 9 (100.0%) | 0 (0.0%) |
| 45 to 54 Years | 24 (100.0%) | 0 (0.0%) |
| 55 to 64 Years | 28 (90.3%) | 3 (9.7%) |
| 65 to 74 Years | 92 (100.0%) | 0 (0.0%) |
| 75 Years and older | 31 (100.0%) | 0 (0.0%) |
| Total | 232 (98.3%) | 4 (1.7%) |
Health Insurance Coverage by Citizenship Status in Harpers Ferry
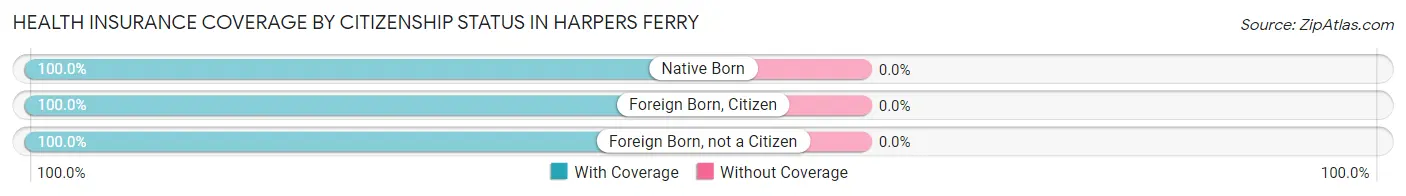
| Citizenship Status | With Coverage | Without Coverage |
| Native Born | 17 (100.0%) | 0 (0.0%) |
| Foreign Born, Citizen | 11 (100.0%) | 0 (0.0%) |
| Foreign Born, not a Citizen | 6 (100.0%) | 0 (0.0%) |
Health Insurance Coverage by Household Income in Harpers Ferry
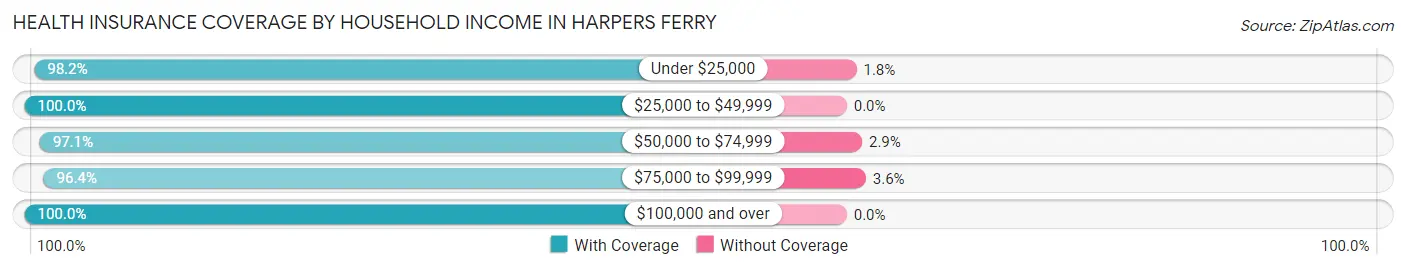
| Household Income | With Coverage | Without Coverage |
| Under $25,000 | 54 (98.2%) | 1 (1.8%) |
| $25,000 to $49,999 | 44 (100.0%) | 0 (0.0%) |
| $50,000 to $74,999 | 34 (97.1%) | 1 (2.9%) |
| $75,000 to $99,999 | 54 (96.4%) | 2 (3.6%) |
| $100,000 and over | 46 (100.0%) | 0 (0.0%) |
Public vs Private Health Insurance Coverage by Age in Harpers Ferry
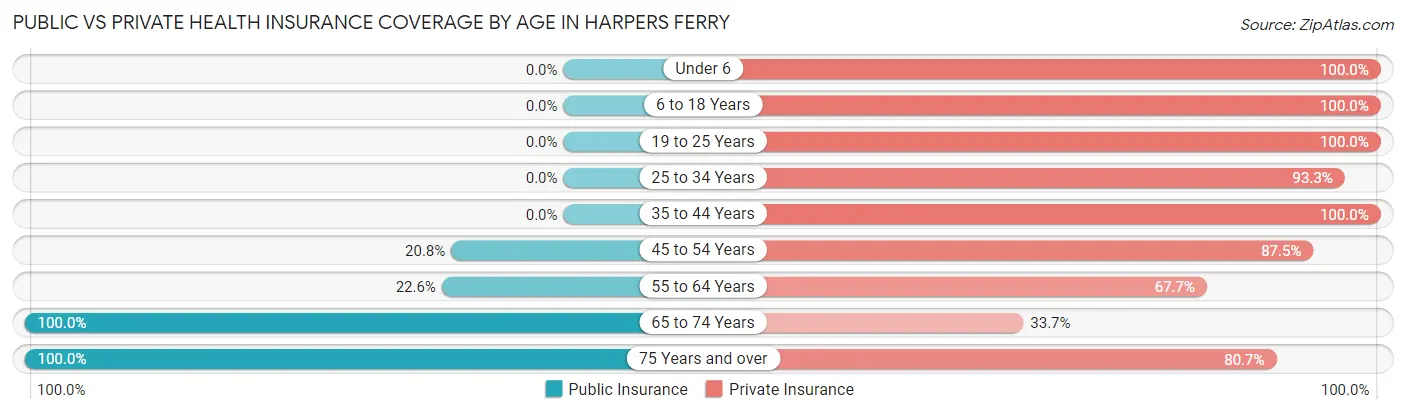
| Age Bracket | Public Insurance | Private Insurance |
| Under 6 | 0 (0.0%) | 17 (100.0%) |
| 6 to 18 Years | 0 (0.0%) | 11 (100.0%) |
| 19 to 25 Years | 0 (0.0%) | 6 (100.0%) |
| 25 to 34 Years | 0 (0.0%) | 14 (93.3%) |
| 35 to 44 Years | 0 (0.0%) | 9 (100.0%) |
| 45 to 54 Years | 5 (20.8%) | 21 (87.5%) |
| 55 to 64 Years | 7 (22.6%) | 21 (67.7%) |
| 65 to 74 Years | 92 (100.0%) | 31 (33.7%) |
| 75 Years and over | 31 (100.0%) | 25 (80.6%) |
| Total | 135 (57.2%) | 155 (65.7%) |
Disability Status by Sex by Age in Harpers Ferry
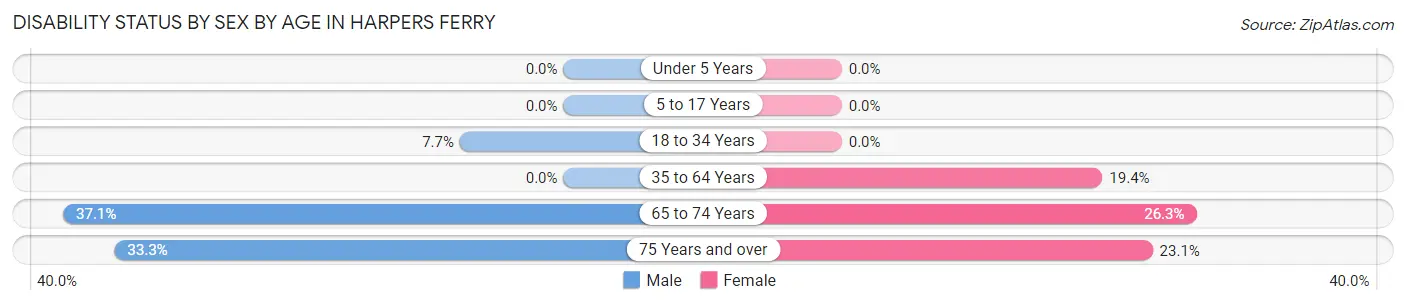
| Age Bracket | Male | Female |
| Under 5 Years | 0 (0.0%) | 0 (0.0%) |
| 5 to 17 Years | 0 (0.0%) | 0 (0.0%) |
| 18 to 34 Years | 1 (7.7%) | 0 (0.0%) |
| 35 to 64 Years | 0 (0.0%) | 6 (19.4%) |
| 65 to 74 Years | 13 (37.1%) | 15 (26.3%) |
| 75 Years and over | 6 (33.3%) | 3 (23.1%) |
Disability Class by Sex by Age in Harpers Ferry
Disability Class: Hearing Difficulty
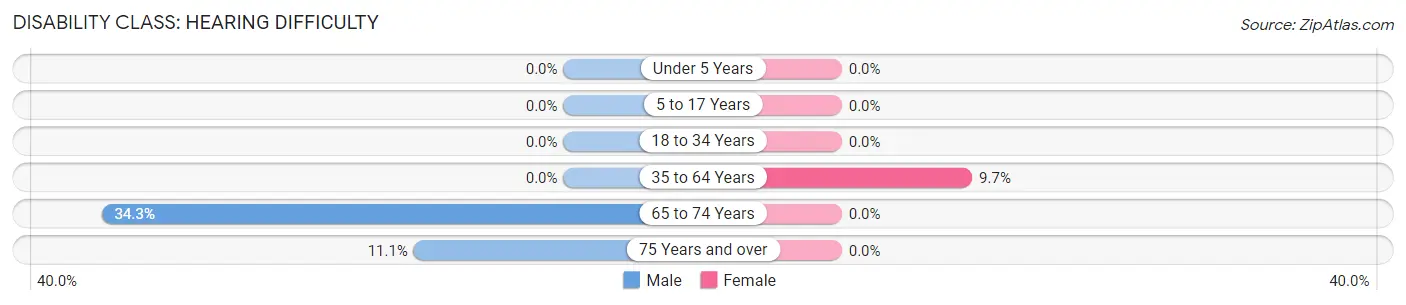
| Age Bracket | Male | Female |
| Under 5 Years | 0 (0.0%) | 0 (0.0%) |
| 5 to 17 Years | 0 (0.0%) | 0 (0.0%) |
| 18 to 34 Years | 0 (0.0%) | 0 (0.0%) |
| 35 to 64 Years | 0 (0.0%) | 3 (9.7%) |
| 65 to 74 Years | 12 (34.3%) | 0 (0.0%) |
| 75 Years and over | 2 (11.1%) | 0 (0.0%) |
Disability Class: Vision Difficulty
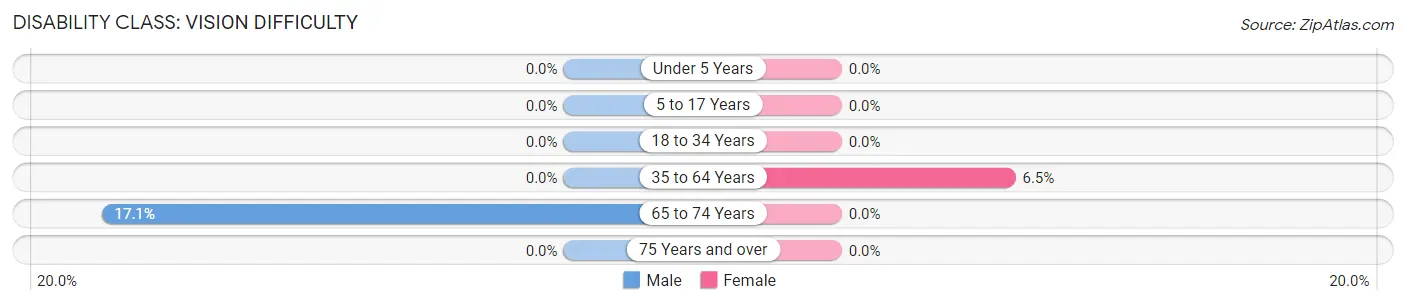
| Age Bracket | Male | Female |
| Under 5 Years | 0 (0.0%) | 0 (0.0%) |
| 5 to 17 Years | 0 (0.0%) | 0 (0.0%) |
| 18 to 34 Years | 0 (0.0%) | 0 (0.0%) |
| 35 to 64 Years | 0 (0.0%) | 2 (6.5%) |
| 65 to 74 Years | 6 (17.1%) | 0 (0.0%) |
| 75 Years and over | 0 (0.0%) | 0 (0.0%) |
Disability Class: Cognitive Difficulty
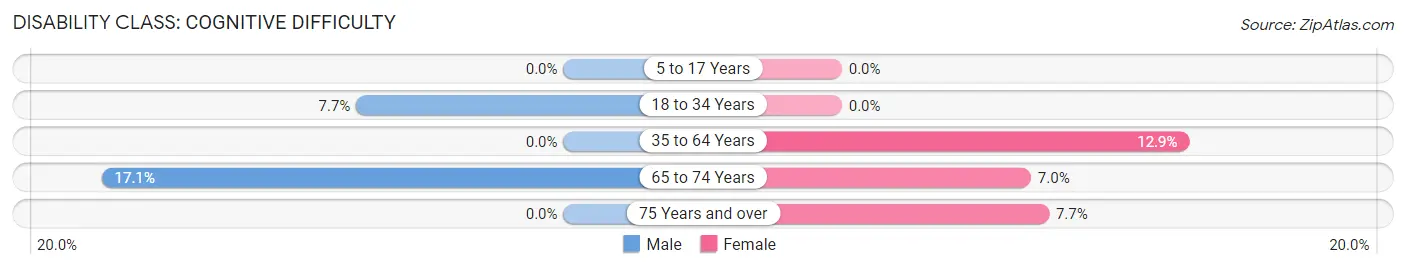
| Age Bracket | Male | Female |
| 5 to 17 Years | 0 (0.0%) | 0 (0.0%) |
| 18 to 34 Years | 1 (7.7%) | 0 (0.0%) |
| 35 to 64 Years | 0 (0.0%) | 4 (12.9%) |
| 65 to 74 Years | 6 (17.1%) | 4 (7.0%) |
| 75 Years and over | 0 (0.0%) | 1 (7.7%) |
Disability Class: Ambulatory Difficulty
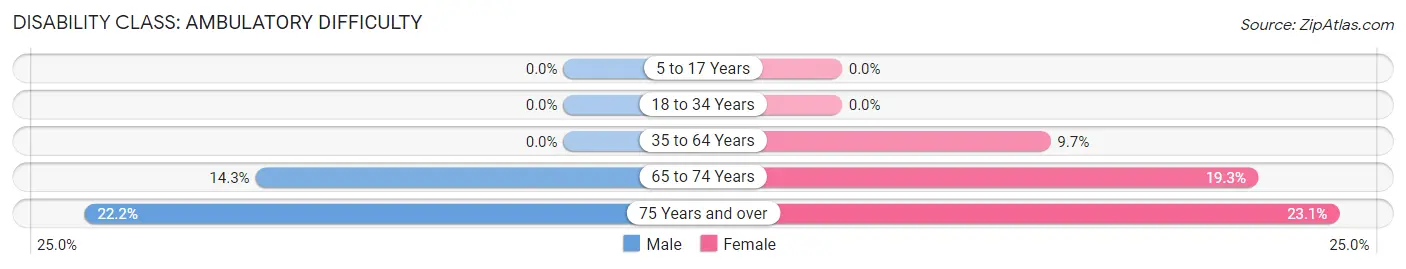
| Age Bracket | Male | Female |
| 5 to 17 Years | 0 (0.0%) | 0 (0.0%) |
| 18 to 34 Years | 0 (0.0%) | 0 (0.0%) |
| 35 to 64 Years | 0 (0.0%) | 3 (9.7%) |
| 65 to 74 Years | 5 (14.3%) | 11 (19.3%) |
| 75 Years and over | 4 (22.2%) | 3 (23.1%) |
Disability Class: Self-Care Difficulty
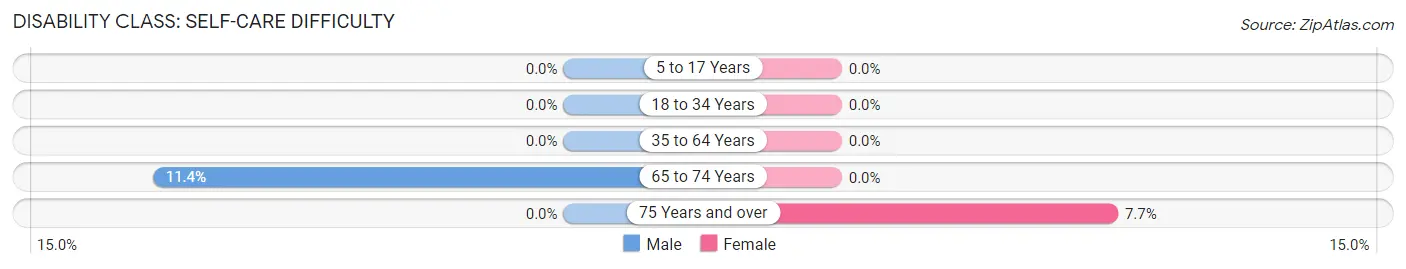
| Age Bracket | Male | Female |
| 5 to 17 Years | 0 (0.0%) | 0 (0.0%) |
| 18 to 34 Years | 0 (0.0%) | 0 (0.0%) |
| 35 to 64 Years | 0 (0.0%) | 0 (0.0%) |
| 65 to 74 Years | 4 (11.4%) | 0 (0.0%) |
| 75 Years and over | 0 (0.0%) | 1 (7.7%) |
Technology Access in Harpers Ferry
Computing Device Access in Harpers Ferry
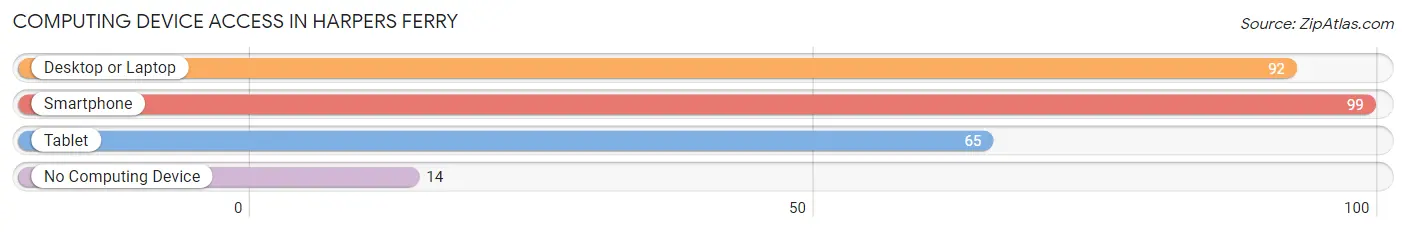
| Device Type | # Households | % Households |
| Desktop or Laptop | 92 | 72.4% |
| Smartphone | 99 | 77.9% |
| Tablet | 65 | 51.2% |
| No Computing Device | 14 | 11.0% |
| Total | 127 | 100.0% |
Internet Access in Harpers Ferry
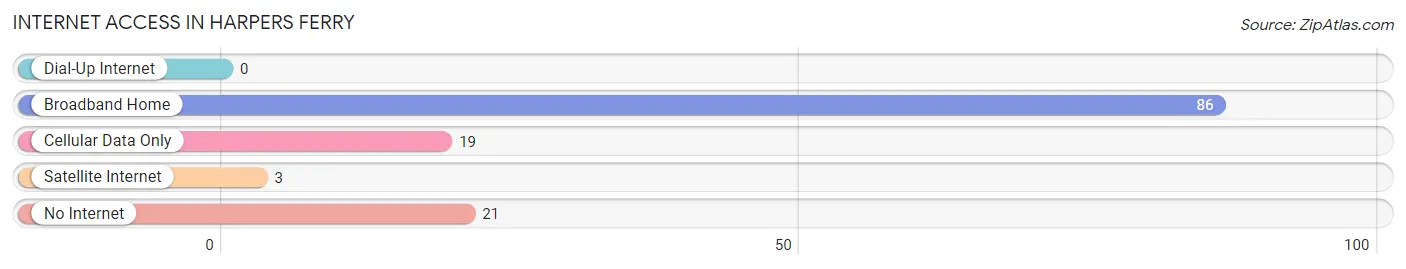
| Internet Type | # Households | % Households |
| Dial-Up Internet | 0 | 0.0% |
| Broadband Home | 86 | 67.7% |
| Cellular Data Only | 19 | 15.0% |
| Satellite Internet | 3 | 2.4% |
| No Internet | 21 | 16.5% |
| Total | 127 | 100.0% |
Harpers Ferry Summary
Harpers Ferry, Iowa is a small town located in the northeast corner of the state, along the Mississippi River. It is part of Allamakee County and is the county seat. The town was founded in 1837 and named after the nearby Harpers Ferry, Virginia. The town has a population of just over 500 people and is known for its historic buildings, scenic views, and outdoor recreation opportunities.
Geography
Harpers Ferry is located in the northeast corner of Iowa, along the Mississippi River. It is part of Allamakee County and is the county seat. The town is situated on a bluff overlooking the river and is surrounded by rolling hills and wooded areas. The town is located about 20 miles south of La Crosse, Wisconsin and about 40 miles north of Dubuque, Iowa.
The town is located in a temperate climate zone, with hot summers and cold winters. The average temperature in the summer is around 75 degrees Fahrenheit, while the average temperature in the winter is around 25 degrees Fahrenheit. The town receives an average of 40 inches of precipitation per year, with most of it falling in the spring and summer months.
Economy
Harpers Ferry’s economy is largely based on tourism and agriculture. The town is home to several historic buildings, including the Harpers Ferry National Historic Park, which is a popular tourist destination. The town also has several wineries, breweries, and distilleries, which attract visitors from all over the region.
Agriculture is also an important part of the local economy. The town is home to several farms, which produce a variety of crops, including corn, soybeans, and hay. The town also has several livestock farms, which produce beef, pork, and poultry.
Demographics
As of the 2010 census, the population of Harpers Ferry was 514 people. The town is predominantly white, with 95.3% of the population identifying as white. The remaining 4.7% of the population is made up of African Americans, Native Americans, Asians, and other races.
The median household income in Harpers Ferry is $45,000, which is slightly lower than the national average. The median age of the population is 44.7 years, which is slightly higher than the national average. The town has a higher than average poverty rate, with 17.3% of the population living below the poverty line.
Conclusion
Harpers Ferry, Iowa is a small town located in the northeast corner of the state, along the Mississippi River. It is part of Allamakee County and is the county seat. The town was founded in 1837 and has a population of just over 500 people. The town is known for its historic buildings, scenic views, and outdoor recreation opportunities. The town’s economy is largely based on tourism and agriculture, and the population is predominantly white. The median household income in Harpers Ferry is slightly lower than the national average, and the town has a higher than average poverty rate.
Common Questions
What is Per Capita Income in Harpers Ferry?
Per Capita income in Harpers Ferry is $30,228.
What is the Median Family Income in Harpers Ferry?
Median Family Income in Harpers Ferry is $67,917.
What is the Median Household income in Harpers Ferry?
Median Household Income in Harpers Ferry is $38,750.
What is Inequality or Gini Index in Harpers Ferry?
Inequality or Gini Index in Harpers Ferry is 0.44.
What is the Total Population of Harpers Ferry?
Total Population of Harpers Ferry is 236.
What is the Total Male Population of Harpers Ferry?
Total Male Population of Harpers Ferry is 120.
What is the Total Female Population of Harpers Ferry?
Total Female Population of Harpers Ferry is 116.
What is the Ratio of Males per 100 Females in Harpers Ferry?
There are 103.45 Males per 100 Females in Harpers Ferry.
What is the Ratio of Females per 100 Males in Harpers Ferry?
There are 96.67 Females per 100 Males in Harpers Ferry.
What is the Median Population Age in Harpers Ferry?
Median Population Age in Harpers Ferry is 65.3 Years.
What is the Average Family Size in Harpers Ferry
Average Family Size in Harpers Ferry is 2.5 People.
What is the Average Household Size in Harpers Ferry
Average Household Size in Harpers Ferry is 1.9 People.
How Large is the Labor Force in Harpers Ferry?
There are 103 People in the Labor Forcein in Harpers Ferry.
What is the Percentage of People in the Labor Force in Harpers Ferry?
48.8% of People are in the Labor Force in Harpers Ferry.
What is the Unemployment Rate in Harpers Ferry?
Unemployment Rate in Harpers Ferry is 1.0%.