Farmington, IA Map & Demographics
Farmington Map
Farmington Overview
$28,565
PER CAPITA INCOME
$67,917
AVG FAMILY INCOME
$55,625
AVG HOUSEHOLD INCOME
47.5%
WAGE / INCOME GAP [ % ]
52.5¢/ $1
WAGE / INCOME GAP [ $ ]
0.36
INEQUALITY / GINI INDEX
506
TOTAL POPULATION
263
MALE POPULATION
243
FEMALE POPULATION
108.23
MALES / 100 FEMALES
92.40
FEMALES / 100 MALES
48.3
MEDIAN AGE
3.1
AVG FAMILY SIZE
2.0
AVG HOUSEHOLD SIZE
230
LABOR FORCE [ PEOPLE ]
54.9%
PERCENT IN LABOR FORCE
2.6%
UNEMPLOYMENT RATE
Farmington Zip Codes
Farmington Area Codes
Income in Farmington
Income Overview in Farmington
Per Capita Income in Farmington is $28,565, while median incomes of families and households are $67,917 and $55,625 respectively.
| Characteristic | Number | Measure |
| Per Capita Income | 506 | $28,565 |
| Median Family Income | 111 | $67,917 |
| Mean Family Income | 111 | $72,089 |
| Median Household Income | 247 | $55,625 |
| Mean Household Income | 247 | $58,470 |
| Income Deficit | 111 | $0 |
| Wage / Income Gap (%) | 506 | 47.46% |
| Wage / Income Gap ($) | 506 | 52.54¢ per $1 |
| Gini / Inequality Index | 506 | 0.36 |
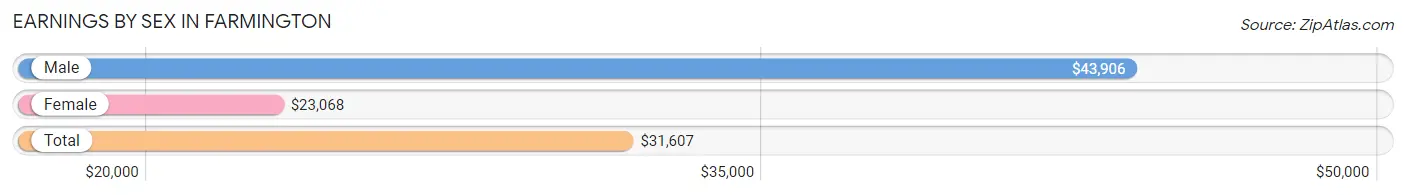
Earnings by Sex in Farmington
Average Earnings in Farmington are $31,607, $43,906 for men and $23,068 for women, a difference of 47.5%.
| Sex | Number | Average Earnings |
| Male | 137 (53.1%) | $43,906 |
| Female | 121 (46.9%) | $23,068 |
| Total | 258 (100.0%) | $31,607 |
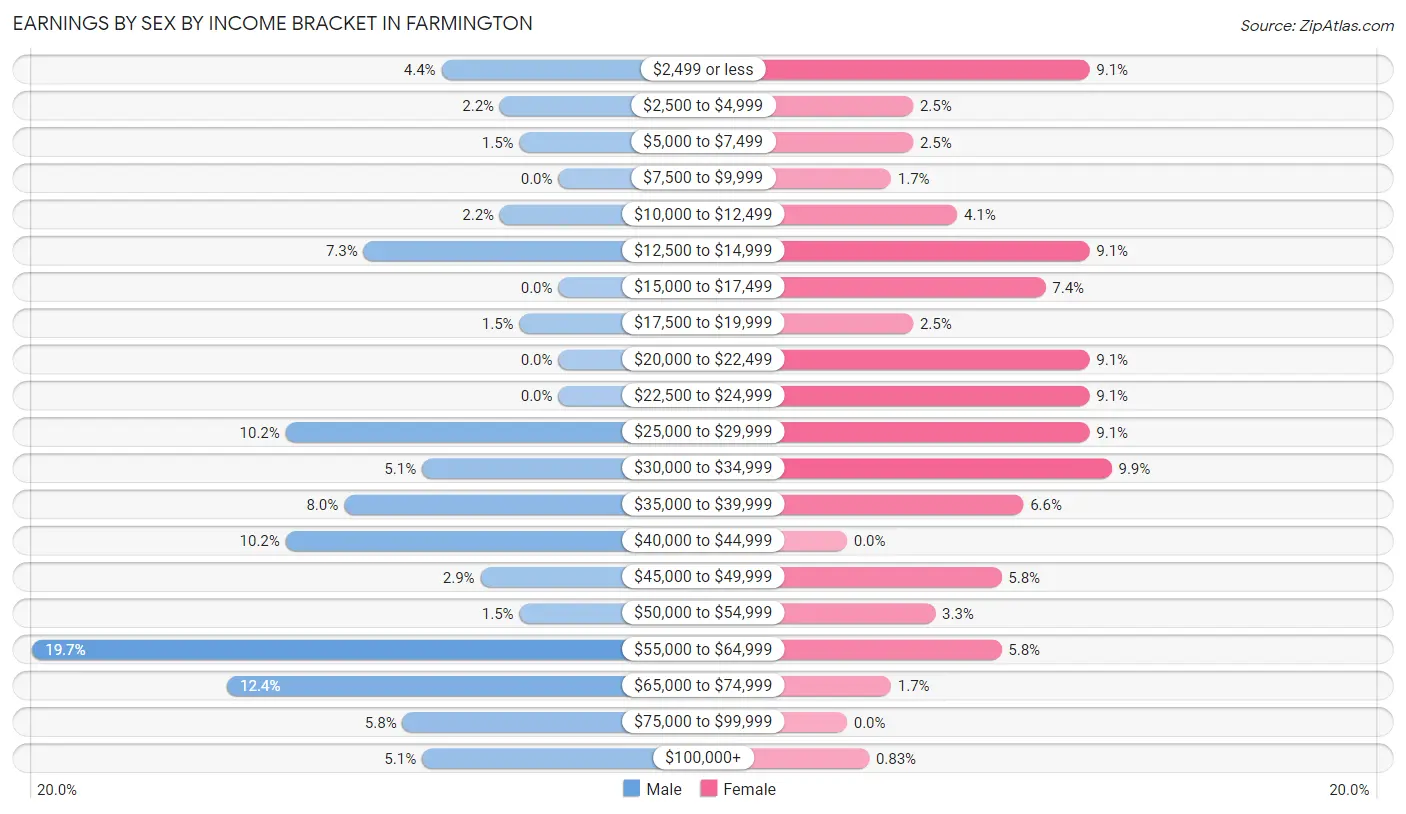
Earnings by Sex by Income Bracket in Farmington
The most common earnings brackets in Farmington are $55,000 to $64,999 for men (27 | 19.7%) and $30,000 to $34,999 for women (12 | 9.9%).
| Income | Male | Female |
| $2,499 or less | 6 (4.4%) | 11 (9.1%) |
| $2,500 to $4,999 | 3 (2.2%) | 3 (2.5%) |
| $5,000 to $7,499 | 2 (1.5%) | 3 (2.5%) |
| $7,500 to $9,999 | 0 (0.0%) | 2 (1.7%) |
| $10,000 to $12,499 | 3 (2.2%) | 5 (4.1%) |
| $12,500 to $14,999 | 10 (7.3%) | 11 (9.1%) |
| $15,000 to $17,499 | 0 (0.0%) | 9 (7.4%) |
| $17,500 to $19,999 | 2 (1.5%) | 3 (2.5%) |
| $20,000 to $22,499 | 0 (0.0%) | 11 (9.1%) |
| $22,500 to $24,999 | 0 (0.0%) | 11 (9.1%) |
| $25,000 to $29,999 | 14 (10.2%) | 11 (9.1%) |
| $30,000 to $34,999 | 7 (5.1%) | 12 (9.9%) |
| $35,000 to $39,999 | 11 (8.0%) | 8 (6.6%) |
| $40,000 to $44,999 | 14 (10.2%) | 0 (0.0%) |
| $45,000 to $49,999 | 4 (2.9%) | 7 (5.8%) |
| $50,000 to $54,999 | 2 (1.5%) | 4 (3.3%) |
| $55,000 to $64,999 | 27 (19.7%) | 7 (5.8%) |
| $65,000 to $74,999 | 17 (12.4%) | 2 (1.7%) |
| $75,000 to $99,999 | 8 (5.8%) | 0 (0.0%) |
| $100,000+ | 7 (5.1%) | 1 (0.8%) |
| Total | 137 (100.0%) | 121 (100.0%) |
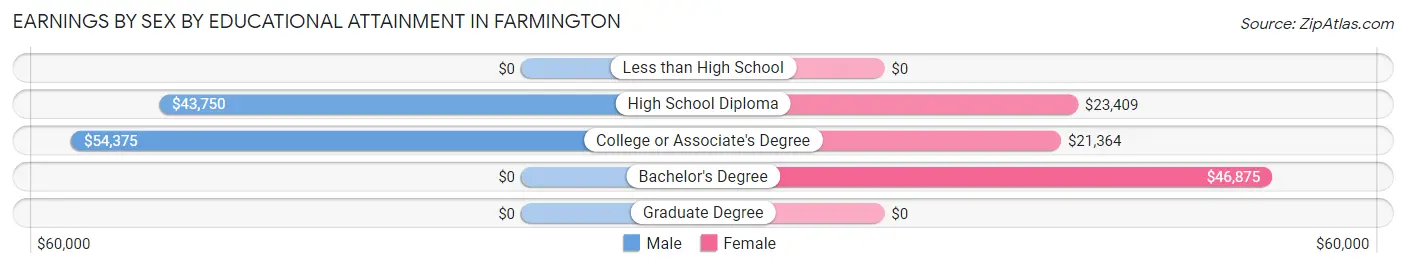
Earnings by Sex by Educational Attainment in Farmington
Average earnings in Farmington are $45,000 for men and $24,773 for women, a difference of 45.0%. Men with an educational attainment of college or associate's degree enjoy the highest average annual earnings of $54,375, while those with high school diploma education earn the least with $43,750. Women with an educational attainment of bachelor's degree earn the most with the average annual earnings of $46,875, while those with college or associate's degree education have the smallest earnings of $21,364.
| Educational Attainment | Male Income | Female Income |
| Less than High School | - | - |
| High School Diploma | $43,750 | $23,409 |
| College or Associate's Degree | $54,375 | $21,364 |
| Bachelor's Degree | - | - |
| Graduate Degree | - | - |
| Total | $45,000 | $24,773 |
Family Income in Farmington
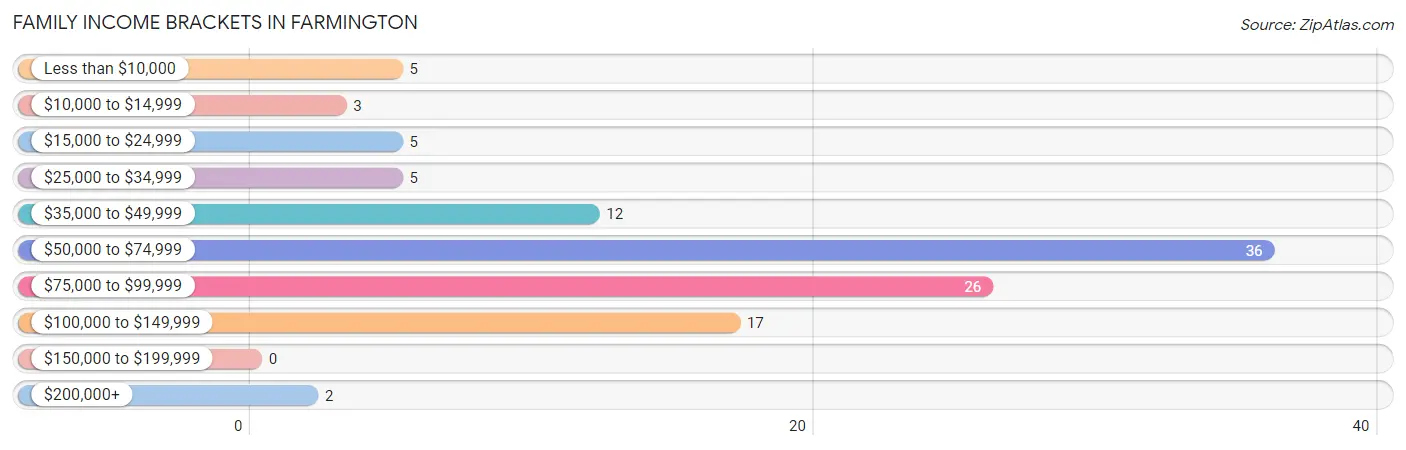
Family Income Brackets in Farmington
According to the Farmington family income data, there are 36 families falling into the $50,000 to $74,999 income range, which is the most common income bracket and makes up 32.4% of all families.
| Income Bracket | # Families | % Families |
| Less than $10,000 | 5 | 4.5% |
| $10,000 to $14,999 | 3 | 2.7% |
| $15,000 to $24,999 | 5 | 4.5% |
| $25,000 to $34,999 | 5 | 4.5% |
| $35,000 to $49,999 | 12 | 10.8% |
| $50,000 to $74,999 | 36 | 32.4% |
| $75,000 to $99,999 | 26 | 23.4% |
| $100,000 to $149,999 | 17 | 15.3% |
| $150,000 to $199,999 | 0 | 0.0% |
| $200,000+ | 2 | 1.8% |
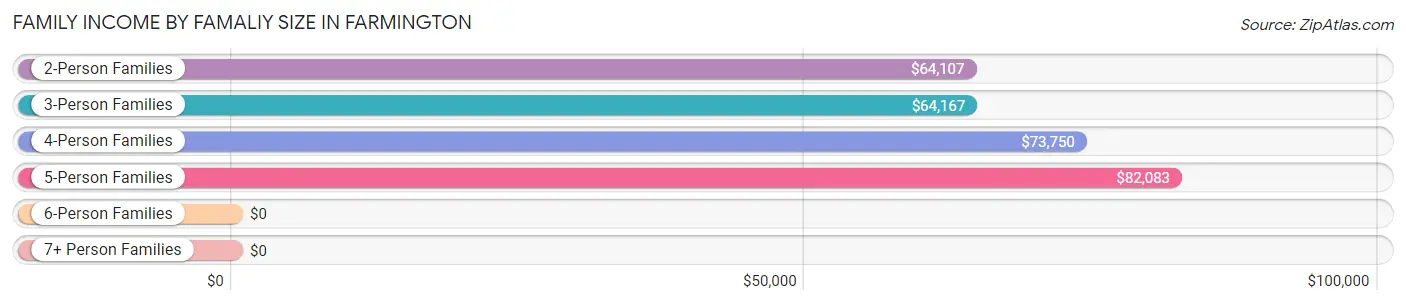
Family Income by Famaliy Size in Farmington
5-person families (19 | 17.1%) account for the highest median family income in Farmington with $82,083 per family, while 2-person families (57 | 51.3%) have the highest median income of $32,054 per family member.
| Income Bracket | # Families | Median Income |
| 2-Person Families | 57 (51.3%) | $64,107 |
| 3-Person Families | 16 (14.4%) | $64,167 |
| 4-Person Families | 16 (14.4%) | $73,750 |
| 5-Person Families | 19 (17.1%) | $82,083 |
| 6-Person Families | 3 (2.7%) | $0 |
| 7+ Person Families | 0 (0.0%) | $0 |
| Total | 111 (100.0%) | $67,917 |
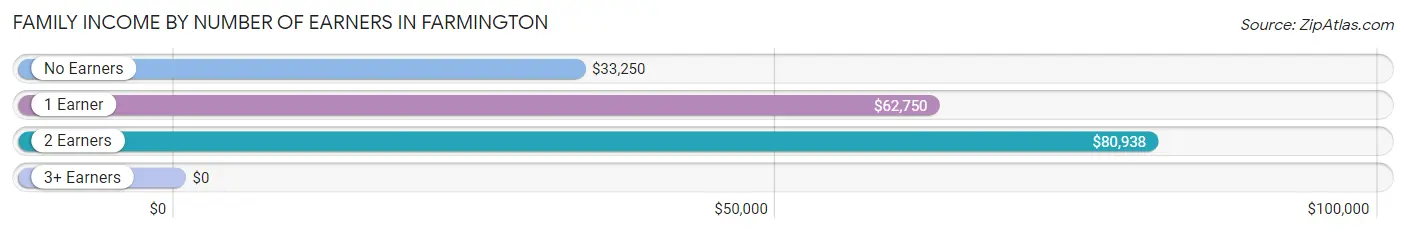
Family Income by Number of Earners in Farmington
| Number of Earners | # Families | Median Income |
| No Earners | 17 (15.3%) | $33,250 |
| 1 Earner | 23 (20.7%) | $62,750 |
| 2 Earners | 59 (53.1%) | $80,938 |
| 3+ Earners | 12 (10.8%) | $0 |
| Total | 111 (100.0%) | $67,917 |
Household Income in Farmington
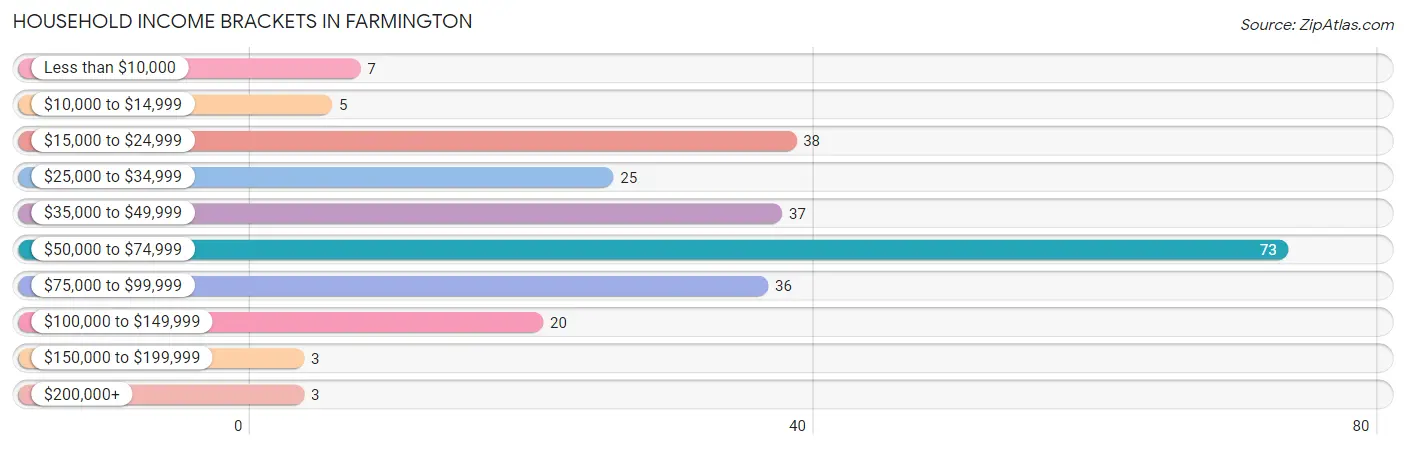
Household Income Brackets in Farmington
With 73 households falling in the category, the $50,000 to $74,999 income range is the most frequent in Farmington, accounting for 29.5% of all households. In contrast, only 3 households (1.2%) fall into the $150,000 to $199,999 income bracket, making it the least populous group.
| Income Bracket | # Households | % Households |
| Less than $10,000 | 7 | 2.8% |
| $10,000 to $14,999 | 5 | 2.0% |
| $15,000 to $24,999 | 38 | 15.4% |
| $25,000 to $34,999 | 25 | 10.1% |
| $35,000 to $49,999 | 37 | 15.0% |
| $50,000 to $74,999 | 73 | 29.6% |
| $75,000 to $99,999 | 36 | 14.6% |
| $100,000 to $149,999 | 20 | 8.1% |
| $150,000 to $199,999 | 3 | 1.2% |
| $200,000+ | 3 | 1.2% |
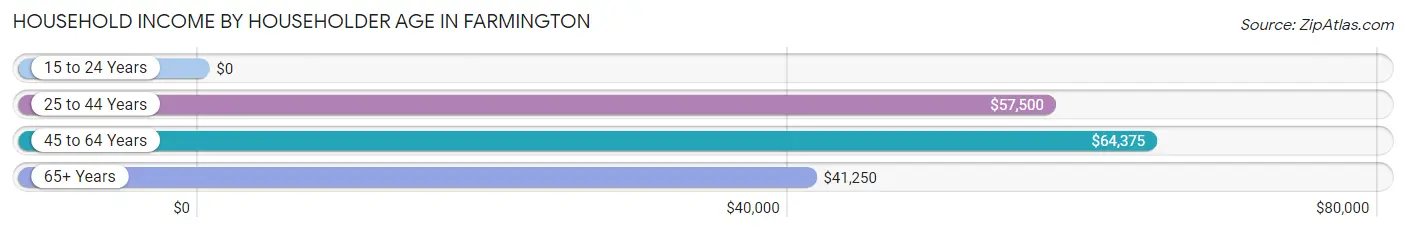
Household Income by Householder Age in Farmington
The median household income in Farmington is $55,625, with the highest median household income of $64,375 found in the 45 to 64 years age bracket for the primary householder. A total of 105 households (42.5%) fall into this category.
| Income Bracket | # Households | Median Income |
| 15 to 24 Years | 0 (0.0%) | $0 |
| 25 to 44 Years | 62 (25.1%) | $57,500 |
| 45 to 64 Years | 105 (42.5%) | $64,375 |
| 65+ Years | 80 (32.4%) | $41,250 |
| Total | 247 (100.0%) | $55,625 |
Poverty in Farmington
Income Below Poverty by Sex and Age in Farmington
With 6.8% poverty level for males and 12.3% for females among the residents of Farmington, 5 year old males and 25 to 34 year old females are the most vulnerable to poverty, with 1 males (100.0%) and 6 females (37.5%) in their respective age groups living below the poverty level.
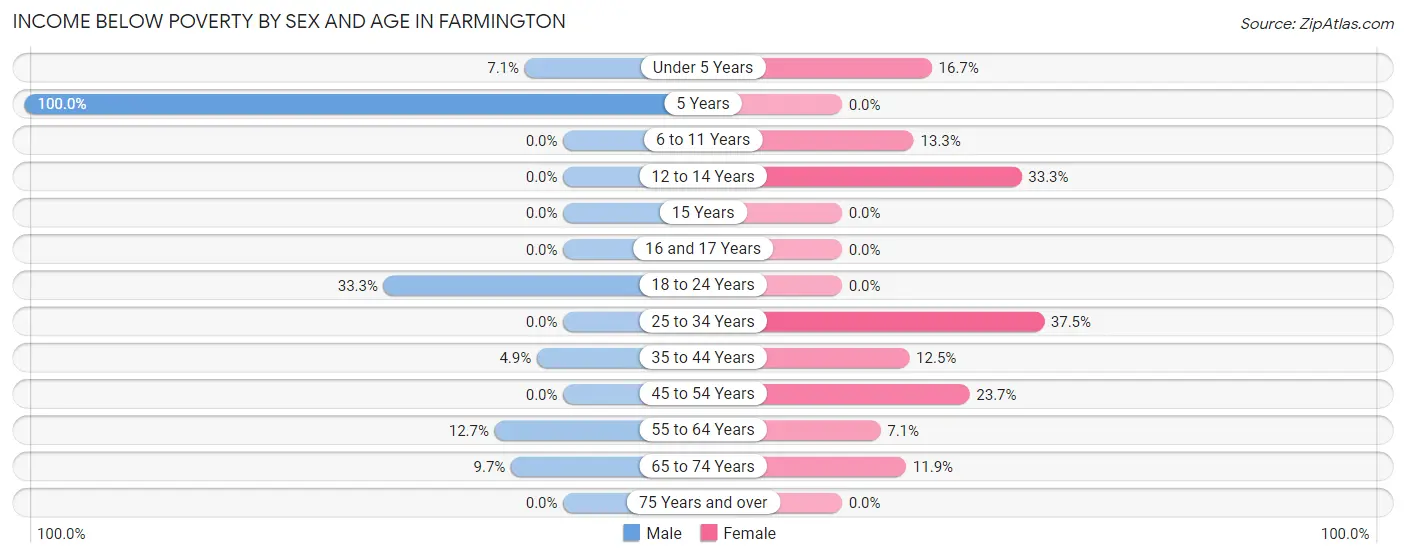
| Age Bracket | Male | Female |
| Under 5 Years | 1 (7.1%) | 1 (16.7%) |
| 5 Years | 1 (100.0%) | 0 (0.0%) |
| 6 to 11 Years | 0 (0.0%) | 2 (13.3%) |
| 12 to 14 Years | 0 (0.0%) | 2 (33.3%) |
| 15 Years | 0 (0.0%) | 0 (0.0%) |
| 16 and 17 Years | 0 (0.0%) | 0 (0.0%) |
| 18 to 24 Years | 4 (33.3%) | 0 (0.0%) |
| 25 to 34 Years | 0 (0.0%) | 6 (37.5%) |
| 35 to 44 Years | 2 (4.9%) | 2 (12.5%) |
| 45 to 54 Years | 0 (0.0%) | 9 (23.7%) |
| 55 to 64 Years | 7 (12.7%) | 3 (7.1%) |
| 65 to 74 Years | 3 (9.7%) | 5 (11.9%) |
| 75 Years and over | 0 (0.0%) | 0 (0.0%) |
| Total | 18 (6.8%) | 30 (12.3%) |
Income Above Poverty by Sex and Age in Farmington
According to the poverty statistics in Farmington, males aged 6 to 11 years and females aged 5 years are the age groups that are most secure financially, with 100.0% of males and 100.0% of females in these age groups living above the poverty line.
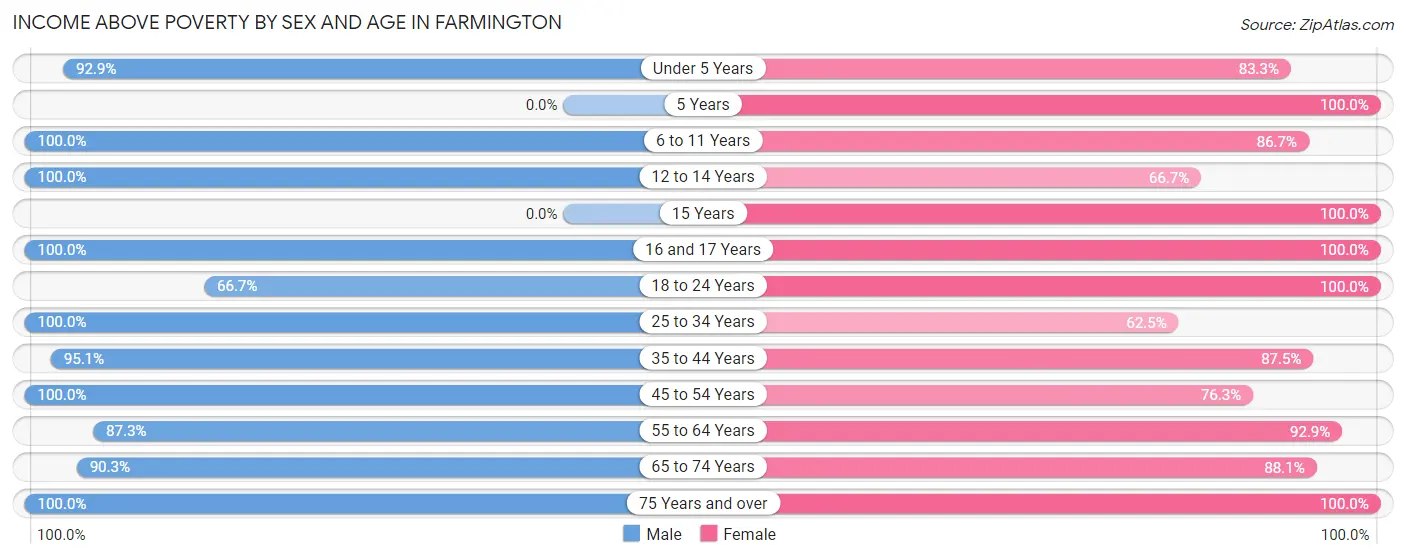
| Age Bracket | Male | Female |
| Under 5 Years | 13 (92.9%) | 5 (83.3%) |
| 5 Years | 0 (0.0%) | 2 (100.0%) |
| 6 to 11 Years | 22 (100.0%) | 13 (86.7%) |
| 12 to 14 Years | 17 (100.0%) | 4 (66.7%) |
| 15 Years | 0 (0.0%) | 4 (100.0%) |
| 16 and 17 Years | 3 (100.0%) | 17 (100.0%) |
| 18 to 24 Years | 8 (66.7%) | 21 (100.0%) |
| 25 to 34 Years | 21 (100.0%) | 10 (62.5%) |
| 35 to 44 Years | 39 (95.1%) | 14 (87.5%) |
| 45 to 54 Years | 38 (100.0%) | 29 (76.3%) |
| 55 to 64 Years | 48 (87.3%) | 39 (92.9%) |
| 65 to 74 Years | 28 (90.3%) | 37 (88.1%) |
| 75 Years and over | 8 (100.0%) | 18 (100.0%) |
| Total | 245 (93.2%) | 213 (87.6%) |
Income Below Poverty Among Married-Couple Families in Farmington
The poverty statistics for married-couple families in Farmington show that 3.6% or 3 of the total 84 families live below the poverty line. Families with no children have the highest poverty rate of 5.6%, comprising of 3 families. On the other hand, families with 1 or 2 children have the lowest poverty rate of 0.0%, which includes 0 families.
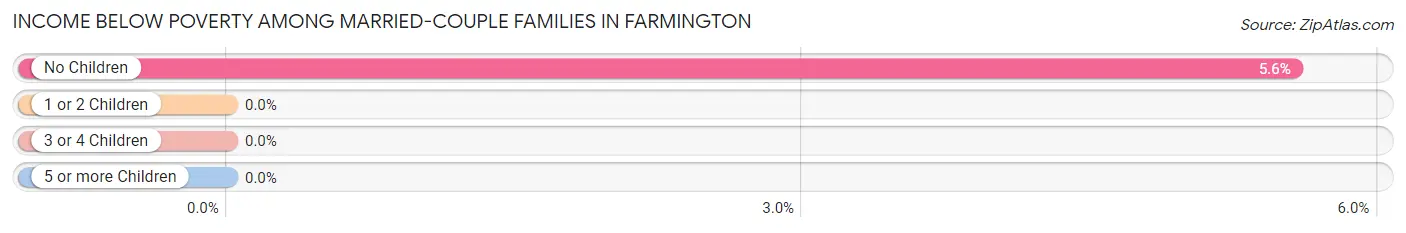
| Children | Above Poverty | Below Poverty |
| No Children | 51 (94.4%) | 3 (5.6%) |
| 1 or 2 Children | 18 (100.0%) | 0 (0.0%) |
| 3 or 4 Children | 12 (100.0%) | 0 (0.0%) |
| 5 or more Children | 0 (0.0%) | 0 (0.0%) |
| Total | 81 (96.4%) | 3 (3.6%) |
Income Below Poverty Among Single-Parent Households in Farmington
According to the poverty data in Farmington, 23.1% or 3 single-father households and 35.7% or 5 single-mother households are living below the poverty line. Among single-father households, those with no children have the highest poverty rate, with 3 households (100.0%) experiencing poverty. Likewise, among single-mother households, those with 5 or more children have the highest poverty rate, with 3 households (100.0%) falling below the poverty line.
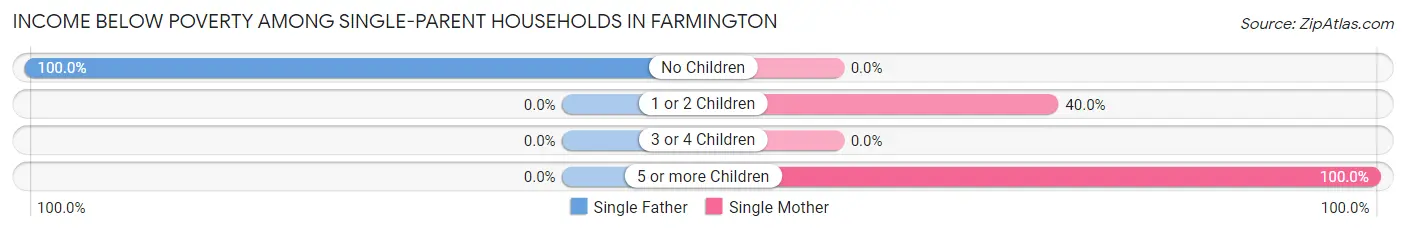
| Children | Single Father | Single Mother |
| No Children | 3 (100.0%) | 0 (0.0%) |
| 1 or 2 Children | 0 (0.0%) | 2 (40.0%) |
| 3 or 4 Children | 0 (0.0%) | 0 (0.0%) |
| 5 or more Children | 0 (0.0%) | 3 (100.0%) |
| Total | 3 (23.1%) | 5 (35.7%) |
Income Below Poverty Among Married-Couple vs Single-Parent Households in Farmington
The poverty data for Farmington shows that 3 of the married-couple family households (3.6%) and 8 of the single-parent households (29.6%) are living below the poverty level. Within the married-couple family households, those with no children have the highest poverty rate, with 3 households (5.6%) falling below the poverty line. Among the single-parent households, those with 5 or more children have the highest poverty rate, with 3 household (100.0%) living below poverty.
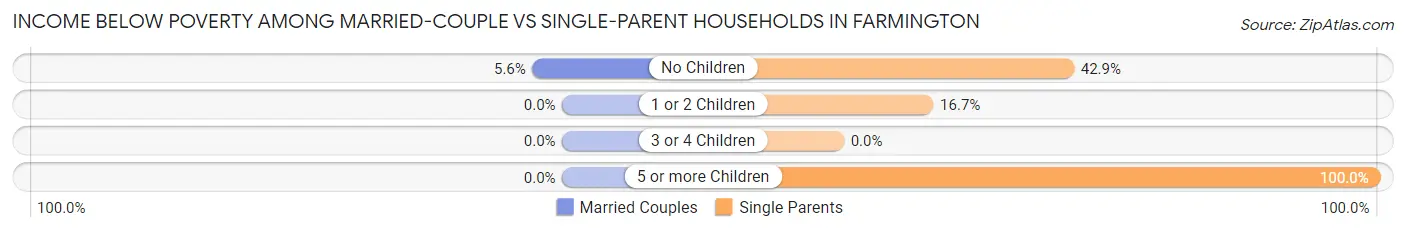
| Children | Married-Couple Families | Single-Parent Households |
| No Children | 3 (5.6%) | 3 (42.9%) |
| 1 or 2 Children | 0 (0.0%) | 2 (16.7%) |
| 3 or 4 Children | 0 (0.0%) | 0 (0.0%) |
| 5 or more Children | 0 (0.0%) | 3 (100.0%) |
| Total | 3 (3.6%) | 8 (29.6%) |
Race in Farmington
The most populous races in Farmington are White / Caucasian (478 | 94.5%), Two or more Races (12 | 2.4%), and Some other Race (10 | 2.0%).
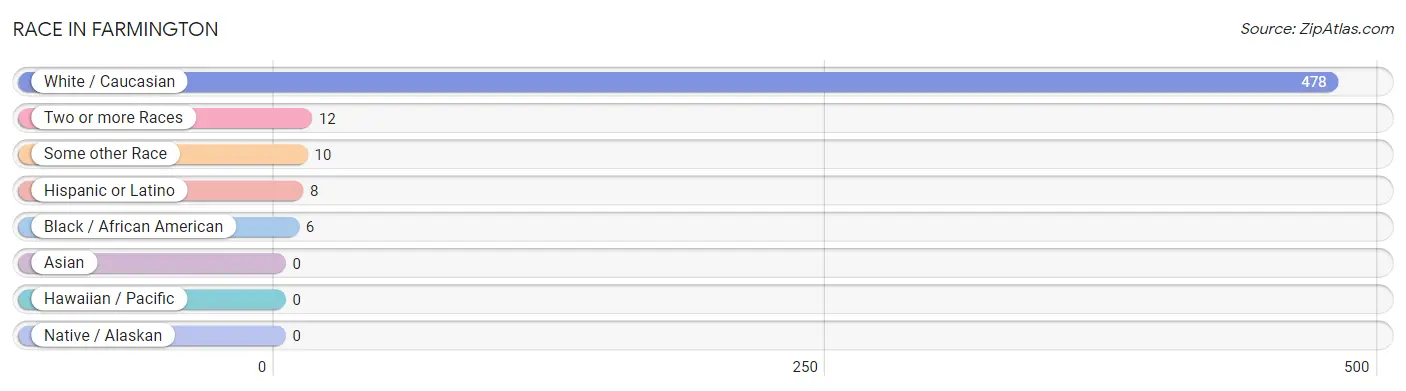
| Race | # Population | % Population |
| Asian | 0 | 0.0% |
| Black / African American | 6 | 1.2% |
| Hawaiian / Pacific | 0 | 0.0% |
| Hispanic or Latino | 8 | 1.6% |
| Native / Alaskan | 0 | 0.0% |
| White / Caucasian | 478 | 94.5% |
| Two or more Races | 12 | 2.4% |
| Some other Race | 10 | 2.0% |
| Total | 506 | 100.0% |
Ancestry in Farmington
The most populous ancestries reported in Farmington are German (188 | 37.1%), Irish (75 | 14.8%), Scottish (62 | 12.2%), English (33 | 6.5%), and Dutch (11 | 2.2%), together accounting for 72.9% of all Farmington residents.
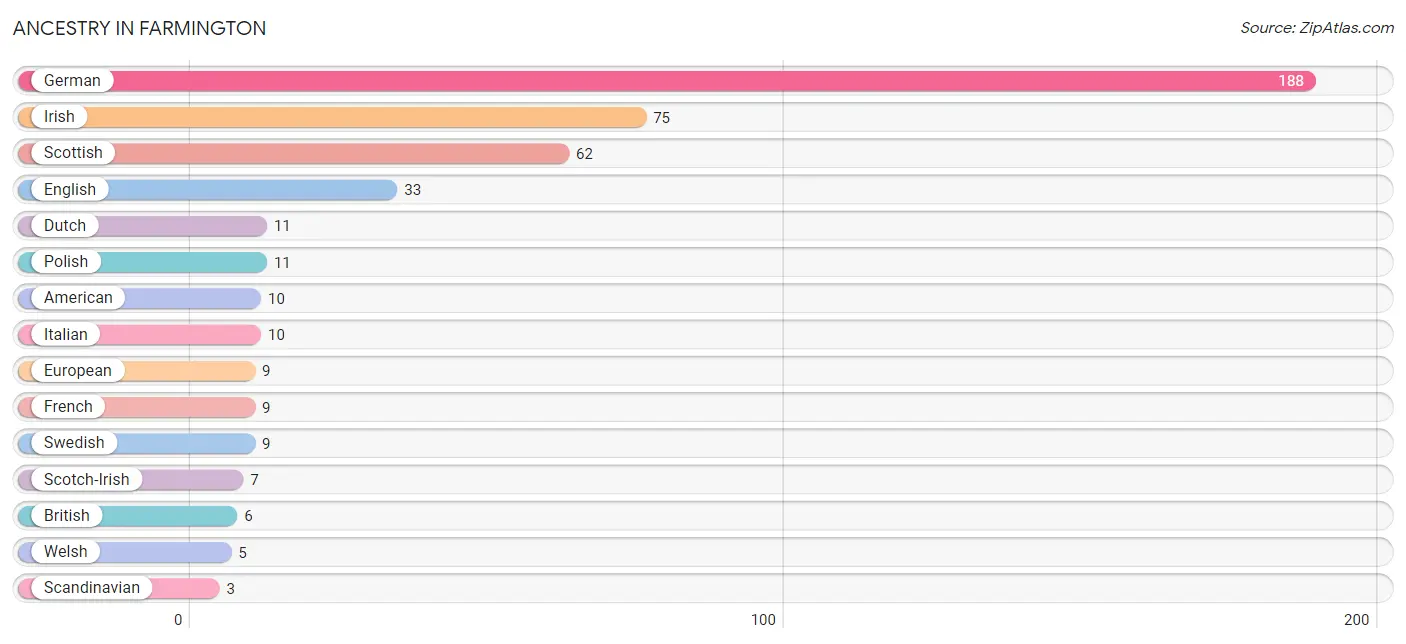
| Ancestry | # Population | % Population |
| American | 10 | 2.0% |
| British | 6 | 1.2% |
| Dutch | 11 | 2.2% |
| English | 33 | 6.5% |
| European | 9 | 1.8% |
| French | 9 | 1.8% |
| German | 188 | 37.1% |
| Irish | 75 | 14.8% |
| Italian | 10 | 2.0% |
| Polish | 11 | 2.2% |
| Scandinavian | 3 | 0.6% |
| Scotch-Irish | 7 | 1.4% |
| Scottish | 62 | 12.2% |
| Swedish | 9 | 1.8% |
| Welsh | 5 | 1.0% | View All 15 Rows |
Immigrants in Farmington
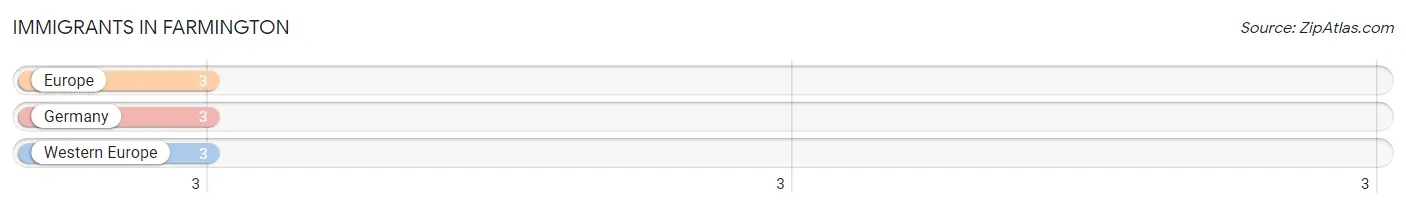
The most numerous immigrant groups reported in Farmington came from Europe (3 | 0.6%), Germany (3 | 0.6%), and Western Europe (3 | 0.6%), together accounting for 1.8% of all Farmington residents.
| Immigration Origin | # Population | % Population |
| Europe | 3 | 0.6% |
| Germany | 3 | 0.6% |
| Western Europe | 3 | 0.6% | View All 3 Rows |
Sex and Age in Farmington
Sex and Age in Farmington
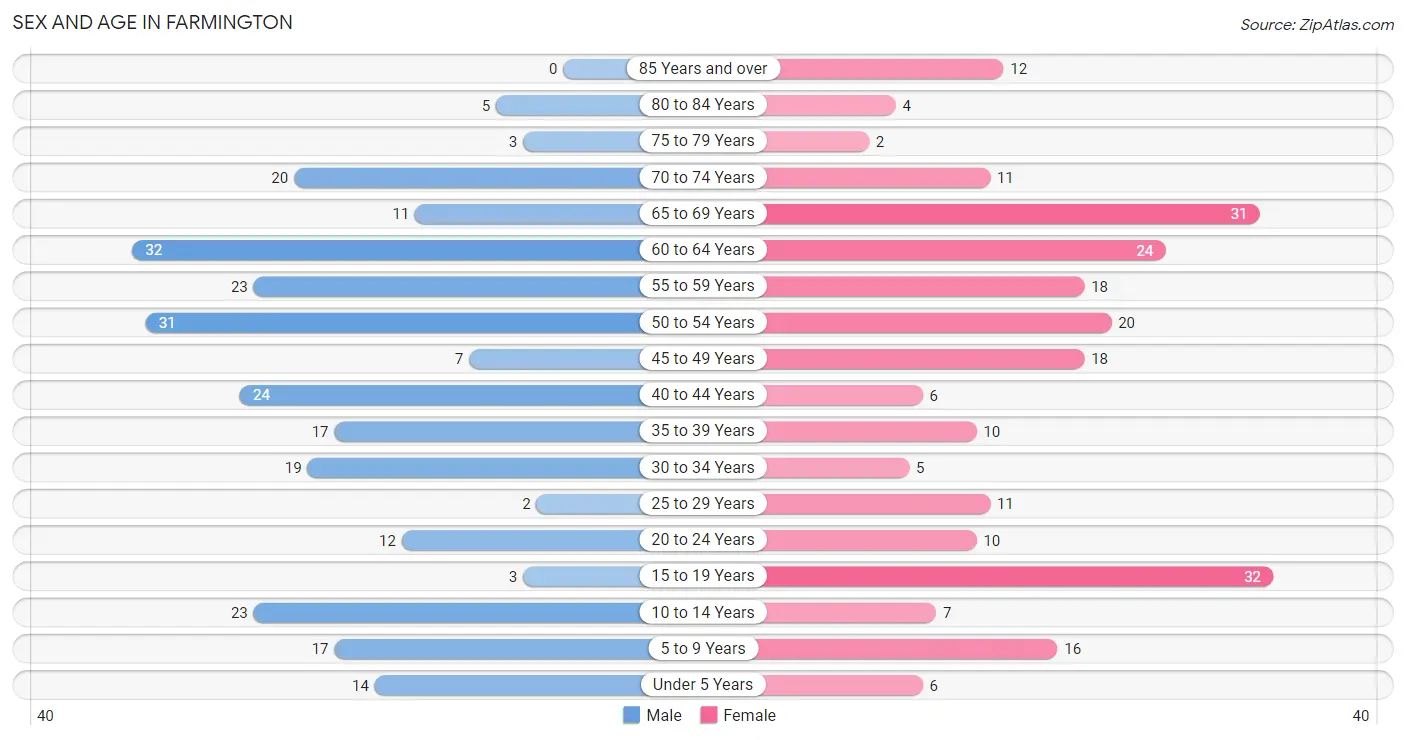
The most populous age groups in Farmington are 60 to 64 Years (32 | 12.2%) for men and 15 to 19 Years (32 | 13.2%) for women.
| Age Bracket | Male | Female |
| Under 5 Years | 14 (5.3%) | 6 (2.5%) |
| 5 to 9 Years | 17 (6.5%) | 16 (6.6%) |
| 10 to 14 Years | 23 (8.7%) | 7 (2.9%) |
| 15 to 19 Years | 3 (1.1%) | 32 (13.2%) |
| 20 to 24 Years | 12 (4.6%) | 10 (4.1%) |
| 25 to 29 Years | 2 (0.8%) | 11 (4.5%) |
| 30 to 34 Years | 19 (7.2%) | 5 (2.1%) |
| 35 to 39 Years | 17 (6.5%) | 10 (4.1%) |
| 40 to 44 Years | 24 (9.1%) | 6 (2.5%) |
| 45 to 49 Years | 7 (2.7%) | 18 (7.4%) |
| 50 to 54 Years | 31 (11.8%) | 20 (8.2%) |
| 55 to 59 Years | 23 (8.7%) | 18 (7.4%) |
| 60 to 64 Years | 32 (12.2%) | 24 (9.9%) |
| 65 to 69 Years | 11 (4.2%) | 31 (12.8%) |
| 70 to 74 Years | 20 (7.6%) | 11 (4.5%) |
| 75 to 79 Years | 3 (1.1%) | 2 (0.8%) |
| 80 to 84 Years | 5 (1.9%) | 4 (1.7%) |
| 85 Years and over | 0 (0.0%) | 12 (4.9%) |
| Total | 263 (100.0%) | 243 (100.0%) |
Families and Households in Farmington
Median Family Size in Farmington
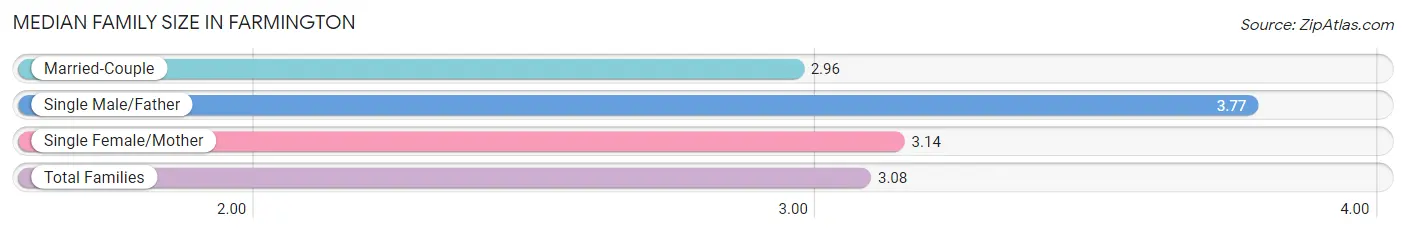
The median family size in Farmington is 3.08 persons per family, with single male/father families (13 | 11.7%) accounting for the largest median family size of 3.77 persons per family. On the other hand, married-couple families (84 | 75.7%) represent the smallest median family size with 2.96 persons per family.
| Family Type | # Families | Family Size |
| Married-Couple | 84 (75.7%) | 2.96 |
| Single Male/Father | 13 (11.7%) | 3.77 |
| Single Female/Mother | 14 (12.6%) | 3.14 |
| Total Families | 111 (100.0%) | 3.08 |
Median Household Size in Farmington
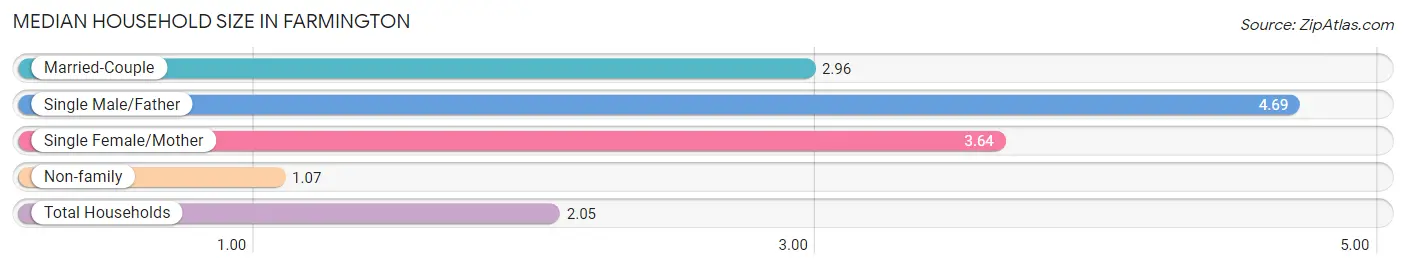
The median household size in Farmington is 2.05 persons per household, with single male/father households (13 | 5.3%) accounting for the largest median household size of 4.69 persons per household. non-family households (136 | 55.1%) represent the smallest median household size with 1.07 persons per household.
| Household Type | # Households | Household Size |
| Married-Couple | 84 (34.0%) | 2.96 |
| Single Male/Father | 13 (5.3%) | 4.69 |
| Single Female/Mother | 14 (5.7%) | 3.64 |
| Non-family | 136 (55.1%) | 1.07 |
| Total Households | 247 (100.0%) | 2.05 |
Household Size by Marriage Status in Farmington
Out of a total of 247 households in Farmington, 111 (44.9%) are family households, while 136 (55.1%) are nonfamily households. The most numerous type of family households are 2-person households, comprising 55, and the most common type of nonfamily households are 1-person households, comprising 130.
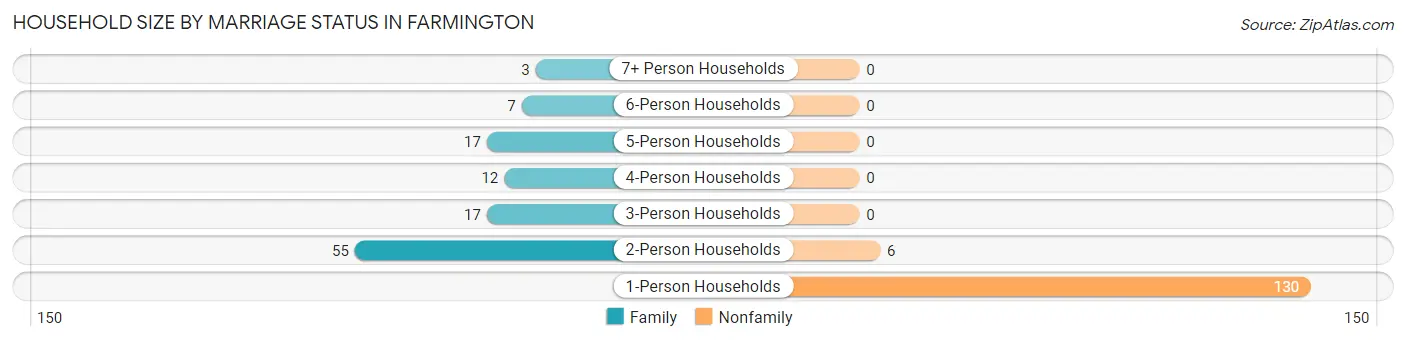
| Household Size | Family Households | Nonfamily Households |
| 1-Person Households | - | 130 (52.6%) |
| 2-Person Households | 55 (22.3%) | 6 (2.4%) |
| 3-Person Households | 17 (6.9%) | 0 (0.0%) |
| 4-Person Households | 12 (4.9%) | 0 (0.0%) |
| 5-Person Households | 17 (6.9%) | 0 (0.0%) |
| 6-Person Households | 7 (2.8%) | 0 (0.0%) |
| 7+ Person Households | 3 (1.2%) | 0 (0.0%) |
| Total | 111 (44.9%) | 136 (55.1%) |
Female Fertility in Farmington
Fertility by Age in Farmington
Average fertility rate in Farmington is 11.0 births per 1,000 women. Women in the age bracket of 35 to 50 years have the highest fertility rate with 29.0 births per 1,000 women. Women in the age bracket of 35 to 50 years acount for 100.0% of all women with births.
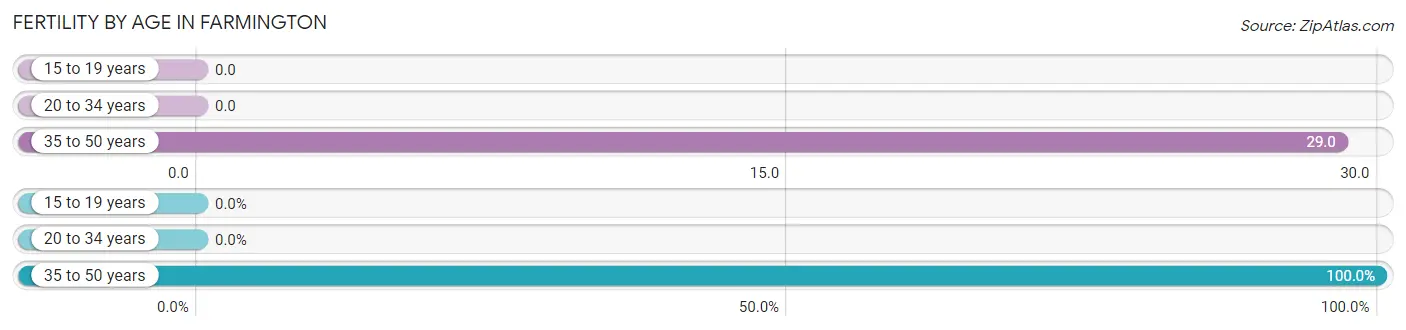
| Age Bracket | Women with Births | Births / 1,000 Women |
| 15 to 19 years | 0 (0.0%) | 0.0 |
| 20 to 34 years | 0 (0.0%) | 0.0 |
| 35 to 50 years | 1 (100.0%) | 29.0 |
| Total | 1 (100.0%) | 11.0 |
Fertility by Age by Marriage Status in Farmington
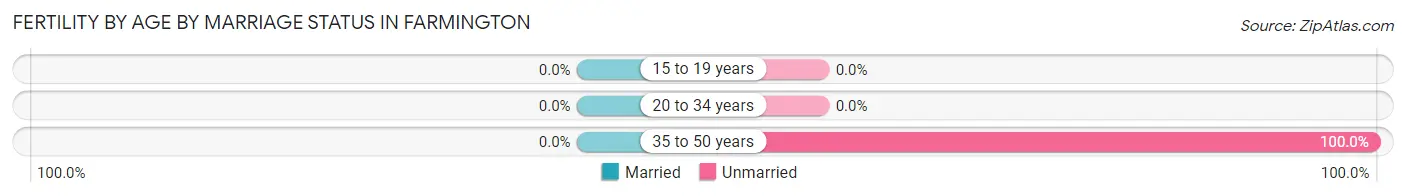
| Age Bracket | Married | Unmarried |
| 15 to 19 years | 0 (0.0%) | 0 (0.0%) |
| 20 to 34 years | 0 (0.0%) | 0 (0.0%) |
| 35 to 50 years | 0 (0.0%) | 1 (100.0%) |
| Total | 0 (0.0%) | 1 (100.0%) |
Fertility by Education in Farmington
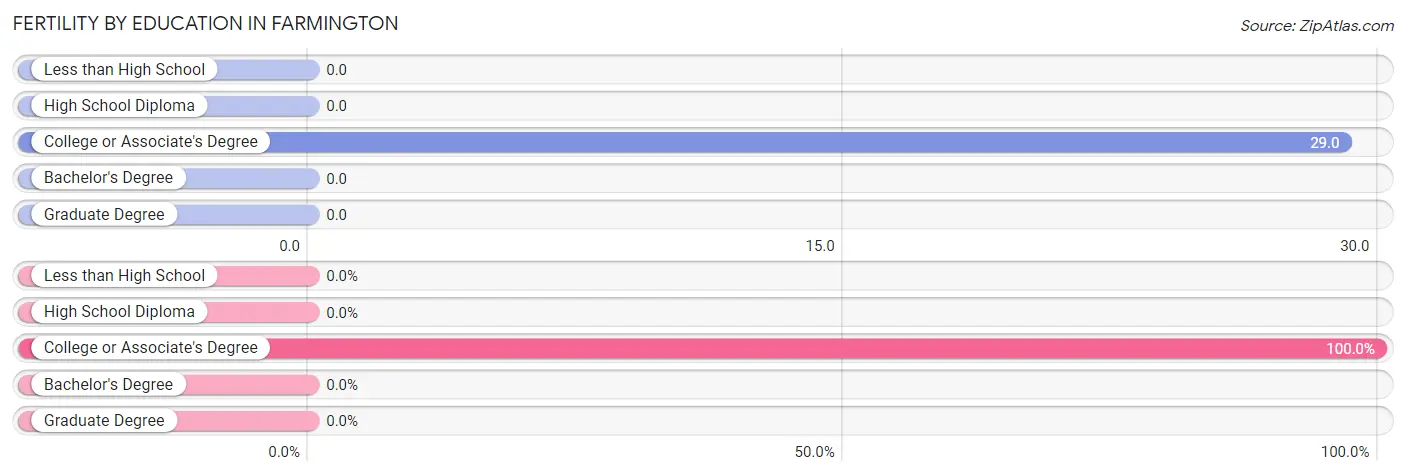
| Educational Attainment | Women with Births | Births / 1,000 Women |
| Less than High School | 0 (0.0%) | 0.0 |
| High School Diploma | 0 (0.0%) | 0.0 |
| College or Associate's Degree | 1 (100.0%) | 29.0 |
| Bachelor's Degree | 0 (0.0%) | 0.0 |
| Graduate Degree | 0 (0.0%) | 0.0 |
| Total | 1 (100.0%) | 11.0 |
Fertility by Education by Marriage Status in Farmington
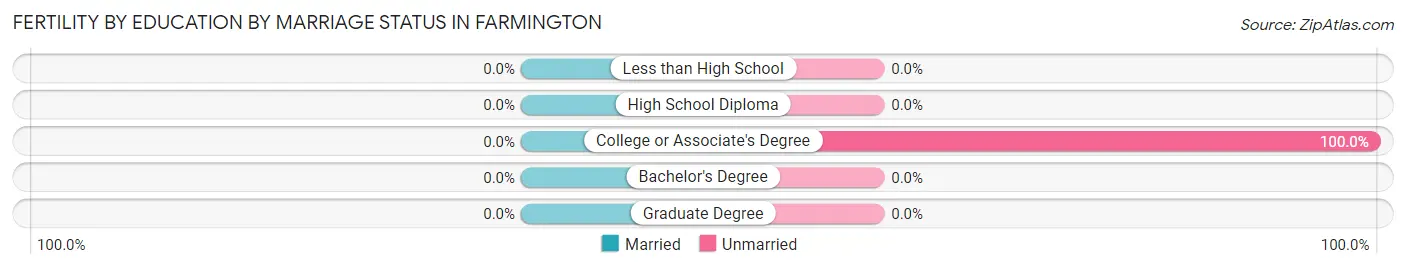
| Educational Attainment | Married | Unmarried |
| Less than High School | 0 (0.0%) | 0 (0.0%) |
| High School Diploma | 0 (0.0%) | 0 (0.0%) |
| College or Associate's Degree | 0 (0.0%) | 1 (100.0%) |
| Bachelor's Degree | 0 (0.0%) | 0 (0.0%) |
| Graduate Degree | 0 (0.0%) | 0 (0.0%) |
| Total | 0 (0.0%) | 1 (100.0%) |
Employment Characteristics in Farmington
Employment by Class of Employer in Farmington
Among the 216 employed individuals in Farmington, private company employees (134 | 62.0%), local government employees (43 | 19.9%), and self-employed (not incorporated) (18 | 8.3%) make up the most common classes of employment.
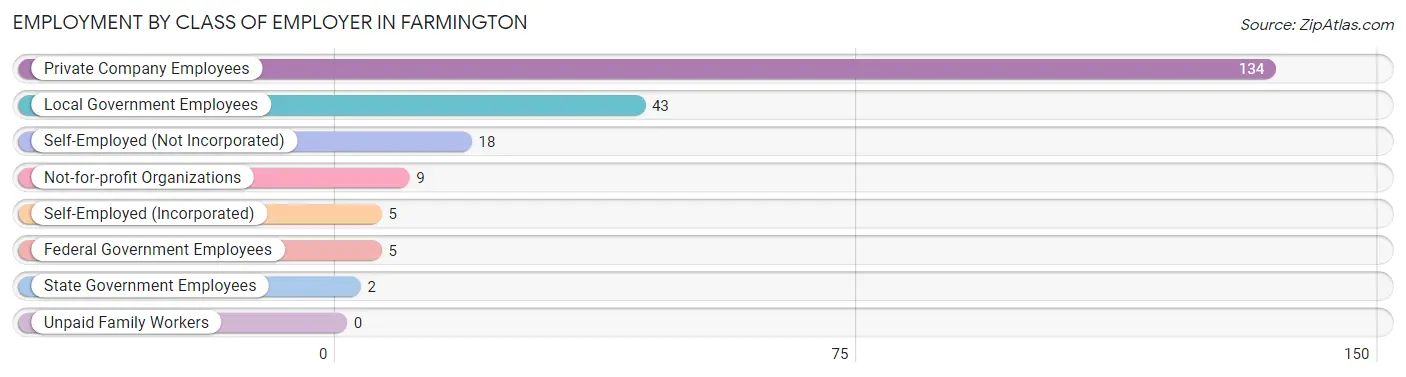
| Employer Class | # Employees | % Employees |
| Private Company Employees | 134 | 62.0% |
| Self-Employed (Incorporated) | 5 | 2.3% |
| Self-Employed (Not Incorporated) | 18 | 8.3% |
| Not-for-profit Organizations | 9 | 4.2% |
| Local Government Employees | 43 | 19.9% |
| State Government Employees | 2 | 0.9% |
| Federal Government Employees | 5 | 2.3% |
| Unpaid Family Workers | 0 | 0.0% |
| Total | 216 | 100.0% |
Employment Status by Age in Farmington
According to the labor force statistics for Farmington, out of the total population over 16 years of age (419), 54.9% or 230 individuals are in the labor force, with 2.6% or 6 of them unemployed. The age group with the highest labor force participation rate is 30 to 34 years, with 91.7% or 22 individuals in the labor force. Within the labor force, the 20 to 24 years age range has the highest percentage of unemployed individuals, with 30.8% or 4 of them being unemployed.
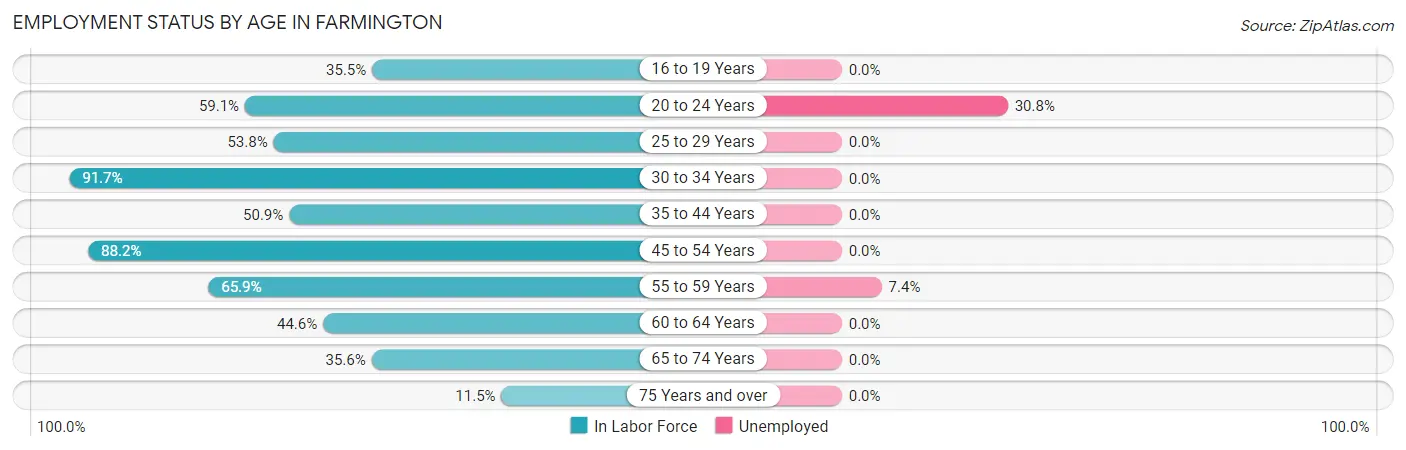
| Age Bracket | In Labor Force | Unemployed |
| 16 to 19 Years | 11 (35.5%) | 0 (0.0%) |
| 20 to 24 Years | 13 (59.1%) | 4 (30.8%) |
| 25 to 29 Years | 7 (53.8%) | 0 (0.0%) |
| 30 to 34 Years | 22 (91.7%) | 0 (0.0%) |
| 35 to 44 Years | 29 (50.9%) | 0 (0.0%) |
| 45 to 54 Years | 67 (88.2%) | 0 (0.0%) |
| 55 to 59 Years | 27 (65.9%) | 2 (7.4%) |
| 60 to 64 Years | 25 (44.6%) | 0 (0.0%) |
| 65 to 74 Years | 26 (35.6%) | 0 (0.0%) |
| 75 Years and over | 3 (11.5%) | 0 (0.0%) |
| Total | 230 (54.9%) | 6 (2.6%) |
Employment Status by Educational Attainment in Farmington
According to labor force statistics for Farmington, 66.3% of individuals (177) out of the total population between 25 and 64 years of age (267) are in the labor force, with 1.1% or 2 of them being unemployed. The group with the highest labor force participation rate are those with the educational attainment of college / associate degree, with 83.3% or 75 individuals in the labor force. Within the labor force, individuals with high school diploma education have the highest percentage of unemployment, with 2.4% or 2 of them being unemployed.
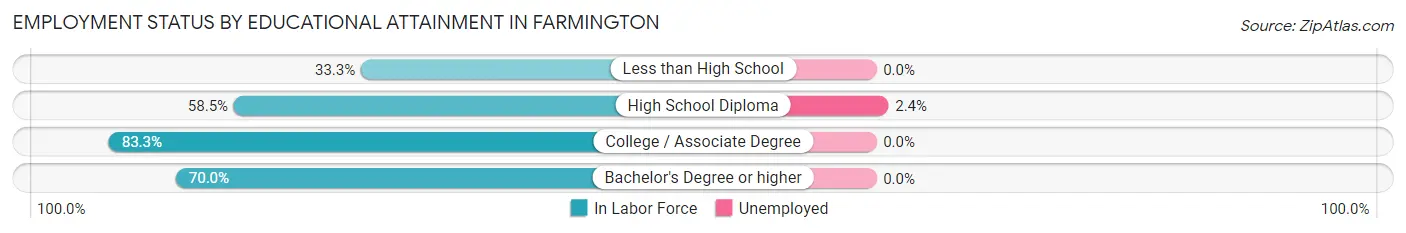
| Educational Attainment | In Labor Force | Unemployed |
| Less than High School | 5 (33.3%) | 0 (0.0%) |
| High School Diploma | 83 (58.5%) | 3 (2.4%) |
| College / Associate Degree | 75 (83.3%) | 0 (0.0%) |
| Bachelor's Degree or higher | 14 (70.0%) | 0 (0.0%) |
| Total | 177 (66.3%) | 3 (1.1%) |
Employment Occupations by Sex in Farmington
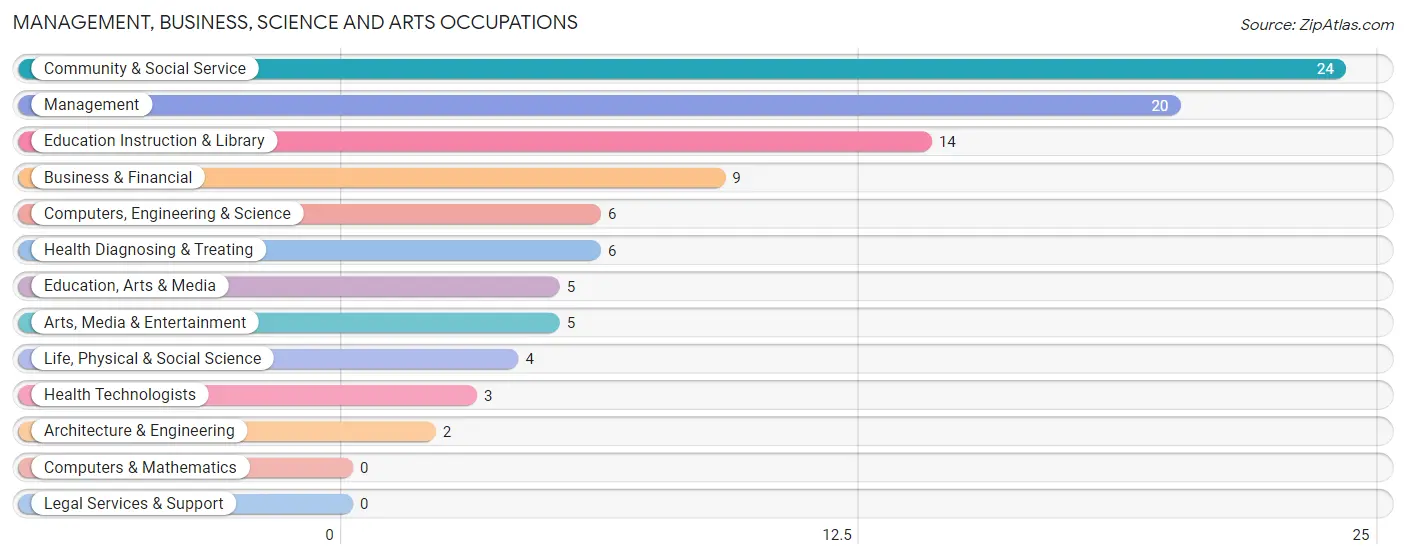
Management, Business, Science and Arts Occupations
The most common Management, Business, Science and Arts occupations in Farmington are Community & Social Service (24 | 10.7%), Management (20 | 8.9%), Education Instruction & Library (14 | 6.2%), Business & Financial (9 | 4.0%), and Computers, Engineering & Science (6 | 2.7%).
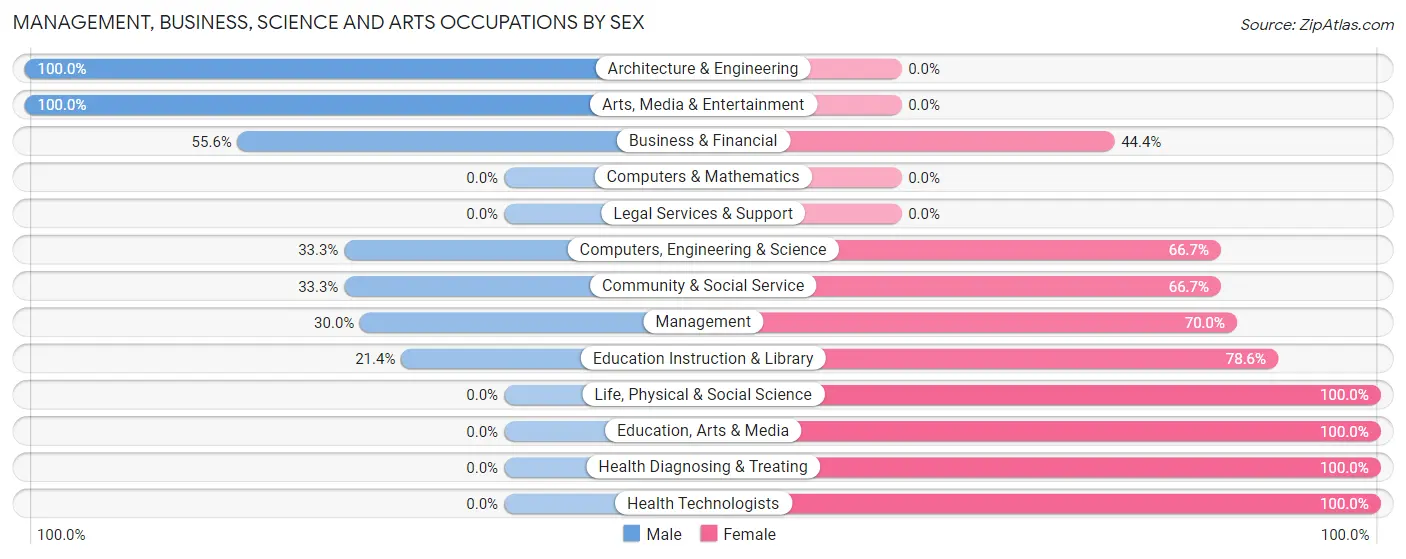
Management, Business, Science and Arts Occupations by Sex
Within the Management, Business, Science and Arts occupations in Farmington, the most male-oriented occupations are Architecture & Engineering (100.0%), Arts, Media & Entertainment (100.0%), and Business & Financial (55.6%), while the most female-oriented occupations are Life, Physical & Social Science (100.0%), Education, Arts & Media (100.0%), and Health Diagnosing & Treating (100.0%).
| Occupation | Male | Female |
| Management | 6 (30.0%) | 14 (70.0%) |
| Business & Financial | 5 (55.6%) | 4 (44.4%) |
| Computers, Engineering & Science | 2 (33.3%) | 4 (66.7%) |
| Computers & Mathematics | 0 (0.0%) | 0 (0.0%) |
| Architecture & Engineering | 2 (100.0%) | 0 (0.0%) |
| Life, Physical & Social Science | 0 (0.0%) | 4 (100.0%) |
| Community & Social Service | 8 (33.3%) | 16 (66.7%) |
| Education, Arts & Media | 0 (0.0%) | 5 (100.0%) |
| Legal Services & Support | 0 (0.0%) | 0 (0.0%) |
| Education Instruction & Library | 3 (21.4%) | 11 (78.6%) |
| Arts, Media & Entertainment | 5 (100.0%) | 0 (0.0%) |
| Health Diagnosing & Treating | 0 (0.0%) | 6 (100.0%) |
| Health Technologists | 0 (0.0%) | 3 (100.0%) |
| Total (Category) | 21 (32.3%) | 44 (67.7%) |
| Total (Overall) | 114 (50.9%) | 110 (49.1%) |
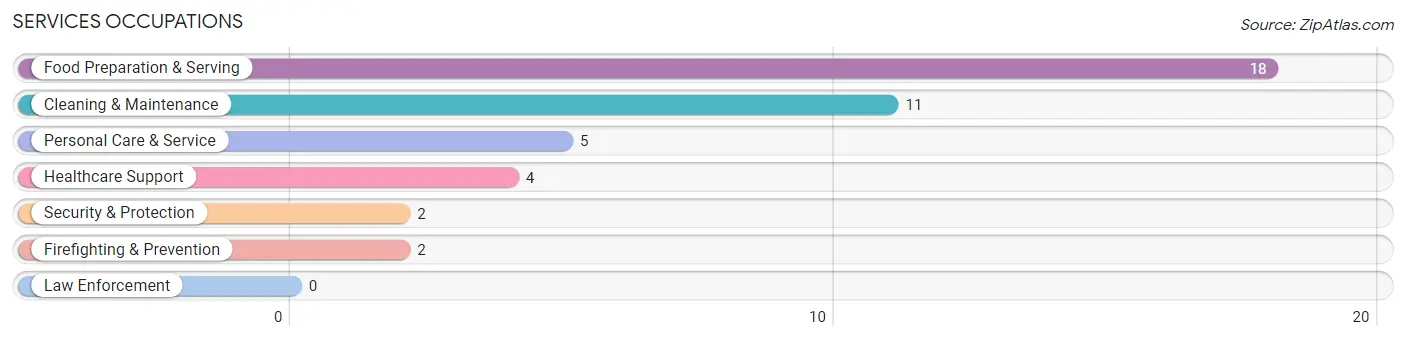
Services Occupations
The most common Services occupations in Farmington are Food Preparation & Serving (18 | 8.0%), Cleaning & Maintenance (11 | 4.9%), Personal Care & Service (5 | 2.2%), Healthcare Support (4 | 1.8%), and Security & Protection (2 | 0.9%).
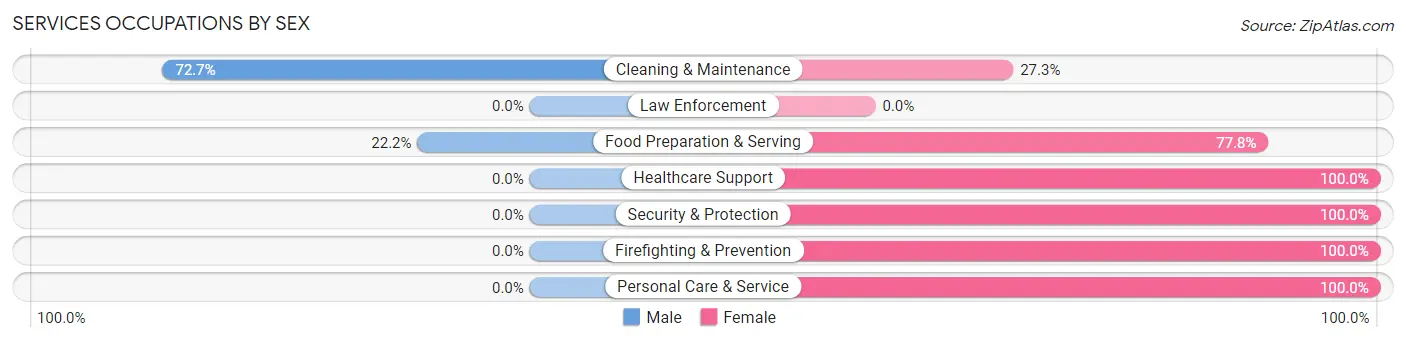
Services Occupations by Sex
Within the Services occupations in Farmington, the most male-oriented occupations are Cleaning & Maintenance (72.7%), and Food Preparation & Serving (22.2%), while the most female-oriented occupations are Healthcare Support (100.0%), Security & Protection (100.0%), and Firefighting & Prevention (100.0%).
| Occupation | Male | Female |
| Healthcare Support | 0 (0.0%) | 4 (100.0%) |
| Security & Protection | 0 (0.0%) | 2 (100.0%) |
| Firefighting & Prevention | 0 (0.0%) | 2 (100.0%) |
| Law Enforcement | 0 (0.0%) | 0 (0.0%) |
| Food Preparation & Serving | 4 (22.2%) | 14 (77.8%) |
| Cleaning & Maintenance | 8 (72.7%) | 3 (27.3%) |
| Personal Care & Service | 0 (0.0%) | 5 (100.0%) |
| Total (Category) | 12 (30.0%) | 28 (70.0%) |
| Total (Overall) | 114 (50.9%) | 110 (49.1%) |
Sales and Office Occupations
The most common Sales and Office occupations in Farmington are Sales & Related (25 | 11.2%), and Office & Administration (22 | 9.8%).
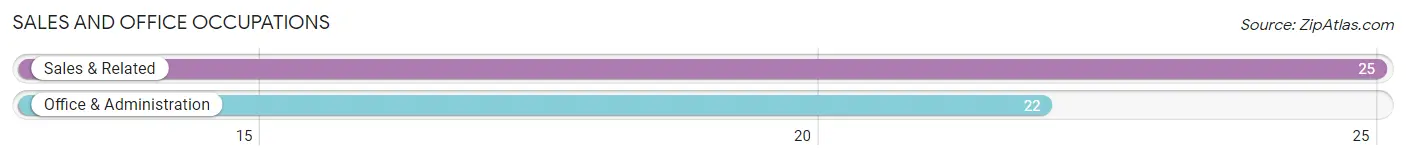
Sales and Office Occupations by Sex
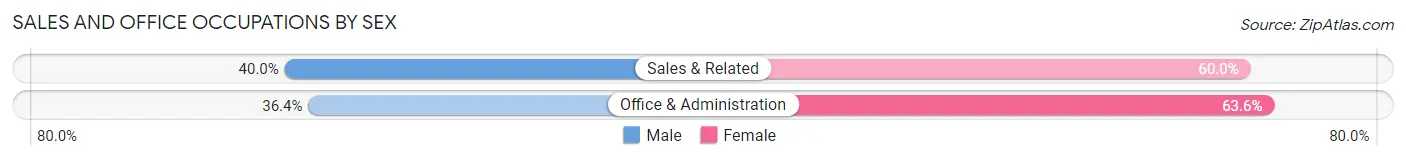
| Occupation | Male | Female |
| Sales & Related | 10 (40.0%) | 15 (60.0%) |
| Office & Administration | 8 (36.4%) | 14 (63.6%) |
| Total (Category) | 18 (38.3%) | 29 (61.7%) |
| Total (Overall) | 114 (50.9%) | 110 (49.1%) |
Natural Resources, Construction and Maintenance Occupations
The most common Natural Resources, Construction and Maintenance occupations in Farmington are Installation, Maintenance & Repair (13 | 5.8%), and Construction & Extraction (7 | 3.1%).
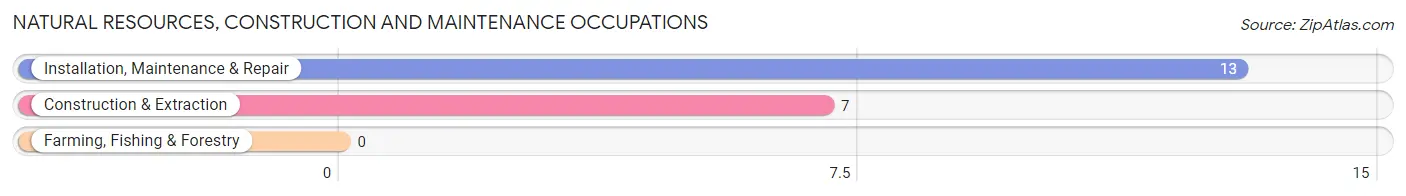
Natural Resources, Construction and Maintenance Occupations by Sex
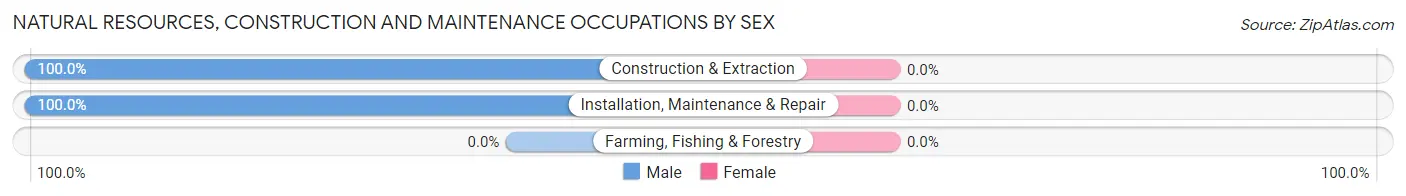
| Occupation | Male | Female |
| Farming, Fishing & Forestry | 0 (0.0%) | 0 (0.0%) |
| Construction & Extraction | 7 (100.0%) | 0 (0.0%) |
| Installation, Maintenance & Repair | 13 (100.0%) | 0 (0.0%) |
| Total (Category) | 20 (100.0%) | 0 (0.0%) |
| Total (Overall) | 114 (50.9%) | 110 (49.1%) |
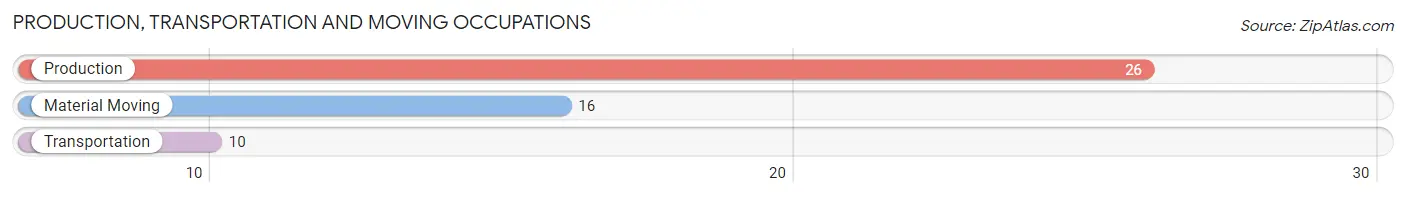
Production, Transportation and Moving Occupations
The most common Production, Transportation and Moving occupations in Farmington are Production (26 | 11.6%), Material Moving (16 | 7.1%), and Transportation (10 | 4.5%).
Production, Transportation and Moving Occupations by Sex
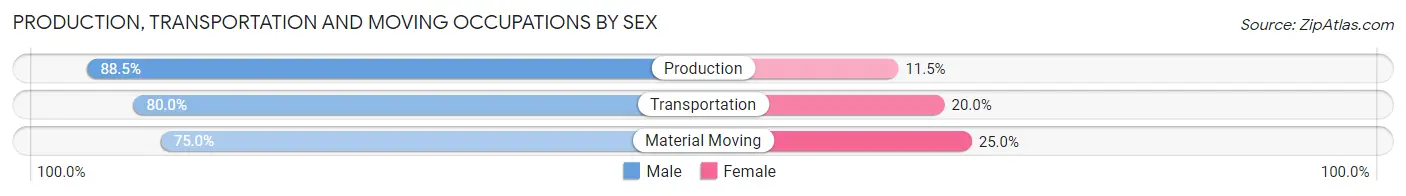
| Occupation | Male | Female |
| Production | 23 (88.5%) | 3 (11.5%) |
| Transportation | 8 (80.0%) | 2 (20.0%) |
| Material Moving | 12 (75.0%) | 4 (25.0%) |
| Total (Category) | 43 (82.7%) | 9 (17.3%) |
| Total (Overall) | 114 (50.9%) | 110 (49.1%) |
Employment Industries by Sex in Farmington
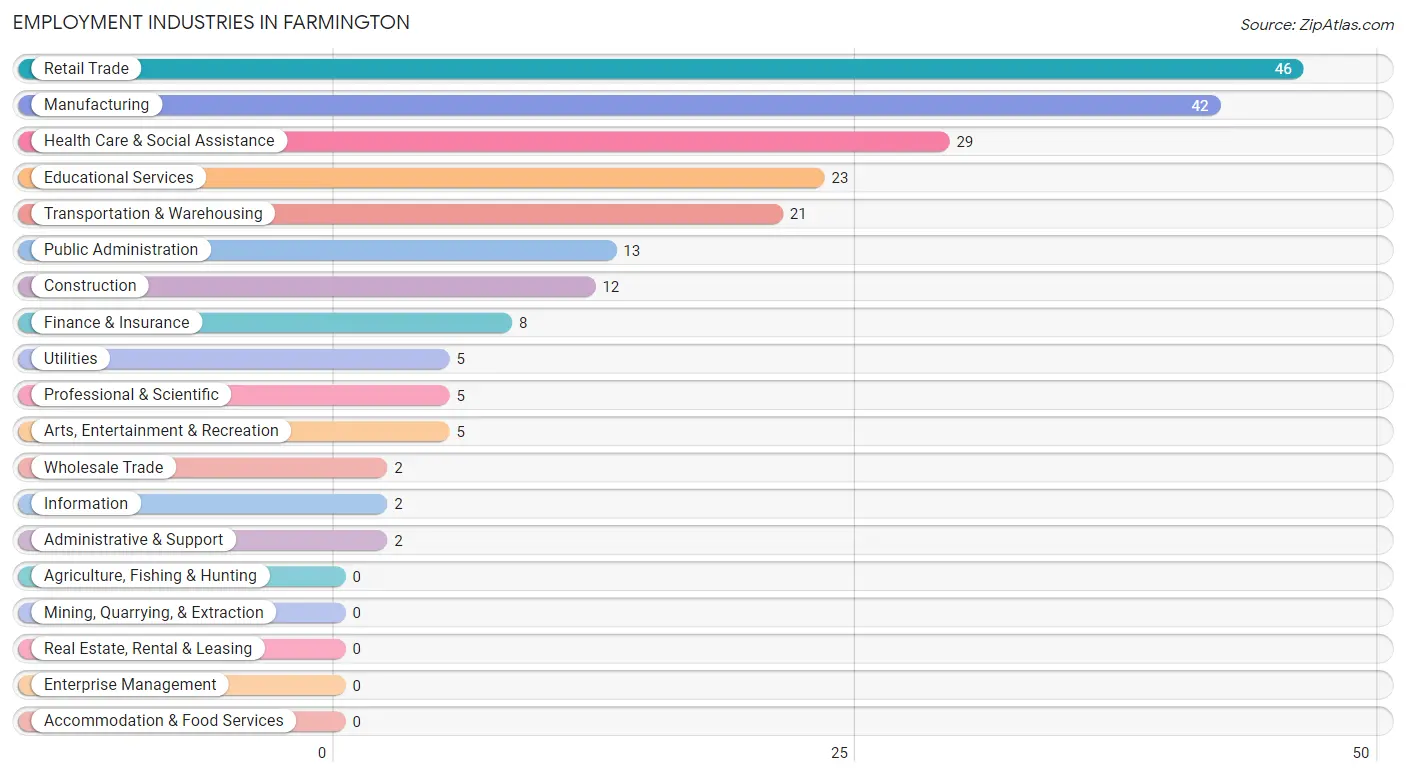
Employment Industries in Farmington
The major employment industries in Farmington include Retail Trade (46 | 20.5%), Manufacturing (42 | 18.8%), Health Care & Social Assistance (29 | 13.0%), Educational Services (23 | 10.3%), and Transportation & Warehousing (21 | 9.4%).
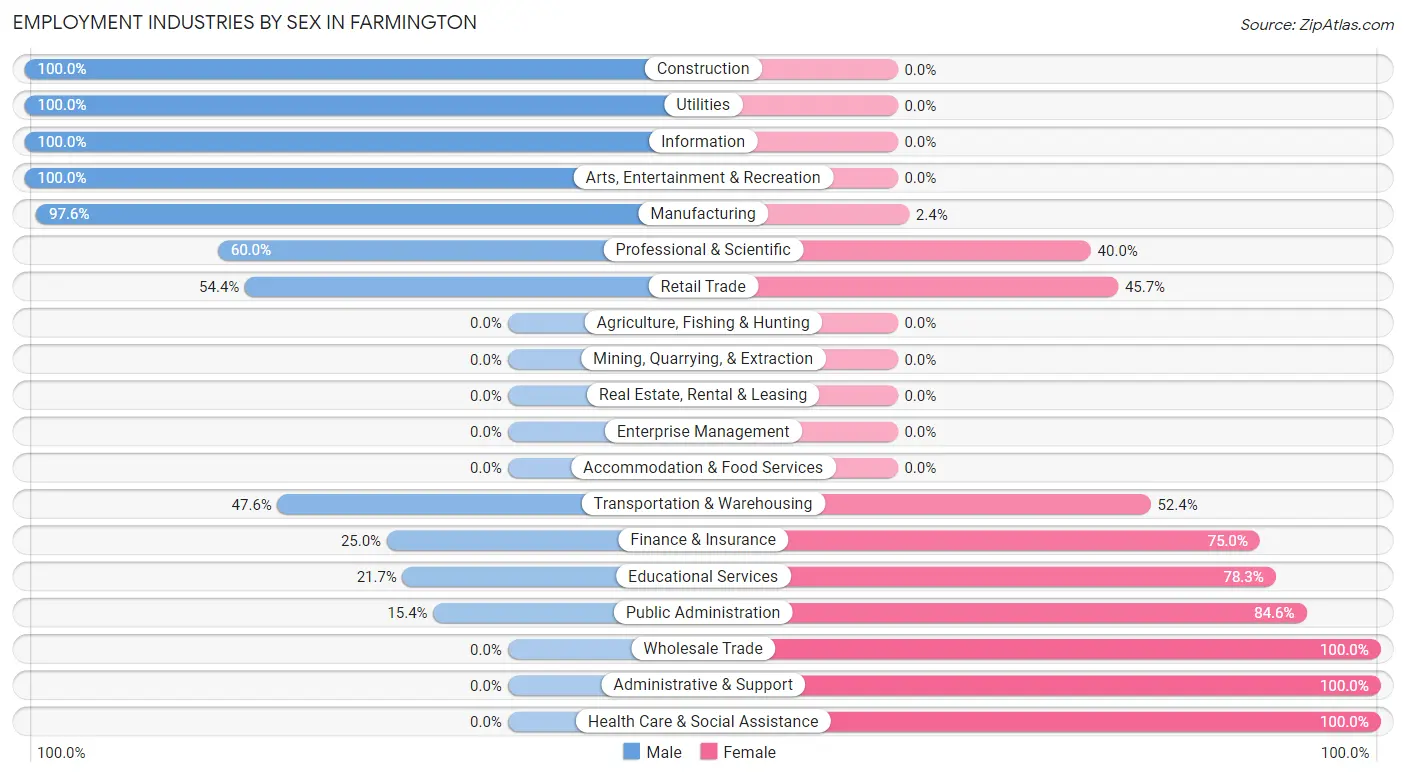
Employment Industries by Sex in Farmington
The Farmington industries that see more men than women are Construction (100.0%), Utilities (100.0%), and Information (100.0%), whereas the industries that tend to have a higher number of women are Wholesale Trade (100.0%), Administrative & Support (100.0%), and Health Care & Social Assistance (100.0%).
| Industry | Male | Female |
| Agriculture, Fishing & Hunting | 0 (0.0%) | 0 (0.0%) |
| Mining, Quarrying, & Extraction | 0 (0.0%) | 0 (0.0%) |
| Construction | 12 (100.0%) | 0 (0.0%) |
| Manufacturing | 41 (97.6%) | 1 (2.4%) |
| Wholesale Trade | 0 (0.0%) | 2 (100.0%) |
| Retail Trade | 25 (54.3%) | 21 (45.7%) |
| Transportation & Warehousing | 10 (47.6%) | 11 (52.4%) |
| Utilities | 5 (100.0%) | 0 (0.0%) |
| Information | 2 (100.0%) | 0 (0.0%) |
| Finance & Insurance | 2 (25.0%) | 6 (75.0%) |
| Real Estate, Rental & Leasing | 0 (0.0%) | 0 (0.0%) |
| Professional & Scientific | 3 (60.0%) | 2 (40.0%) |
| Enterprise Management | 0 (0.0%) | 0 (0.0%) |
| Administrative & Support | 0 (0.0%) | 2 (100.0%) |
| Educational Services | 5 (21.7%) | 18 (78.3%) |
| Health Care & Social Assistance | 0 (0.0%) | 29 (100.0%) |
| Arts, Entertainment & Recreation | 5 (100.0%) | 0 (0.0%) |
| Accommodation & Food Services | 0 (0.0%) | 0 (0.0%) |
| Public Administration | 2 (15.4%) | 11 (84.6%) |
| Total | 114 (50.9%) | 110 (49.1%) |
Education in Farmington
School Enrollment in Farmington
The most common levels of schooling among the 109 students in Farmington are elementary school (33 | 30.3%), middle school (27 | 24.8%), and high school (24 | 22.0%).
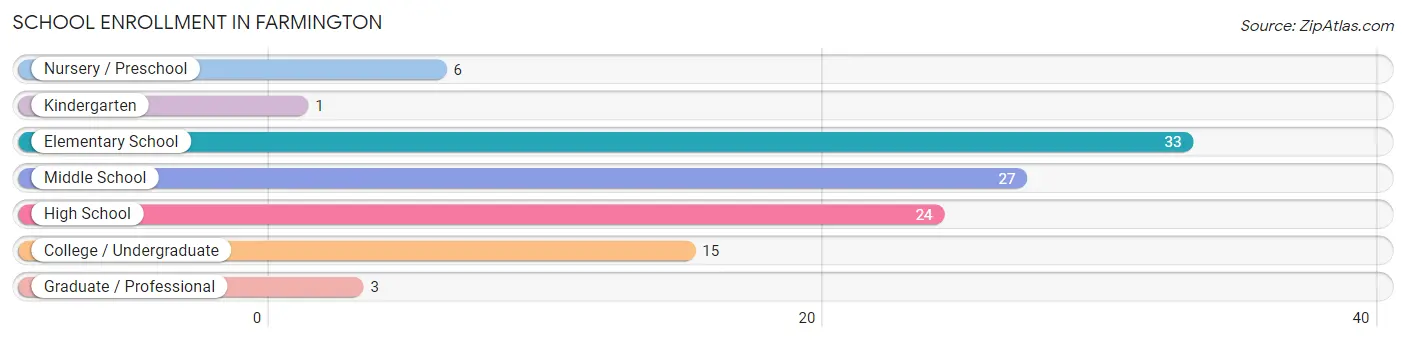
| School Level | # Students | % Students |
| Nursery / Preschool | 6 | 5.5% |
| Kindergarten | 1 | 0.9% |
| Elementary School | 33 | 30.3% |
| Middle School | 27 | 24.8% |
| High School | 24 | 22.0% |
| College / Undergraduate | 15 | 13.8% |
| Graduate / Professional | 3 | 2.8% |
| Total | 109 | 100.0% |
School Enrollment by Age by Funding Source in Farmington
Out of a total of 109 students who are enrolled in schools in Farmington, 13 (11.9%) attend a private institution, while the remaining 96 (88.1%) are enrolled in public schools. The age group of 18 to 19 year olds has the highest likelihood of being enrolled in private schools, with 11 (100.0% in the age bracket) enrolled. Conversely, the age group of 3 to 4 year olds has the lowest likelihood of being enrolled in a private school, with 4 (100.0% in the age bracket) attending a public institution.
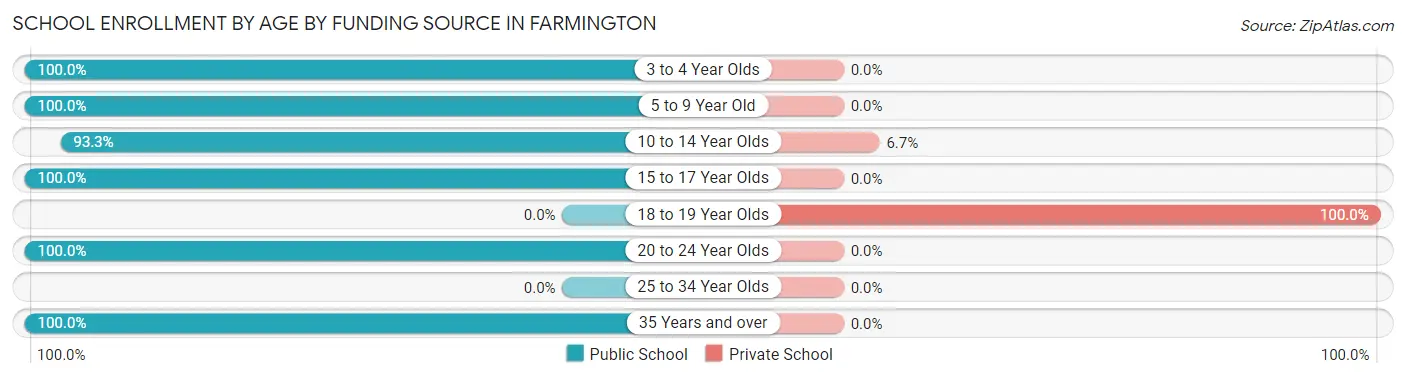
| Age Bracket | Public School | Private School |
| 3 to 4 Year Olds | 4 (100.0%) | 0 (0.0%) |
| 5 to 9 Year Old | 33 (100.0%) | 0 (0.0%) |
| 10 to 14 Year Olds | 28 (93.3%) | 2 (6.7%) |
| 15 to 17 Year Olds | 24 (100.0%) | 0 (0.0%) |
| 18 to 19 Year Olds | 0 (0.0%) | 11 (100.0%) |
| 20 to 24 Year Olds | 1 (100.0%) | 0 (0.0%) |
| 25 to 34 Year Olds | 0 (0.0%) | 0 (0.0%) |
| 35 Years and over | 6 (100.0%) | 0 (0.0%) |
| Total | 96 (88.1%) | 13 (11.9%) |
Educational Attainment by Field of Study in Farmington
Business (13 | 26.0%), education (11 | 22.0%), bio, nature & agricultural (10 | 20.0%), social sciences (8 | 16.0%), and visual & performing arts (5 | 10.0%) are the most common fields of study among 50 individuals in Farmington who have obtained a bachelor's degree or higher.
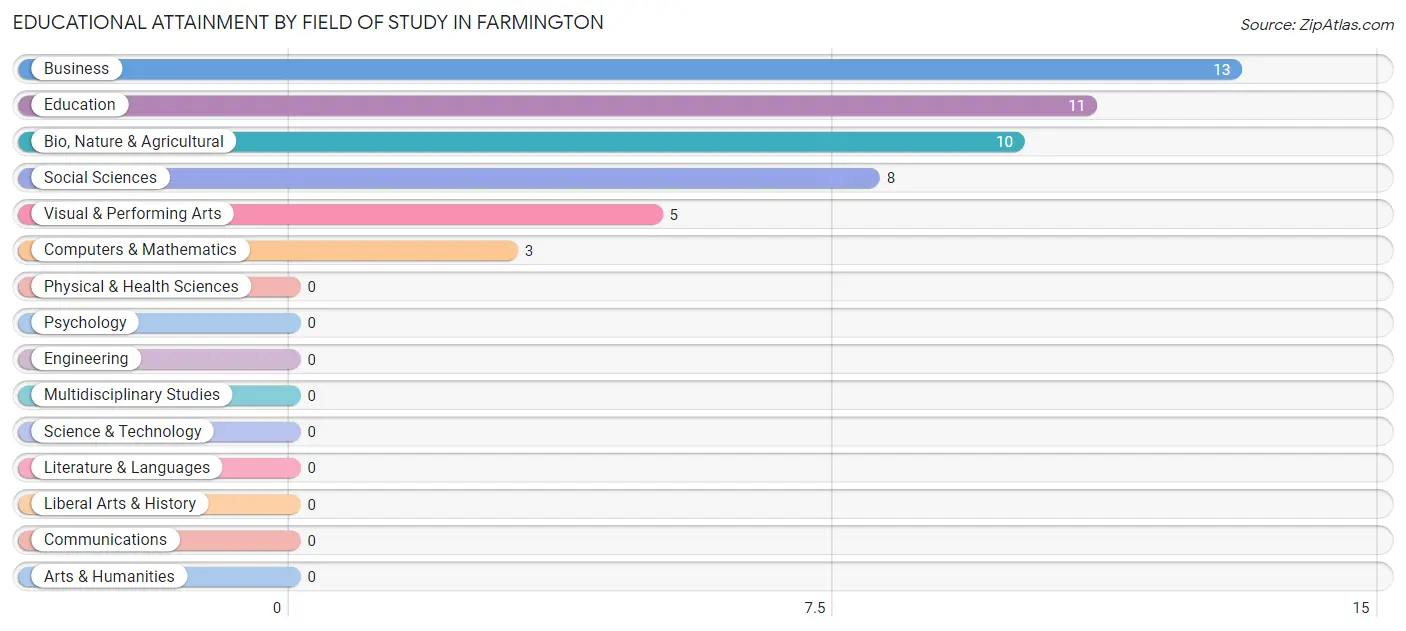
| Field of Study | # Graduates | % Graduates |
| Computers & Mathematics | 3 | 6.0% |
| Bio, Nature & Agricultural | 10 | 20.0% |
| Physical & Health Sciences | 0 | 0.0% |
| Psychology | 0 | 0.0% |
| Social Sciences | 8 | 16.0% |
| Engineering | 0 | 0.0% |
| Multidisciplinary Studies | 0 | 0.0% |
| Science & Technology | 0 | 0.0% |
| Business | 13 | 26.0% |
| Education | 11 | 22.0% |
| Literature & Languages | 0 | 0.0% |
| Liberal Arts & History | 0 | 0.0% |
| Visual & Performing Arts | 5 | 10.0% |
| Communications | 0 | 0.0% |
| Arts & Humanities | 0 | 0.0% |
| Total | 50 | 100.0% |
Transportation & Commute in Farmington
Vehicle Availability by Sex in Farmington
The most prevalent vehicle ownership categories in Farmington are males with 2 vehicles (52, accounting for 48.1%) and females with 2 vehicles (29, making up 48.1%).
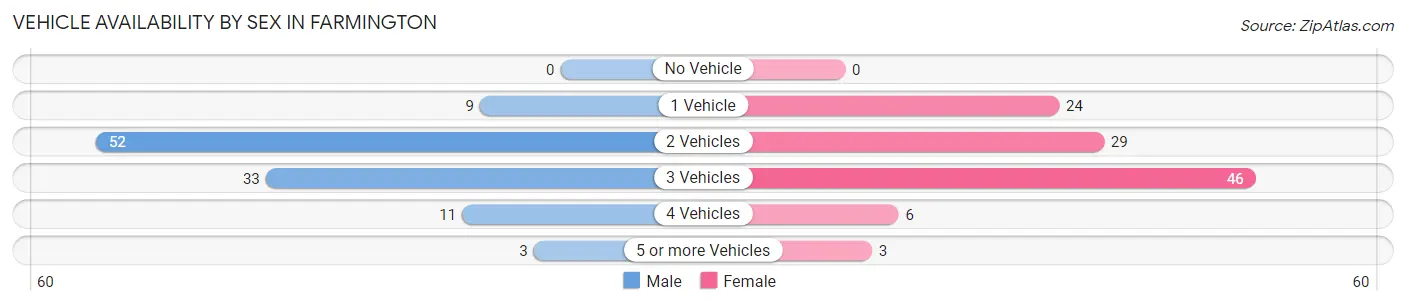
| Vehicles Available | Male | Female |
| No Vehicle | 0 (0.0%) | 0 (0.0%) |
| 1 Vehicle | 9 (8.3%) | 24 (22.2%) |
| 2 Vehicles | 52 (48.1%) | 29 (26.9%) |
| 3 Vehicles | 33 (30.6%) | 46 (42.6%) |
| 4 Vehicles | 11 (10.2%) | 6 (5.6%) |
| 5 or more Vehicles | 3 (2.8%) | 3 (2.8%) |
| Total | 108 (100.0%) | 108 (100.0%) |
Commute Time in Farmington
The most frequently occuring commute durations in Farmington are 45 to 59 minutes (52 commuters, 26.3%), less than 5 minutes (28 commuters, 14.1%), and 5 to 9 minutes (26 commuters, 13.1%).
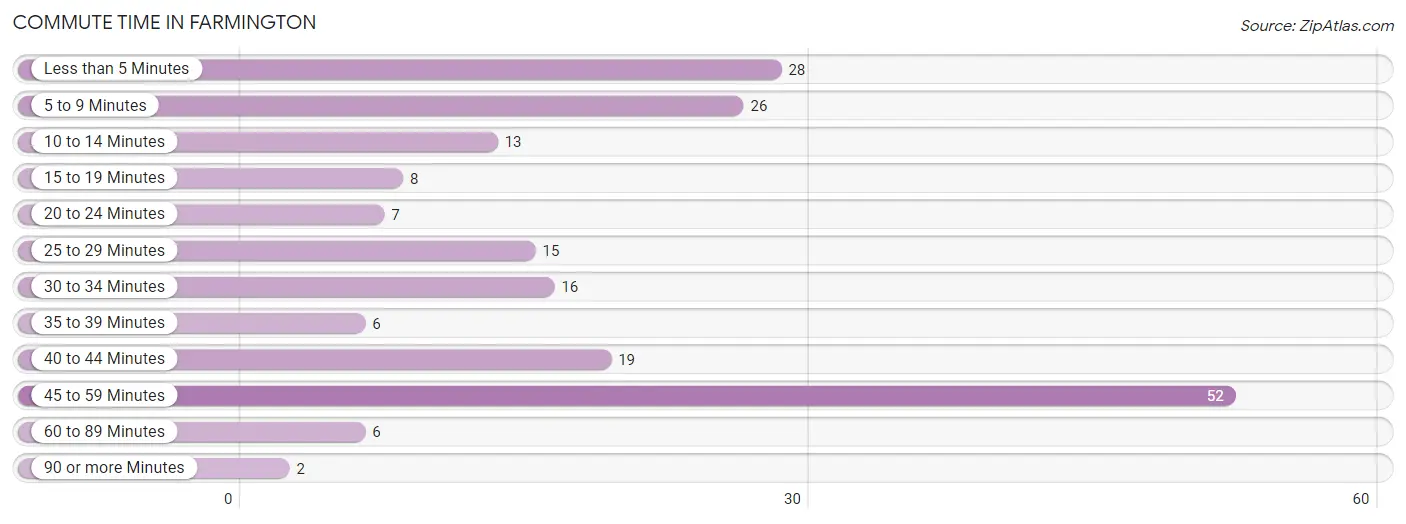
| Commute Time | # Commuters | % Commuters |
| Less than 5 Minutes | 28 | 14.1% |
| 5 to 9 Minutes | 26 | 13.1% |
| 10 to 14 Minutes | 13 | 6.6% |
| 15 to 19 Minutes | 8 | 4.0% |
| 20 to 24 Minutes | 7 | 3.5% |
| 25 to 29 Minutes | 15 | 7.6% |
| 30 to 34 Minutes | 16 | 8.1% |
| 35 to 39 Minutes | 6 | 3.0% |
| 40 to 44 Minutes | 19 | 9.6% |
| 45 to 59 Minutes | 52 | 26.3% |
| 60 to 89 Minutes | 6 | 3.0% |
| 90 or more Minutes | 2 | 1.0% |
Commute Time by Sex in Farmington
The most common commute times in Farmington are 45 to 59 minutes (20 commuters, 20.6%) for males and 45 to 59 minutes (32 commuters, 31.7%) for females.
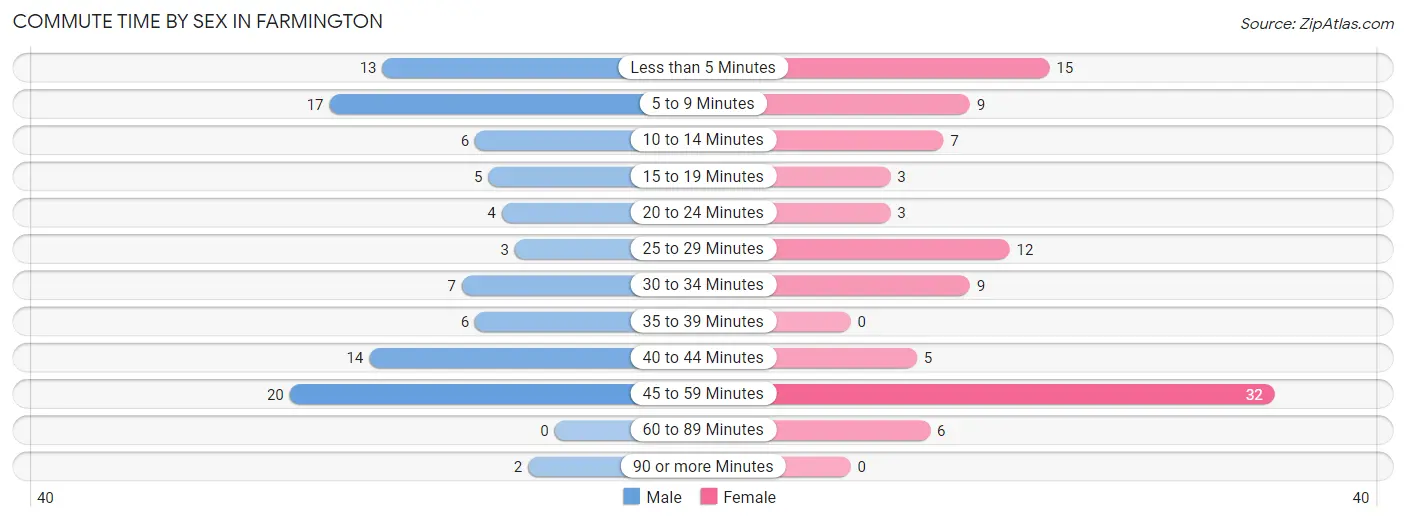
| Commute Time | Male | Female |
| Less than 5 Minutes | 13 (13.4%) | 15 (14.8%) |
| 5 to 9 Minutes | 17 (17.5%) | 9 (8.9%) |
| 10 to 14 Minutes | 6 (6.2%) | 7 (6.9%) |
| 15 to 19 Minutes | 5 (5.1%) | 3 (3.0%) |
| 20 to 24 Minutes | 4 (4.1%) | 3 (3.0%) |
| 25 to 29 Minutes | 3 (3.1%) | 12 (11.9%) |
| 30 to 34 Minutes | 7 (7.2%) | 9 (8.9%) |
| 35 to 39 Minutes | 6 (6.2%) | 0 (0.0%) |
| 40 to 44 Minutes | 14 (14.4%) | 5 (5.0%) |
| 45 to 59 Minutes | 20 (20.6%) | 32 (31.7%) |
| 60 to 89 Minutes | 0 (0.0%) | 6 (5.9%) |
| 90 or more Minutes | 2 (2.1%) | 0 (0.0%) |
Time of Departure to Work by Sex in Farmington
The most frequent times of departure to work in Farmington are 12:00 AM to 4:59 AM (29, 29.9%) for males and 8:00 AM to 8:29 AM (29, 28.7%) for females.
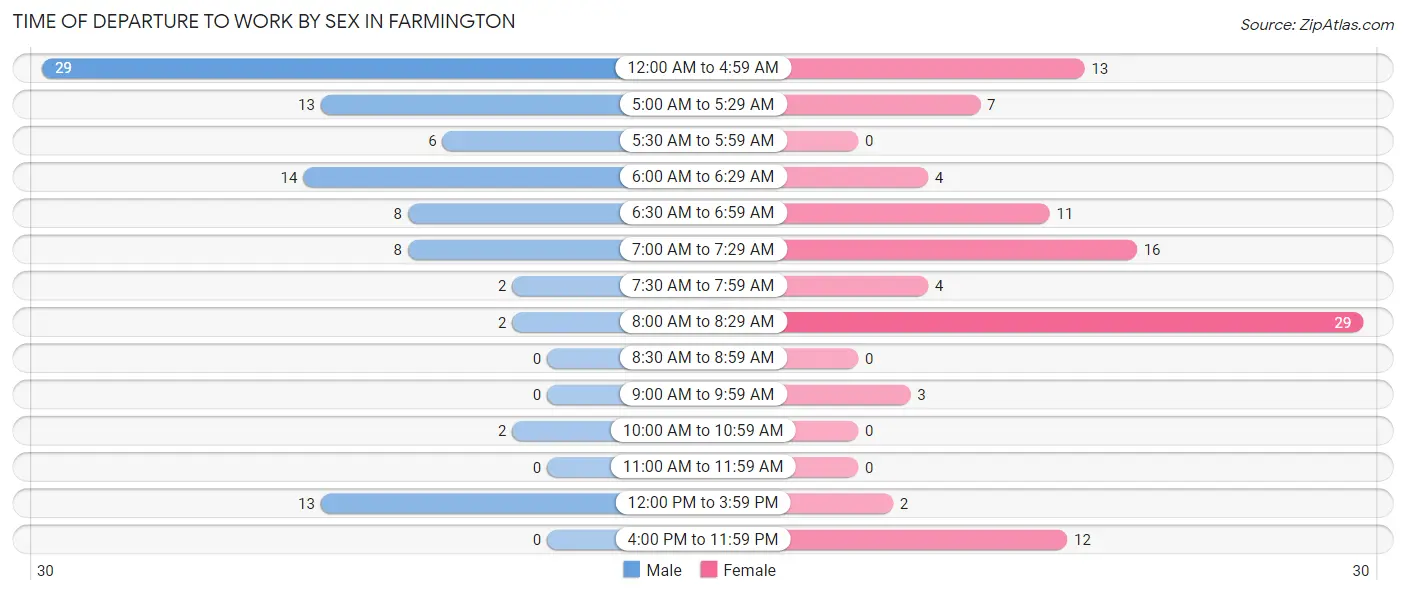
| Time of Departure | Male | Female |
| 12:00 AM to 4:59 AM | 29 (29.9%) | 13 (12.9%) |
| 5:00 AM to 5:29 AM | 13 (13.4%) | 7 (6.9%) |
| 5:30 AM to 5:59 AM | 6 (6.2%) | 0 (0.0%) |
| 6:00 AM to 6:29 AM | 14 (14.4%) | 4 (4.0%) |
| 6:30 AM to 6:59 AM | 8 (8.3%) | 11 (10.9%) |
| 7:00 AM to 7:29 AM | 8 (8.3%) | 16 (15.8%) |
| 7:30 AM to 7:59 AM | 2 (2.1%) | 4 (4.0%) |
| 8:00 AM to 8:29 AM | 2 (2.1%) | 29 (28.7%) |
| 8:30 AM to 8:59 AM | 0 (0.0%) | 0 (0.0%) |
| 9:00 AM to 9:59 AM | 0 (0.0%) | 3 (3.0%) |
| 10:00 AM to 10:59 AM | 2 (2.1%) | 0 (0.0%) |
| 11:00 AM to 11:59 AM | 0 (0.0%) | 0 (0.0%) |
| 12:00 PM to 3:59 PM | 13 (13.4%) | 2 (2.0%) |
| 4:00 PM to 11:59 PM | 0 (0.0%) | 12 (11.9%) |
| Total | 97 (100.0%) | 101 (100.0%) |
Housing Occupancy in Farmington
Occupancy by Ownership in Farmington
Of the total 247 dwellings in Farmington, owner-occupied units account for 206 (83.4%), while renter-occupied units make up 41 (16.6%).
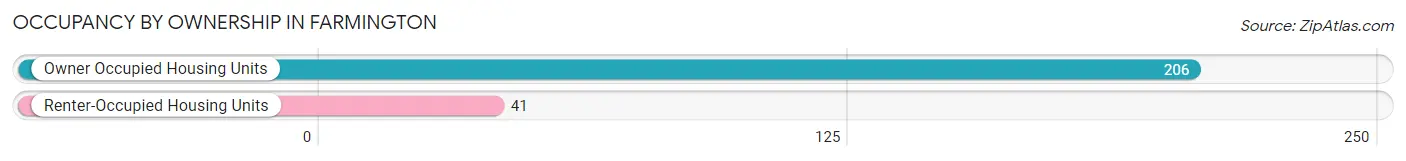
| Occupancy | # Housing Units | % Housing Units |
| Owner Occupied Housing Units | 206 | 83.4% |
| Renter-Occupied Housing Units | 41 | 16.6% |
| Total Occupied Housing Units | 247 | 100.0% |
Occupancy by Household Size in Farmington
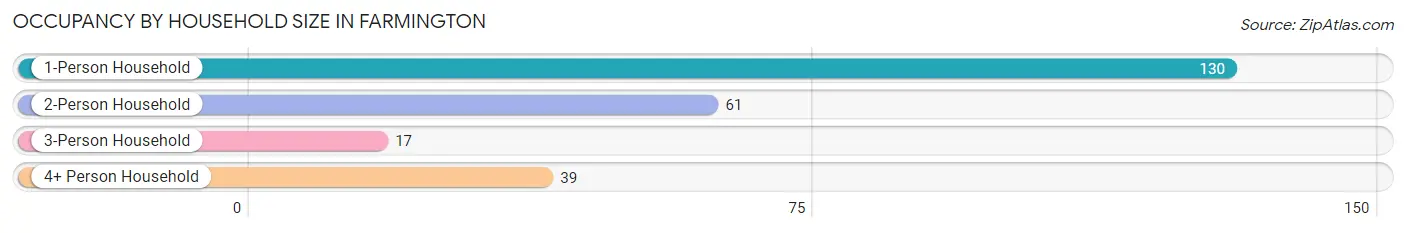
| Household Size | # Housing Units | % Housing Units |
| 1-Person Household | 130 | 52.6% |
| 2-Person Household | 61 | 24.7% |
| 3-Person Household | 17 | 6.9% |
| 4+ Person Household | 39 | 15.8% |
| Total Housing Units | 247 | 100.0% |
Occupancy by Ownership by Household Size in Farmington
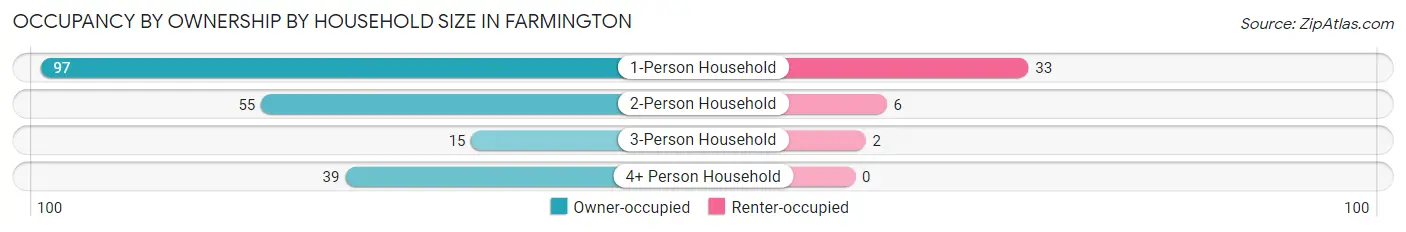
| Household Size | Owner-occupied | Renter-occupied |
| 1-Person Household | 97 (74.6%) | 33 (25.4%) |
| 2-Person Household | 55 (90.2%) | 6 (9.8%) |
| 3-Person Household | 15 (88.2%) | 2 (11.8%) |
| 4+ Person Household | 39 (100.0%) | 0 (0.0%) |
| Total Housing Units | 206 (83.4%) | 41 (16.6%) |
Occupancy by Educational Attainment in Farmington
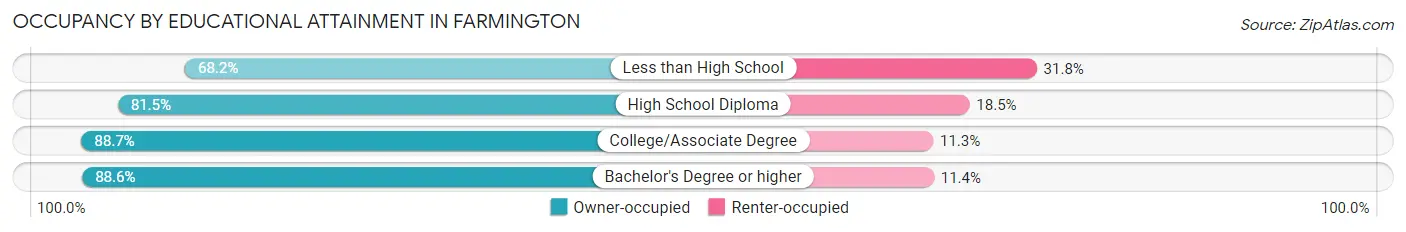
| Household Size | Owner-occupied | Renter-occupied |
| Less than High School | 15 (68.2%) | 7 (31.8%) |
| High School Diploma | 97 (81.5%) | 22 (18.5%) |
| College/Associate Degree | 63 (88.7%) | 8 (11.3%) |
| Bachelor's Degree or higher | 31 (88.6%) | 4 (11.4%) |
Occupancy by Age of Householder in Farmington
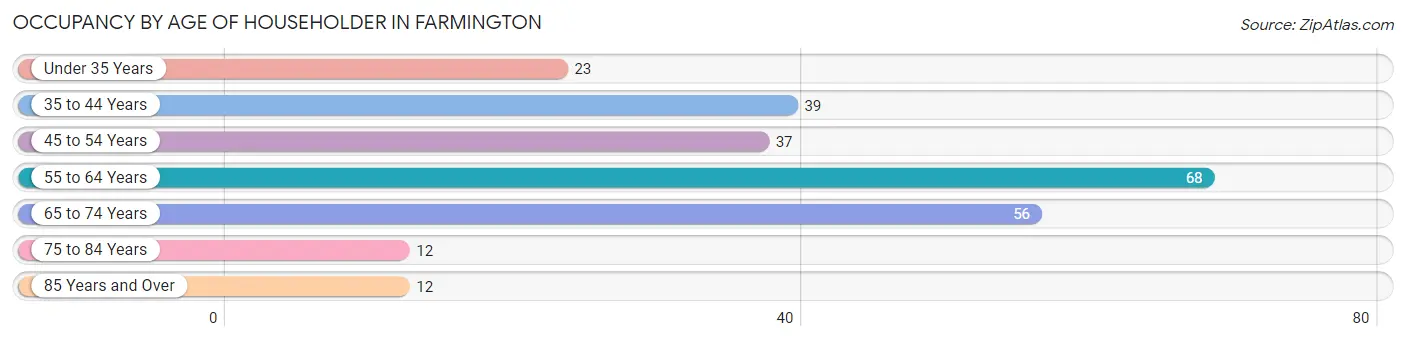
| Age Bracket | # Households | % Households |
| Under 35 Years | 23 | 9.3% |
| 35 to 44 Years | 39 | 15.8% |
| 45 to 54 Years | 37 | 15.0% |
| 55 to 64 Years | 68 | 27.5% |
| 65 to 74 Years | 56 | 22.7% |
| 75 to 84 Years | 12 | 4.9% |
| 85 Years and Over | 12 | 4.9% |
| Total | 247 | 100.0% |
Housing Finances in Farmington
Median Income by Occupancy in Farmington
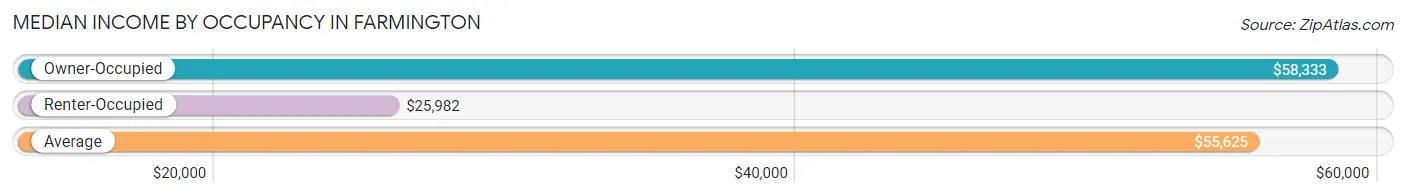
| Occupancy Type | # Households | Median Income |
| Owner-Occupied | 206 (83.4%) | $58,333 |
| Renter-Occupied | 41 (16.6%) | $25,982 |
| Average | 247 (100.0%) | $55,625 |
Occupancy by Householder Income Bracket in Farmington
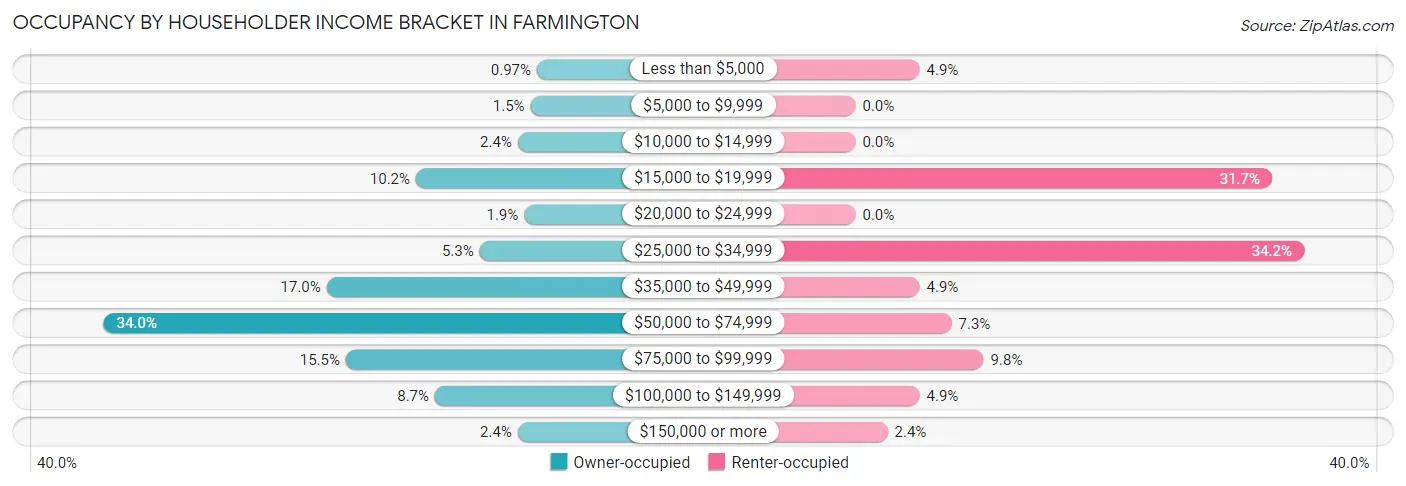
| Income Bracket | Owner-occupied | Renter-occupied |
| Less than $5,000 | 2 (1.0%) | 2 (4.9%) |
| $5,000 to $9,999 | 3 (1.5%) | 0 (0.0%) |
| $10,000 to $14,999 | 5 (2.4%) | 0 (0.0%) |
| $15,000 to $19,999 | 21 (10.2%) | 13 (31.7%) |
| $20,000 to $24,999 | 4 (1.9%) | 0 (0.0%) |
| $25,000 to $34,999 | 11 (5.3%) | 14 (34.2%) |
| $35,000 to $49,999 | 35 (17.0%) | 2 (4.9%) |
| $50,000 to $74,999 | 70 (34.0%) | 3 (7.3%) |
| $75,000 to $99,999 | 32 (15.5%) | 4 (9.8%) |
| $100,000 to $149,999 | 18 (8.7%) | 2 (4.9%) |
| $150,000 or more | 5 (2.4%) | 1 (2.4%) |
| Total | 206 (100.0%) | 41 (100.0%) |
Monthly Housing Cost Tiers in Farmington
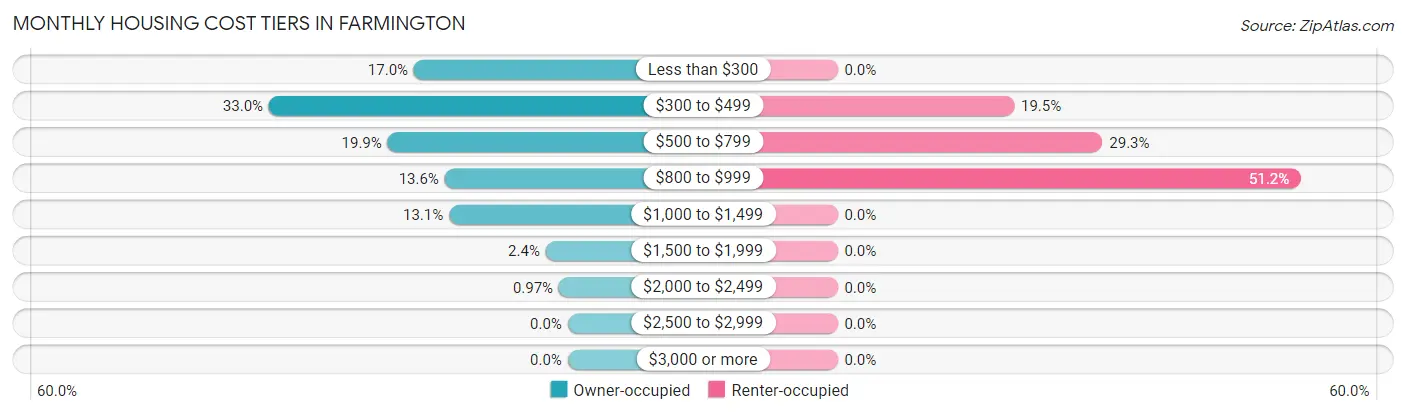
| Monthly Cost | Owner-occupied | Renter-occupied |
| Less than $300 | 35 (17.0%) | 0 (0.0%) |
| $300 to $499 | 68 (33.0%) | 8 (19.5%) |
| $500 to $799 | 41 (19.9%) | 12 (29.3%) |
| $800 to $999 | 28 (13.6%) | 21 (51.2%) |
| $1,000 to $1,499 | 27 (13.1%) | 0 (0.0%) |
| $1,500 to $1,999 | 5 (2.4%) | 0 (0.0%) |
| $2,000 to $2,499 | 2 (1.0%) | 0 (0.0%) |
| $2,500 to $2,999 | 0 (0.0%) | 0 (0.0%) |
| $3,000 or more | 0 (0.0%) | 0 (0.0%) |
| Total | 206 (100.0%) | 41 (100.0%) |
Physical Housing Characteristics in Farmington
Housing Structures in Farmington
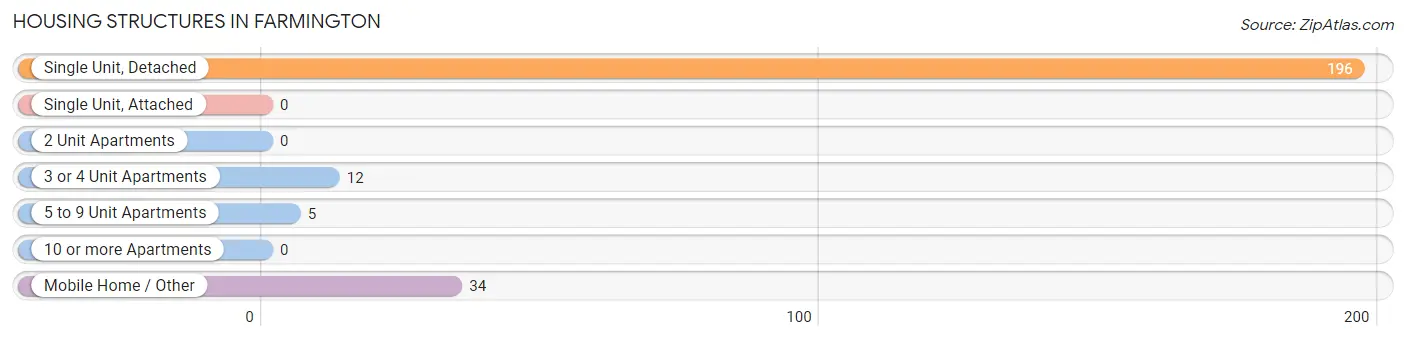
| Structure Type | # Housing Units | % Housing Units |
| Single Unit, Detached | 196 | 79.3% |
| Single Unit, Attached | 0 | 0.0% |
| 2 Unit Apartments | 0 | 0.0% |
| 3 or 4 Unit Apartments | 12 | 4.9% |
| 5 to 9 Unit Apartments | 5 | 2.0% |
| 10 or more Apartments | 0 | 0.0% |
| Mobile Home / Other | 34 | 13.8% |
| Total | 247 | 100.0% |
Housing Structures by Occupancy in Farmington
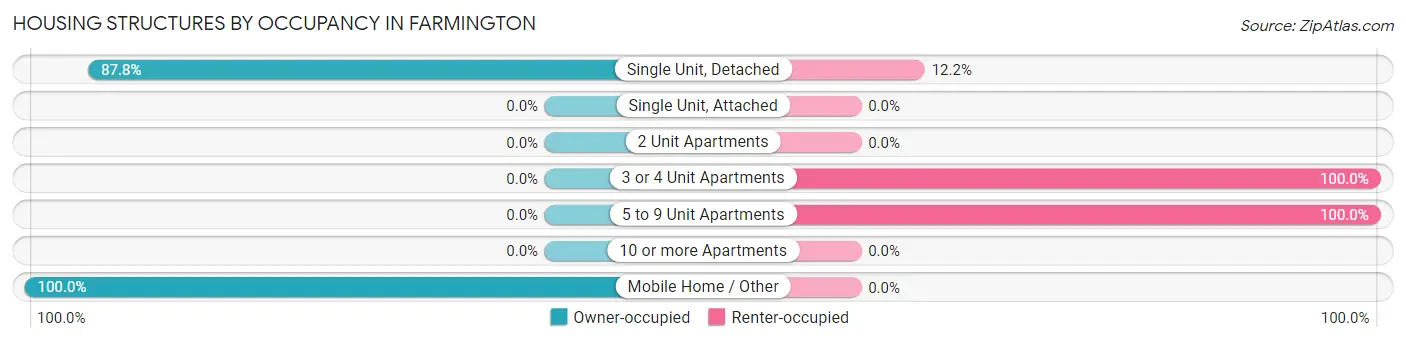
| Structure Type | Owner-occupied | Renter-occupied |
| Single Unit, Detached | 172 (87.8%) | 24 (12.2%) |
| Single Unit, Attached | 0 (0.0%) | 0 (0.0%) |
| 2 Unit Apartments | 0 (0.0%) | 0 (0.0%) |
| 3 or 4 Unit Apartments | 0 (0.0%) | 12 (100.0%) |
| 5 to 9 Unit Apartments | 0 (0.0%) | 5 (100.0%) |
| 10 or more Apartments | 0 (0.0%) | 0 (0.0%) |
| Mobile Home / Other | 34 (100.0%) | 0 (0.0%) |
| Total | 206 (83.4%) | 41 (16.6%) |
Housing Structures by Number of Rooms in Farmington
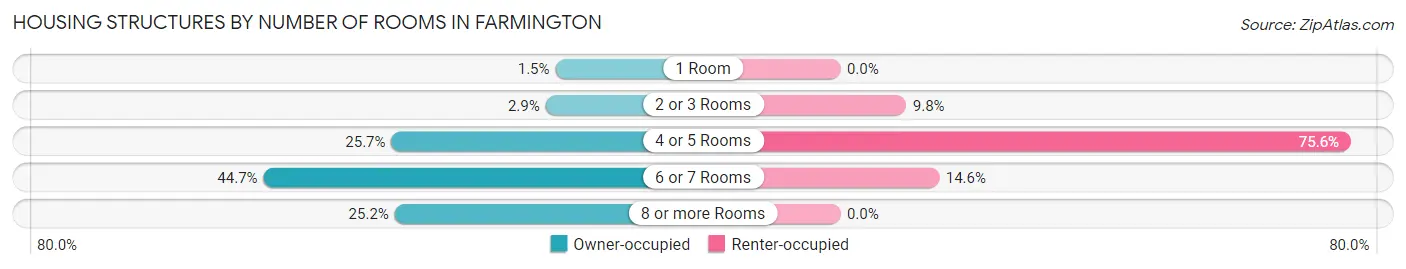
| Number of Rooms | Owner-occupied | Renter-occupied |
| 1 Room | 3 (1.5%) | 0 (0.0%) |
| 2 or 3 Rooms | 6 (2.9%) | 4 (9.8%) |
| 4 or 5 Rooms | 53 (25.7%) | 31 (75.6%) |
| 6 or 7 Rooms | 92 (44.7%) | 6 (14.6%) |
| 8 or more Rooms | 52 (25.2%) | 0 (0.0%) |
| Total | 206 (100.0%) | 41 (100.0%) |
Housing Structure by Heating Type in Farmington
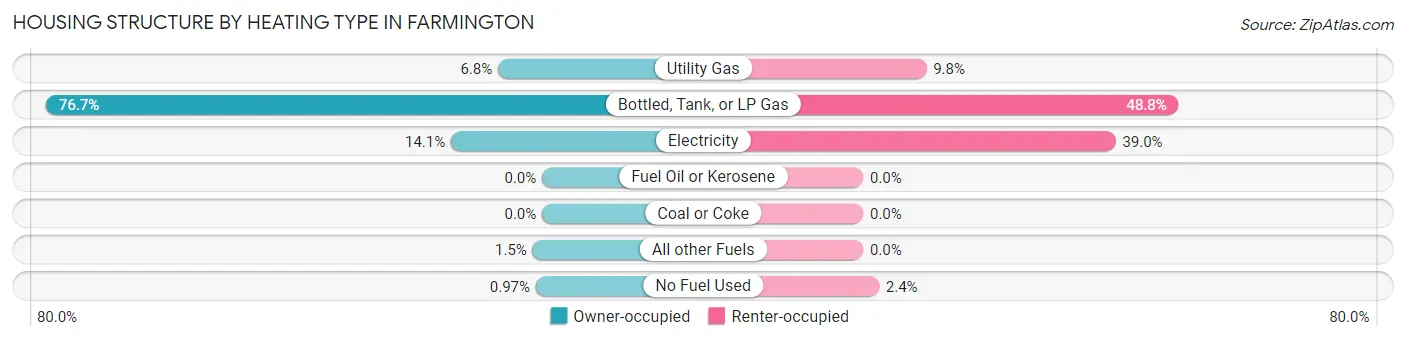
| Heating Type | Owner-occupied | Renter-occupied |
| Utility Gas | 14 (6.8%) | 4 (9.8%) |
| Bottled, Tank, or LP Gas | 158 (76.7%) | 20 (48.8%) |
| Electricity | 29 (14.1%) | 16 (39.0%) |
| Fuel Oil or Kerosene | 0 (0.0%) | 0 (0.0%) |
| Coal or Coke | 0 (0.0%) | 0 (0.0%) |
| All other Fuels | 3 (1.5%) | 0 (0.0%) |
| No Fuel Used | 2 (1.0%) | 1 (2.4%) |
| Total | 206 (100.0%) | 41 (100.0%) |
Household Vehicle Usage in Farmington
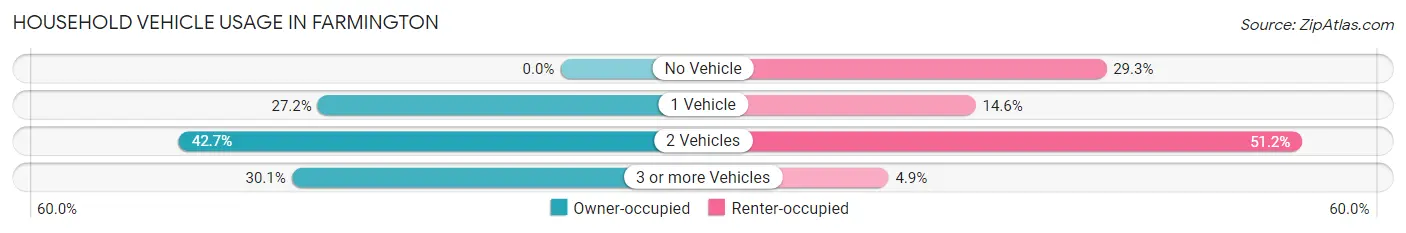
| Vehicles per Household | Owner-occupied | Renter-occupied |
| No Vehicle | 0 (0.0%) | 12 (29.3%) |
| 1 Vehicle | 56 (27.2%) | 6 (14.6%) |
| 2 Vehicles | 88 (42.7%) | 21 (51.2%) |
| 3 or more Vehicles | 62 (30.1%) | 2 (4.9%) |
| Total | 206 (100.0%) | 41 (100.0%) |
Real Estate & Mortgages in Farmington
Real Estate and Mortgage Overview in Farmington
| Characteristic | Without Mortgage | With Mortgage |
| Housing Units | 135 | 71 |
| Median Property Value | $44,200 | $83,600 |
| Median Household Income | $56,458 | $0 |
| Monthly Housing Costs | $401 | $0 |
| Real Estate Taxes | $743 | $0 |
Property Value by Mortgage Status in Farmington
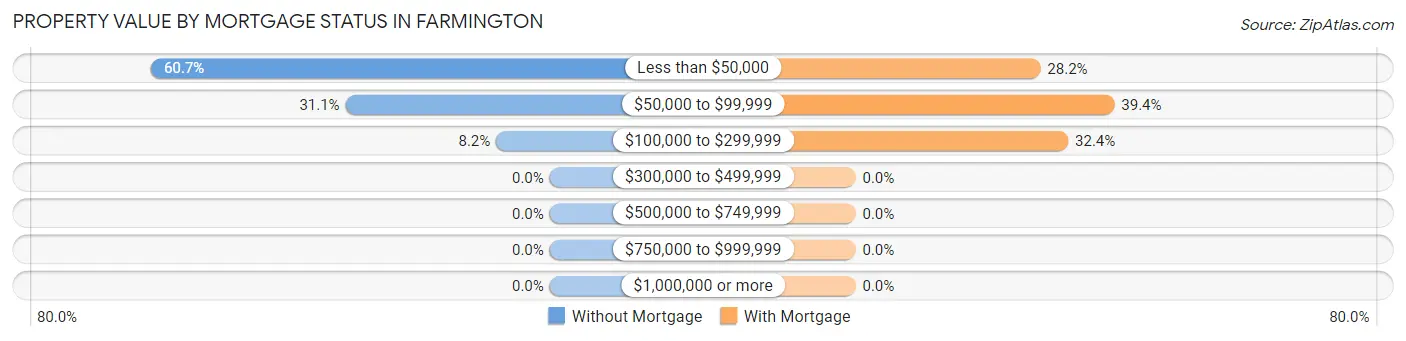
| Property Value | Without Mortgage | With Mortgage |
| Less than $50,000 | 82 (60.7%) | 20 (28.2%) |
| $50,000 to $99,999 | 42 (31.1%) | 28 (39.4%) |
| $100,000 to $299,999 | 11 (8.2%) | 23 (32.4%) |
| $300,000 to $499,999 | 0 (0.0%) | 0 (0.0%) |
| $500,000 to $749,999 | 0 (0.0%) | 0 (0.0%) |
| $750,000 to $999,999 | 0 (0.0%) | 0 (0.0%) |
| $1,000,000 or more | 0 (0.0%) | 0 (0.0%) |
| Total | 135 (100.0%) | 71 (100.0%) |
Household Income by Mortgage Status in Farmington
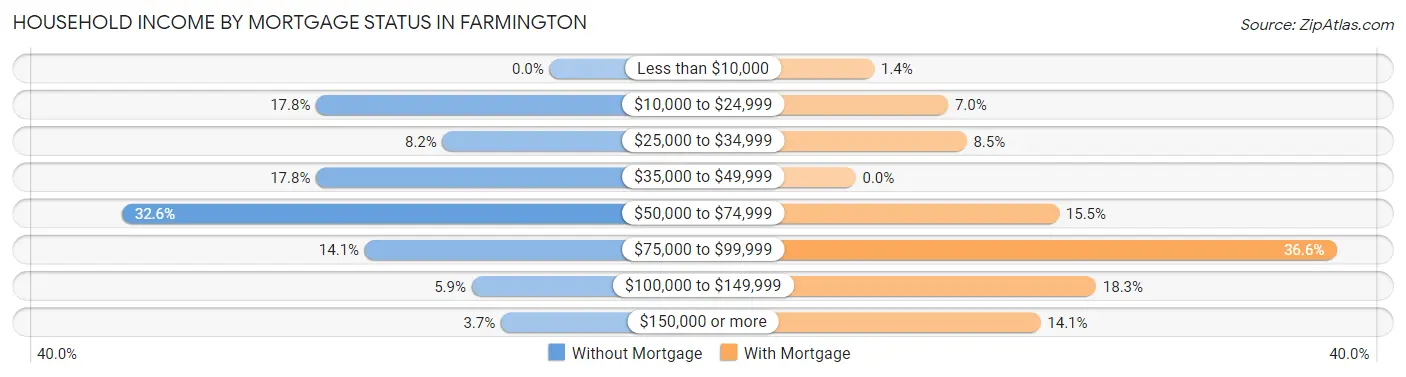
| Household Income | Without Mortgage | With Mortgage |
| Less than $10,000 | 0 (0.0%) | 1 (1.4%) |
| $10,000 to $24,999 | 24 (17.8%) | 5 (7.0%) |
| $25,000 to $34,999 | 11 (8.2%) | 6 (8.5%) |
| $35,000 to $49,999 | 24 (17.8%) | 0 (0.0%) |
| $50,000 to $74,999 | 44 (32.6%) | 11 (15.5%) |
| $75,000 to $99,999 | 19 (14.1%) | 26 (36.6%) |
| $100,000 to $149,999 | 8 (5.9%) | 13 (18.3%) |
| $150,000 or more | 5 (3.7%) | 10 (14.1%) |
| Total | 135 (100.0%) | 71 (100.0%) |
Property Value to Household Income Ratio in Farmington
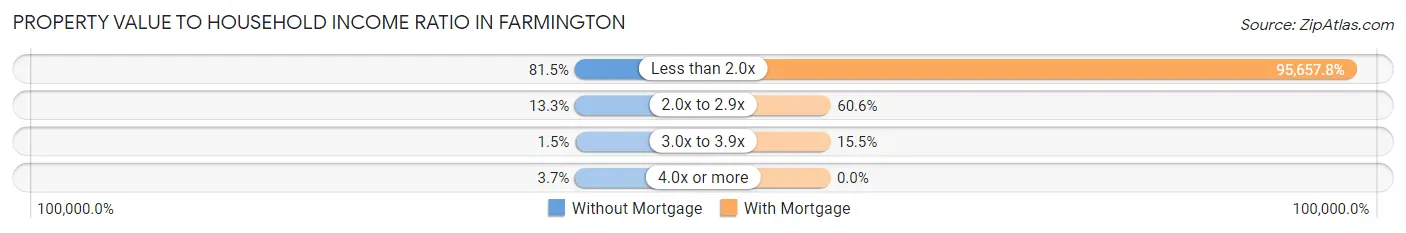
| Value-to-Income Ratio | Without Mortgage | With Mortgage |
| Less than 2.0x | 110 (81.5%) | 67,917 (95,657.7%) |
| 2.0x to 2.9x | 18 (13.3%) | 43 (60.6%) |
| 3.0x to 3.9x | 2 (1.5%) | 11 (15.5%) |
| 4.0x or more | 5 (3.7%) | 0 (0.0%) |
| Total | 135 (100.0%) | 71 (100.0%) |
Real Estate Taxes by Mortgage Status in Farmington
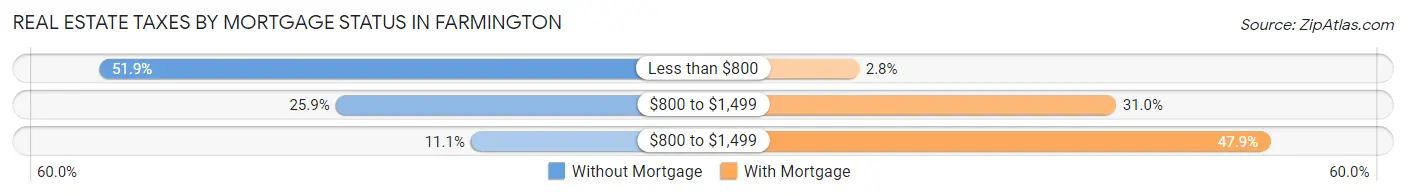
| Property Taxes | Without Mortgage | With Mortgage |
| Less than $800 | 70 (51.8%) | 2 (2.8%) |
| $800 to $1,499 | 35 (25.9%) | 22 (31.0%) |
| $800 to $1,499 | 15 (11.1%) | 34 (47.9%) |
| Total | 135 (100.0%) | 71 (100.0%) |
Health & Disability in Farmington
Health Insurance Coverage by Age in Farmington
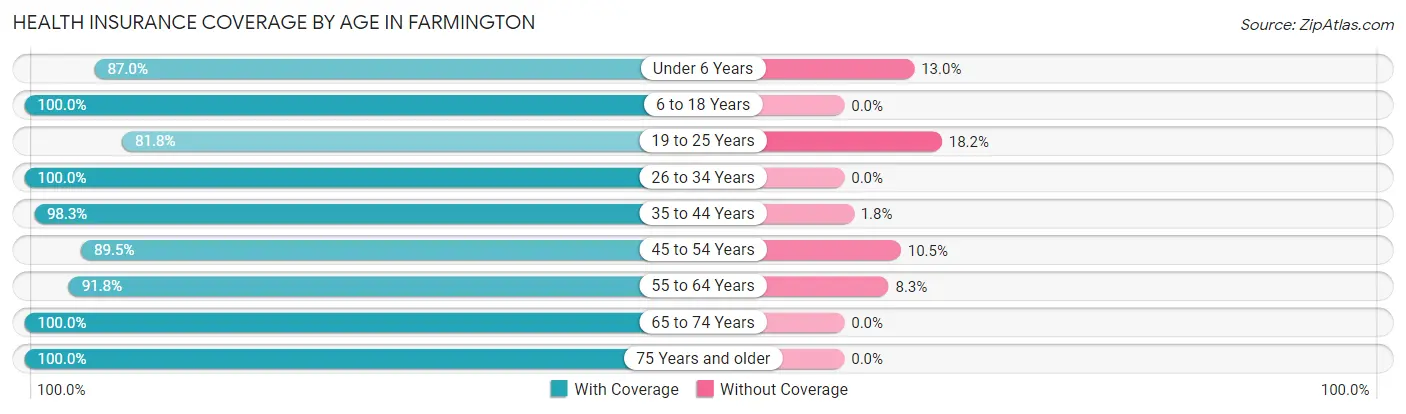
| Age Bracket | With Coverage | Without Coverage |
| Under 6 Years | 20 (87.0%) | 3 (13.0%) |
| 6 to 18 Years | 84 (100.0%) | 0 (0.0%) |
| 19 to 25 Years | 27 (81.8%) | 6 (18.2%) |
| 26 to 34 Years | 37 (100.0%) | 0 (0.0%) |
| 35 to 44 Years | 56 (98.3%) | 1 (1.8%) |
| 45 to 54 Years | 68 (89.5%) | 8 (10.5%) |
| 55 to 64 Years | 89 (91.7%) | 8 (8.3%) |
| 65 to 74 Years | 73 (100.0%) | 0 (0.0%) |
| 75 Years and older | 26 (100.0%) | 0 (0.0%) |
| Total | 480 (94.9%) | 26 (5.1%) |
Health Insurance Coverage by Citizenship Status in Farmington
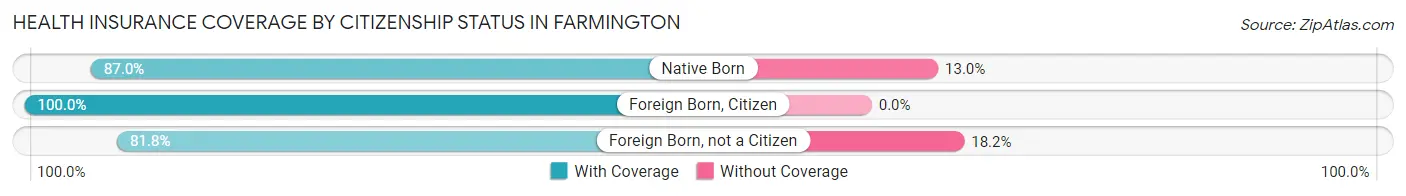
| Citizenship Status | With Coverage | Without Coverage |
| Native Born | 20 (87.0%) | 3 (13.0%) |
| Foreign Born, Citizen | 84 (100.0%) | 0 (0.0%) |
| Foreign Born, not a Citizen | 27 (81.8%) | 6 (18.2%) |
Health Insurance Coverage by Household Income in Farmington
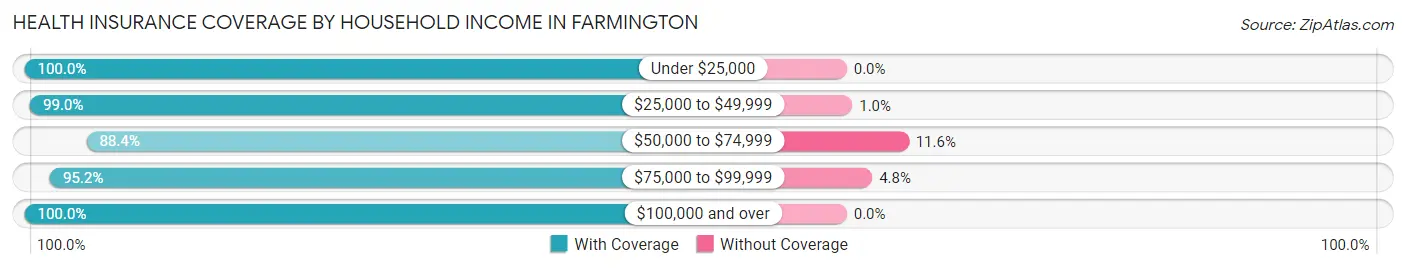
| Household Income | With Coverage | Without Coverage |
| Under $25,000 | 63 (100.0%) | 0 (0.0%) |
| $25,000 to $49,999 | 96 (99.0%) | 1 (1.0%) |
| $50,000 to $74,999 | 160 (88.4%) | 21 (11.6%) |
| $75,000 to $99,999 | 80 (95.2%) | 4 (4.8%) |
| $100,000 and over | 81 (100.0%) | 0 (0.0%) |
Public vs Private Health Insurance Coverage by Age in Farmington
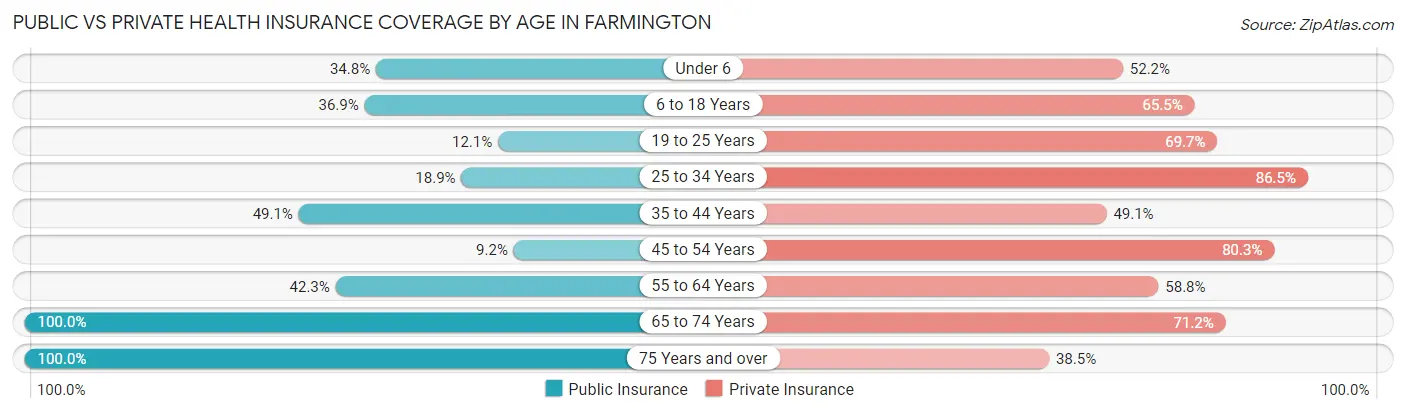
| Age Bracket | Public Insurance | Private Insurance |
| Under 6 | 8 (34.8%) | 12 (52.2%) |
| 6 to 18 Years | 31 (36.9%) | 55 (65.5%) |
| 19 to 25 Years | 4 (12.1%) | 23 (69.7%) |
| 25 to 34 Years | 7 (18.9%) | 32 (86.5%) |
| 35 to 44 Years | 28 (49.1%) | 28 (49.1%) |
| 45 to 54 Years | 7 (9.2%) | 61 (80.3%) |
| 55 to 64 Years | 41 (42.3%) | 57 (58.8%) |
| 65 to 74 Years | 73 (100.0%) | 52 (71.2%) |
| 75 Years and over | 26 (100.0%) | 10 (38.5%) |
| Total | 225 (44.5%) | 330 (65.2%) |
Disability Status by Sex by Age in Farmington
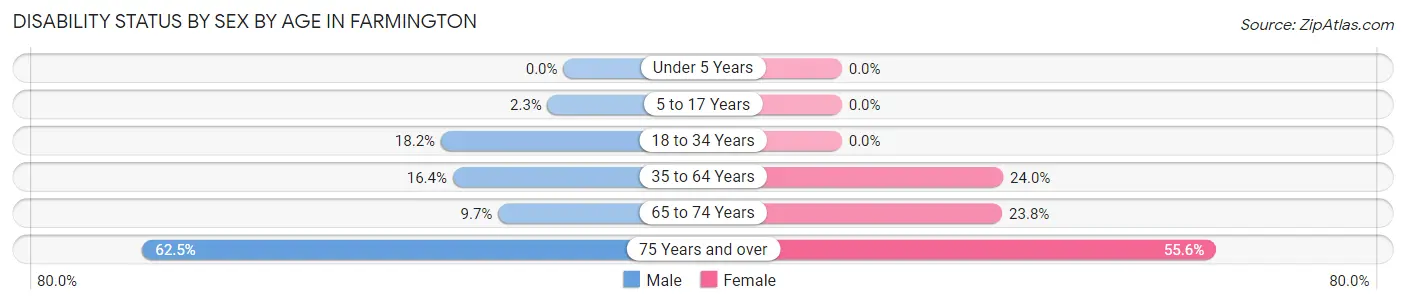
| Age Bracket | Male | Female |
| Under 5 Years | 0 (0.0%) | 0 (0.0%) |
| 5 to 17 Years | 1 (2.3%) | 0 (0.0%) |
| 18 to 34 Years | 6 (18.2%) | 0 (0.0%) |
| 35 to 64 Years | 22 (16.4%) | 23 (24.0%) |
| 65 to 74 Years | 3 (9.7%) | 10 (23.8%) |
| 75 Years and over | 5 (62.5%) | 10 (55.6%) |
Disability Class by Sex by Age in Farmington
Disability Class: Hearing Difficulty
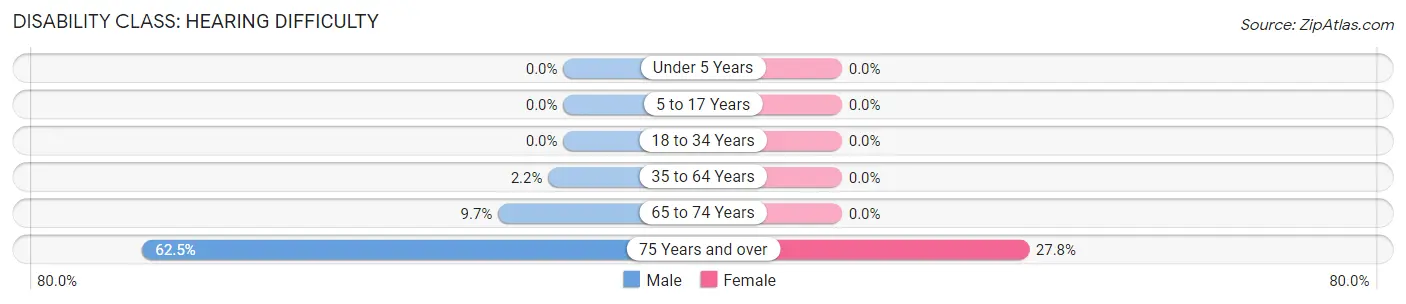
| Age Bracket | Male | Female |
| Under 5 Years | 0 (0.0%) | 0 (0.0%) |
| 5 to 17 Years | 0 (0.0%) | 0 (0.0%) |
| 18 to 34 Years | 0 (0.0%) | 0 (0.0%) |
| 35 to 64 Years | 3 (2.2%) | 0 (0.0%) |
| 65 to 74 Years | 3 (9.7%) | 0 (0.0%) |
| 75 Years and over | 5 (62.5%) | 5 (27.8%) |
Disability Class: Vision Difficulty
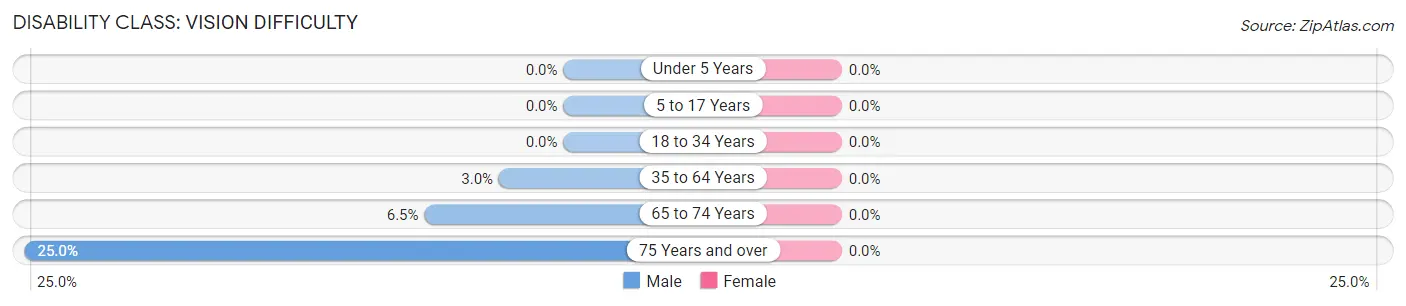
| Age Bracket | Male | Female |
| Under 5 Years | 0 (0.0%) | 0 (0.0%) |
| 5 to 17 Years | 0 (0.0%) | 0 (0.0%) |
| 18 to 34 Years | 0 (0.0%) | 0 (0.0%) |
| 35 to 64 Years | 4 (3.0%) | 0 (0.0%) |
| 65 to 74 Years | 2 (6.5%) | 0 (0.0%) |
| 75 Years and over | 2 (25.0%) | 0 (0.0%) |
Disability Class: Cognitive Difficulty
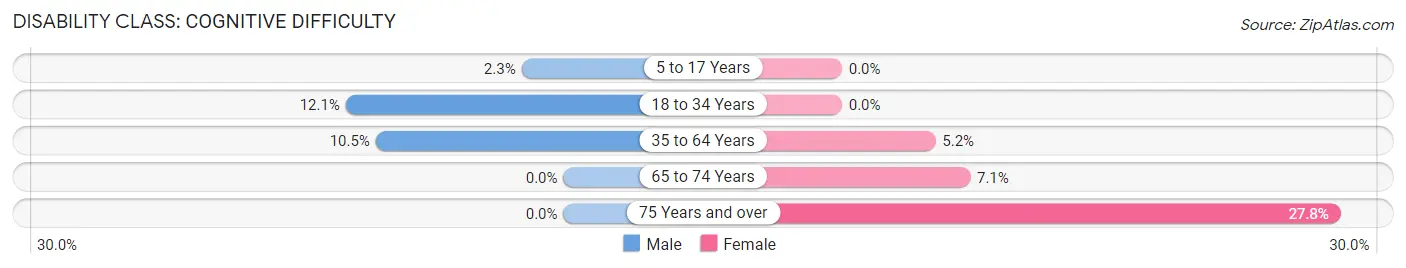
| Age Bracket | Male | Female |
| 5 to 17 Years | 1 (2.3%) | 0 (0.0%) |
| 18 to 34 Years | 4 (12.1%) | 0 (0.0%) |
| 35 to 64 Years | 14 (10.4%) | 5 (5.2%) |
| 65 to 74 Years | 0 (0.0%) | 3 (7.1%) |
| 75 Years and over | 0 (0.0%) | 5 (27.8%) |
Disability Class: Ambulatory Difficulty
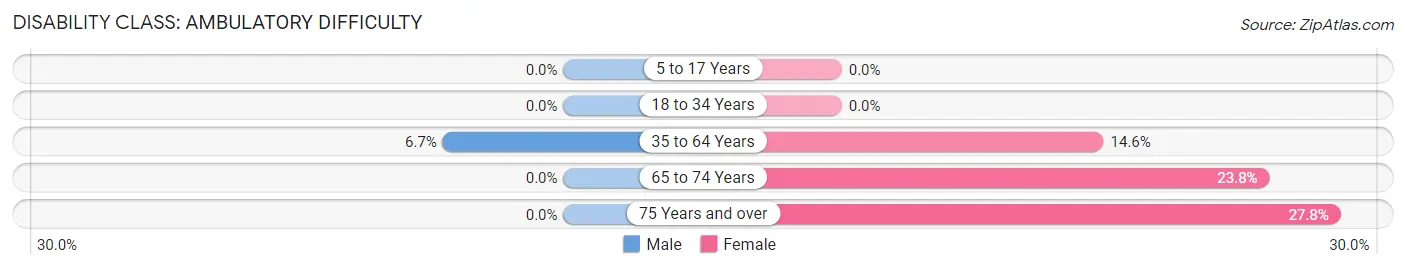
| Age Bracket | Male | Female |
| 5 to 17 Years | 0 (0.0%) | 0 (0.0%) |
| 18 to 34 Years | 0 (0.0%) | 0 (0.0%) |
| 35 to 64 Years | 9 (6.7%) | 14 (14.6%) |
| 65 to 74 Years | 0 (0.0%) | 10 (23.8%) |
| 75 Years and over | 0 (0.0%) | 5 (27.8%) |
Disability Class: Self-Care Difficulty
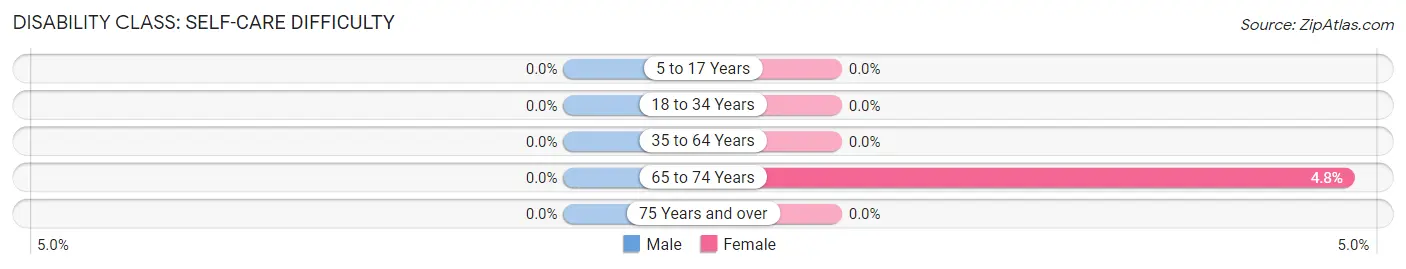
| Age Bracket | Male | Female |
| 5 to 17 Years | 0 (0.0%) | 0 (0.0%) |
| 18 to 34 Years | 0 (0.0%) | 0 (0.0%) |
| 35 to 64 Years | 0 (0.0%) | 0 (0.0%) |
| 65 to 74 Years | 0 (0.0%) | 2 (4.8%) |
| 75 Years and over | 0 (0.0%) | 0 (0.0%) |
Technology Access in Farmington
Computing Device Access in Farmington
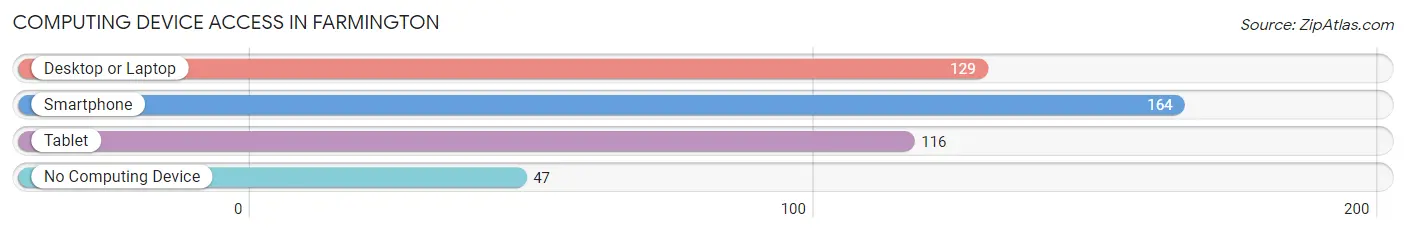
| Device Type | # Households | % Households |
| Desktop or Laptop | 129 | 52.2% |
| Smartphone | 164 | 66.4% |
| Tablet | 116 | 47.0% |
| No Computing Device | 47 | 19.0% |
| Total | 247 | 100.0% |
Internet Access in Farmington
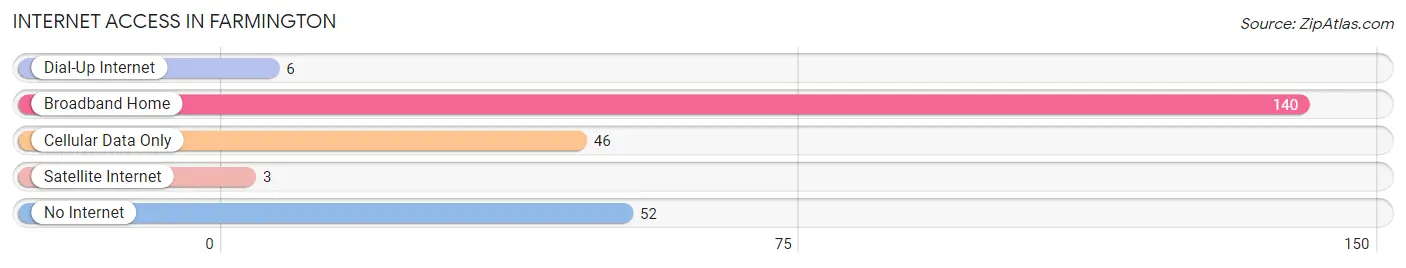
| Internet Type | # Households | % Households |
| Dial-Up Internet | 6 | 2.4% |
| Broadband Home | 140 | 56.7% |
| Cellular Data Only | 46 | 18.6% |
| Satellite Internet | 3 | 1.2% |
| No Internet | 52 | 21.0% |
| Total | 247 | 100.0% |
Farmington Summary
History
The city of Farmington, Iowa is located in Van Buren County in the southeastern part of the state. It is situated on the banks of the Des Moines River, and is part of the Keosauqua Micropolitan Statistical Area. The city was founded in 1837 by a group of settlers from Ohio, led by William and Mary Ann Smith. The city was named after the Smiths’ hometown of Farmington, Ohio.
The city of Farmington was incorporated in 1851, and the first mayor was William Smith. The city quickly grew and prospered, and by the late 19th century, it was a thriving agricultural and commercial center. The city was home to several businesses, including a flour mill, a sawmill, a brickyard, and a furniture factory.
In the early 20th century, the city continued to grow and prosper. The population increased from 1,000 in 1900 to over 2,000 by 1920. The city was home to several churches, schools, and businesses, and was a popular tourist destination.
Geography
Farmington is located in Van Buren County in the southeastern part of Iowa. It is situated on the banks of the Des Moines River, and is part of the Keosauqua Micropolitan Statistical Area. The city has a total area of 2.2 square miles, all of which is land.
The city is located in a hilly region, with the highest point being the summit of the Des Moines River at an elevation of 845 feet. The city is located in a humid continental climate zone, with hot summers and cold winters. The average annual temperature is around 50 degrees Fahrenheit, and the average annual precipitation is around 36 inches.
Economy
The economy of Farmington is largely based on agriculture and manufacturing. The city is home to several large farms, which produce a variety of crops, including corn, soybeans, and hay. The city is also home to several manufacturing companies, which produce a variety of products, including furniture, clothing, and automotive parts.
The city is also home to several retail stores, restaurants, and other businesses. The city is served by the Burlington Northern Santa Fe Railroad, which provides freight service to the city.
Demographics
As of the 2010 census, the population of Farmington was 2,072. The racial makeup of the city was 97.3% White, 0.7% African American, 0.2% Native American, 0.3% Asian, 0.1% Pacific Islander, 0.4% from other races, and 1.0% from two or more races. Hispanic or Latino of any race were 1.3% of the population.
The median income for a household in the city was $41,250, and the median income for a family was $50,000. The per capita income for the city was $20,845. About 11.2% of families and 14.2% of the population were below the poverty line, including 18.2% of those under age 18 and 8.3% of those age 65 or over.
Common Questions
What is Per Capita Income in Farmington?
Per Capita income in Farmington is $28,565.
What is the Median Family Income in Farmington?
Median Family Income in Farmington is $67,917.
What is the Median Household income in Farmington?
Median Household Income in Farmington is $55,625.
What is Income or Wage Gap in Farmington?
Income or Wage Gap in Farmington is 47.5%.
Women in Farmington earn 52.5 cents for every dollar earned by a man.
What is Inequality or Gini Index in Farmington?
Inequality or Gini Index in Farmington is 0.36.
What is the Total Population of Farmington?
Total Population of Farmington is 506.
What is the Total Male Population of Farmington?
Total Male Population of Farmington is 263.
What is the Total Female Population of Farmington?
Total Female Population of Farmington is 243.
What is the Ratio of Males per 100 Females in Farmington?
There are 108.23 Males per 100 Females in Farmington.
What is the Ratio of Females per 100 Males in Farmington?
There are 92.40 Females per 100 Males in Farmington.
What is the Median Population Age in Farmington?
Median Population Age in Farmington is 48.3 Years.
What is the Average Family Size in Farmington
Average Family Size in Farmington is 3.1 People.
What is the Average Household Size in Farmington
Average Household Size in Farmington is 2.0 People.
How Large is the Labor Force in Farmington?
There are 230 People in the Labor Forcein in Farmington.
What is the Percentage of People in the Labor Force in Farmington?
54.9% of People are in the Labor Force in Farmington.
What is the Unemployment Rate in Farmington?
Unemployment Rate in Farmington is 2.6%.