Maurice, IA Map & Demographics
Maurice Map
Maurice Overview
$46,958
PER CAPITA INCOME
$91,250
AVG FAMILY INCOME
$78,958
AVG HOUSEHOLD INCOME
57.2%
WAGE / INCOME GAP [ % ]
42.8¢/ $1
WAGE / INCOME GAP [ $ ]
0.48
INEQUALITY / GINI INDEX
246
TOTAL POPULATION
119
MALE POPULATION
127
FEMALE POPULATION
93.70
MALES / 100 FEMALES
106.72
FEMALES / 100 MALES
47.5
MEDIAN AGE
2.7
AVG FAMILY SIZE
2.3
AVG HOUSEHOLD SIZE
143
LABOR FORCE [ PEOPLE ]
75.3%
PERCENT IN LABOR FORCE
1.4%
UNEMPLOYMENT RATE
Maurice Zip Codes
Maurice Area Codes
Income in Maurice
Income Overview in Maurice
Per Capita Income in Maurice is $46,958, while median incomes of families and households are $91,250 and $78,958 respectively.
| Characteristic | Number | Measure |
| Per Capita Income | 246 | $46,958 |
| Median Family Income | 74 | $91,250 |
| Mean Family Income | 74 | $106,962 |
| Median Household Income | 105 | $78,958 |
| Mean Household Income | 105 | $112,306 |
| Income Deficit | 74 | $0 |
| Wage / Income Gap (%) | 246 | 57.16% |
| Wage / Income Gap ($) | 246 | 42.84¢ per $1 |
| Gini / Inequality Index | 246 | 0.48 |
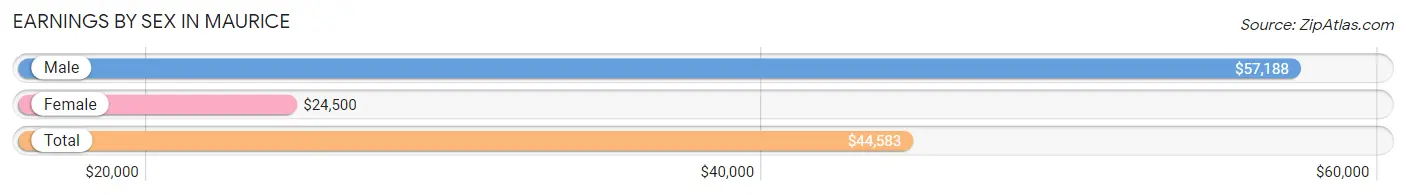
Earnings by Sex in Maurice
Average Earnings in Maurice are $44,583, $57,188 for men and $24,500 for women, a difference of 57.2%.
| Sex | Number | Average Earnings |
| Male | 77 (50.3%) | $57,188 |
| Female | 76 (49.7%) | $24,500 |
| Total | 153 (100.0%) | $44,583 |
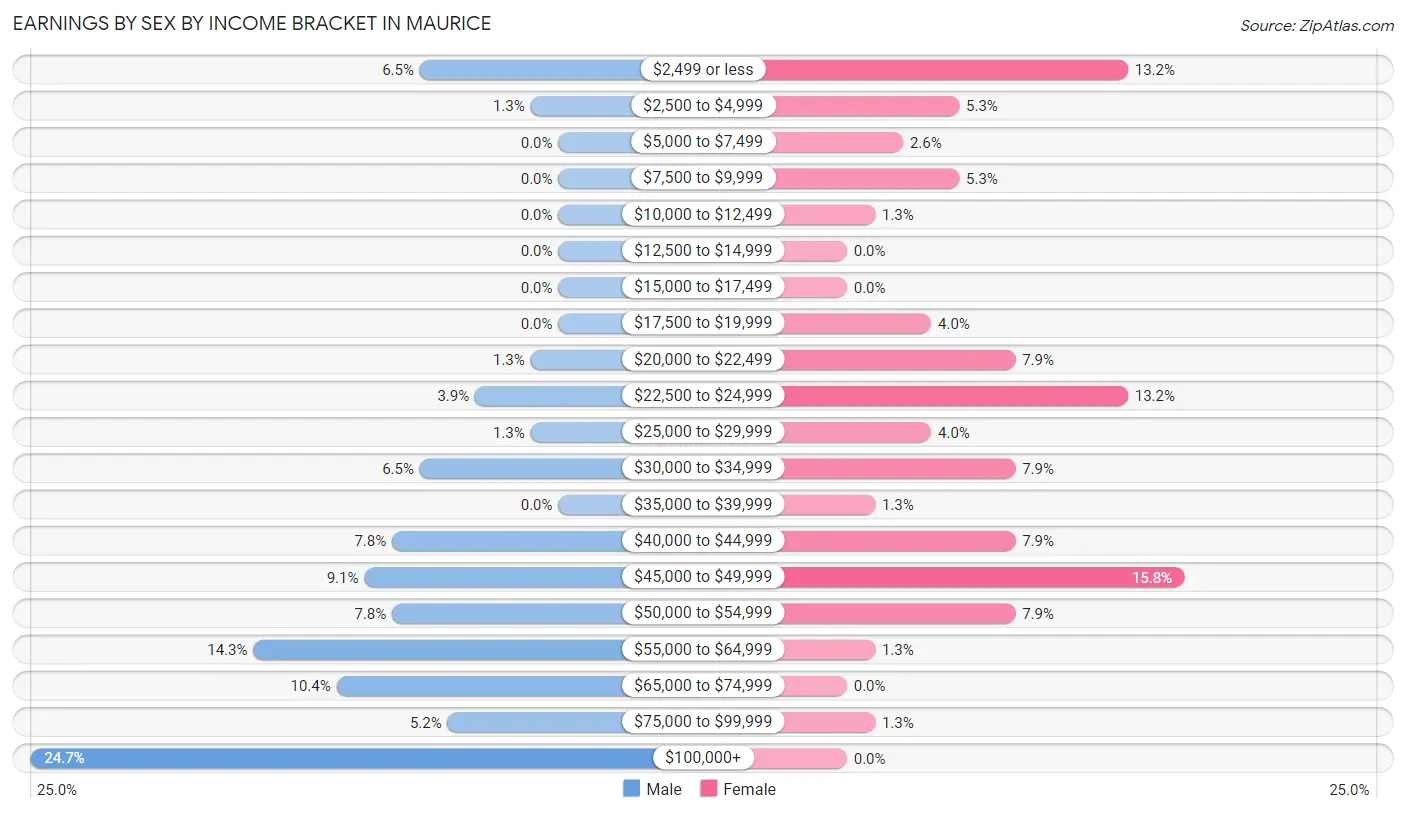
Earnings by Sex by Income Bracket in Maurice
The most common earnings brackets in Maurice are $100,000+ for men (19 | 24.7%) and $45,000 to $49,999 for women (12 | 15.8%).
| Income | Male | Female |
| $2,499 or less | 5 (6.5%) | 10 (13.2%) |
| $2,500 to $4,999 | 1 (1.3%) | 4 (5.3%) |
| $5,000 to $7,499 | 0 (0.0%) | 2 (2.6%) |
| $7,500 to $9,999 | 0 (0.0%) | 4 (5.3%) |
| $10,000 to $12,499 | 0 (0.0%) | 1 (1.3%) |
| $12,500 to $14,999 | 0 (0.0%) | 0 (0.0%) |
| $15,000 to $17,499 | 0 (0.0%) | 0 (0.0%) |
| $17,500 to $19,999 | 0 (0.0%) | 3 (4.0%) |
| $20,000 to $22,499 | 1 (1.3%) | 6 (7.9%) |
| $22,500 to $24,999 | 3 (3.9%) | 10 (13.2%) |
| $25,000 to $29,999 | 1 (1.3%) | 3 (4.0%) |
| $30,000 to $34,999 | 5 (6.5%) | 6 (7.9%) |
| $35,000 to $39,999 | 0 (0.0%) | 1 (1.3%) |
| $40,000 to $44,999 | 6 (7.8%) | 6 (7.9%) |
| $45,000 to $49,999 | 7 (9.1%) | 12 (15.8%) |
| $50,000 to $54,999 | 6 (7.8%) | 6 (7.9%) |
| $55,000 to $64,999 | 11 (14.3%) | 1 (1.3%) |
| $65,000 to $74,999 | 8 (10.4%) | 0 (0.0%) |
| $75,000 to $99,999 | 4 (5.2%) | 1 (1.3%) |
| $100,000+ | 19 (24.7%) | 0 (0.0%) |
| Total | 77 (100.0%) | 76 (100.0%) |
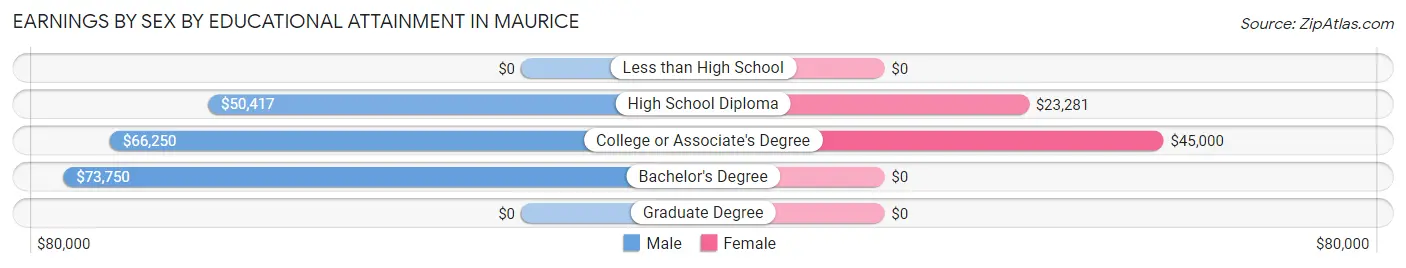
Earnings by Sex by Educational Attainment in Maurice
Average earnings in Maurice are $60,000 for men and $24,875 for women, a difference of 58.5%. Men with an educational attainment of bachelor's degree enjoy the highest average annual earnings of $73,750, while those with high school diploma education earn the least with $50,417. Women with an educational attainment of college or associate's degree earn the most with the average annual earnings of $45,000, while those with high school diploma education have the smallest earnings of $23,281.
| Educational Attainment | Male Income | Female Income |
| Less than High School | - | - |
| High School Diploma | $50,417 | $23,281 |
| College or Associate's Degree | $66,250 | $45,000 |
| Bachelor's Degree | $73,750 | $0 |
| Graduate Degree | - | - |
| Total | $60,000 | $24,875 |
Family Income in Maurice
Family Income Brackets in Maurice
According to the Maurice family income data, there are 16 families falling into the $75,000 to $99,999 income range, which is the most common income bracket and makes up 21.6% of all families. Conversely, the less than $10,000 income bracket is the least frequent group with only 1 families (1.3%) belonging to this category.
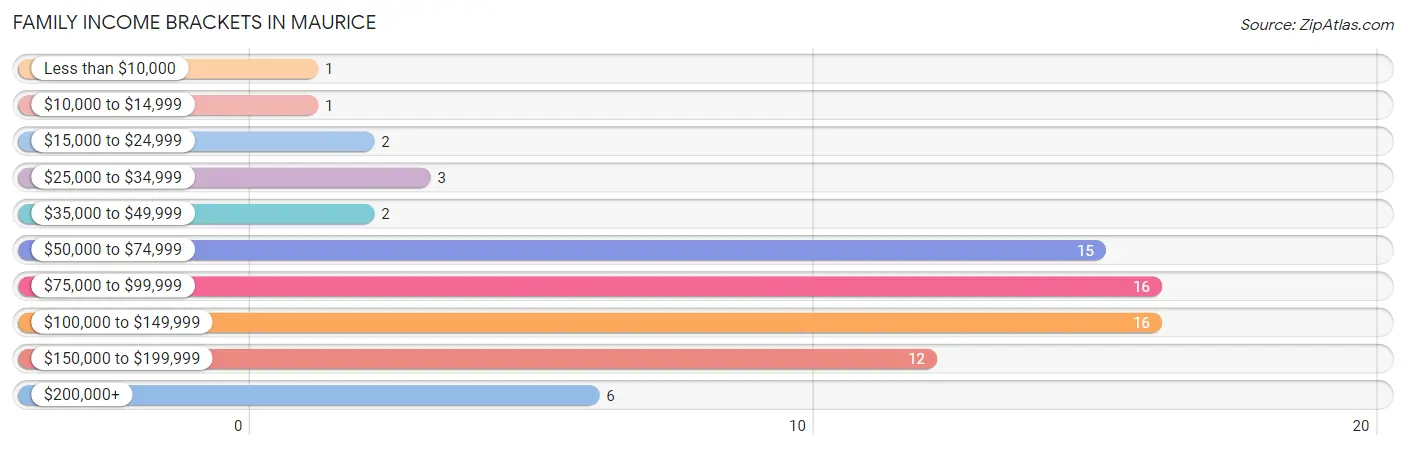
| Income Bracket | # Families | % Families |
| Less than $10,000 | 1 | 1.4% |
| $10,000 to $14,999 | 1 | 1.4% |
| $15,000 to $24,999 | 2 | 2.7% |
| $25,000 to $34,999 | 3 | 4.1% |
| $35,000 to $49,999 | 2 | 2.7% |
| $50,000 to $74,999 | 15 | 20.3% |
| $75,000 to $99,999 | 16 | 21.6% |
| $100,000 to $149,999 | 16 | 21.6% |
| $150,000 to $199,999 | 12 | 16.2% |
| $200,000+ | 6 | 8.1% |
Family Income by Famaliy Size in Maurice
3-person families (10 | 13.5%) account for the highest median family income in Maurice with $171,250 per family, while 3-person families (10 | 13.5%) have the highest median income of $57,083 per family member.
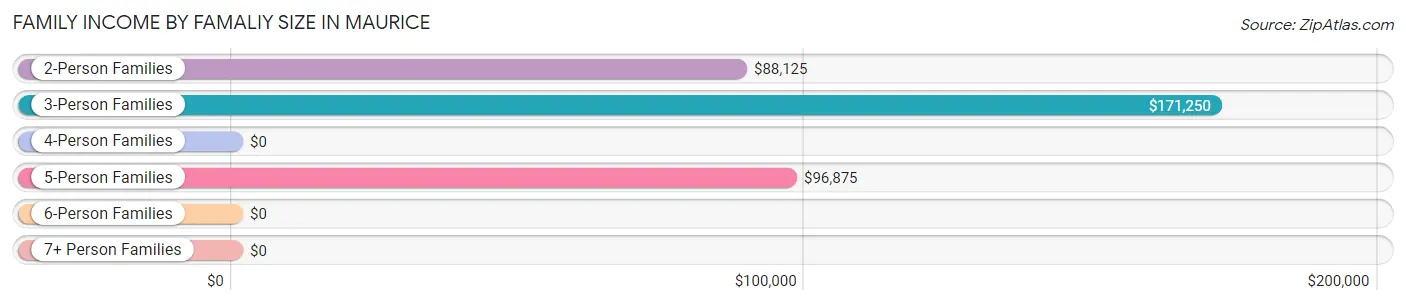
| Income Bracket | # Families | Median Income |
| 2-Person Families | 53 (71.6%) | $88,125 |
| 3-Person Families | 10 (13.5%) | $171,250 |
| 4-Person Families | 4 (5.4%) | $0 |
| 5-Person Families | 5 (6.8%) | $96,875 |
| 6-Person Families | 0 (0.0%) | $0 |
| 7+ Person Families | 2 (2.7%) | $0 |
| Total | 74 (100.0%) | $91,250 |
Family Income by Number of Earners in Maurice
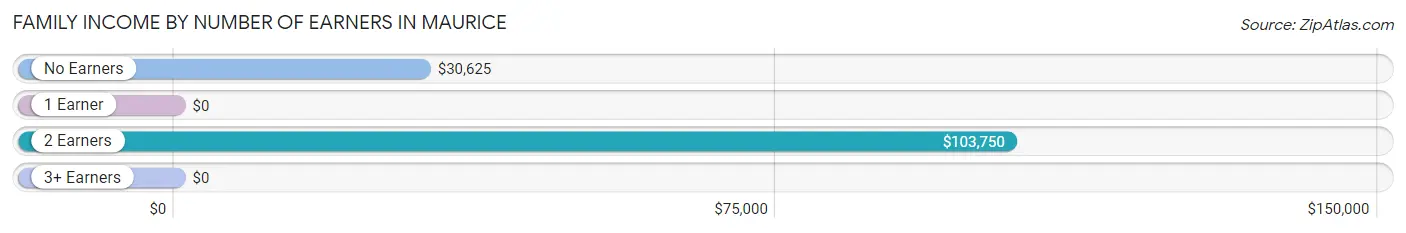
| Number of Earners | # Families | Median Income |
| No Earners | 5 (6.8%) | $30,625 |
| 1 Earner | 20 (27.0%) | $0 |
| 2 Earners | 47 (63.5%) | $103,750 |
| 3+ Earners | 2 (2.7%) | $0 |
| Total | 74 (100.0%) | $91,250 |
Household Income in Maurice
Household Income Brackets in Maurice
With 21 households falling in the category, the $75,000 to $99,999 income range is the most frequent in Maurice, accounting for 20.0% of all households. In contrast, only 2 households (1.9%) fall into the $10,000 to $14,999 income bracket, making it the least populous group.
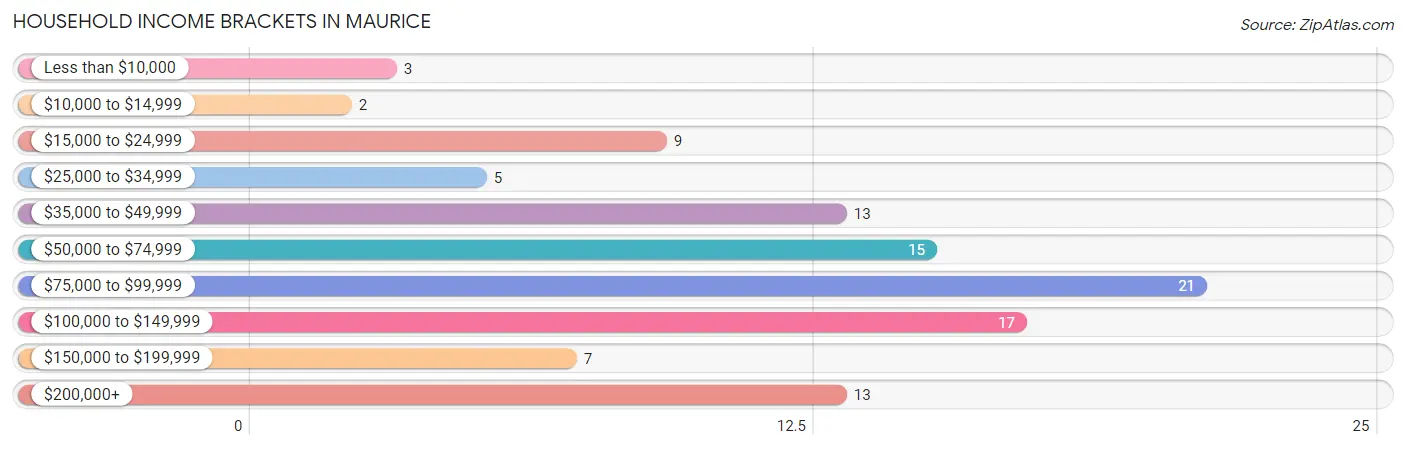
| Income Bracket | # Households | % Households |
| Less than $10,000 | 3 | 2.9% |
| $10,000 to $14,999 | 2 | 1.9% |
| $15,000 to $24,999 | 9 | 8.6% |
| $25,000 to $34,999 | 5 | 4.8% |
| $35,000 to $49,999 | 13 | 12.4% |
| $50,000 to $74,999 | 15 | 14.3% |
| $75,000 to $99,999 | 21 | 20.0% |
| $100,000 to $149,999 | 17 | 16.2% |
| $150,000 to $199,999 | 7 | 6.7% |
| $200,000+ | 13 | 12.4% |
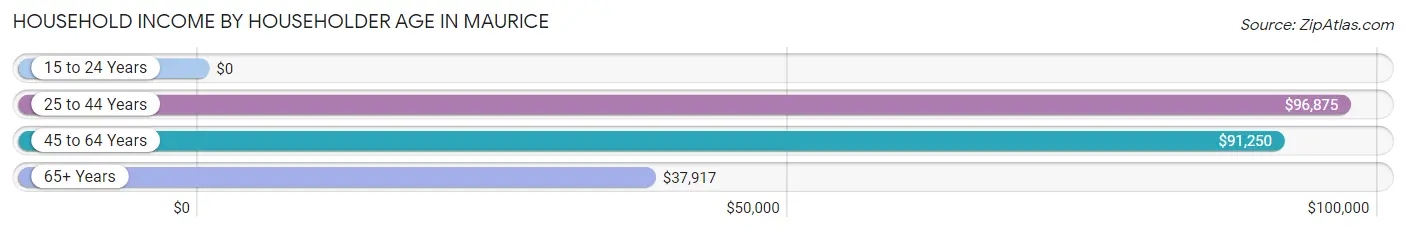
Household Income by Householder Age in Maurice
The median household income in Maurice is $78,958, with the highest median household income of $96,875 found in the 25 to 44 years age bracket for the primary householder. A total of 27 households (25.7%) fall into this category. Meanwhile, the 15 to 24 years age bracket for the primary householder has the lowest median household income of $0, with 1 households (0.9%) in this group.
| Income Bracket | # Households | Median Income |
| 15 to 24 Years | 1 (0.9%) | $0 |
| 25 to 44 Years | 27 (25.7%) | $96,875 |
| 45 to 64 Years | 42 (40.0%) | $91,250 |
| 65+ Years | 35 (33.3%) | $37,917 |
| Total | 105 (100.0%) | $78,958 |
Poverty in Maurice
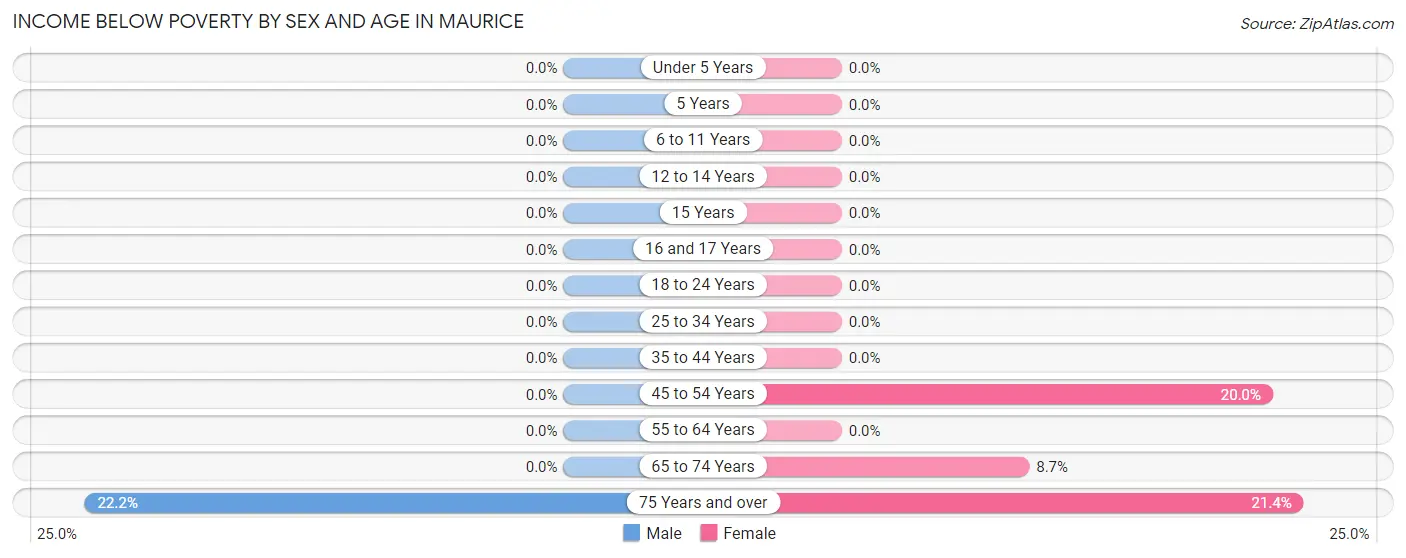
Income Below Poverty by Sex and Age in Maurice
With 1.7% poverty level for males and 4.7% for females among the residents of Maurice, 75 year old and over males and 75 year old and over females are the most vulnerable to poverty, with 2 males (22.2%) and 3 females (21.4%) in their respective age groups living below the poverty level.
| Age Bracket | Male | Female |
| Under 5 Years | 0 (0.0%) | 0 (0.0%) |
| 5 Years | 0 (0.0%) | 0 (0.0%) |
| 6 to 11 Years | 0 (0.0%) | 0 (0.0%) |
| 12 to 14 Years | 0 (0.0%) | 0 (0.0%) |
| 15 Years | 0 (0.0%) | 0 (0.0%) |
| 16 and 17 Years | 0 (0.0%) | 0 (0.0%) |
| 18 to 24 Years | 0 (0.0%) | 0 (0.0%) |
| 25 to 34 Years | 0 (0.0%) | 0 (0.0%) |
| 35 to 44 Years | 0 (0.0%) | 0 (0.0%) |
| 45 to 54 Years | 0 (0.0%) | 1 (20.0%) |
| 55 to 64 Years | 0 (0.0%) | 0 (0.0%) |
| 65 to 74 Years | 0 (0.0%) | 2 (8.7%) |
| 75 Years and over | 2 (22.2%) | 3 (21.4%) |
| Total | 2 (1.7%) | 6 (4.7%) |
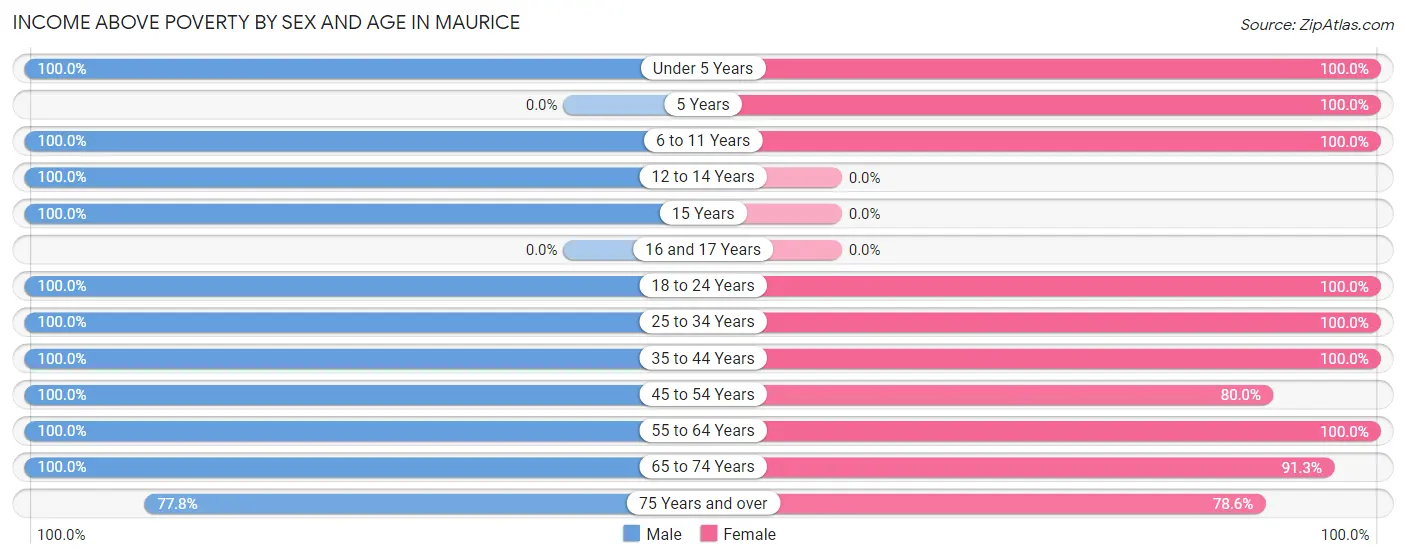
Income Above Poverty by Sex and Age in Maurice
According to the poverty statistics in Maurice, males aged under 5 years and females aged under 5 years are the age groups that are most secure financially, with 100.0% of males and 100.0% of females in these age groups living above the poverty line.
| Age Bracket | Male | Female |
| Under 5 Years | 3 (100.0%) | 14 (100.0%) |
| 5 Years | 0 (0.0%) | 1 (100.0%) |
| 6 to 11 Years | 8 (100.0%) | 9 (100.0%) |
| 12 to 14 Years | 11 (100.0%) | 0 (0.0%) |
| 15 Years | 8 (100.0%) | 0 (0.0%) |
| 16 and 17 Years | 0 (0.0%) | 0 (0.0%) |
| 18 to 24 Years | 3 (100.0%) | 3 (100.0%) |
| 25 to 34 Years | 6 (100.0%) | 14 (100.0%) |
| 35 to 44 Years | 19 (100.0%) | 19 (100.0%) |
| 45 to 54 Years | 6 (100.0%) | 4 (80.0%) |
| 55 to 64 Years | 35 (100.0%) | 25 (100.0%) |
| 65 to 74 Years | 9 (100.0%) | 21 (91.3%) |
| 75 Years and over | 7 (77.8%) | 11 (78.6%) |
| Total | 115 (98.3%) | 121 (95.3%) |
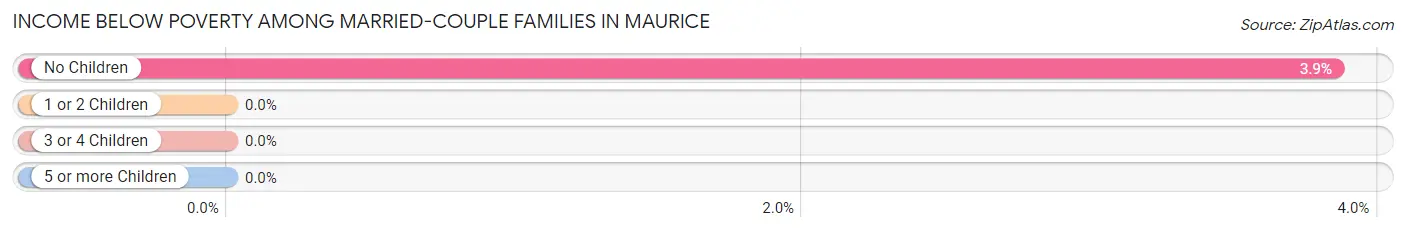
Income Below Poverty Among Married-Couple Families in Maurice
The poverty statistics for married-couple families in Maurice show that 3.0% or 2 of the total 66 families live below the poverty line. Families with no children have the highest poverty rate of 3.8%, comprising of 2 families. On the other hand, families with 1 or 2 children have the lowest poverty rate of 0.0%, which includes 0 families.
| Children | Above Poverty | Below Poverty |
| No Children | 50 (96.2%) | 2 (3.8%) |
| 1 or 2 Children | 9 (100.0%) | 0 (0.0%) |
| 3 or 4 Children | 4 (100.0%) | 0 (0.0%) |
| 5 or more Children | 1 (100.0%) | 0 (0.0%) |
| Total | 64 (97.0%) | 2 (3.0%) |
Income Below Poverty Among Single-Parent Households in Maurice
| Children | Single Father | Single Mother |
| No Children | 0 (0.0%) | 0 (0.0%) |
| 1 or 2 Children | 0 (0.0%) | 0 (0.0%) |
| 3 or 4 Children | 0 (0.0%) | 0 (0.0%) |
| 5 or more Children | 0 (0.0%) | 0 (0.0%) |
| Total | 0 (0.0%) | 0 (0.0%) |
Income Below Poverty Among Married-Couple vs Single-Parent Households in Maurice
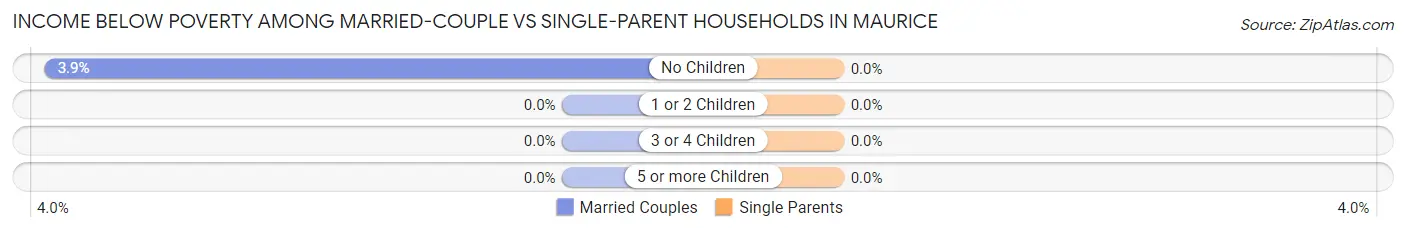
| Children | Married-Couple Families | Single-Parent Households |
| No Children | 2 (3.8%) | 0 (0.0%) |
| 1 or 2 Children | 0 (0.0%) | 0 (0.0%) |
| 3 or 4 Children | 0 (0.0%) | 0 (0.0%) |
| 5 or more Children | 0 (0.0%) | 0 (0.0%) |
| Total | 2 (3.0%) | 0 (0.0%) |
Race in Maurice
The most populous races in Maurice are White / Caucasian (228 | 92.7%), Hispanic or Latino (25 | 10.2%), and Two or more Races (11 | 4.5%).
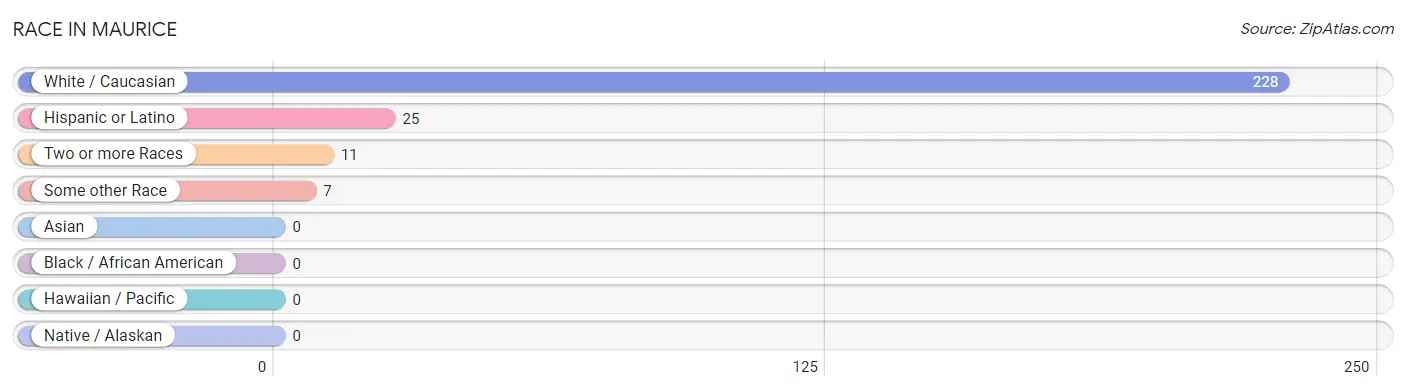
| Race | # Population | % Population |
| Asian | 0 | 0.0% |
| Black / African American | 0 | 0.0% |
| Hawaiian / Pacific | 0 | 0.0% |
| Hispanic or Latino | 25 | 10.2% |
| Native / Alaskan | 0 | 0.0% |
| White / Caucasian | 228 | 92.7% |
| Two or more Races | 11 | 4.5% |
| Some other Race | 7 | 2.9% |
| Total | 246 | 100.0% |
Ancestry in Maurice
The most populous ancestries reported in Maurice are Dutch (113 | 45.9%), German (55 | 22.4%), Colombian (13 | 5.3%), South American (13 | 5.3%), and Mexican (9 | 3.7%), together accounting for 82.5% of all Maurice residents.
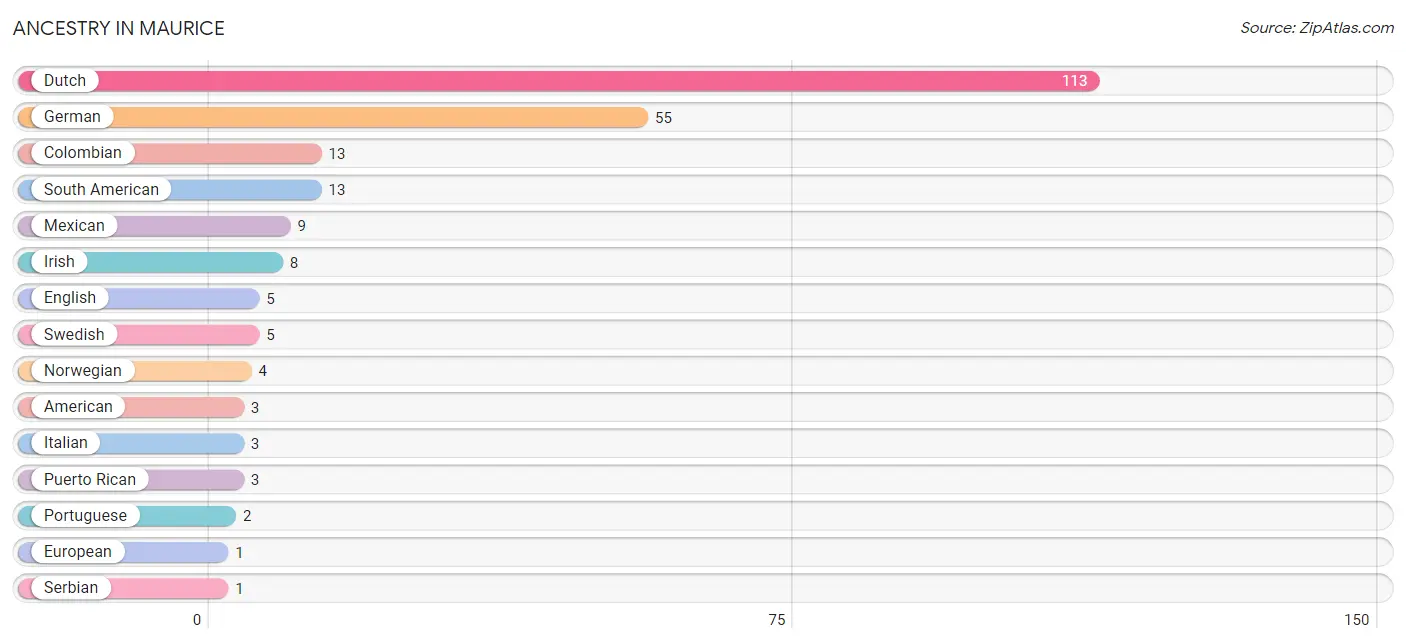
| Ancestry | # Population | % Population |
| American | 3 | 1.2% |
| Colombian | 13 | 5.3% |
| Dutch | 113 | 45.9% |
| English | 5 | 2.0% |
| European | 1 | 0.4% |
| German | 55 | 22.4% |
| Irish | 8 | 3.3% |
| Italian | 3 | 1.2% |
| Mexican | 9 | 3.7% |
| Norwegian | 4 | 1.6% |
| Portuguese | 2 | 0.8% |
| Puerto Rican | 3 | 1.2% |
| Serbian | 1 | 0.4% |
| South American | 13 | 5.3% |
| Swedish | 5 | 2.0% |
| Swiss | 1 | 0.4% | View All 16 Rows |
Immigrants in Maurice
The most numerous immigrant groups reported in Maurice came from Colombia (7 | 2.9%), Latin America (7 | 2.9%), and South America (7 | 2.9%), together accounting for 8.6% of all Maurice residents.
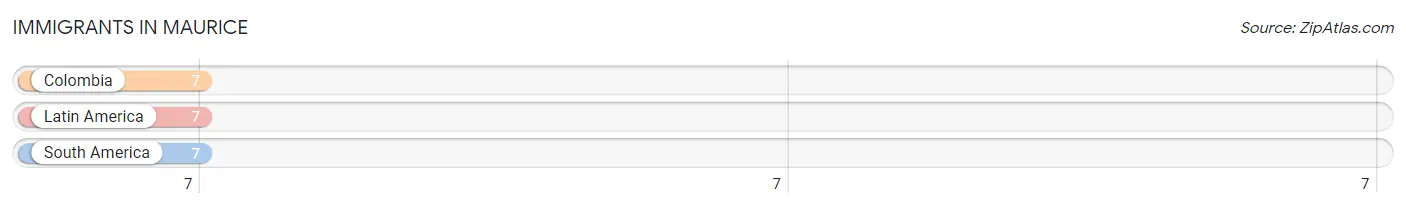
| Immigration Origin | # Population | % Population |
| Colombia | 7 | 2.9% |
| Latin America | 7 | 2.9% |
| South America | 7 | 2.9% | View All 3 Rows |
Sex and Age in Maurice
Sex and Age in Maurice
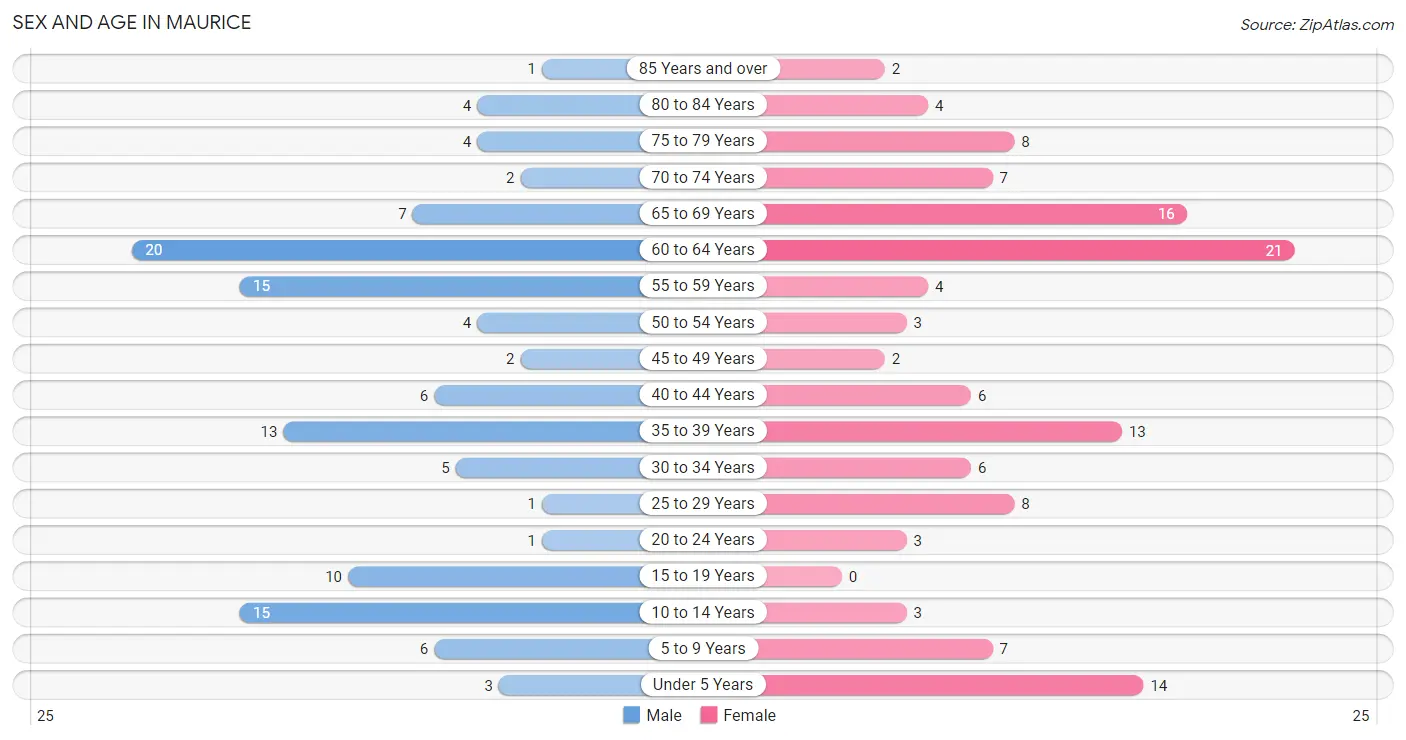
The most populous age groups in Maurice are 60 to 64 Years (20 | 16.8%) for men and 60 to 64 Years (21 | 16.5%) for women.
| Age Bracket | Male | Female |
| Under 5 Years | 3 (2.5%) | 14 (11.0%) |
| 5 to 9 Years | 6 (5.0%) | 7 (5.5%) |
| 10 to 14 Years | 15 (12.6%) | 3 (2.4%) |
| 15 to 19 Years | 10 (8.4%) | 0 (0.0%) |
| 20 to 24 Years | 1 (0.8%) | 3 (2.4%) |
| 25 to 29 Years | 1 (0.8%) | 8 (6.3%) |
| 30 to 34 Years | 5 (4.2%) | 6 (4.7%) |
| 35 to 39 Years | 13 (10.9%) | 13 (10.2%) |
| 40 to 44 Years | 6 (5.0%) | 6 (4.7%) |
| 45 to 49 Years | 2 (1.7%) | 2 (1.6%) |
| 50 to 54 Years | 4 (3.4%) | 3 (2.4%) |
| 55 to 59 Years | 15 (12.6%) | 4 (3.2%) |
| 60 to 64 Years | 20 (16.8%) | 21 (16.5%) |
| 65 to 69 Years | 7 (5.9%) | 16 (12.6%) |
| 70 to 74 Years | 2 (1.7%) | 7 (5.5%) |
| 75 to 79 Years | 4 (3.4%) | 8 (6.3%) |
| 80 to 84 Years | 4 (3.4%) | 4 (3.2%) |
| 85 Years and over | 1 (0.8%) | 2 (1.6%) |
| Total | 119 (100.0%) | 127 (100.0%) |
Families and Households in Maurice
Median Family Size in Maurice
The median family size in Maurice is 2.70 persons per family, with single female/mother families (2 | 2.7%) accounting for the largest median family size of 5.5 persons per family. On the other hand, married-couple families (66 | 89.2%) represent the smallest median family size with 2.59 persons per family.
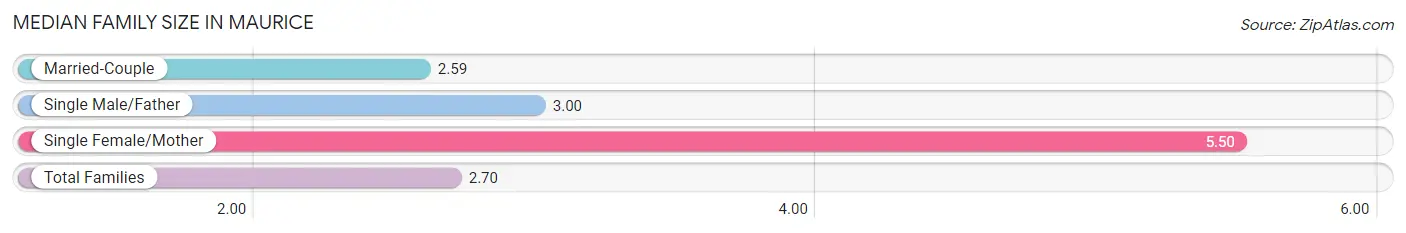
| Family Type | # Families | Family Size |
| Married-Couple | 66 (89.2%) | 2.59 |
| Single Male/Father | 6 (8.1%) | 3.00 |
| Single Female/Mother | 2 (2.7%) | 5.50 |
| Total Families | 74 (100.0%) | 2.70 |
Median Household Size in Maurice
The median household size in Maurice is 2.34 persons per household, with single female/mother households (2 | 1.9%) accounting for the largest median household size of 5.5 persons per household. non-family households (31 | 29.5%) represent the smallest median household size with 1.32 persons per household.
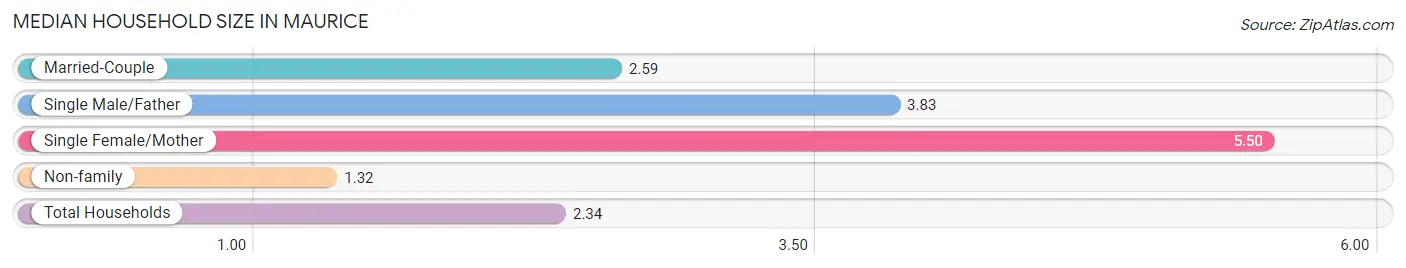
| Household Type | # Households | Household Size |
| Married-Couple | 66 (62.9%) | 2.59 |
| Single Male/Father | 6 (5.7%) | 3.83 |
| Single Female/Mother | 2 (1.9%) | 5.50 |
| Non-family | 31 (29.5%) | 1.32 |
| Total Households | 105 (100.0%) | 2.34 |
Household Size by Marriage Status in Maurice
Out of a total of 105 households in Maurice, 74 (70.5%) are family households, while 31 (29.5%) are nonfamily households. The most numerous type of family households are 2-person households, comprising 52, and the most common type of nonfamily households are 1-person households, comprising 26.
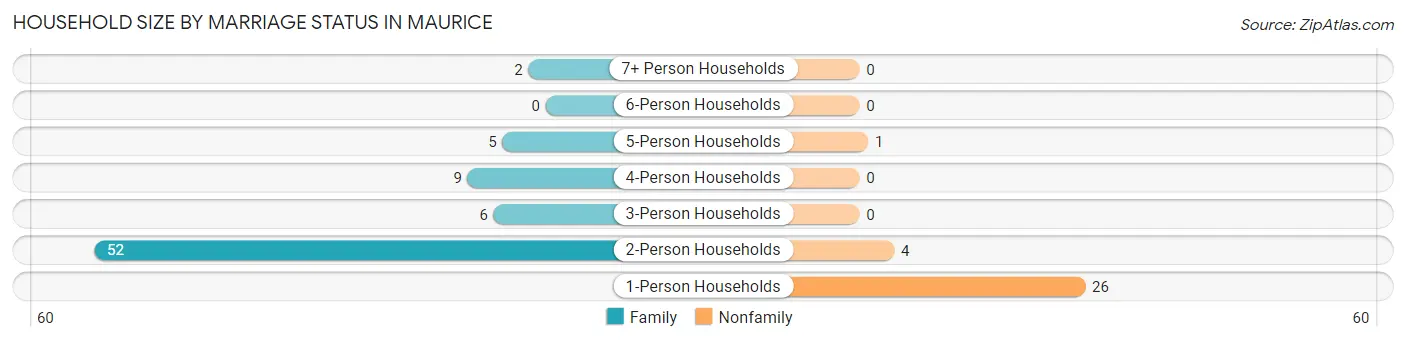
| Household Size | Family Households | Nonfamily Households |
| 1-Person Households | - | 26 (24.8%) |
| 2-Person Households | 52 (49.5%) | 4 (3.8%) |
| 3-Person Households | 6 (5.7%) | 0 (0.0%) |
| 4-Person Households | 9 (8.6%) | 0 (0.0%) |
| 5-Person Households | 5 (4.8%) | 1 (0.9%) |
| 6-Person Households | 0 (0.0%) | 0 (0.0%) |
| 7+ Person Households | 2 (1.9%) | 0 (0.0%) |
| Total | 74 (70.5%) | 31 (29.5%) |
Female Fertility in Maurice
Fertility by Age in Maurice
Average fertility rate in Maurice is 53.0 births per 1,000 women. Women in the age bracket of 20 to 34 years have the highest fertility rate with 118.0 births per 1,000 women. Women in the age bracket of 20 to 34 years acount for 100.0% of all women with births.
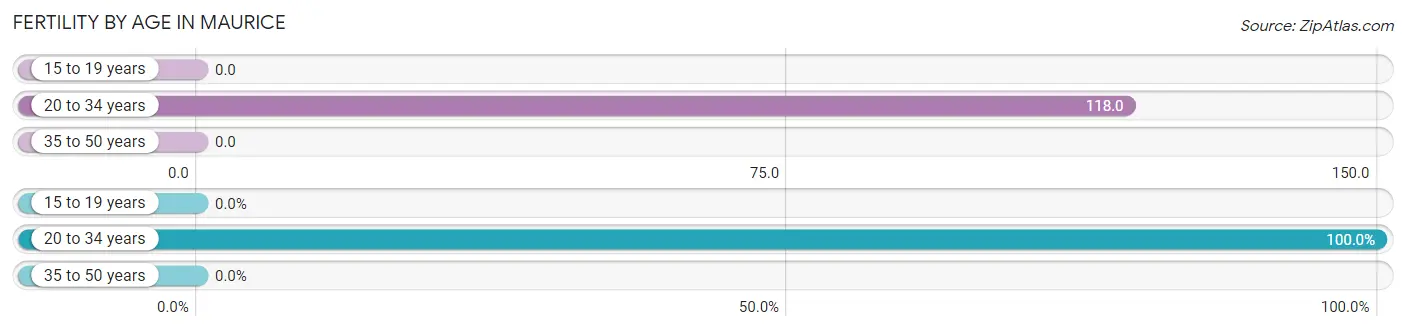
| Age Bracket | Women with Births | Births / 1,000 Women |
| 15 to 19 years | 0 (0.0%) | 0.0 |
| 20 to 34 years | 2 (100.0%) | 118.0 |
| 35 to 50 years | 0 (0.0%) | 0.0 |
| Total | 2 (100.0%) | 53.0 |
Fertility by Age by Marriage Status in Maurice
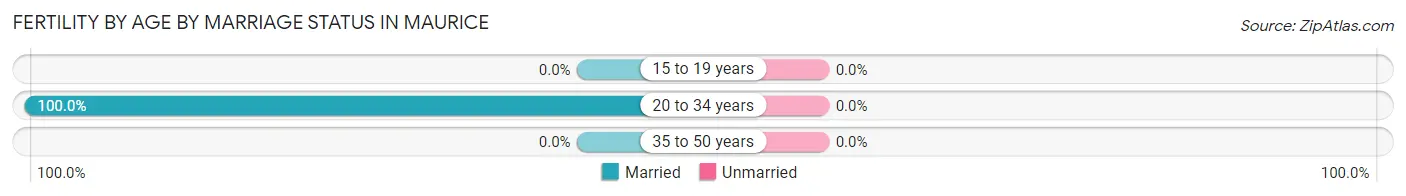
| Age Bracket | Married | Unmarried |
| 15 to 19 years | 0 (0.0%) | 0 (0.0%) |
| 20 to 34 years | 2 (100.0%) | 0 (0.0%) |
| 35 to 50 years | 0 (0.0%) | 0 (0.0%) |
| Total | 2 (100.0%) | 0 (0.0%) |
Fertility by Education in Maurice
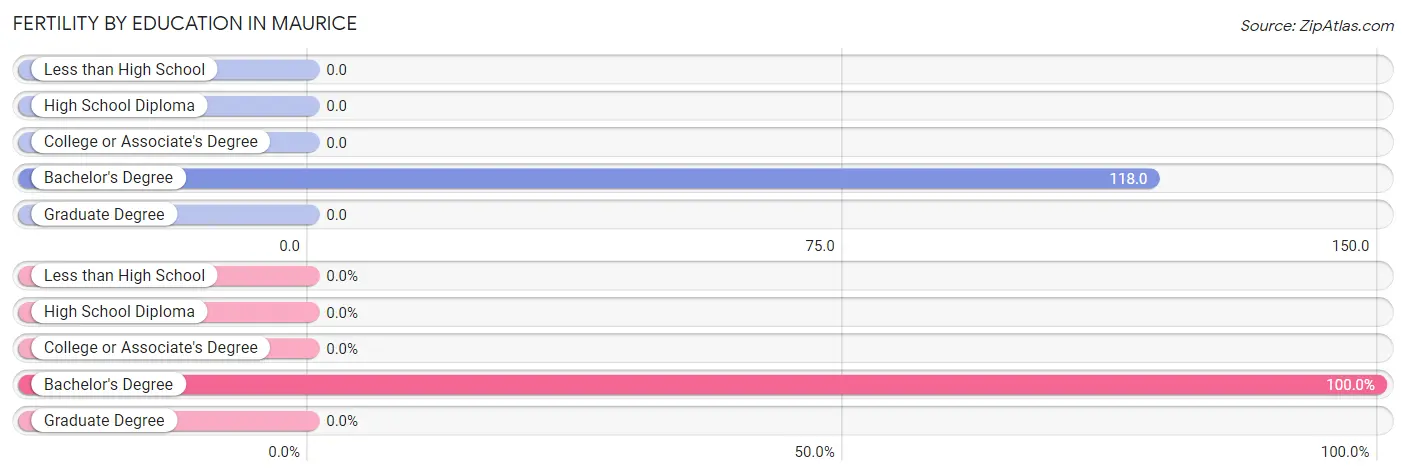
| Educational Attainment | Women with Births | Births / 1,000 Women |
| Less than High School | 0 (0.0%) | 0.0 |
| High School Diploma | 0 (0.0%) | 0.0 |
| College or Associate's Degree | 0 (0.0%) | 0.0 |
| Bachelor's Degree | 2 (100.0%) | 118.0 |
| Graduate Degree | 0 (0.0%) | 0.0 |
| Total | 2 (100.0%) | 53.0 |
Fertility by Education by Marriage Status in Maurice
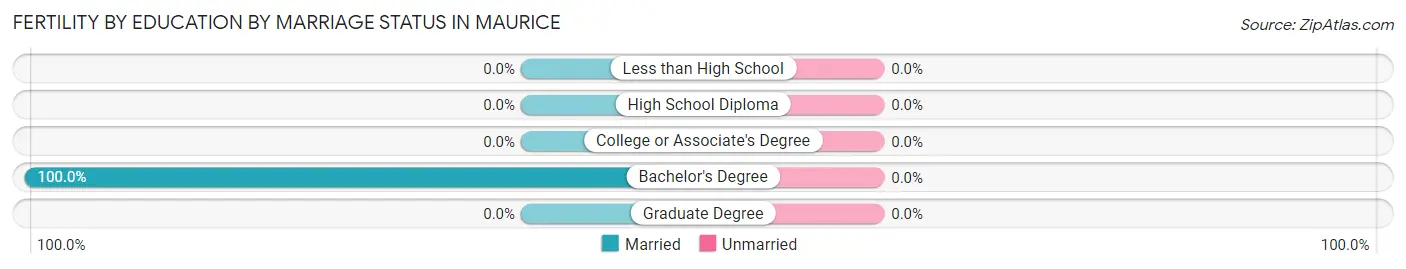
| Educational Attainment | Married | Unmarried |
| Less than High School | 0 (0.0%) | 0 (0.0%) |
| High School Diploma | 0 (0.0%) | 0 (0.0%) |
| College or Associate's Degree | 0 (0.0%) | 0 (0.0%) |
| Bachelor's Degree | 2 (100.0%) | 0 (0.0%) |
| Graduate Degree | 0 (0.0%) | 0 (0.0%) |
| Total | 2 (100.0%) | 0 (0.0%) |
Employment Characteristics in Maurice
Employment by Class of Employer in Maurice
Among the 141 employed individuals in Maurice, private company employees (103 | 73.1%), not-for-profit organizations (12 | 8.5%), and local government employees (10 | 7.1%) make up the most common classes of employment.
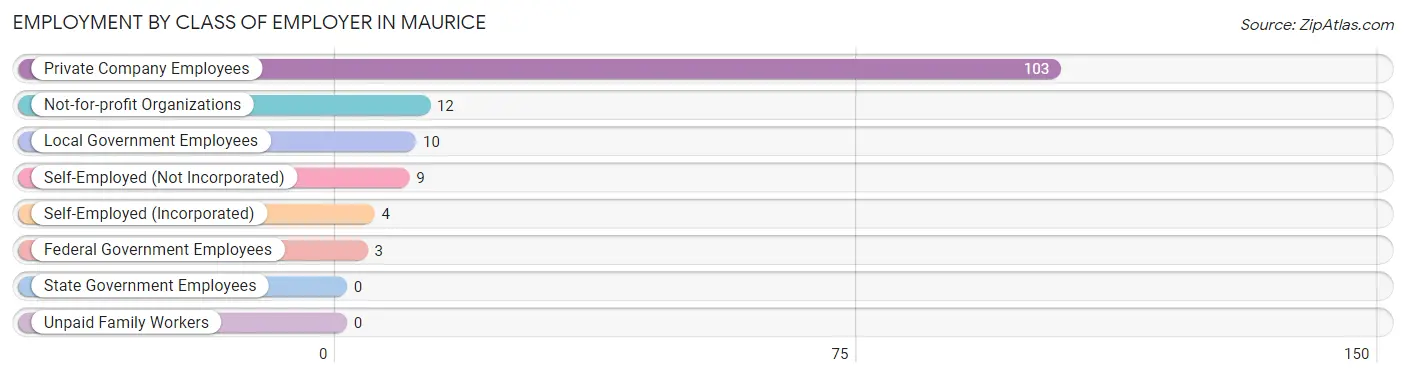
| Employer Class | # Employees | % Employees |
| Private Company Employees | 103 | 73.1% |
| Self-Employed (Incorporated) | 4 | 2.8% |
| Self-Employed (Not Incorporated) | 9 | 6.4% |
| Not-for-profit Organizations | 12 | 8.5% |
| Local Government Employees | 10 | 7.1% |
| State Government Employees | 0 | 0.0% |
| Federal Government Employees | 3 | 2.1% |
| Unpaid Family Workers | 0 | 0.0% |
| Total | 141 | 100.0% |
Employment Status by Age in Maurice
According to the labor force statistics for Maurice, out of the total population over 16 years of age (190), 75.3% or 143 individuals are in the labor force, with 1.4% or 2 of them unemployed. The age group with the highest labor force participation rate is 20 to 24 years, with 100.0% or 4 individuals in the labor force. Within the labor force, the 60 to 64 years age range has the highest percentage of unemployed individuals, with 5.4% or 2 of them being unemployed.
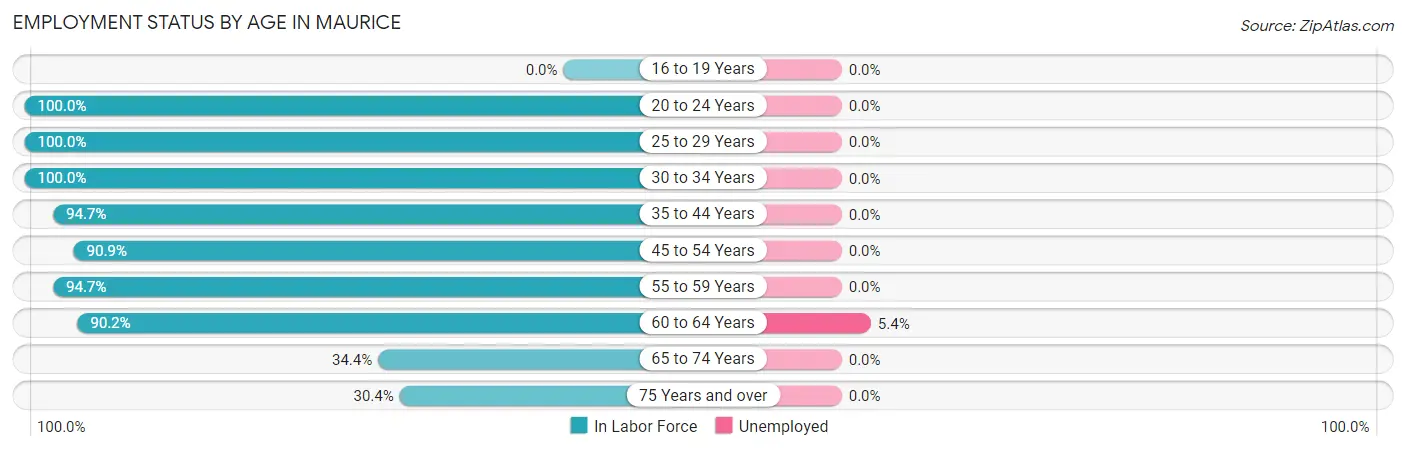
| Age Bracket | In Labor Force | Unemployed |
| 16 to 19 Years | 0 (0.0%) | 0 (0.0%) |
| 20 to 24 Years | 4 (100.0%) | 0 (0.0%) |
| 25 to 29 Years | 9 (100.0%) | 0 (0.0%) |
| 30 to 34 Years | 11 (100.0%) | 0 (0.0%) |
| 35 to 44 Years | 36 (94.7%) | 0 (0.0%) |
| 45 to 54 Years | 10 (90.9%) | 0 (0.0%) |
| 55 to 59 Years | 18 (94.7%) | 0 (0.0%) |
| 60 to 64 Years | 37 (90.2%) | 2 (5.4%) |
| 65 to 74 Years | 11 (34.4%) | 0 (0.0%) |
| 75 Years and over | 7 (30.4%) | 0 (0.0%) |
| Total | 143 (75.3%) | 2 (1.4%) |
Employment Status by Educational Attainment in Maurice
According to labor force statistics for Maurice, 93.8% of individuals (121) out of the total population between 25 and 64 years of age (129) are in the labor force, with 1.7% or 2 of them being unemployed. The group with the highest labor force participation rate are those with the educational attainment of less than high school, with 100.0% or 8 individuals in the labor force. Within the labor force, individuals with high school diploma education have the highest percentage of unemployment, with 4.3% or 2 of them being unemployed.
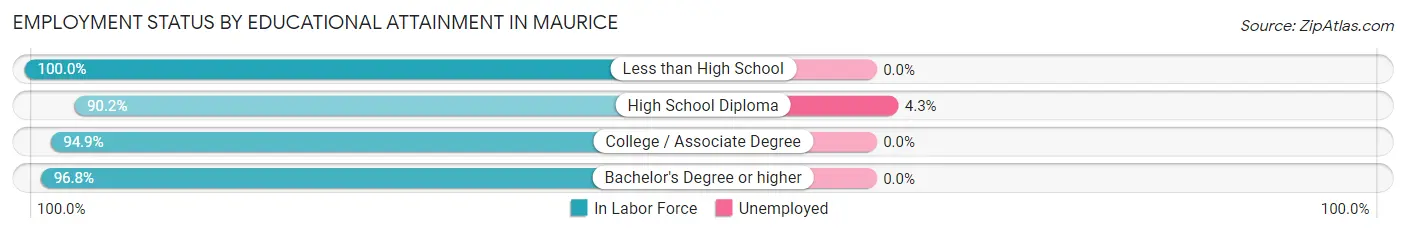
| Educational Attainment | In Labor Force | Unemployed |
| Less than High School | 8 (100.0%) | 0 (0.0%) |
| High School Diploma | 46 (90.2%) | 2 (4.3%) |
| College / Associate Degree | 37 (94.9%) | 0 (0.0%) |
| Bachelor's Degree or higher | 30 (96.8%) | 0 (0.0%) |
| Total | 121 (93.8%) | 2 (1.7%) |
Employment Occupations by Sex in Maurice
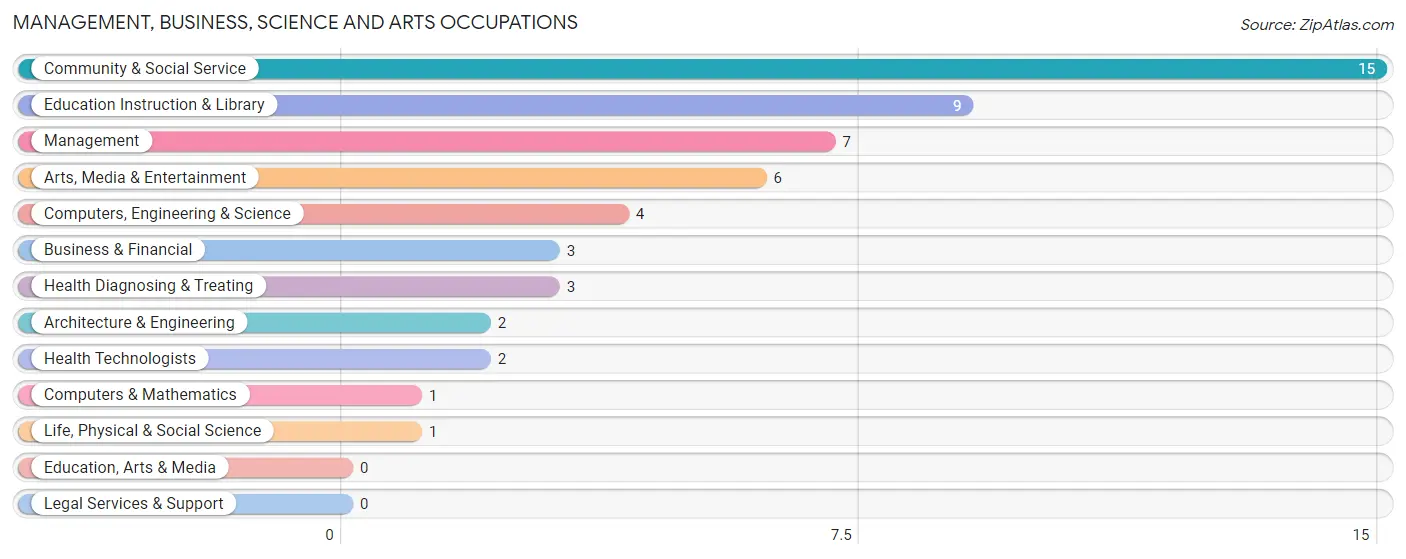
Management, Business, Science and Arts Occupations
The most common Management, Business, Science and Arts occupations in Maurice are Community & Social Service (15 | 10.6%), Education Instruction & Library (9 | 6.4%), Management (7 | 5.0%), Arts, Media & Entertainment (6 | 4.3%), and Computers, Engineering & Science (4 | 2.8%).
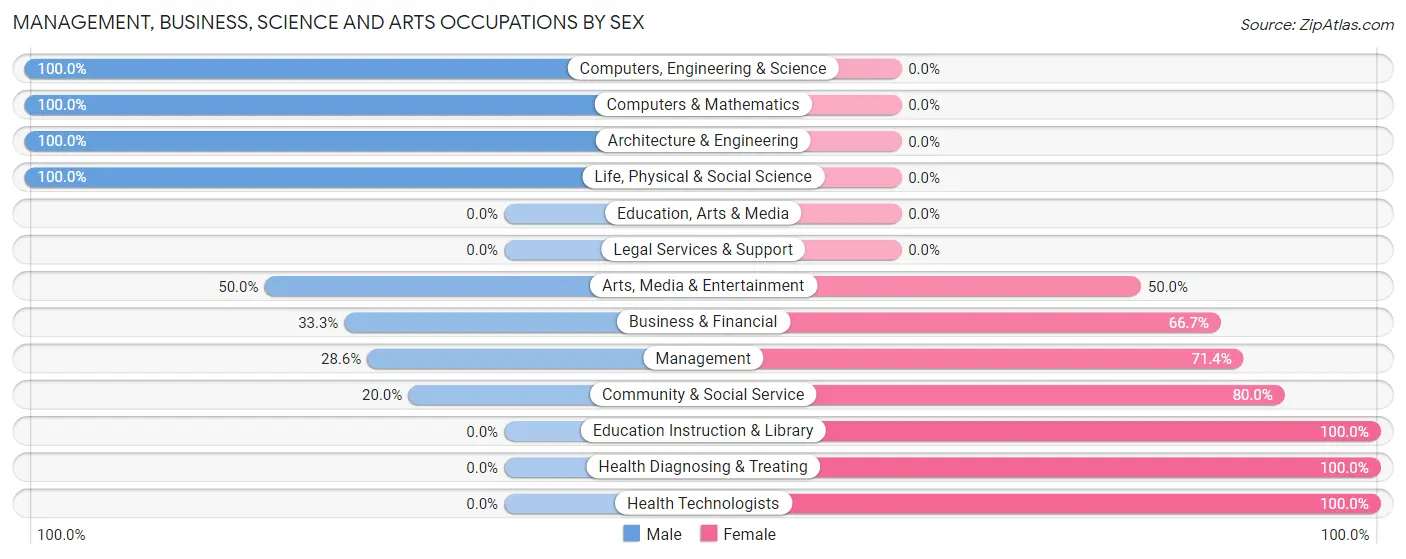
Management, Business, Science and Arts Occupations by Sex
Within the Management, Business, Science and Arts occupations in Maurice, the most male-oriented occupations are Computers, Engineering & Science (100.0%), Computers & Mathematics (100.0%), and Architecture & Engineering (100.0%), while the most female-oriented occupations are Education Instruction & Library (100.0%), Health Diagnosing & Treating (100.0%), and Health Technologists (100.0%).
| Occupation | Male | Female |
| Management | 2 (28.6%) | 5 (71.4%) |
| Business & Financial | 1 (33.3%) | 2 (66.7%) |
| Computers, Engineering & Science | 4 (100.0%) | 0 (0.0%) |
| Computers & Mathematics | 1 (100.0%) | 0 (0.0%) |
| Architecture & Engineering | 2 (100.0%) | 0 (0.0%) |
| Life, Physical & Social Science | 1 (100.0%) | 0 (0.0%) |
| Community & Social Service | 3 (20.0%) | 12 (80.0%) |
| Education, Arts & Media | 0 (0.0%) | 0 (0.0%) |
| Legal Services & Support | 0 (0.0%) | 0 (0.0%) |
| Education Instruction & Library | 0 (0.0%) | 9 (100.0%) |
| Arts, Media & Entertainment | 3 (50.0%) | 3 (50.0%) |
| Health Diagnosing & Treating | 0 (0.0%) | 3 (100.0%) |
| Health Technologists | 0 (0.0%) | 2 (100.0%) |
| Total (Category) | 10 (31.2%) | 22 (68.8%) |
| Total (Overall) | 72 (51.1%) | 69 (48.9%) |
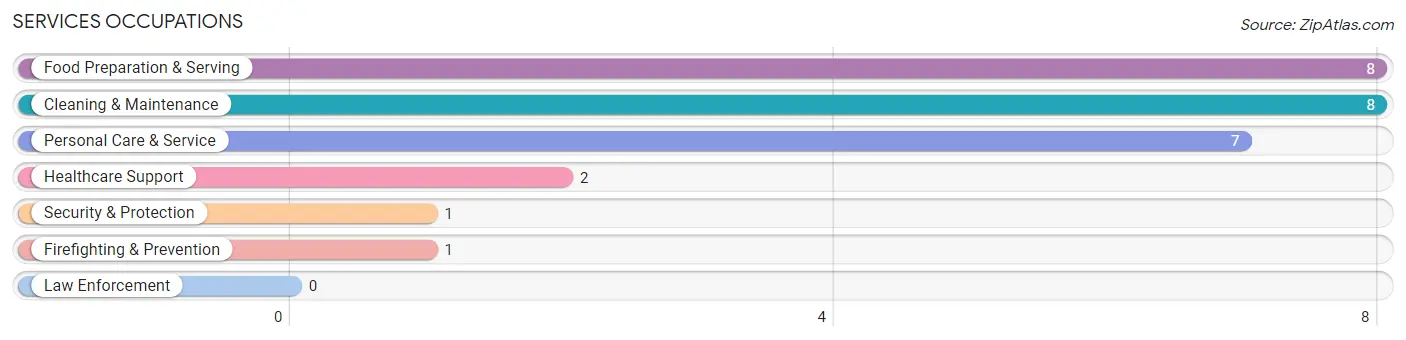
Services Occupations
The most common Services occupations in Maurice are Food Preparation & Serving (8 | 5.7%), Cleaning & Maintenance (8 | 5.7%), Personal Care & Service (7 | 5.0%), Healthcare Support (2 | 1.4%), and Security & Protection (1 | 0.7%).
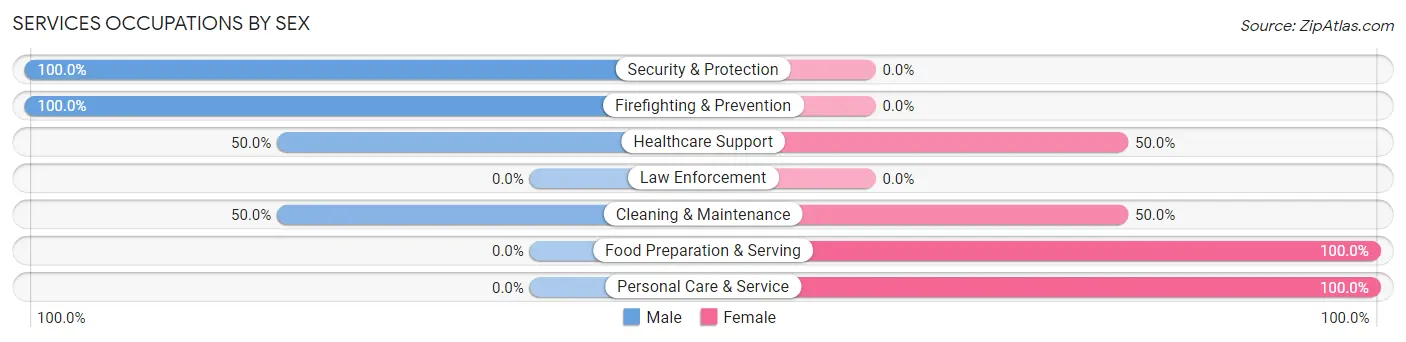
Services Occupations by Sex
Within the Services occupations in Maurice, the most male-oriented occupations are Security & Protection (100.0%), Firefighting & Prevention (100.0%), and Healthcare Support (50.0%), while the most female-oriented occupations are Food Preparation & Serving (100.0%), Personal Care & Service (100.0%), and Healthcare Support (50.0%).
| Occupation | Male | Female |
| Healthcare Support | 1 (50.0%) | 1 (50.0%) |
| Security & Protection | 1 (100.0%) | 0 (0.0%) |
| Firefighting & Prevention | 1 (100.0%) | 0 (0.0%) |
| Law Enforcement | 0 (0.0%) | 0 (0.0%) |
| Food Preparation & Serving | 0 (0.0%) | 8 (100.0%) |
| Cleaning & Maintenance | 4 (50.0%) | 4 (50.0%) |
| Personal Care & Service | 0 (0.0%) | 7 (100.0%) |
| Total (Category) | 6 (23.1%) | 20 (76.9%) |
| Total (Overall) | 72 (51.1%) | 69 (48.9%) |
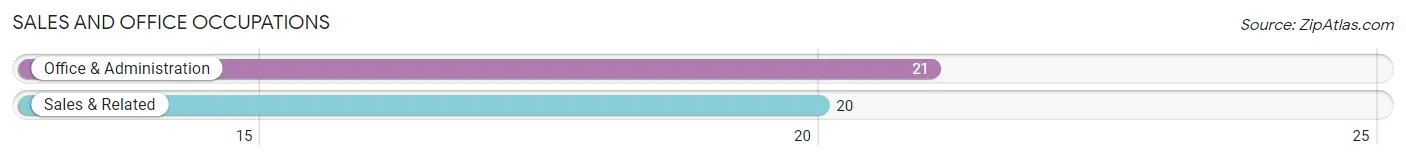
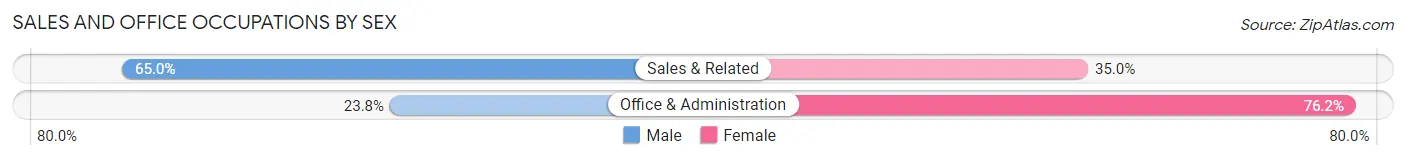
Sales and Office Occupations
The most common Sales and Office occupations in Maurice are Office & Administration (21 | 14.9%), and Sales & Related (20 | 14.2%).
Sales and Office Occupations by Sex
| Occupation | Male | Female |
| Sales & Related | 13 (65.0%) | 7 (35.0%) |
| Office & Administration | 5 (23.8%) | 16 (76.2%) |
| Total (Category) | 18 (43.9%) | 23 (56.1%) |
| Total (Overall) | 72 (51.1%) | 69 (48.9%) |
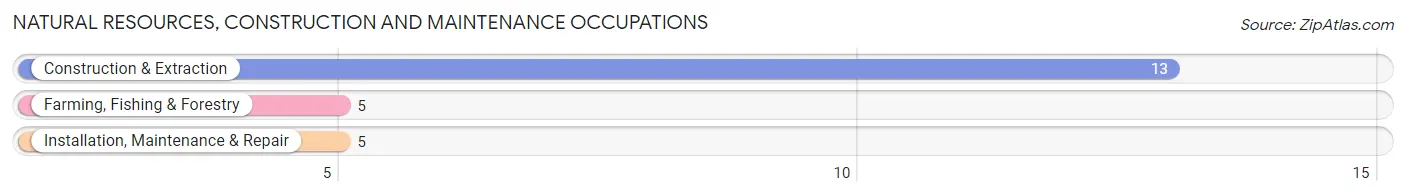
Natural Resources, Construction and Maintenance Occupations
The most common Natural Resources, Construction and Maintenance occupations in Maurice are Construction & Extraction (13 | 9.2%), Farming, Fishing & Forestry (5 | 3.5%), and Installation, Maintenance & Repair (5 | 3.5%).
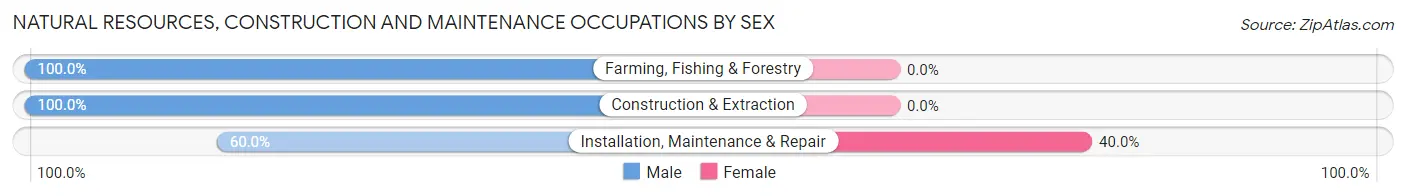
Natural Resources, Construction and Maintenance Occupations by Sex
| Occupation | Male | Female |
| Farming, Fishing & Forestry | 5 (100.0%) | 0 (0.0%) |
| Construction & Extraction | 13 (100.0%) | 0 (0.0%) |
| Installation, Maintenance & Repair | 3 (60.0%) | 2 (40.0%) |
| Total (Category) | 21 (91.3%) | 2 (8.7%) |
| Total (Overall) | 72 (51.1%) | 69 (48.9%) |
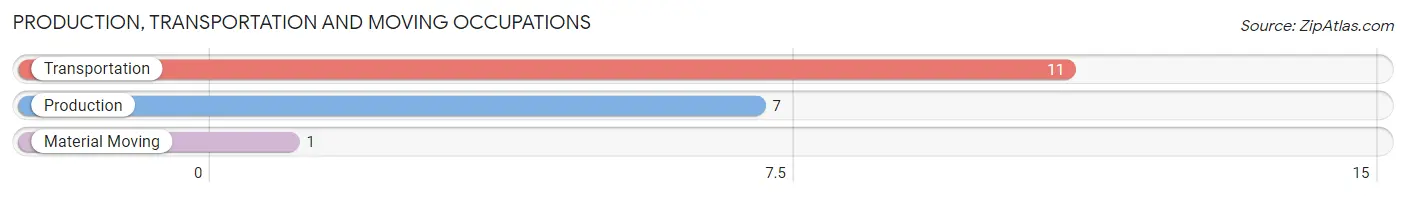
Production, Transportation and Moving Occupations
The most common Production, Transportation and Moving occupations in Maurice are Transportation (11 | 7.8%), Production (7 | 5.0%), and Material Moving (1 | 0.7%).
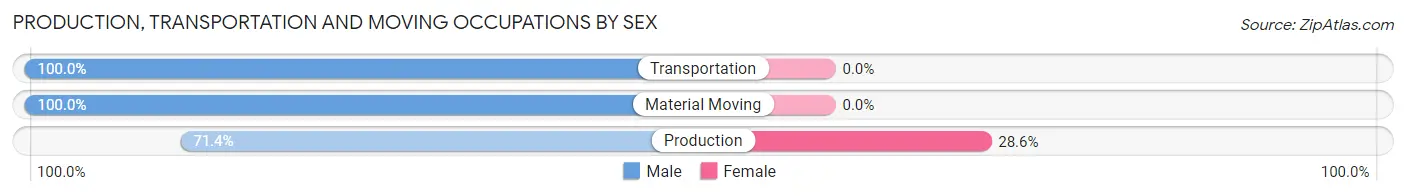
Production, Transportation and Moving Occupations by Sex
| Occupation | Male | Female |
| Production | 5 (71.4%) | 2 (28.6%) |
| Transportation | 11 (100.0%) | 0 (0.0%) |
| Material Moving | 1 (100.0%) | 0 (0.0%) |
| Total (Category) | 17 (89.5%) | 2 (10.5%) |
| Total (Overall) | 72 (51.1%) | 69 (48.9%) |
Employment Industries by Sex in Maurice
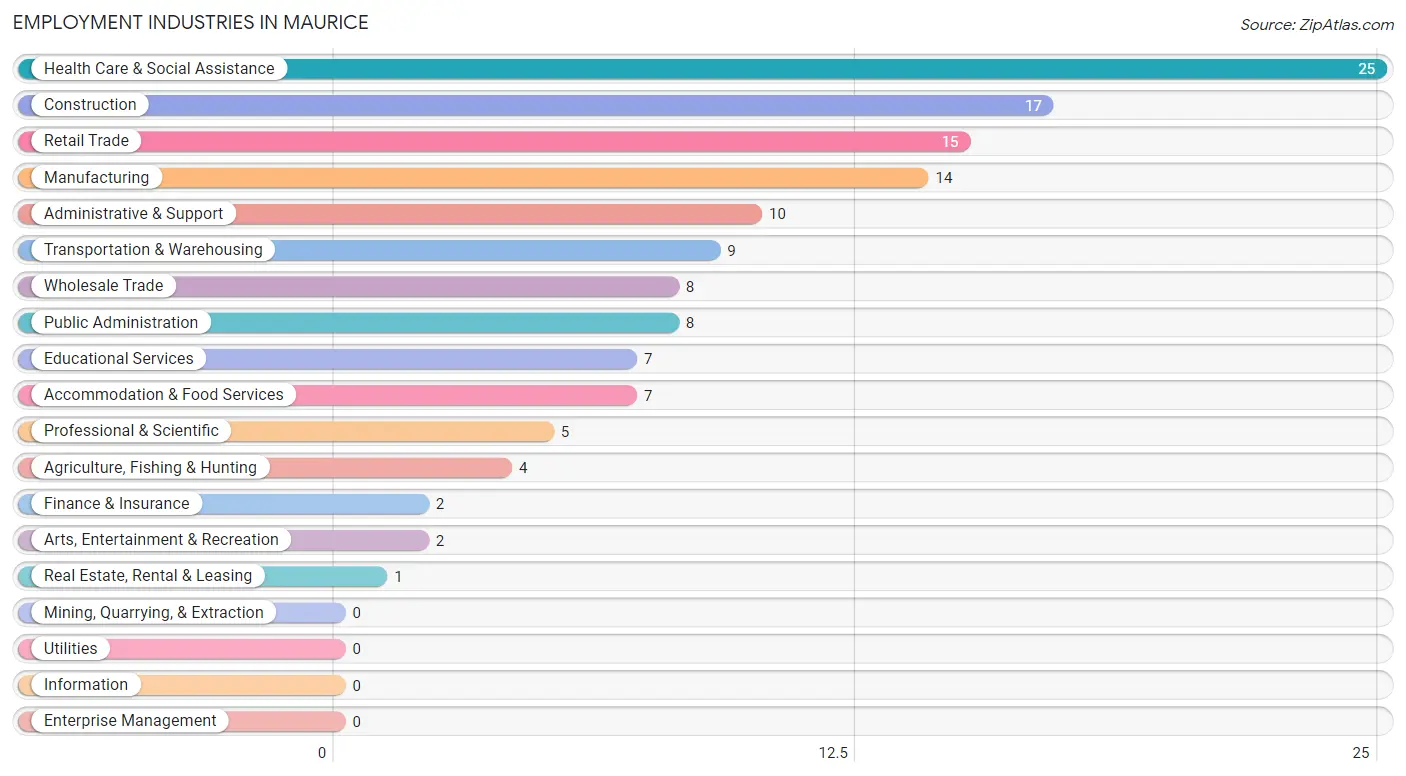
Employment Industries in Maurice
The major employment industries in Maurice include Health Care & Social Assistance (25 | 17.7%), Construction (17 | 12.1%), Retail Trade (15 | 10.6%), Manufacturing (14 | 9.9%), and Administrative & Support (10 | 7.1%).
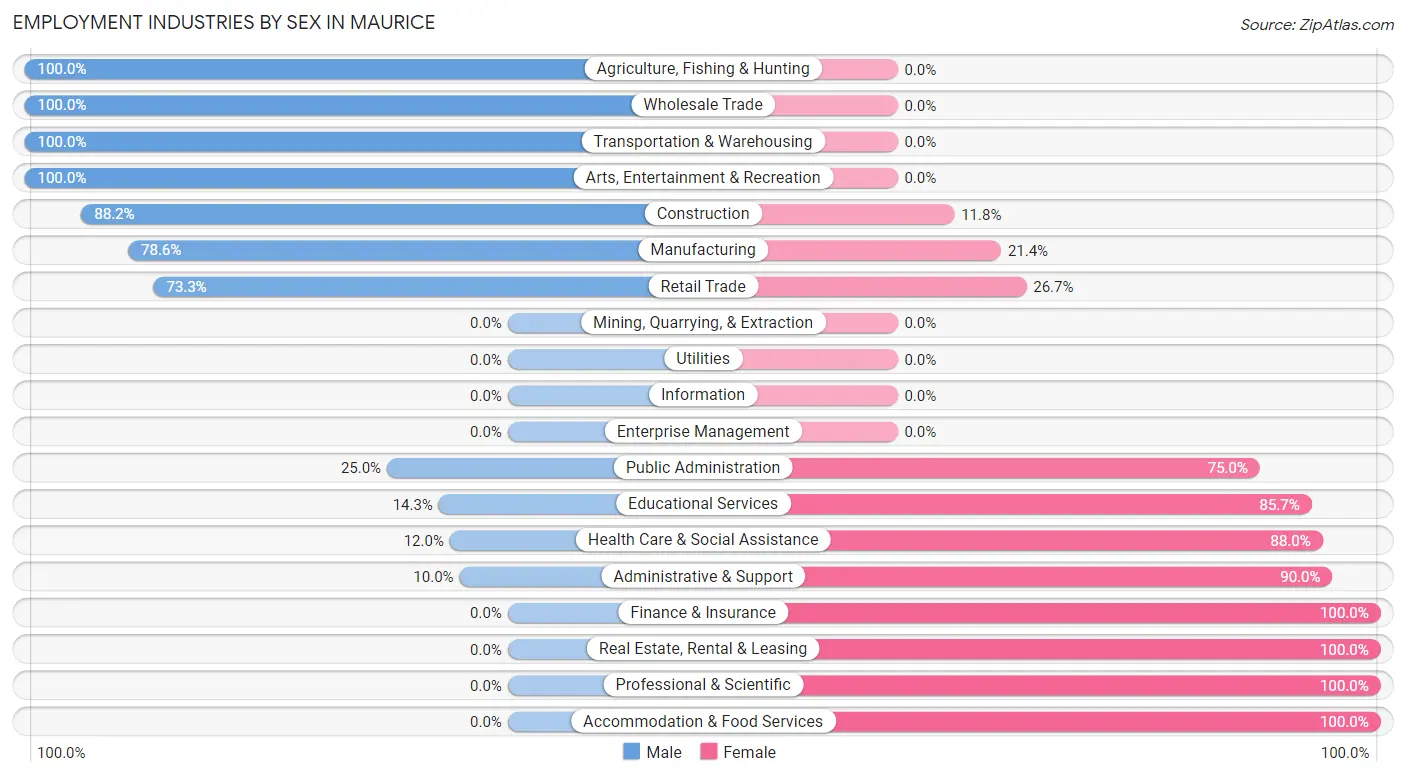
Employment Industries by Sex in Maurice
The Maurice industries that see more men than women are Agriculture, Fishing & Hunting (100.0%), Wholesale Trade (100.0%), and Transportation & Warehousing (100.0%), whereas the industries that tend to have a higher number of women are Finance & Insurance (100.0%), Real Estate, Rental & Leasing (100.0%), and Professional & Scientific (100.0%).
| Industry | Male | Female |
| Agriculture, Fishing & Hunting | 4 (100.0%) | 0 (0.0%) |
| Mining, Quarrying, & Extraction | 0 (0.0%) | 0 (0.0%) |
| Construction | 15 (88.2%) | 2 (11.8%) |
| Manufacturing | 11 (78.6%) | 3 (21.4%) |
| Wholesale Trade | 8 (100.0%) | 0 (0.0%) |
| Retail Trade | 11 (73.3%) | 4 (26.7%) |
| Transportation & Warehousing | 9 (100.0%) | 0 (0.0%) |
| Utilities | 0 (0.0%) | 0 (0.0%) |
| Information | 0 (0.0%) | 0 (0.0%) |
| Finance & Insurance | 0 (0.0%) | 2 (100.0%) |
| Real Estate, Rental & Leasing | 0 (0.0%) | 1 (100.0%) |
| Professional & Scientific | 0 (0.0%) | 5 (100.0%) |
| Enterprise Management | 0 (0.0%) | 0 (0.0%) |
| Administrative & Support | 1 (10.0%) | 9 (90.0%) |
| Educational Services | 1 (14.3%) | 6 (85.7%) |
| Health Care & Social Assistance | 3 (12.0%) | 22 (88.0%) |
| Arts, Entertainment & Recreation | 2 (100.0%) | 0 (0.0%) |
| Accommodation & Food Services | 0 (0.0%) | 7 (100.0%) |
| Public Administration | 2 (25.0%) | 6 (75.0%) |
| Total | 72 (51.1%) | 69 (48.9%) |
Education in Maurice
School Enrollment in Maurice
The most common levels of schooling among the 51 students in Maurice are middle school (16 | 31.4%), elementary school (11 | 21.6%), and high school (10 | 19.6%).
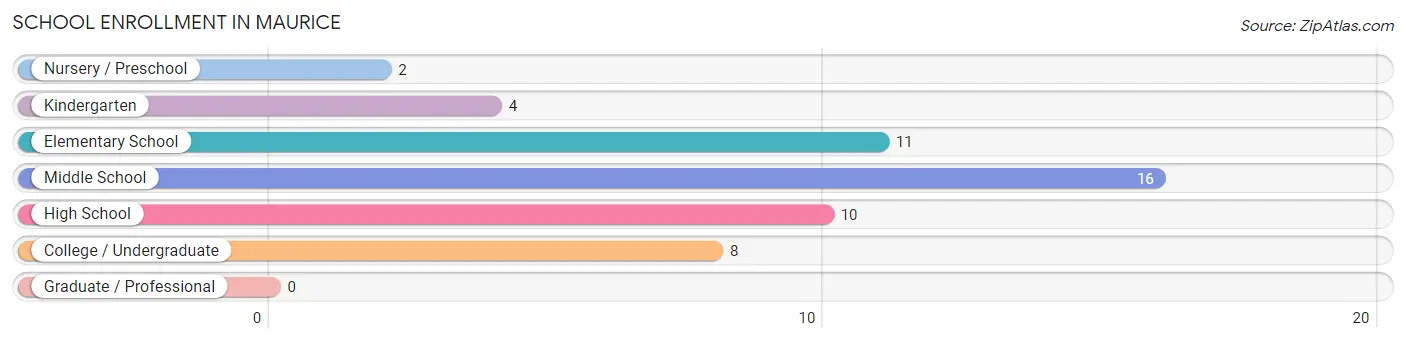
| School Level | # Students | % Students |
| Nursery / Preschool | 2 | 3.9% |
| Kindergarten | 4 | 7.8% |
| Elementary School | 11 | 21.6% |
| Middle School | 16 | 31.4% |
| High School | 10 | 19.6% |
| College / Undergraduate | 8 | 15.7% |
| Graduate / Professional | 0 | 0.0% |
| Total | 51 | 100.0% |
School Enrollment by Age by Funding Source in Maurice
Out of a total of 51 students who are enrolled in schools in Maurice, 22 (43.1%) attend a private institution, while the remaining 29 (56.9%) are enrolled in public schools. The age group of 25 to 34 year olds has the highest likelihood of being enrolled in private schools, with 2 (100.0% in the age bracket) enrolled. Conversely, the age group of 18 to 19 year olds has the lowest likelihood of being enrolled in a private school, with 2 (100.0% in the age bracket) attending a public institution.
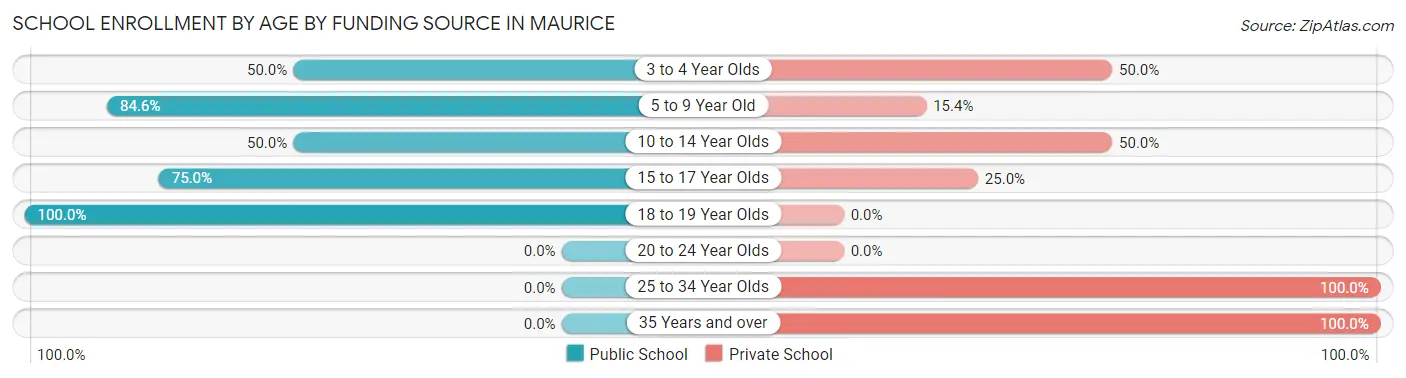
| Age Bracket | Public School | Private School |
| 3 to 4 Year Olds | 1 (50.0%) | 1 (50.0%) |
| 5 to 9 Year Old | 11 (84.6%) | 2 (15.4%) |
| 10 to 14 Year Olds | 9 (50.0%) | 9 (50.0%) |
| 15 to 17 Year Olds | 6 (75.0%) | 2 (25.0%) |
| 18 to 19 Year Olds | 2 (100.0%) | 0 (0.0%) |
| 20 to 24 Year Olds | 0 (0.0%) | 0 (0.0%) |
| 25 to 34 Year Olds | 0 (0.0%) | 2 (100.0%) |
| 35 Years and over | 0 (0.0%) | 6 (100.0%) |
| Total | 29 (56.9%) | 22 (43.1%) |
Educational Attainment by Field of Study in Maurice
Arts & humanities (7 | 18.4%), literature & languages (6 | 15.8%), education (5 | 13.2%), social sciences (4 | 10.5%), and bio, nature & agricultural (3 | 7.9%) are the most common fields of study among 38 individuals in Maurice who have obtained a bachelor's degree or higher.
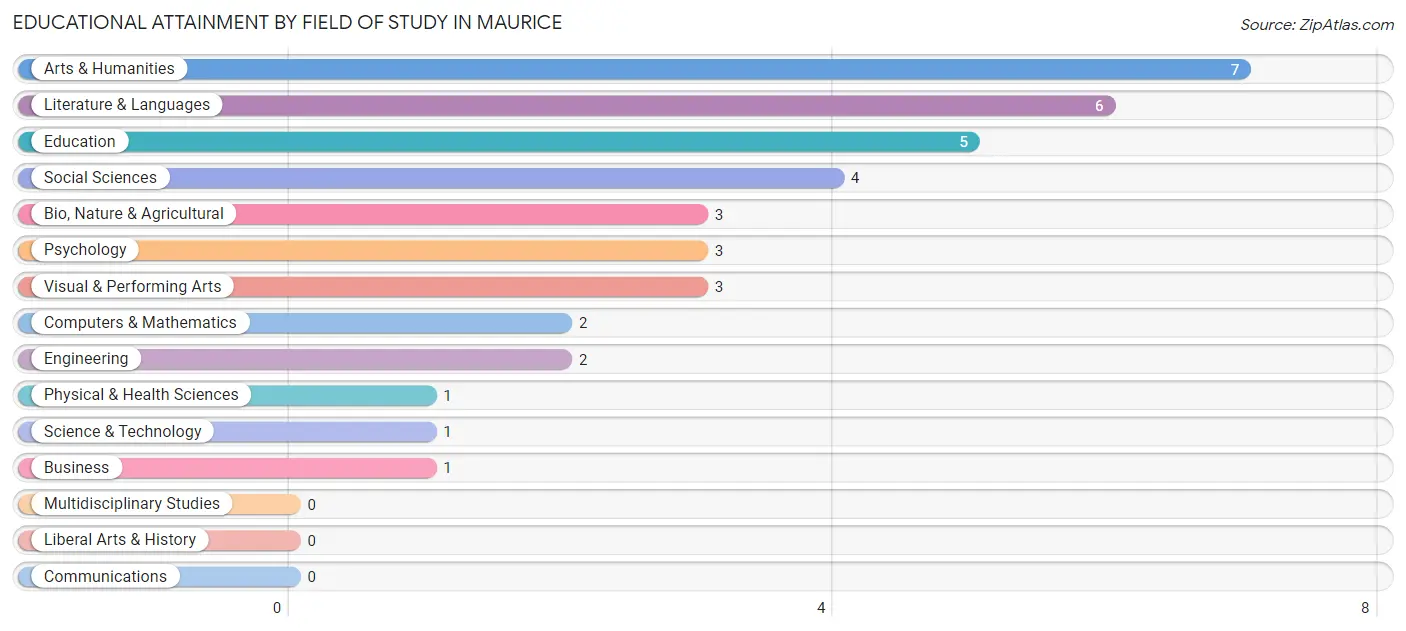
| Field of Study | # Graduates | % Graduates |
| Computers & Mathematics | 2 | 5.3% |
| Bio, Nature & Agricultural | 3 | 7.9% |
| Physical & Health Sciences | 1 | 2.6% |
| Psychology | 3 | 7.9% |
| Social Sciences | 4 | 10.5% |
| Engineering | 2 | 5.3% |
| Multidisciplinary Studies | 0 | 0.0% |
| Science & Technology | 1 | 2.6% |
| Business | 1 | 2.6% |
| Education | 5 | 13.2% |
| Literature & Languages | 6 | 15.8% |
| Liberal Arts & History | 0 | 0.0% |
| Visual & Performing Arts | 3 | 7.9% |
| Communications | 0 | 0.0% |
| Arts & Humanities | 7 | 18.4% |
| Total | 38 | 100.0% |
Transportation & Commute in Maurice
Vehicle Availability by Sex in Maurice
The most prevalent vehicle ownership categories in Maurice are males with 2 vehicles (31, accounting for 43.1%) and females with 2 vehicles (33, making up 44.9%).
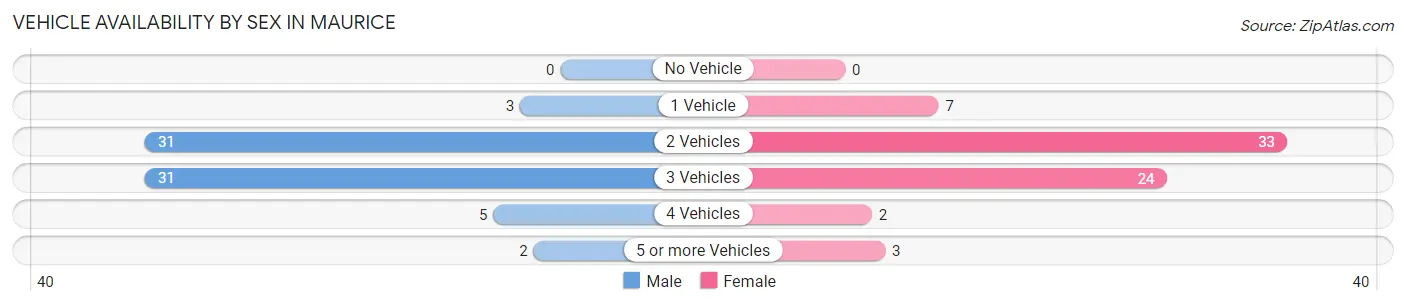
| Vehicles Available | Male | Female |
| No Vehicle | 0 (0.0%) | 0 (0.0%) |
| 1 Vehicle | 3 (4.2%) | 7 (10.1%) |
| 2 Vehicles | 31 (43.1%) | 33 (47.8%) |
| 3 Vehicles | 31 (43.1%) | 24 (34.8%) |
| 4 Vehicles | 5 (6.9%) | 2 (2.9%) |
| 5 or more Vehicles | 2 (2.8%) | 3 (4.3%) |
| Total | 72 (100.0%) | 69 (100.0%) |
Commute Time in Maurice
The most frequently occuring commute durations in Maurice are 15 to 19 minutes (45 commuters, 33.3%), 20 to 24 minutes (28 commuters, 20.7%), and 10 to 14 minutes (25 commuters, 18.5%).
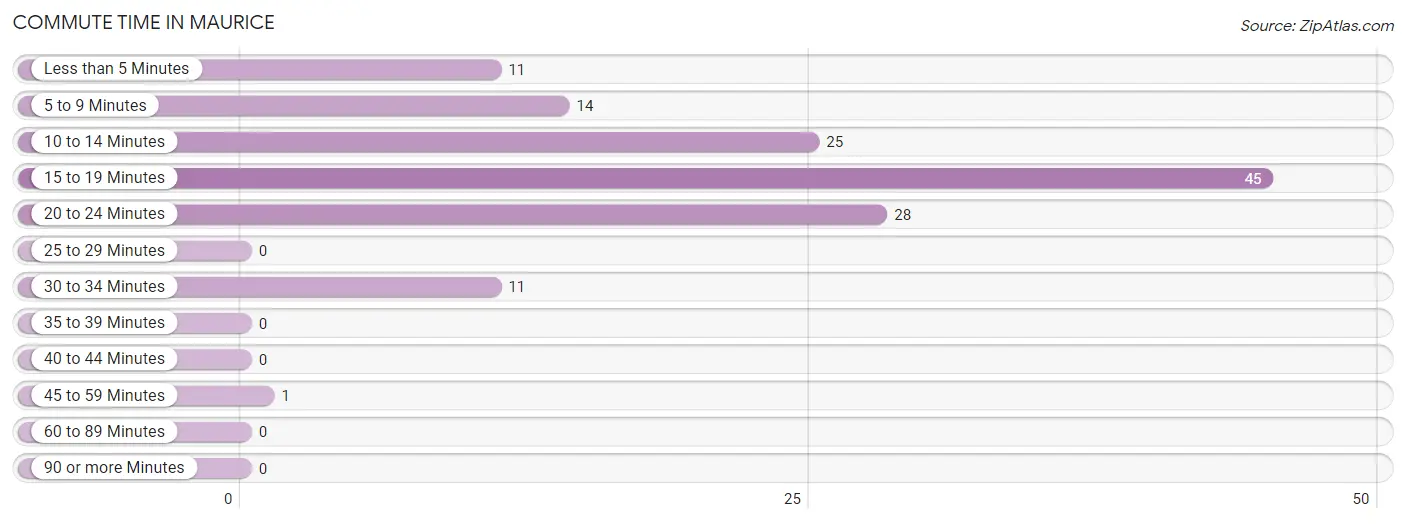
| Commute Time | # Commuters | % Commuters |
| Less than 5 Minutes | 11 | 8.2% |
| 5 to 9 Minutes | 14 | 10.4% |
| 10 to 14 Minutes | 25 | 18.5% |
| 15 to 19 Minutes | 45 | 33.3% |
| 20 to 24 Minutes | 28 | 20.7% |
| 25 to 29 Minutes | 0 | 0.0% |
| 30 to 34 Minutes | 11 | 8.2% |
| 35 to 39 Minutes | 0 | 0.0% |
| 40 to 44 Minutes | 0 | 0.0% |
| 45 to 59 Minutes | 1 | 0.7% |
| 60 to 89 Minutes | 0 | 0.0% |
| 90 or more Minutes | 0 | 0.0% |
Commute Time by Sex in Maurice
The most common commute times in Maurice are 15 to 19 minutes (20 commuters, 29.0%) for males and 15 to 19 minutes (25 commuters, 37.9%) for females.
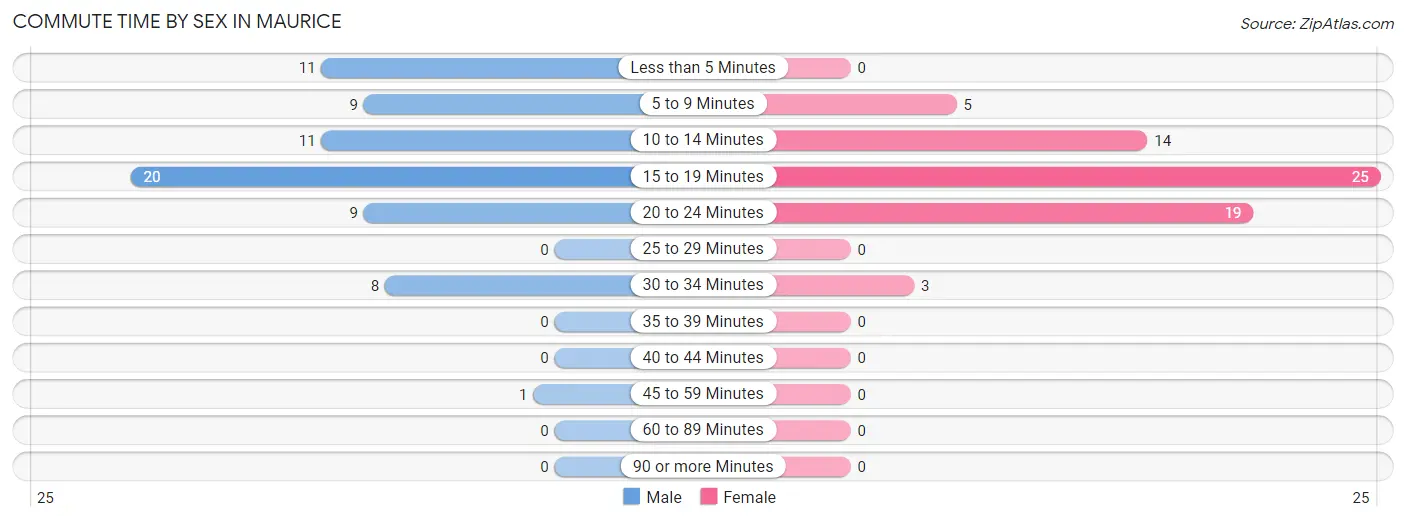
| Commute Time | Male | Female |
| Less than 5 Minutes | 11 (15.9%) | 0 (0.0%) |
| 5 to 9 Minutes | 9 (13.0%) | 5 (7.6%) |
| 10 to 14 Minutes | 11 (15.9%) | 14 (21.2%) |
| 15 to 19 Minutes | 20 (29.0%) | 25 (37.9%) |
| 20 to 24 Minutes | 9 (13.0%) | 19 (28.8%) |
| 25 to 29 Minutes | 0 (0.0%) | 0 (0.0%) |
| 30 to 34 Minutes | 8 (11.6%) | 3 (4.5%) |
| 35 to 39 Minutes | 0 (0.0%) | 0 (0.0%) |
| 40 to 44 Minutes | 0 (0.0%) | 0 (0.0%) |
| 45 to 59 Minutes | 1 (1.5%) | 0 (0.0%) |
| 60 to 89 Minutes | 0 (0.0%) | 0 (0.0%) |
| 90 or more Minutes | 0 (0.0%) | 0 (0.0%) |
Time of Departure to Work by Sex in Maurice
The most frequent times of departure to work in Maurice are 7:30 AM to 7:59 AM (16, 23.2%) for males and 7:30 AM to 7:59 AM (24, 36.4%) for females.
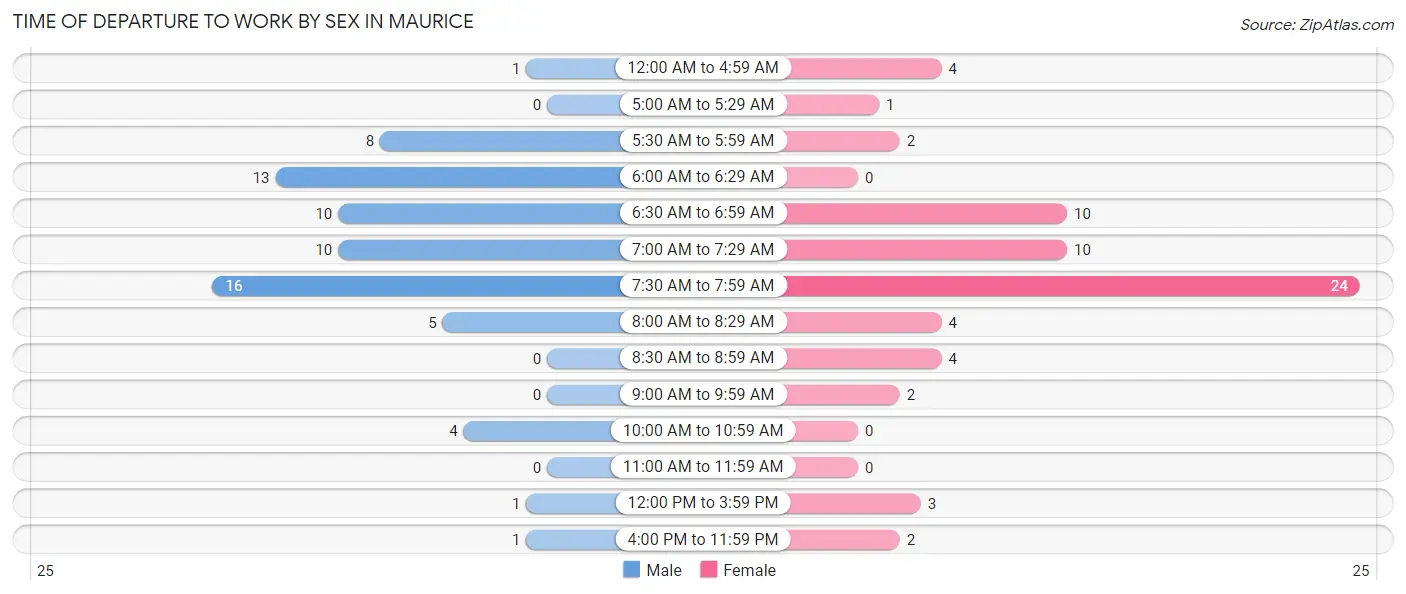
| Time of Departure | Male | Female |
| 12:00 AM to 4:59 AM | 1 (1.5%) | 4 (6.1%) |
| 5:00 AM to 5:29 AM | 0 (0.0%) | 1 (1.5%) |
| 5:30 AM to 5:59 AM | 8 (11.6%) | 2 (3.0%) |
| 6:00 AM to 6:29 AM | 13 (18.8%) | 0 (0.0%) |
| 6:30 AM to 6:59 AM | 10 (14.5%) | 10 (15.1%) |
| 7:00 AM to 7:29 AM | 10 (14.5%) | 10 (15.1%) |
| 7:30 AM to 7:59 AM | 16 (23.2%) | 24 (36.4%) |
| 8:00 AM to 8:29 AM | 5 (7.2%) | 4 (6.1%) |
| 8:30 AM to 8:59 AM | 0 (0.0%) | 4 (6.1%) |
| 9:00 AM to 9:59 AM | 0 (0.0%) | 2 (3.0%) |
| 10:00 AM to 10:59 AM | 4 (5.8%) | 0 (0.0%) |
| 11:00 AM to 11:59 AM | 0 (0.0%) | 0 (0.0%) |
| 12:00 PM to 3:59 PM | 1 (1.5%) | 3 (4.5%) |
| 4:00 PM to 11:59 PM | 1 (1.5%) | 2 (3.0%) |
| Total | 69 (100.0%) | 66 (100.0%) |
Housing Occupancy in Maurice
Occupancy by Ownership in Maurice
Of the total 105 dwellings in Maurice, owner-occupied units account for 99 (94.3%), while renter-occupied units make up 6 (5.7%).
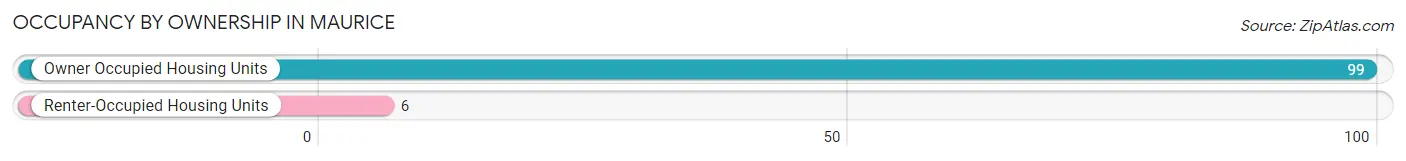
| Occupancy | # Housing Units | % Housing Units |
| Owner Occupied Housing Units | 99 | 94.3% |
| Renter-Occupied Housing Units | 6 | 5.7% |
| Total Occupied Housing Units | 105 | 100.0% |
Occupancy by Household Size in Maurice
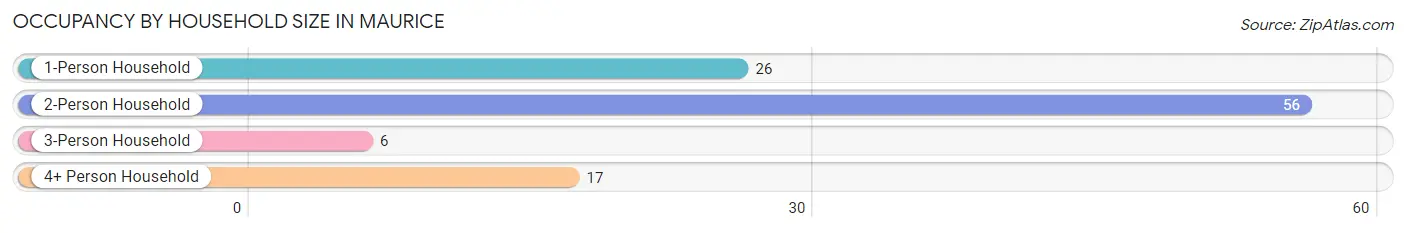
| Household Size | # Housing Units | % Housing Units |
| 1-Person Household | 26 | 24.8% |
| 2-Person Household | 56 | 53.3% |
| 3-Person Household | 6 | 5.7% |
| 4+ Person Household | 17 | 16.2% |
| Total Housing Units | 105 | 100.0% |
Occupancy by Ownership by Household Size in Maurice
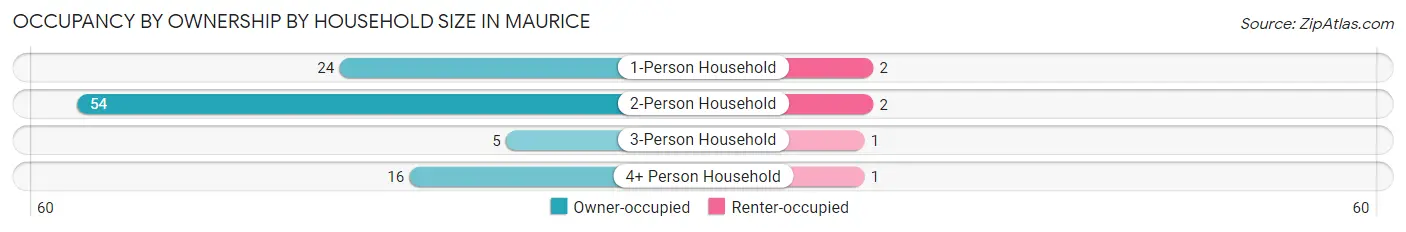
| Household Size | Owner-occupied | Renter-occupied |
| 1-Person Household | 24 (92.3%) | 2 (7.7%) |
| 2-Person Household | 54 (96.4%) | 2 (3.6%) |
| 3-Person Household | 5 (83.3%) | 1 (16.7%) |
| 4+ Person Household | 16 (94.1%) | 1 (5.9%) |
| Total Housing Units | 99 (94.3%) | 6 (5.7%) |
Occupancy by Educational Attainment in Maurice
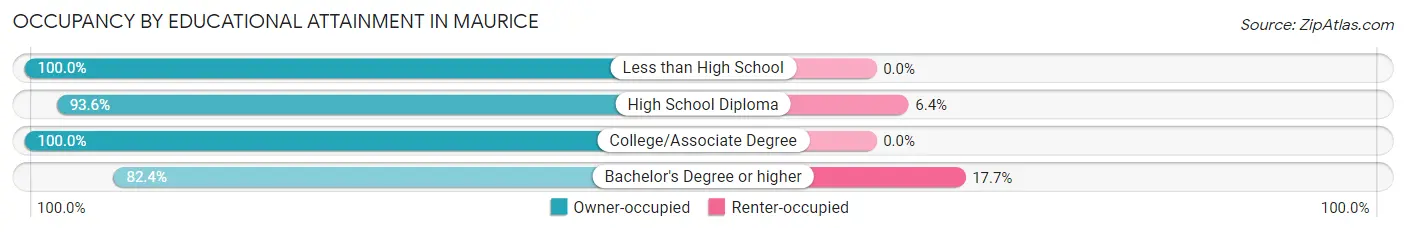
| Household Size | Owner-occupied | Renter-occupied |
| Less than High School | 11 (100.0%) | 0 (0.0%) |
| High School Diploma | 44 (93.6%) | 3 (6.4%) |
| College/Associate Degree | 30 (100.0%) | 0 (0.0%) |
| Bachelor's Degree or higher | 14 (82.4%) | 3 (17.6%) |
Occupancy by Age of Householder in Maurice
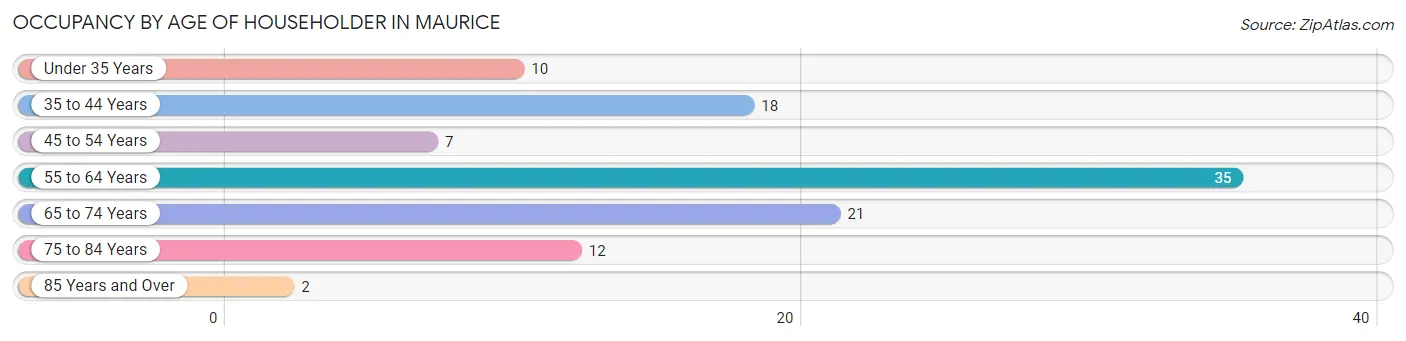
| Age Bracket | # Households | % Households |
| Under 35 Years | 10 | 9.5% |
| 35 to 44 Years | 18 | 17.1% |
| 45 to 54 Years | 7 | 6.7% |
| 55 to 64 Years | 35 | 33.3% |
| 65 to 74 Years | 21 | 20.0% |
| 75 to 84 Years | 12 | 11.4% |
| 85 Years and Over | 2 | 1.9% |
| Total | 105 | 100.0% |
Housing Finances in Maurice
Median Income by Occupancy in Maurice
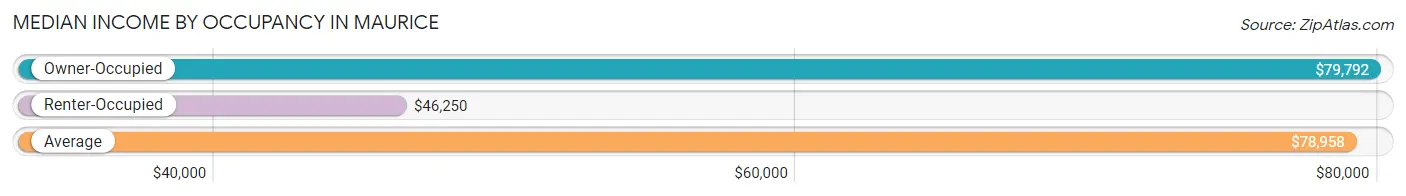
| Occupancy Type | # Households | Median Income |
| Owner-Occupied | 99 (94.3%) | $79,792 |
| Renter-Occupied | 6 (5.7%) | $46,250 |
| Average | 105 (100.0%) | $78,958 |
Occupancy by Householder Income Bracket in Maurice
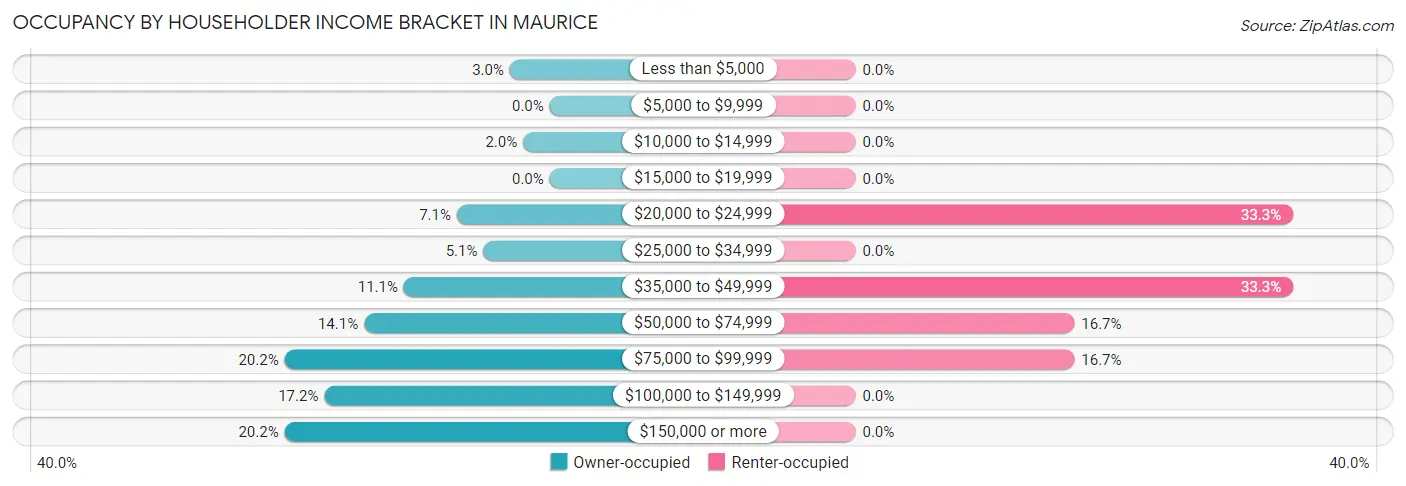
| Income Bracket | Owner-occupied | Renter-occupied |
| Less than $5,000 | 3 (3.0%) | 0 (0.0%) |
| $5,000 to $9,999 | 0 (0.0%) | 0 (0.0%) |
| $10,000 to $14,999 | 2 (2.0%) | 0 (0.0%) |
| $15,000 to $19,999 | 0 (0.0%) | 0 (0.0%) |
| $20,000 to $24,999 | 7 (7.1%) | 2 (33.3%) |
| $25,000 to $34,999 | 5 (5.1%) | 0 (0.0%) |
| $35,000 to $49,999 | 11 (11.1%) | 2 (33.3%) |
| $50,000 to $74,999 | 14 (14.1%) | 1 (16.7%) |
| $75,000 to $99,999 | 20 (20.2%) | 1 (16.7%) |
| $100,000 to $149,999 | 17 (17.2%) | 0 (0.0%) |
| $150,000 or more | 20 (20.2%) | 0 (0.0%) |
| Total | 99 (100.0%) | 6 (100.0%) |
Monthly Housing Cost Tiers in Maurice
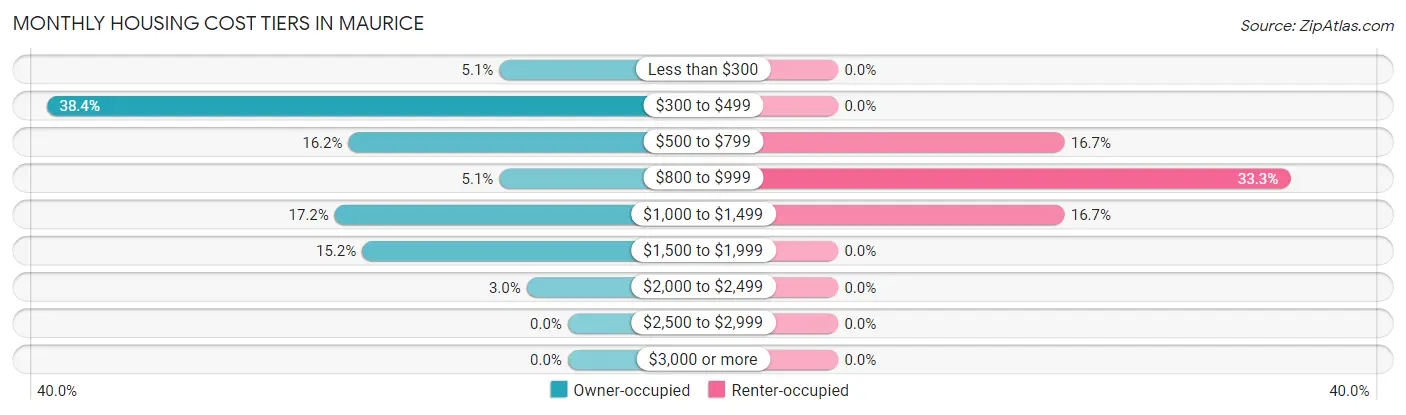
| Monthly Cost | Owner-occupied | Renter-occupied |
| Less than $300 | 5 (5.1%) | 0 (0.0%) |
| $300 to $499 | 38 (38.4%) | 0 (0.0%) |
| $500 to $799 | 16 (16.2%) | 1 (16.7%) |
| $800 to $999 | 5 (5.1%) | 2 (33.3%) |
| $1,000 to $1,499 | 17 (17.2%) | 1 (16.7%) |
| $1,500 to $1,999 | 15 (15.1%) | 0 (0.0%) |
| $2,000 to $2,499 | 3 (3.0%) | 0 (0.0%) |
| $2,500 to $2,999 | 0 (0.0%) | 0 (0.0%) |
| $3,000 or more | 0 (0.0%) | 0 (0.0%) |
| Total | 99 (100.0%) | 6 (100.0%) |
Physical Housing Characteristics in Maurice
Housing Structures in Maurice
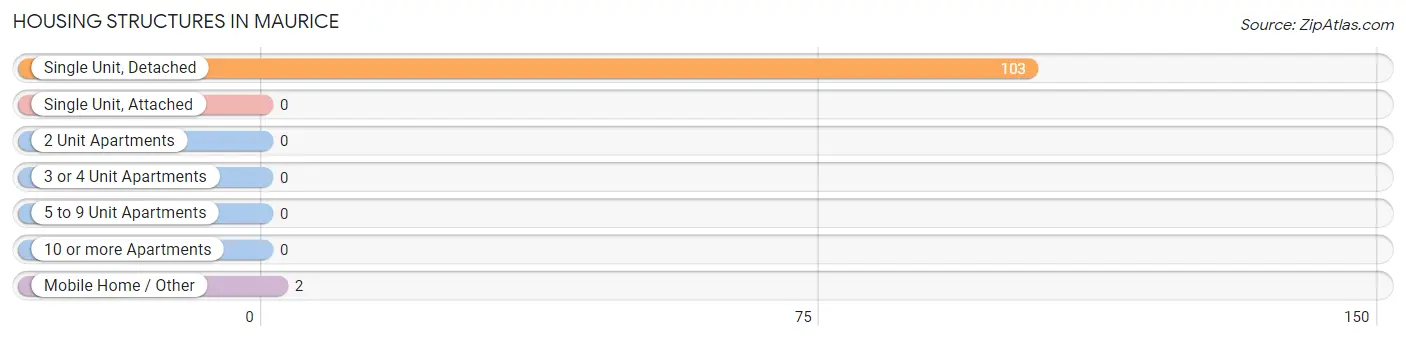
| Structure Type | # Housing Units | % Housing Units |
| Single Unit, Detached | 103 | 98.1% |
| Single Unit, Attached | 0 | 0.0% |
| 2 Unit Apartments | 0 | 0.0% |
| 3 or 4 Unit Apartments | 0 | 0.0% |
| 5 to 9 Unit Apartments | 0 | 0.0% |
| 10 or more Apartments | 0 | 0.0% |
| Mobile Home / Other | 2 | 1.9% |
| Total | 105 | 100.0% |
Housing Structures by Occupancy in Maurice
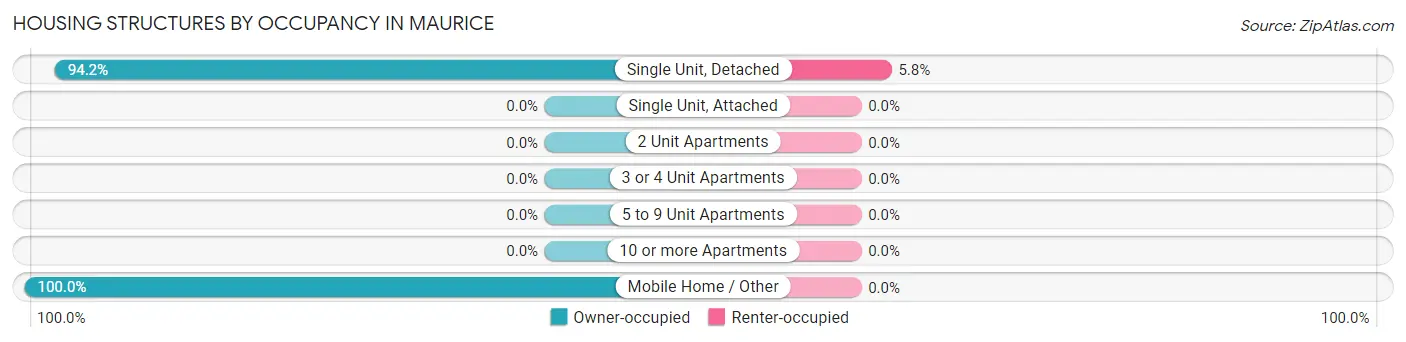
| Structure Type | Owner-occupied | Renter-occupied |
| Single Unit, Detached | 97 (94.2%) | 6 (5.8%) |
| Single Unit, Attached | 0 (0.0%) | 0 (0.0%) |
| 2 Unit Apartments | 0 (0.0%) | 0 (0.0%) |
| 3 or 4 Unit Apartments | 0 (0.0%) | 0 (0.0%) |
| 5 to 9 Unit Apartments | 0 (0.0%) | 0 (0.0%) |
| 10 or more Apartments | 0 (0.0%) | 0 (0.0%) |
| Mobile Home / Other | 2 (100.0%) | 0 (0.0%) |
| Total | 99 (94.3%) | 6 (5.7%) |
Housing Structures by Number of Rooms in Maurice
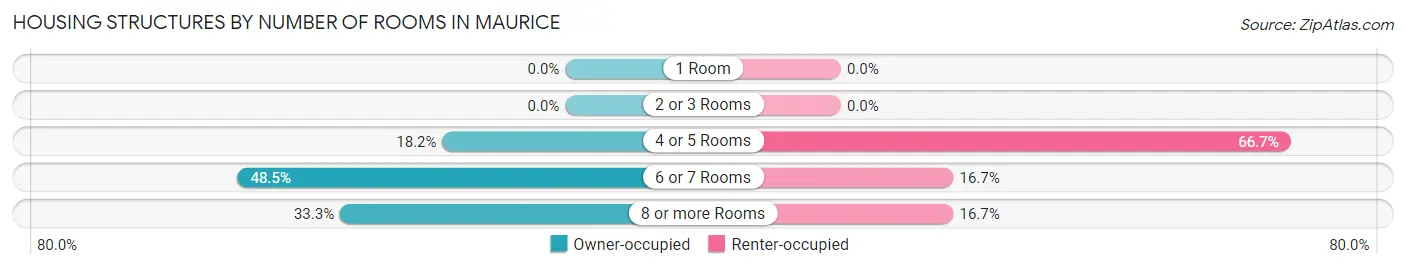
| Number of Rooms | Owner-occupied | Renter-occupied |
| 1 Room | 0 (0.0%) | 0 (0.0%) |
| 2 or 3 Rooms | 0 (0.0%) | 0 (0.0%) |
| 4 or 5 Rooms | 18 (18.2%) | 4 (66.7%) |
| 6 or 7 Rooms | 48 (48.5%) | 1 (16.7%) |
| 8 or more Rooms | 33 (33.3%) | 1 (16.7%) |
| Total | 99 (100.0%) | 6 (100.0%) |
Housing Structure by Heating Type in Maurice
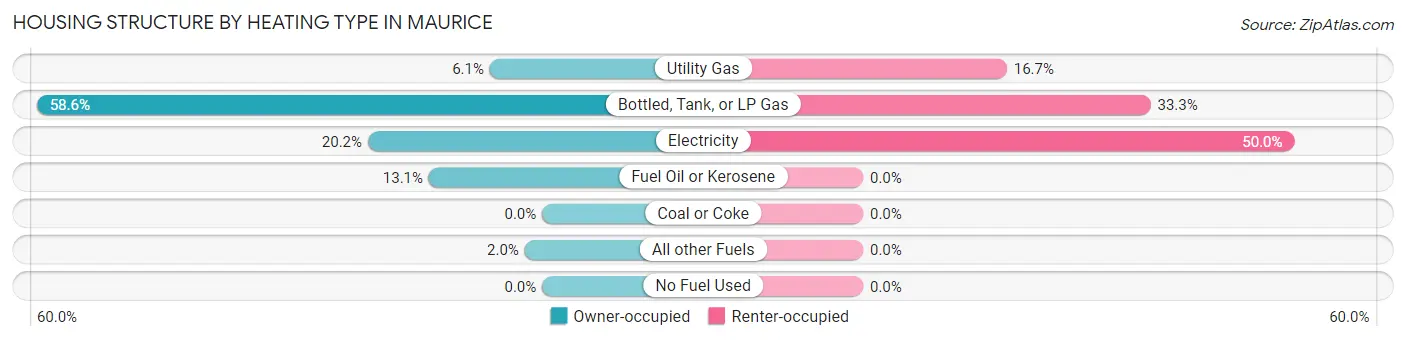
| Heating Type | Owner-occupied | Renter-occupied |
| Utility Gas | 6 (6.1%) | 1 (16.7%) |
| Bottled, Tank, or LP Gas | 58 (58.6%) | 2 (33.3%) |
| Electricity | 20 (20.2%) | 3 (50.0%) |
| Fuel Oil or Kerosene | 13 (13.1%) | 0 (0.0%) |
| Coal or Coke | 0 (0.0%) | 0 (0.0%) |
| All other Fuels | 2 (2.0%) | 0 (0.0%) |
| No Fuel Used | 0 (0.0%) | 0 (0.0%) |
| Total | 99 (100.0%) | 6 (100.0%) |
Household Vehicle Usage in Maurice
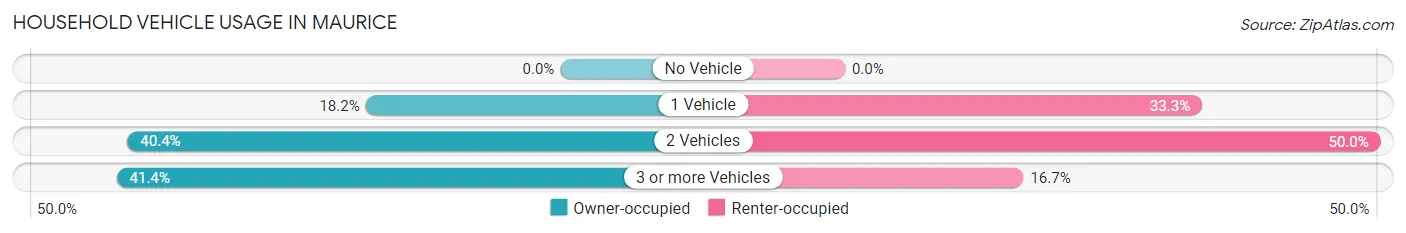
| Vehicles per Household | Owner-occupied | Renter-occupied |
| No Vehicle | 0 (0.0%) | 0 (0.0%) |
| 1 Vehicle | 18 (18.2%) | 2 (33.3%) |
| 2 Vehicles | 40 (40.4%) | 3 (50.0%) |
| 3 or more Vehicles | 41 (41.4%) | 1 (16.7%) |
| Total | 99 (100.0%) | 6 (100.0%) |
Real Estate & Mortgages in Maurice
Real Estate and Mortgage Overview in Maurice
| Characteristic | Without Mortgage | With Mortgage |
| Housing Units | 52 | 47 |
| Median Property Value | $144,400 | $213,500 |
| Median Household Income | $69,167 | $13 |
| Monthly Housing Costs | $393 | $0 |
| Real Estate Taxes | $1,400 | $3 |
Property Value by Mortgage Status in Maurice
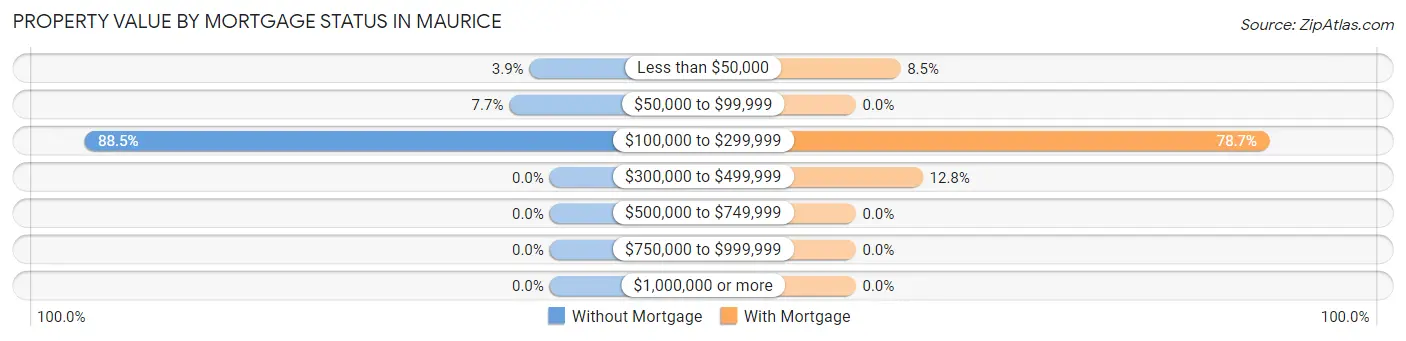
| Property Value | Without Mortgage | With Mortgage |
| Less than $50,000 | 2 (3.8%) | 4 (8.5%) |
| $50,000 to $99,999 | 4 (7.7%) | 0 (0.0%) |
| $100,000 to $299,999 | 46 (88.5%) | 37 (78.7%) |
| $300,000 to $499,999 | 0 (0.0%) | 6 (12.8%) |
| $500,000 to $749,999 | 0 (0.0%) | 0 (0.0%) |
| $750,000 to $999,999 | 0 (0.0%) | 0 (0.0%) |
| $1,000,000 or more | 0 (0.0%) | 0 (0.0%) |
| Total | 52 (100.0%) | 47 (100.0%) |
Household Income by Mortgage Status in Maurice
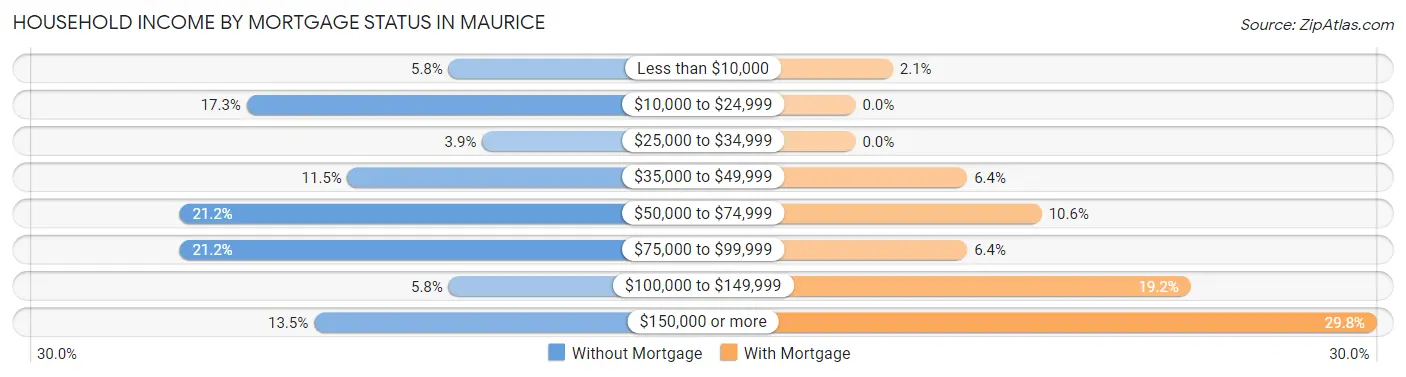
| Household Income | Without Mortgage | With Mortgage |
| Less than $10,000 | 3 (5.8%) | 1 (2.1%) |
| $10,000 to $24,999 | 9 (17.3%) | 0 (0.0%) |
| $25,000 to $34,999 | 2 (3.8%) | 0 (0.0%) |
| $35,000 to $49,999 | 6 (11.5%) | 3 (6.4%) |
| $50,000 to $74,999 | 11 (21.1%) | 5 (10.6%) |
| $75,000 to $99,999 | 11 (21.1%) | 3 (6.4%) |
| $100,000 to $149,999 | 3 (5.8%) | 9 (19.2%) |
| $150,000 or more | 7 (13.5%) | 14 (29.8%) |
| Total | 52 (100.0%) | 47 (100.0%) |
Property Value to Household Income Ratio in Maurice
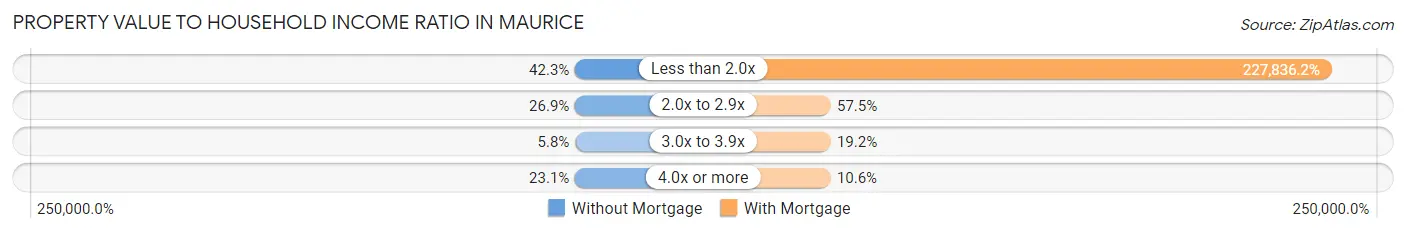
| Value-to-Income Ratio | Without Mortgage | With Mortgage |
| Less than 2.0x | 22 (42.3%) | 107,083 (227,836.2%) |
| 2.0x to 2.9x | 14 (26.9%) | 27 (57.5%) |
| 3.0x to 3.9x | 3 (5.8%) | 9 (19.2%) |
| 4.0x or more | 12 (23.1%) | 5 (10.6%) |
| Total | 52 (100.0%) | 47 (100.0%) |
Real Estate Taxes by Mortgage Status in Maurice
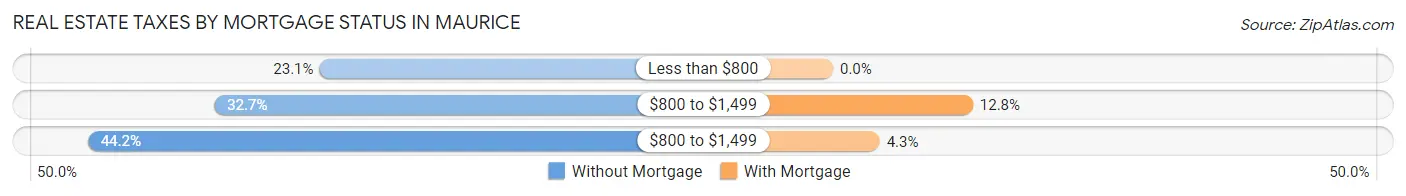
| Property Taxes | Without Mortgage | With Mortgage |
| Less than $800 | 12 (23.1%) | 0 (0.0%) |
| $800 to $1,499 | 17 (32.7%) | 6 (12.8%) |
| $800 to $1,499 | 23 (44.2%) | 2 (4.3%) |
| Total | 52 (100.0%) | 47 (100.0%) |
Health & Disability in Maurice
Health Insurance Coverage by Age in Maurice
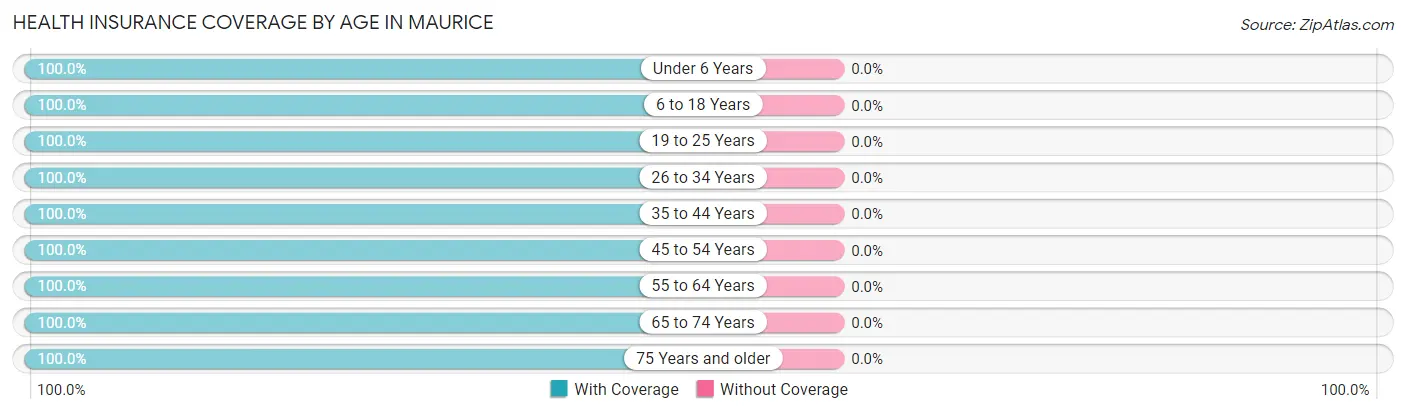
| Age Bracket | With Coverage | Without Coverage |
| Under 6 Years | 18 (100.0%) | 0 (0.0%) |
| 6 to 18 Years | 38 (100.0%) | 0 (0.0%) |
| 19 to 25 Years | 6 (100.0%) | 0 (0.0%) |
| 26 to 34 Years | 20 (100.0%) | 0 (0.0%) |
| 35 to 44 Years | 38 (100.0%) | 0 (0.0%) |
| 45 to 54 Years | 11 (100.0%) | 0 (0.0%) |
| 55 to 64 Years | 60 (100.0%) | 0 (0.0%) |
| 65 to 74 Years | 32 (100.0%) | 0 (0.0%) |
| 75 Years and older | 23 (100.0%) | 0 (0.0%) |
| Total | 246 (100.0%) | 0 (0.0%) |
Health Insurance Coverage by Citizenship Status in Maurice
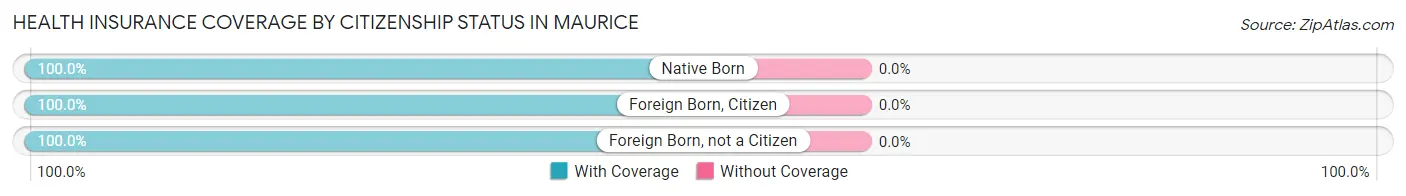
| Citizenship Status | With Coverage | Without Coverage |
| Native Born | 18 (100.0%) | 0 (0.0%) |
| Foreign Born, Citizen | 38 (100.0%) | 0 (0.0%) |
| Foreign Born, not a Citizen | 6 (100.0%) | 0 (0.0%) |
Health Insurance Coverage by Household Income in Maurice
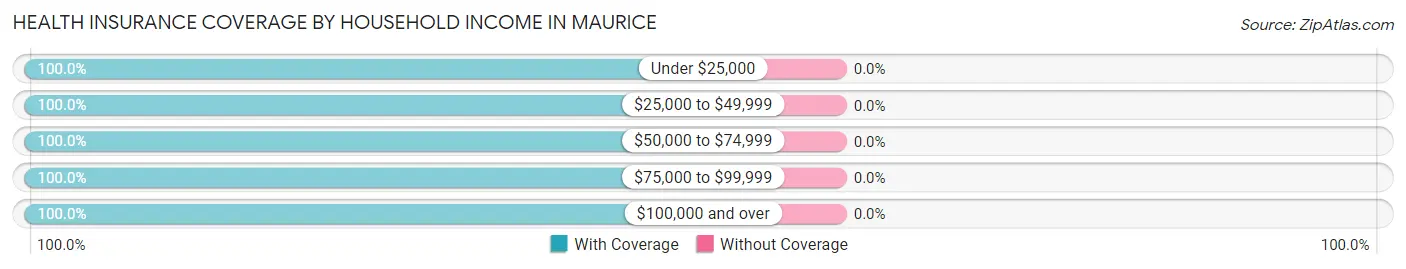
| Household Income | With Coverage | Without Coverage |
| Under $25,000 | 19 (100.0%) | 0 (0.0%) |
| $25,000 to $49,999 | 22 (100.0%) | 0 (0.0%) |
| $50,000 to $74,999 | 52 (100.0%) | 0 (0.0%) |
| $75,000 to $99,999 | 54 (100.0%) | 0 (0.0%) |
| $100,000 and over | 99 (100.0%) | 0 (0.0%) |
Public vs Private Health Insurance Coverage by Age in Maurice
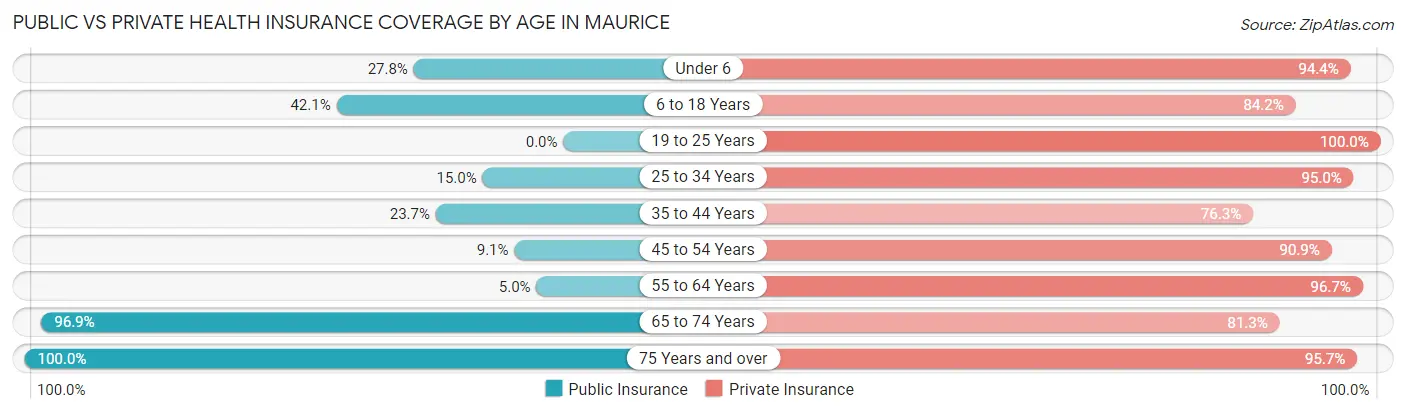
| Age Bracket | Public Insurance | Private Insurance |
| Under 6 | 5 (27.8%) | 17 (94.4%) |
| 6 to 18 Years | 16 (42.1%) | 32 (84.2%) |
| 19 to 25 Years | 0 (0.0%) | 6 (100.0%) |
| 25 to 34 Years | 3 (15.0%) | 19 (95.0%) |
| 35 to 44 Years | 9 (23.7%) | 29 (76.3%) |
| 45 to 54 Years | 1 (9.1%) | 10 (90.9%) |
| 55 to 64 Years | 3 (5.0%) | 58 (96.7%) |
| 65 to 74 Years | 31 (96.9%) | 26 (81.2%) |
| 75 Years and over | 23 (100.0%) | 22 (95.7%) |
| Total | 91 (37.0%) | 219 (89.0%) |
Disability Status by Sex by Age in Maurice
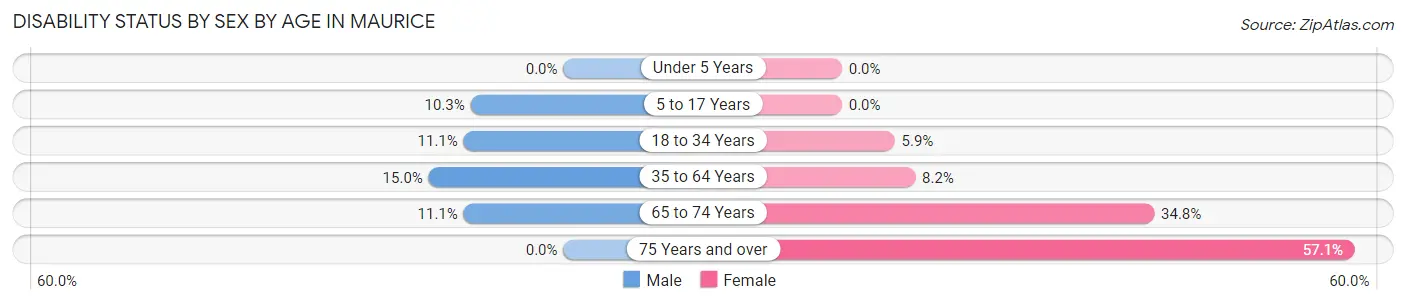
| Age Bracket | Male | Female |
| Under 5 Years | 0 (0.0%) | 0 (0.0%) |
| 5 to 17 Years | 3 (10.3%) | 0 (0.0%) |
| 18 to 34 Years | 1 (11.1%) | 1 (5.9%) |
| 35 to 64 Years | 9 (15.0%) | 4 (8.2%) |
| 65 to 74 Years | 1 (11.1%) | 8 (34.8%) |
| 75 Years and over | 0 (0.0%) | 8 (57.1%) |
Disability Class by Sex by Age in Maurice
Disability Class: Hearing Difficulty
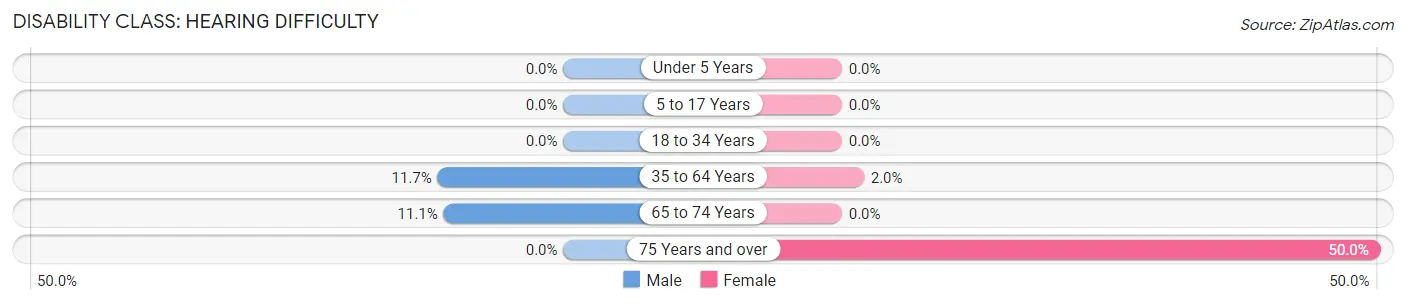
| Age Bracket | Male | Female |
| Under 5 Years | 0 (0.0%) | 0 (0.0%) |
| 5 to 17 Years | 0 (0.0%) | 0 (0.0%) |
| 18 to 34 Years | 0 (0.0%) | 0 (0.0%) |
| 35 to 64 Years | 7 (11.7%) | 1 (2.0%) |
| 65 to 74 Years | 1 (11.1%) | 0 (0.0%) |
| 75 Years and over | 0 (0.0%) | 7 (50.0%) |
Disability Class: Vision Difficulty
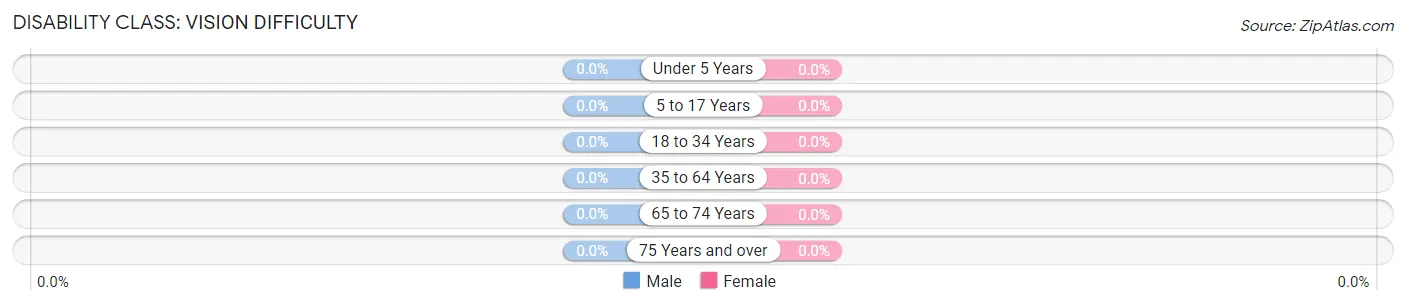
| Age Bracket | Male | Female |
| Under 5 Years | 0 (0.0%) | 0 (0.0%) |
| 5 to 17 Years | 0 (0.0%) | 0 (0.0%) |
| 18 to 34 Years | 0 (0.0%) | 0 (0.0%) |
| 35 to 64 Years | 0 (0.0%) | 0 (0.0%) |
| 65 to 74 Years | 0 (0.0%) | 0 (0.0%) |
| 75 Years and over | 0 (0.0%) | 0 (0.0%) |
Disability Class: Cognitive Difficulty
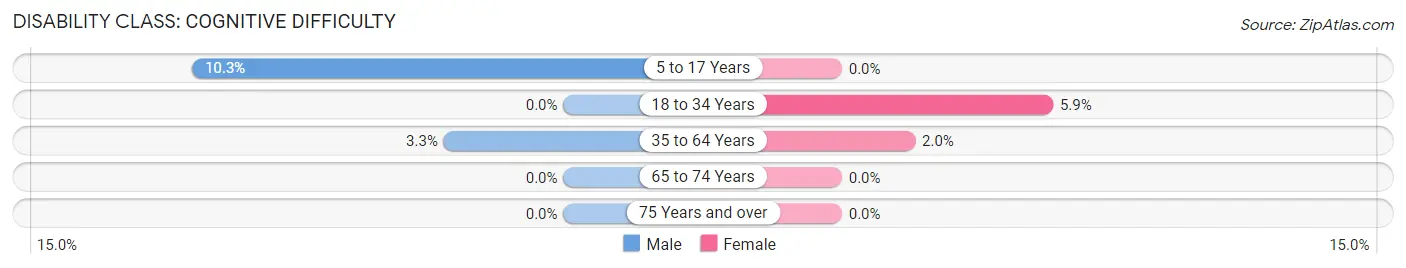
| Age Bracket | Male | Female |
| 5 to 17 Years | 3 (10.3%) | 0 (0.0%) |
| 18 to 34 Years | 0 (0.0%) | 1 (5.9%) |
| 35 to 64 Years | 2 (3.3%) | 1 (2.0%) |
| 65 to 74 Years | 0 (0.0%) | 0 (0.0%) |
| 75 Years and over | 0 (0.0%) | 0 (0.0%) |
Disability Class: Ambulatory Difficulty
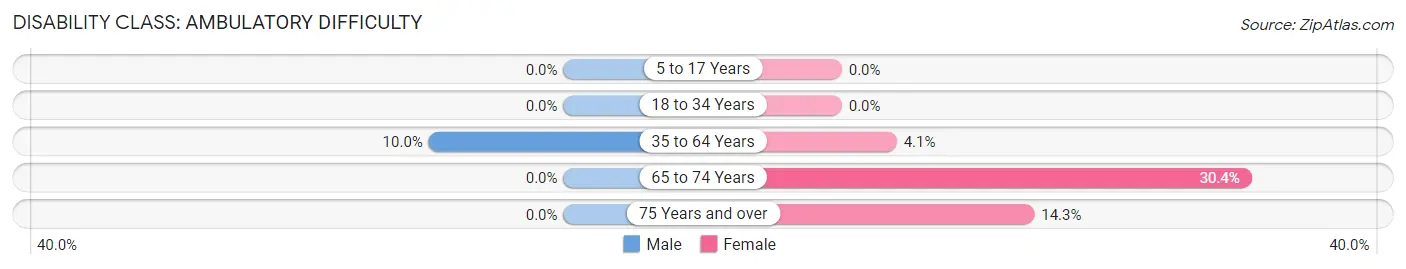
| Age Bracket | Male | Female |
| 5 to 17 Years | 0 (0.0%) | 0 (0.0%) |
| 18 to 34 Years | 0 (0.0%) | 0 (0.0%) |
| 35 to 64 Years | 6 (10.0%) | 2 (4.1%) |
| 65 to 74 Years | 0 (0.0%) | 7 (30.4%) |
| 75 Years and over | 0 (0.0%) | 2 (14.3%) |
Disability Class: Self-Care Difficulty
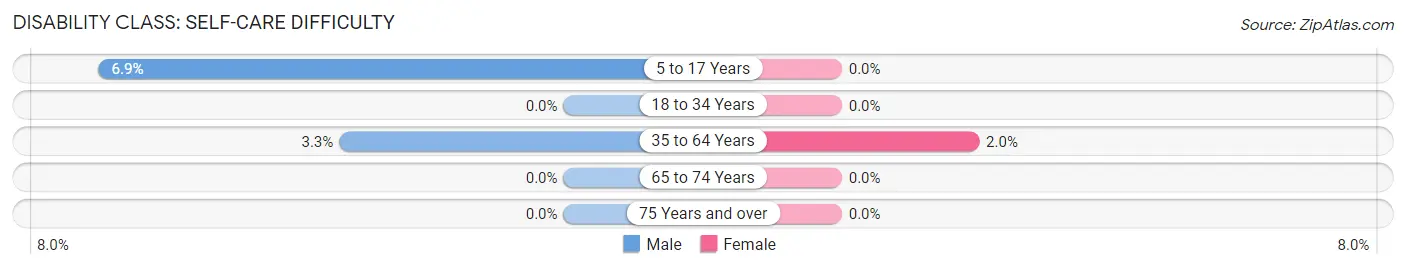
| Age Bracket | Male | Female |
| 5 to 17 Years | 2 (6.9%) | 0 (0.0%) |
| 18 to 34 Years | 0 (0.0%) | 0 (0.0%) |
| 35 to 64 Years | 2 (3.3%) | 1 (2.0%) |
| 65 to 74 Years | 0 (0.0%) | 0 (0.0%) |
| 75 Years and over | 0 (0.0%) | 0 (0.0%) |
Technology Access in Maurice
Computing Device Access in Maurice
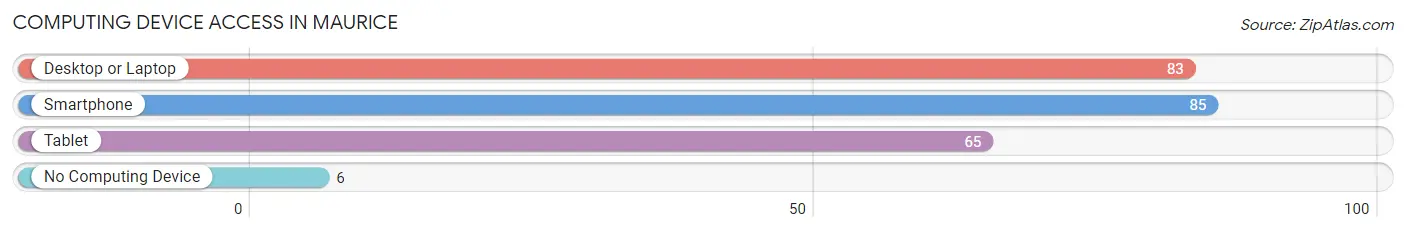
| Device Type | # Households | % Households |
| Desktop or Laptop | 83 | 79.0% |
| Smartphone | 85 | 80.9% |
| Tablet | 65 | 61.9% |
| No Computing Device | 6 | 5.7% |
| Total | 105 | 100.0% |
Internet Access in Maurice
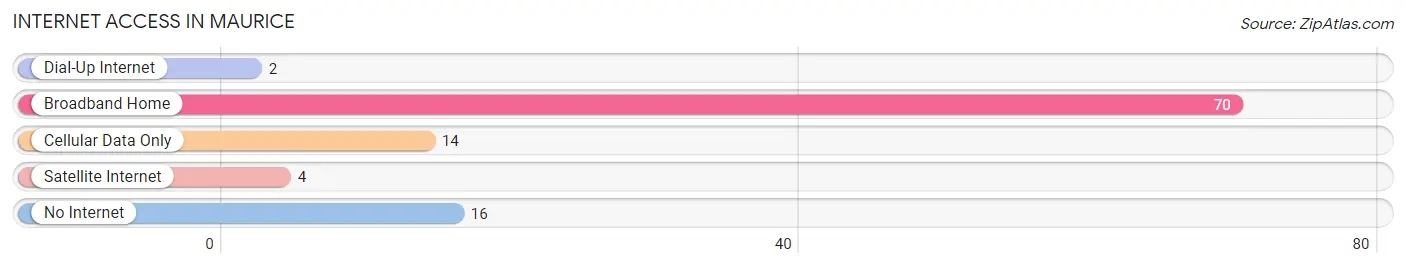
| Internet Type | # Households | % Households |
| Dial-Up Internet | 2 | 1.9% |
| Broadband Home | 70 | 66.7% |
| Cellular Data Only | 14 | 13.3% |
| Satellite Internet | 4 | 3.8% |
| No Internet | 16 | 15.2% |
| Total | 105 | 100.0% |
Maurice Summary
Maurice, Iowa is a small town located in Sioux County, Iowa. It is situated in the northwest corner of the state, just south of the Big Sioux River. The town was founded in 1881 and has a population of approximately 1,000 people.
Geography
Maurice is located in the northwest corner of Iowa, just south of the Big Sioux River. The town is situated on the banks of the river, and is surrounded by rolling hills and farmland. The town is located in the Loess Hills region of Iowa, which is characterized by its steep, rolling hills and deep ravines. The town is located in the Central Time Zone and has an elevation of 1,072 feet.
Economy
Maurice is a small, rural town with a primarily agricultural economy. The town is home to several farms, which produce a variety of crops, including corn, soybeans, and hay. The town also has a few small businesses, including a grocery store, a hardware store, and a few restaurants.
Demographics
As of the 2010 census, the population of Maurice was 1,000 people. The racial makeup of the town was 97.2% White, 0.7% African American, 0.3% Native American, 0.2% Asian, 0.1% Pacific Islander, and 1.5% from two or more races. The median household income was $45,000, and the median family income was $50,000.
History
Maurice was founded in 1881 by a group of settlers from the Netherlands. The town was named after Maurice, Prince of Orange, who was the leader of the Dutch revolt against Spain in the 16th century. The town was originally a farming community, and the settlers built a church and a school. The town grew slowly over the years, and by the early 20th century, it had become a small but thriving community.
In the 1950s, the town began to experience a period of growth and development. The town was connected to the nearby city of Sioux Center by a paved road, and the town began to attract new businesses and residents. The town also began to attract tourists, who came to enjoy the town's rural charm and scenic beauty.
Today, Maurice is a small but vibrant community. The town is home to a variety of businesses, including a grocery store, a hardware store, and several restaurants. The town also has a number of parks and recreational facilities, including a golf course and a swimming pool. The town is also home to a number of churches, and the town's annual Dutch Days celebration is a popular event.
Common Questions
What is Per Capita Income in Maurice?
Per Capita income in Maurice is $46,958.
What is the Median Family Income in Maurice?
Median Family Income in Maurice is $91,250.
What is the Median Household income in Maurice?
Median Household Income in Maurice is $78,958.
What is Income or Wage Gap in Maurice?
Income or Wage Gap in Maurice is 57.2%.
Women in Maurice earn 42.8 cents for every dollar earned by a man.
What is Inequality or Gini Index in Maurice?
Inequality or Gini Index in Maurice is 0.48.
What is the Total Population of Maurice?
Total Population of Maurice is 246.
What is the Total Male Population of Maurice?
Total Male Population of Maurice is 119.
What is the Total Female Population of Maurice?
Total Female Population of Maurice is 127.
What is the Ratio of Males per 100 Females in Maurice?
There are 93.70 Males per 100 Females in Maurice.
What is the Ratio of Females per 100 Males in Maurice?
There are 106.72 Females per 100 Males in Maurice.
What is the Median Population Age in Maurice?
Median Population Age in Maurice is 47.5 Years.
What is the Average Family Size in Maurice
Average Family Size in Maurice is 2.7 People.
What is the Average Household Size in Maurice
Average Household Size in Maurice is 2.3 People.
How Large is the Labor Force in Maurice?
There are 143 People in the Labor Forcein in Maurice.
What is the Percentage of People in the Labor Force in Maurice?
75.3% of People are in the Labor Force in Maurice.
What is the Unemployment Rate in Maurice?
Unemployment Rate in Maurice is 1.4%.