Fertile, IA Map & Demographics
Fertile Map
Fertile Overview
$37,907
PER CAPITA INCOME
$80,750
AVG FAMILY INCOME
$57,500
AVG HOUSEHOLD INCOME
26.9%
WAGE / INCOME GAP [ % ]
73.1¢/ $1
WAGE / INCOME GAP [ $ ]
0.35
INEQUALITY / GINI INDEX
298
TOTAL POPULATION
159
MALE POPULATION
139
FEMALE POPULATION
114.39
MALES / 100 FEMALES
87.42
FEMALES / 100 MALES
57.7
MEDIAN AGE
2.3
AVG FAMILY SIZE
1.9
AVG HOUSEHOLD SIZE
171
LABOR FORCE [ PEOPLE ]
64.0%
PERCENT IN LABOR FORCE
Fertile Zip Codes
Fertile Area Codes
Income in Fertile
Income Overview in Fertile
Per Capita Income in Fertile is $37,907, while median incomes of families and households are $80,750 and $57,500 respectively.
| Characteristic | Number | Measure |
| Per Capita Income | 298 | $37,907 |
| Median Family Income | 103 | $80,750 |
| Mean Family Income | 103 | $83,910 |
| Median Household Income | 158 | $57,500 |
| Mean Household Income | 158 | $73,642 |
| Income Deficit | 103 | $0 |
| Wage / Income Gap (%) | 298 | 26.91% |
| Wage / Income Gap ($) | 298 | 73.09¢ per $1 |
| Gini / Inequality Index | 298 | 0.35 |
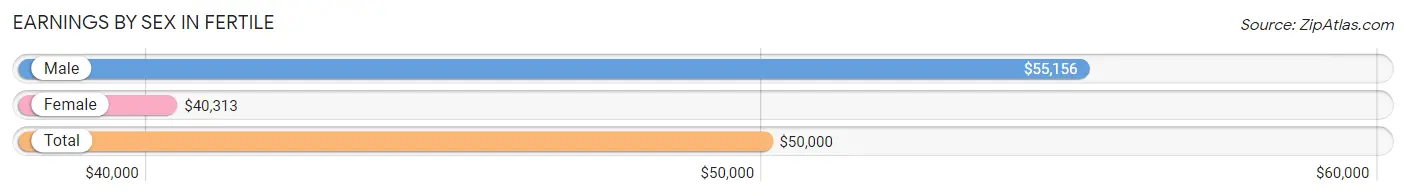
Earnings by Sex in Fertile
Average Earnings in Fertile are $50,000, $55,156 for men and $40,313 for women, a difference of 26.9%.
| Sex | Number | Average Earnings |
| Male | 95 (54.0%) | $55,156 |
| Female | 81 (46.0%) | $40,313 |
| Total | 176 (100.0%) | $50,000 |
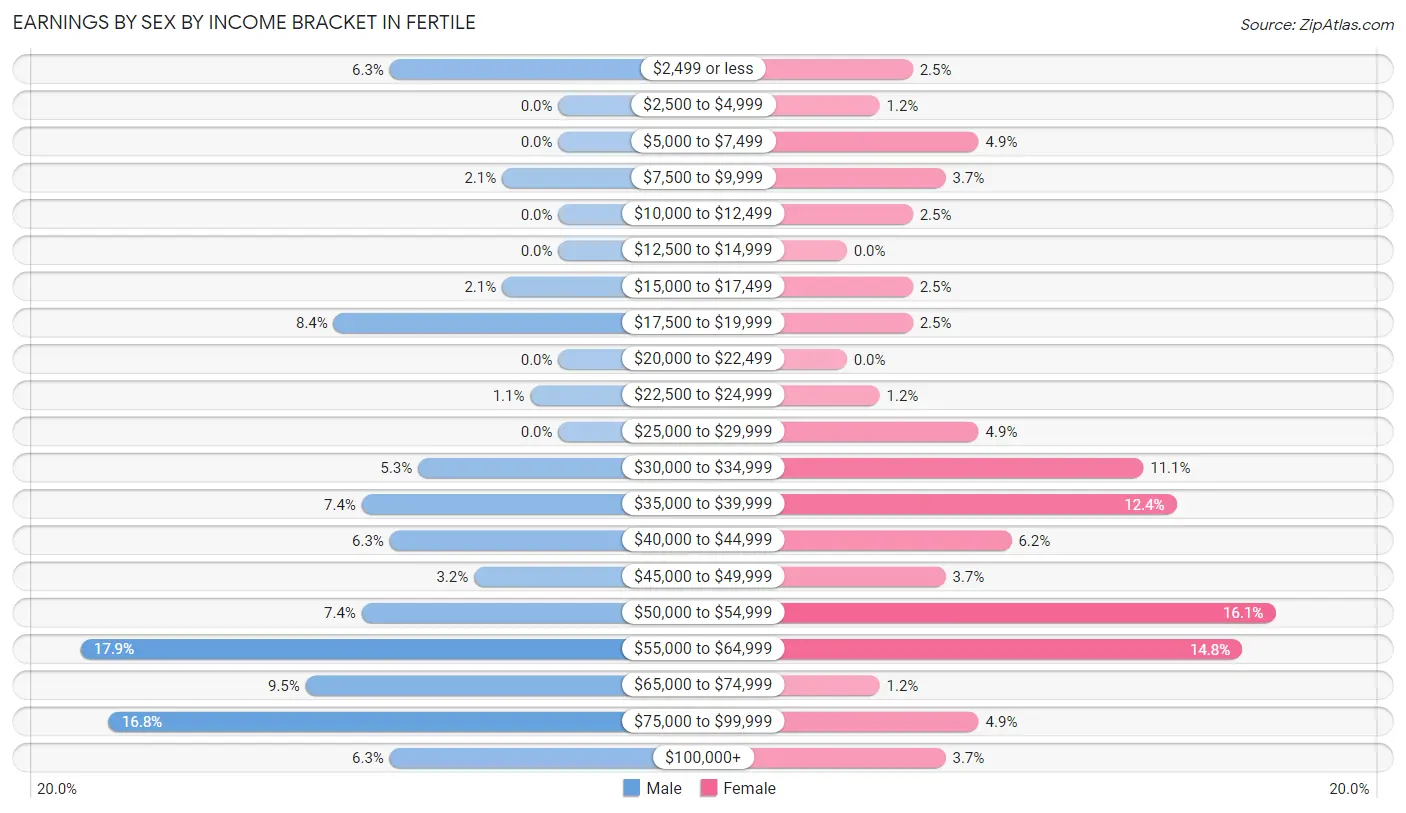
Earnings by Sex by Income Bracket in Fertile
The most common earnings brackets in Fertile are $55,000 to $64,999 for men (17 | 17.9%) and $50,000 to $54,999 for women (13 | 16.1%).
| Income | Male | Female |
| $2,499 or less | 6 (6.3%) | 2 (2.5%) |
| $2,500 to $4,999 | 0 (0.0%) | 1 (1.2%) |
| $5,000 to $7,499 | 0 (0.0%) | 4 (4.9%) |
| $7,500 to $9,999 | 2 (2.1%) | 3 (3.7%) |
| $10,000 to $12,499 | 0 (0.0%) | 2 (2.5%) |
| $12,500 to $14,999 | 0 (0.0%) | 0 (0.0%) |
| $15,000 to $17,499 | 2 (2.1%) | 2 (2.5%) |
| $17,500 to $19,999 | 8 (8.4%) | 2 (2.5%) |
| $20,000 to $22,499 | 0 (0.0%) | 0 (0.0%) |
| $22,500 to $24,999 | 1 (1.1%) | 1 (1.2%) |
| $25,000 to $29,999 | 0 (0.0%) | 4 (4.9%) |
| $30,000 to $34,999 | 5 (5.3%) | 9 (11.1%) |
| $35,000 to $39,999 | 7 (7.4%) | 10 (12.3%) |
| $40,000 to $44,999 | 6 (6.3%) | 5 (6.2%) |
| $45,000 to $49,999 | 3 (3.2%) | 3 (3.7%) |
| $50,000 to $54,999 | 7 (7.4%) | 13 (16.1%) |
| $55,000 to $64,999 | 17 (17.9%) | 12 (14.8%) |
| $65,000 to $74,999 | 9 (9.5%) | 1 (1.2%) |
| $75,000 to $99,999 | 16 (16.8%) | 4 (4.9%) |
| $100,000+ | 6 (6.3%) | 3 (3.7%) |
| Total | 95 (100.0%) | 81 (100.0%) |
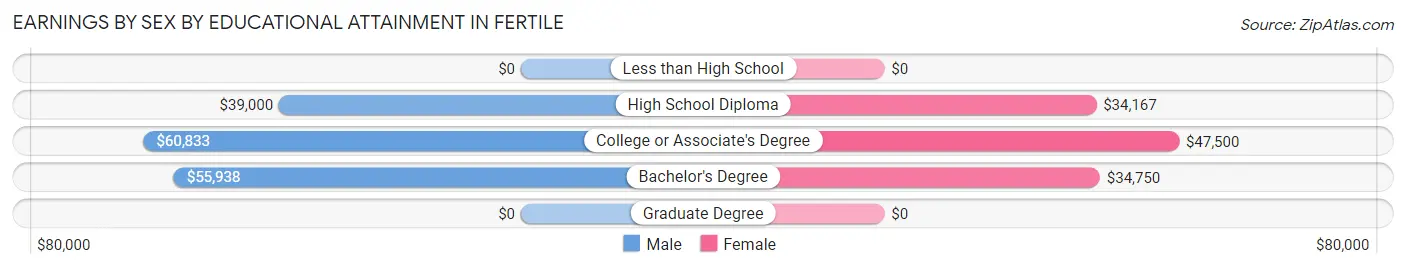
Earnings by Sex by Educational Attainment in Fertile
Average earnings in Fertile are $54,500 for men and $40,625 for women, a difference of 25.5%. Men with an educational attainment of college or associate's degree enjoy the highest average annual earnings of $60,833, while those with high school diploma education earn the least with $39,000. Women with an educational attainment of college or associate's degree earn the most with the average annual earnings of $47,500, while those with high school diploma education have the smallest earnings of $34,167.
| Educational Attainment | Male Income | Female Income |
| Less than High School | - | - |
| High School Diploma | $39,000 | $34,167 |
| College or Associate's Degree | $60,833 | $47,500 |
| Bachelor's Degree | $55,938 | $34,750 |
| Graduate Degree | - | - |
| Total | $54,500 | $40,625 |
Family Income in Fertile
Family Income Brackets in Fertile
According to the Fertile family income data, there are 32 families falling into the $100,000 to $149,999 income range, which is the most common income bracket and makes up 31.1% of all families.
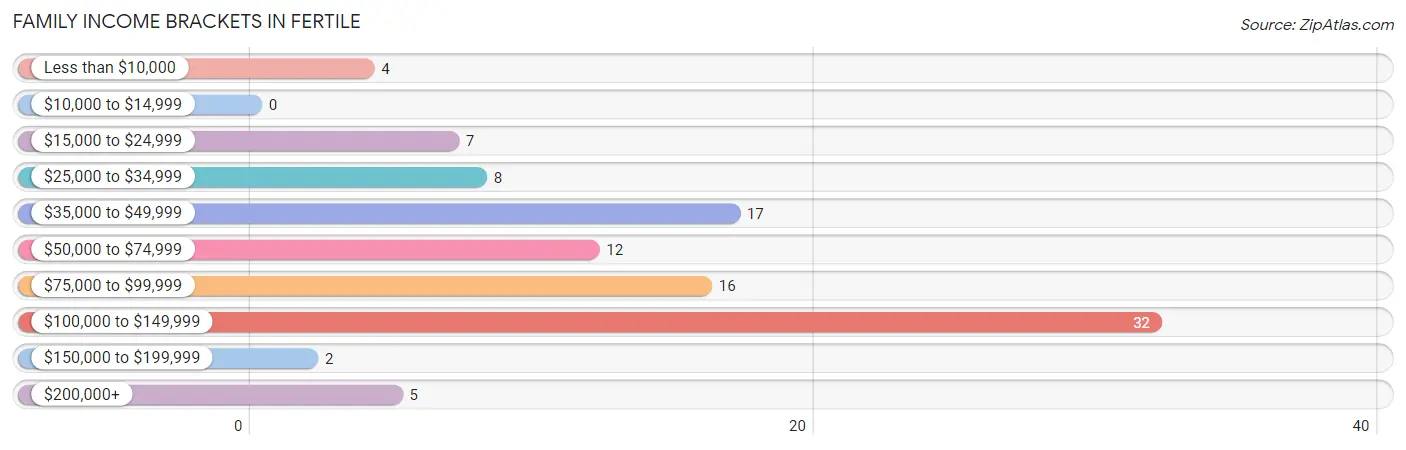
| Income Bracket | # Families | % Families |
| Less than $10,000 | 4 | 3.9% |
| $10,000 to $14,999 | 0 | 0.0% |
| $15,000 to $24,999 | 7 | 6.8% |
| $25,000 to $34,999 | 8 | 7.8% |
| $35,000 to $49,999 | 17 | 16.5% |
| $50,000 to $74,999 | 12 | 11.7% |
| $75,000 to $99,999 | 16 | 15.5% |
| $100,000 to $149,999 | 32 | 31.1% |
| $150,000 to $199,999 | 2 | 1.9% |
| $200,000+ | 5 | 4.9% |
Family Income by Famaliy Size in Fertile
4-person families (14 | 13.6%) account for the highest median family income in Fertile with $114,167 per family, while 3-person families (10 | 9.7%) have the highest median income of $33,333 per family member.
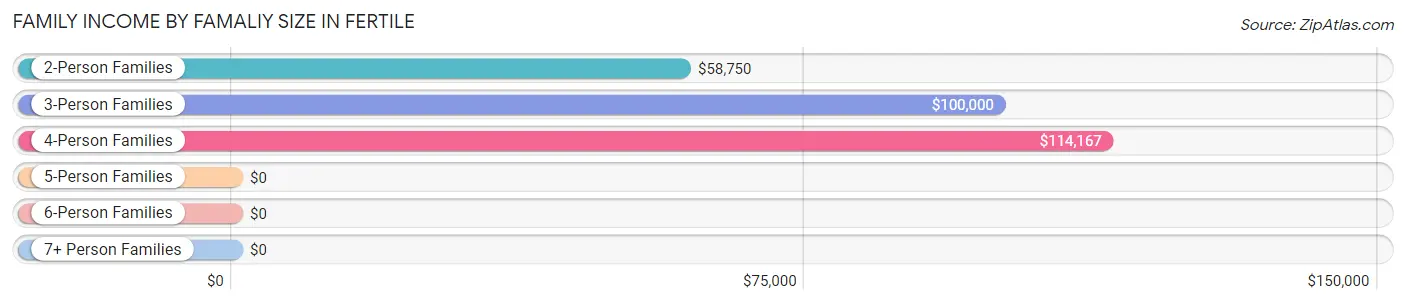
| Income Bracket | # Families | Median Income |
| 2-Person Families | 77 (74.8%) | $58,750 |
| 3-Person Families | 10 (9.7%) | $100,000 |
| 4-Person Families | 14 (13.6%) | $114,167 |
| 5-Person Families | 2 (1.9%) | $0 |
| 6-Person Families | 0 (0.0%) | $0 |
| 7+ Person Families | 0 (0.0%) | $0 |
| Total | 103 (100.0%) | $80,750 |
Family Income by Number of Earners in Fertile
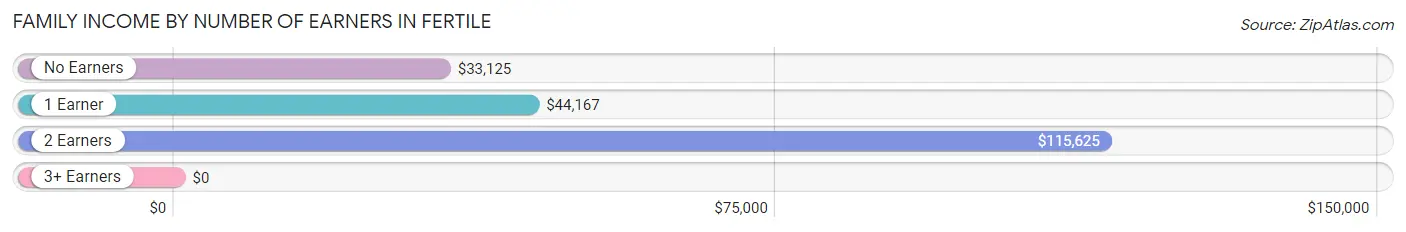
| Number of Earners | # Families | Median Income |
| No Earners | 23 (22.3%) | $33,125 |
| 1 Earner | 28 (27.2%) | $44,167 |
| 2 Earners | 49 (47.6%) | $115,625 |
| 3+ Earners | 3 (2.9%) | $0 |
| Total | 103 (100.0%) | $80,750 |
Household Income in Fertile
Household Income Brackets in Fertile
With 34 households falling in the category, the $100,000 to $149,999 income range is the most frequent in Fertile, accounting for 21.5% of all households. In contrast, only 1 households (0.6%) fall into the $10,000 to $14,999 income bracket, making it the least populous group.
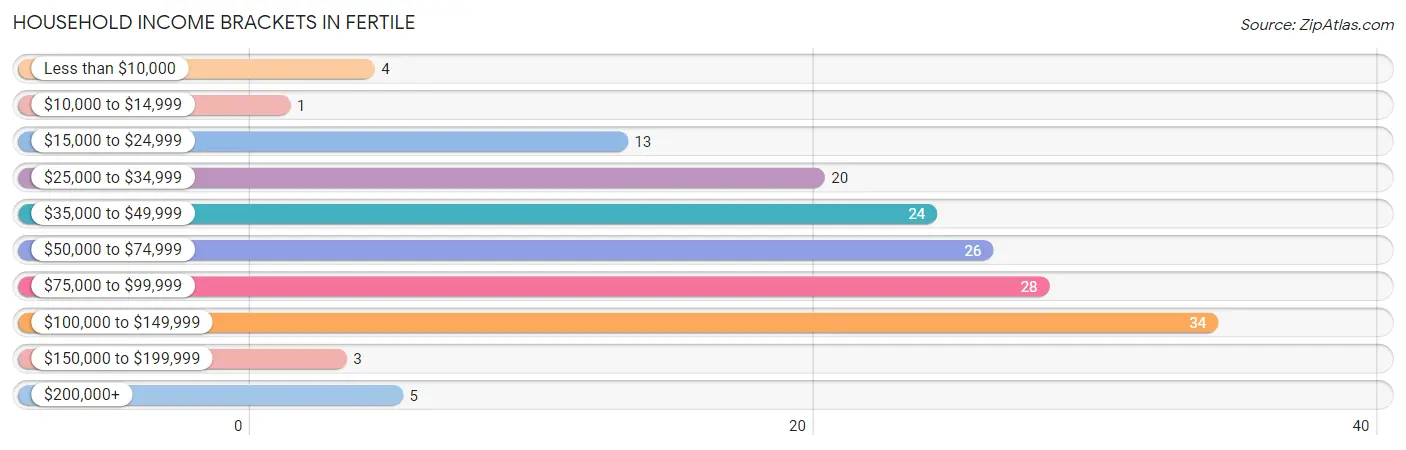
| Income Bracket | # Households | % Households |
| Less than $10,000 | 4 | 2.5% |
| $10,000 to $14,999 | 1 | 0.6% |
| $15,000 to $24,999 | 13 | 8.2% |
| $25,000 to $34,999 | 20 | 12.7% |
| $35,000 to $49,999 | 24 | 15.2% |
| $50,000 to $74,999 | 26 | 16.5% |
| $75,000 to $99,999 | 28 | 17.7% |
| $100,000 to $149,999 | 34 | 21.5% |
| $150,000 to $199,999 | 3 | 1.9% |
| $200,000+ | 5 | 3.2% |
Household Income by Householder Age in Fertile
The median household income in Fertile is $57,500, with the highest median household income of $86,719 found in the 25 to 44 years age bracket for the primary householder. A total of 39 households (24.7%) fall into this category. Meanwhile, the 15 to 24 years age bracket for the primary householder has the lowest median household income of $0, with 2 households (1.3%) in this group.
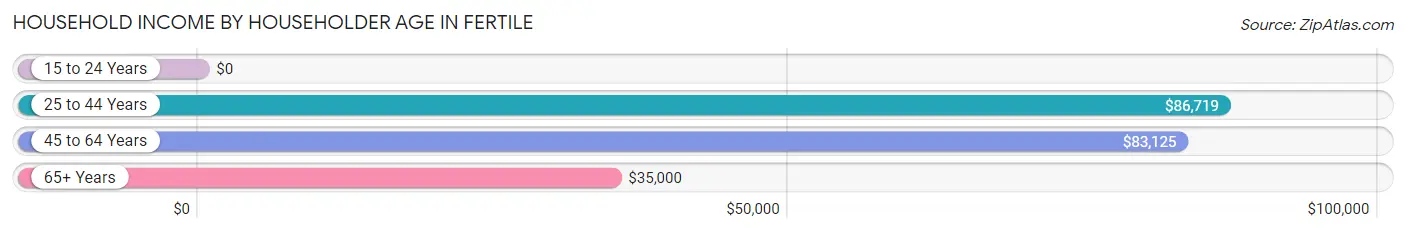
| Income Bracket | # Households | Median Income |
| 15 to 24 Years | 2 (1.3%) | $0 |
| 25 to 44 Years | 39 (24.7%) | $86,719 |
| 45 to 64 Years | 63 (39.9%) | $83,125 |
| 65+ Years | 54 (34.2%) | $35,000 |
| Total | 158 (100.0%) | $57,500 |
Poverty in Fertile
Income Below Poverty by Sex and Age in Fertile
With 4.4% poverty level for males and 4.3% for females among the residents of Fertile, 35 to 44 year old males and 65 to 74 year old females are the most vulnerable to poverty, with 3 males (18.8%) and 2 females (11.8%) in their respective age groups living below the poverty level.
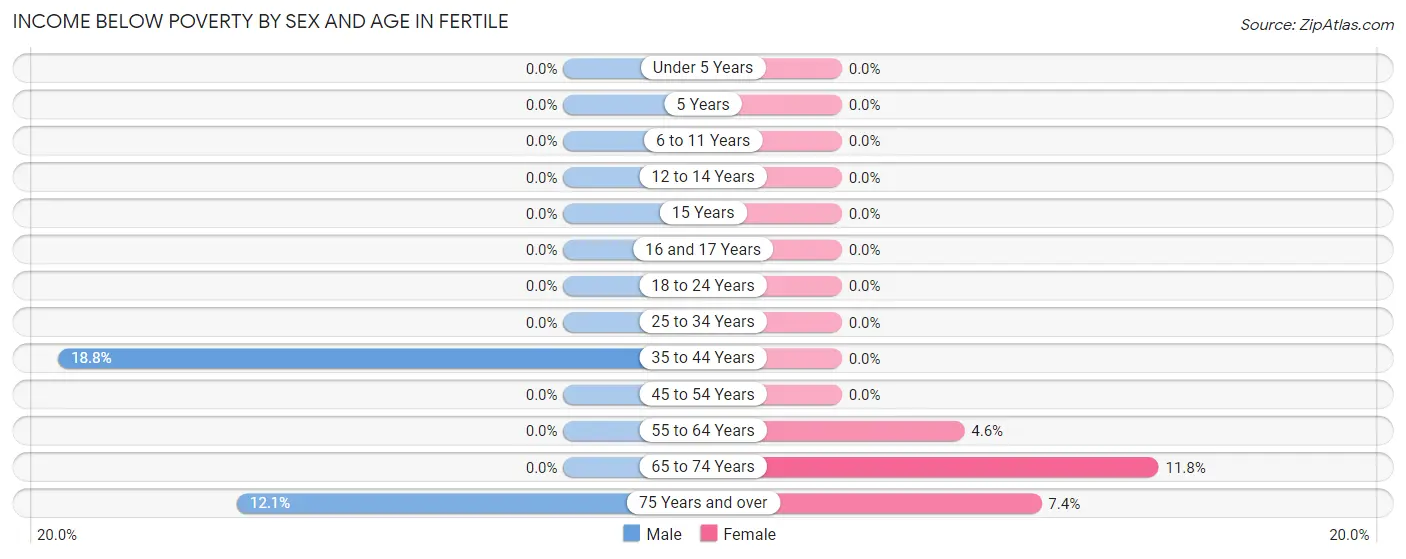
| Age Bracket | Male | Female |
| Under 5 Years | 0 (0.0%) | 0 (0.0%) |
| 5 Years | 0 (0.0%) | 0 (0.0%) |
| 6 to 11 Years | 0 (0.0%) | 0 (0.0%) |
| 12 to 14 Years | 0 (0.0%) | 0 (0.0%) |
| 15 Years | 0 (0.0%) | 0 (0.0%) |
| 16 and 17 Years | 0 (0.0%) | 0 (0.0%) |
| 18 to 24 Years | 0 (0.0%) | 0 (0.0%) |
| 25 to 34 Years | 0 (0.0%) | 0 (0.0%) |
| 35 to 44 Years | 3 (18.8%) | 0 (0.0%) |
| 45 to 54 Years | 0 (0.0%) | 0 (0.0%) |
| 55 to 64 Years | 0 (0.0%) | 2 (4.5%) |
| 65 to 74 Years | 0 (0.0%) | 2 (11.8%) |
| 75 Years and over | 4 (12.1%) | 2 (7.4%) |
| Total | 7 (4.4%) | 6 (4.3%) |
Income Above Poverty by Sex and Age in Fertile
According to the poverty statistics in Fertile, males aged under 5 years and females aged under 5 years are the age groups that are most secure financially, with 100.0% of males and 100.0% of females in these age groups living above the poverty line.
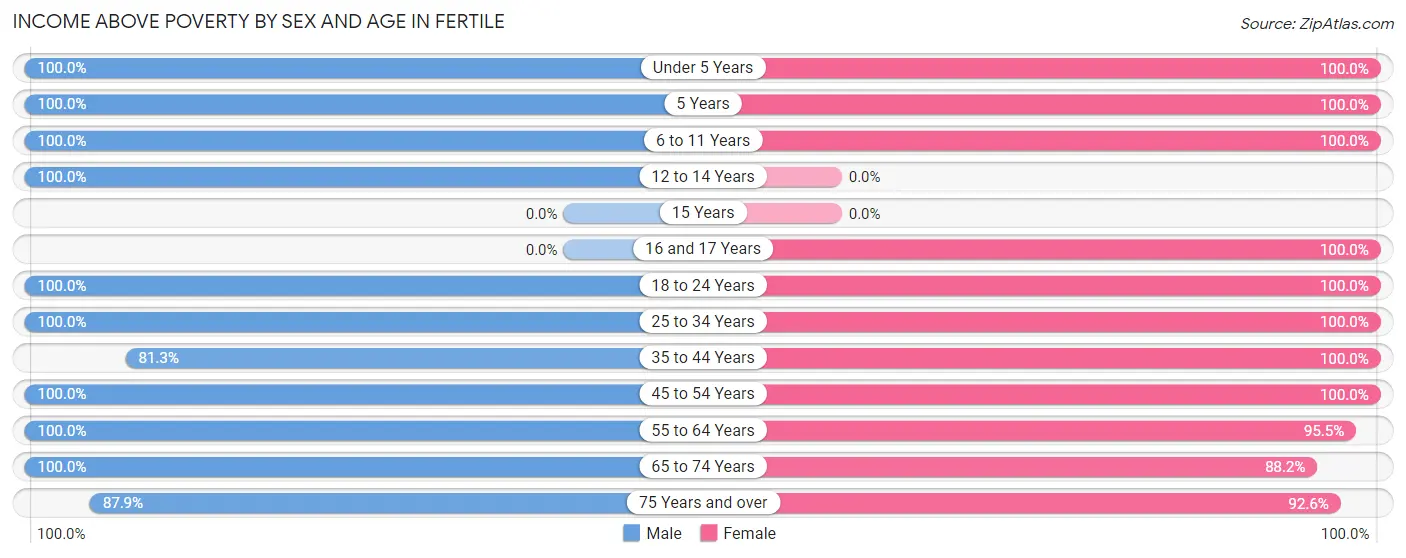
| Age Bracket | Male | Female |
| Under 5 Years | 4 (100.0%) | 3 (100.0%) |
| 5 Years | 2 (100.0%) | 2 (100.0%) |
| 6 to 11 Years | 9 (100.0%) | 7 (100.0%) |
| 12 to 14 Years | 4 (100.0%) | 0 (0.0%) |
| 15 Years | 0 (0.0%) | 0 (0.0%) |
| 16 and 17 Years | 0 (0.0%) | 2 (100.0%) |
| 18 to 24 Years | 3 (100.0%) | 1 (100.0%) |
| 25 to 34 Years | 32 (100.0%) | 13 (100.0%) |
| 35 to 44 Years | 13 (81.2%) | 9 (100.0%) |
| 45 to 54 Years | 7 (100.0%) | 14 (100.0%) |
| 55 to 64 Years | 38 (100.0%) | 42 (95.5%) |
| 65 to 74 Years | 11 (100.0%) | 15 (88.2%) |
| 75 Years and over | 29 (87.9%) | 25 (92.6%) |
| Total | 152 (95.6%) | 133 (95.7%) |
Income Below Poverty Among Married-Couple Families in Fertile
The poverty statistics for married-couple families in Fertile show that 4.0% or 4 of the total 100 families live below the poverty line. Families with no children have the highest poverty rate of 5.1%, comprising of 4 families. On the other hand, families with 1 or 2 children have the lowest poverty rate of 0.0%, which includes 0 families.
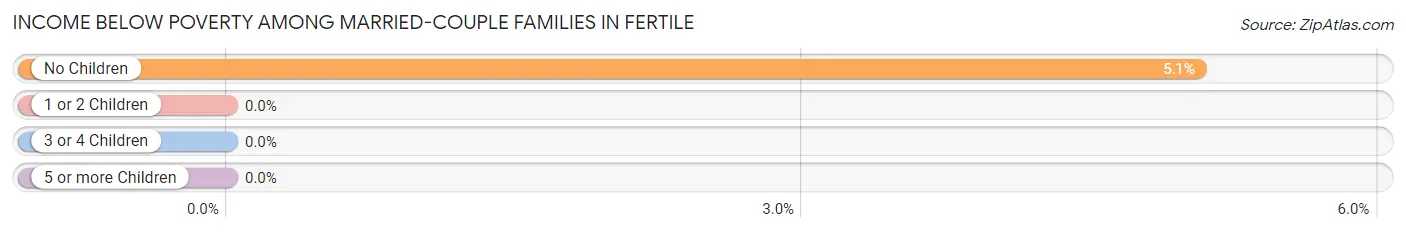
| Children | Above Poverty | Below Poverty |
| No Children | 75 (94.9%) | 4 (5.1%) |
| 1 or 2 Children | 19 (100.0%) | 0 (0.0%) |
| 3 or 4 Children | 2 (100.0%) | 0 (0.0%) |
| 5 or more Children | 0 (0.0%) | 0 (0.0%) |
| Total | 96 (96.0%) | 4 (4.0%) |
Income Below Poverty Among Single-Parent Households in Fertile
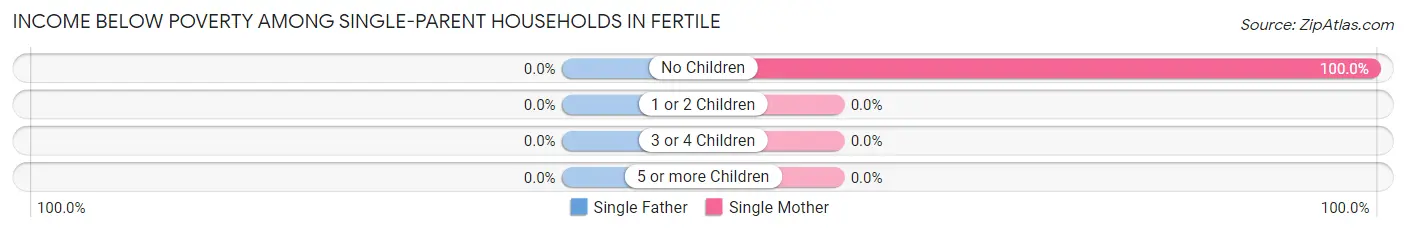
| Children | Single Father | Single Mother |
| No Children | 0 (0.0%) | 1 (100.0%) |
| 1 or 2 Children | 0 (0.0%) | 0 (0.0%) |
| 3 or 4 Children | 0 (0.0%) | 0 (0.0%) |
| 5 or more Children | 0 (0.0%) | 0 (0.0%) |
| Total | 0 (0.0%) | 1 (50.0%) |
Income Below Poverty Among Married-Couple vs Single-Parent Households in Fertile
The poverty data for Fertile shows that 4 of the married-couple family households (4.0%) and 1 of the single-parent households (33.3%) are living below the poverty level. Within the married-couple family households, those with no children have the highest poverty rate, with 4 households (5.1%) falling below the poverty line. Among the single-parent households, those with no children have the highest poverty rate, with 1 household (50.0%) living below poverty.
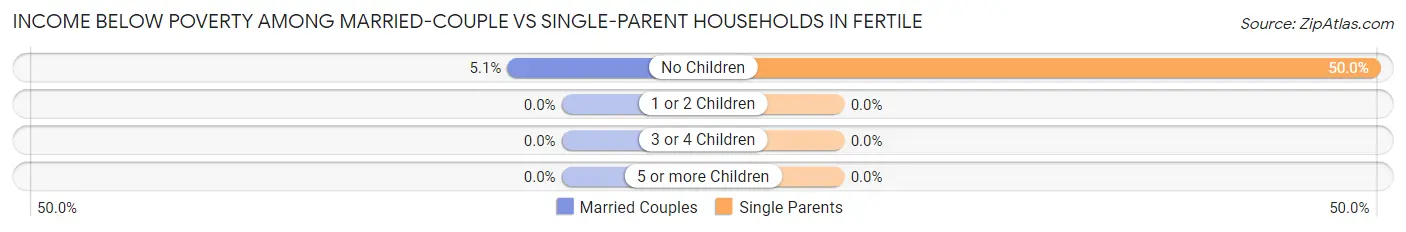
| Children | Married-Couple Families | Single-Parent Households |
| No Children | 4 (5.1%) | 1 (50.0%) |
| 1 or 2 Children | 0 (0.0%) | 0 (0.0%) |
| 3 or 4 Children | 0 (0.0%) | 0 (0.0%) |
| 5 or more Children | 0 (0.0%) | 0 (0.0%) |
| Total | 4 (4.0%) | 1 (33.3%) |
Race in Fertile
The most populous races in Fertile are White / Caucasian (296 | 99.3%), Hispanic or Latino (3 | 1.0%), and Native / Alaskan (2 | 0.7%).
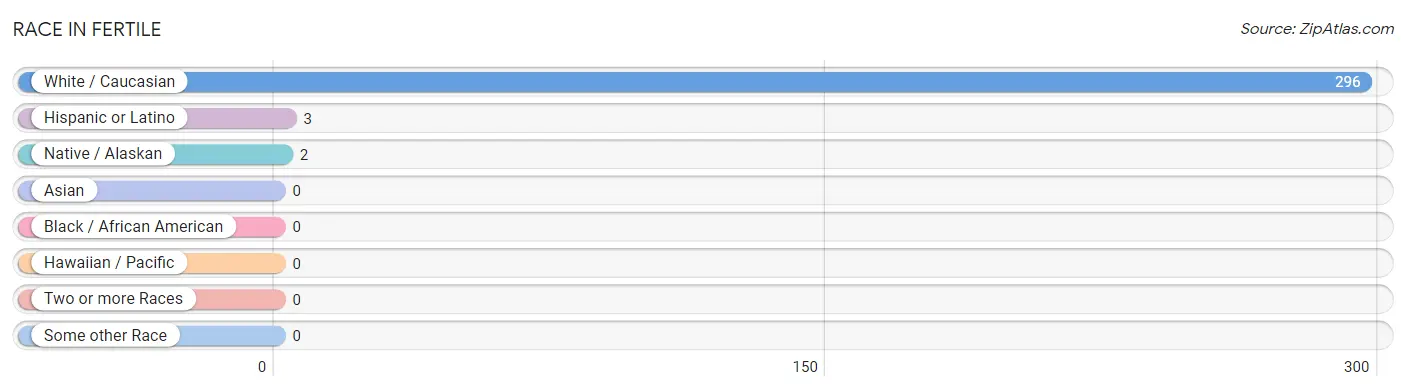
| Race | # Population | % Population |
| Asian | 0 | 0.0% |
| Black / African American | 0 | 0.0% |
| Hawaiian / Pacific | 0 | 0.0% |
| Hispanic or Latino | 3 | 1.0% |
| Native / Alaskan | 2 | 0.7% |
| White / Caucasian | 296 | 99.3% |
| Two or more Races | 0 | 0.0% |
| Some other Race | 0 | 0.0% |
| Total | 298 | 100.0% |
Ancestry in Fertile
The most populous ancestries reported in Fertile are German (113 | 37.9%), Norwegian (71 | 23.8%), Irish (29 | 9.7%), English (23 | 7.7%), and Danish (22 | 7.4%), together accounting for 86.6% of all Fertile residents.
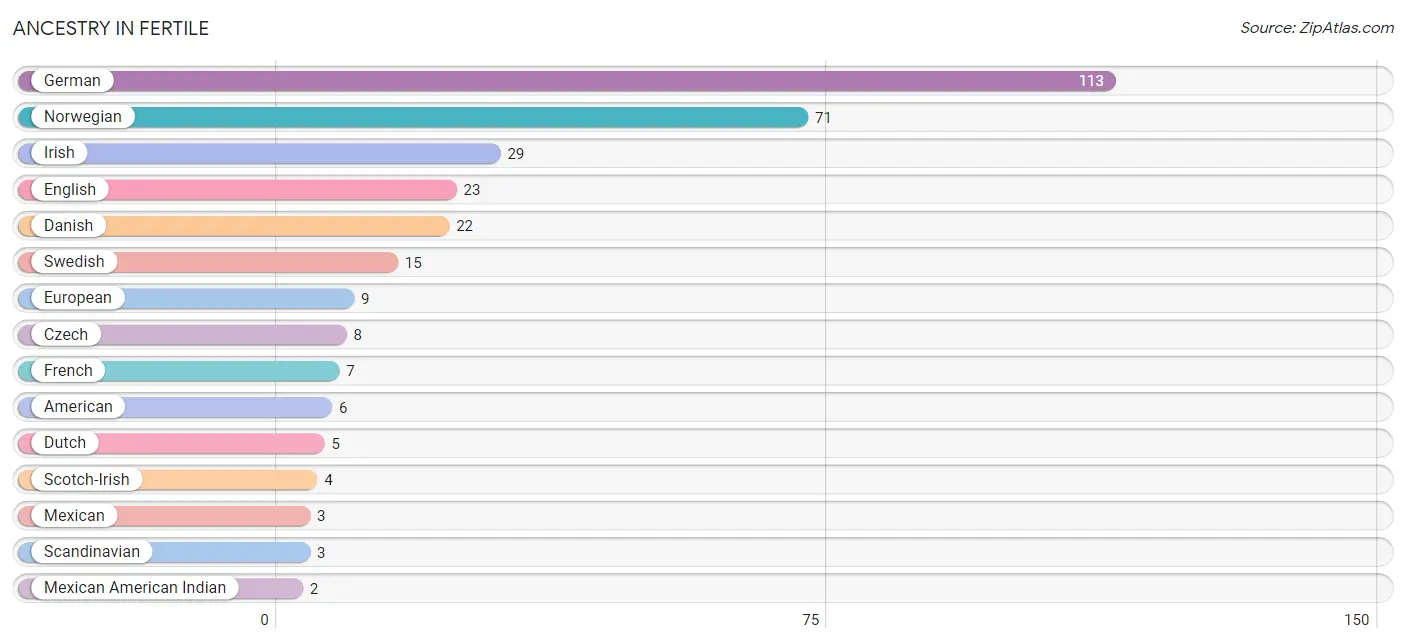
| Ancestry | # Population | % Population |
| American | 6 | 2.0% |
| Arab | 1 | 0.3% |
| Czech | 8 | 2.7% |
| Danish | 22 | 7.4% |
| Dutch | 5 | 1.7% |
| English | 23 | 7.7% |
| European | 9 | 3.0% |
| French | 7 | 2.4% |
| German | 113 | 37.9% |
| Irish | 29 | 9.7% |
| Mexican | 3 | 1.0% |
| Mexican American Indian | 2 | 0.7% |
| Norwegian | 71 | 23.8% |
| Scandinavian | 3 | 1.0% |
| Scotch-Irish | 4 | 1.3% |
| Scottish | 1 | 0.3% |
| Swedish | 15 | 5.0% |
| Swiss | 2 | 0.7% |
| Welsh | 1 | 0.3% | View All 19 Rows |
Immigrants in Fertile

| Immigration Origin | # Population | % Population | View All 0 Rows |
Sex and Age in Fertile
Sex and Age in Fertile
The most populous age groups in Fertile are 55 to 59 Years (29 | 18.2%) for men and 55 to 59 Years (23 | 16.6%) for women.
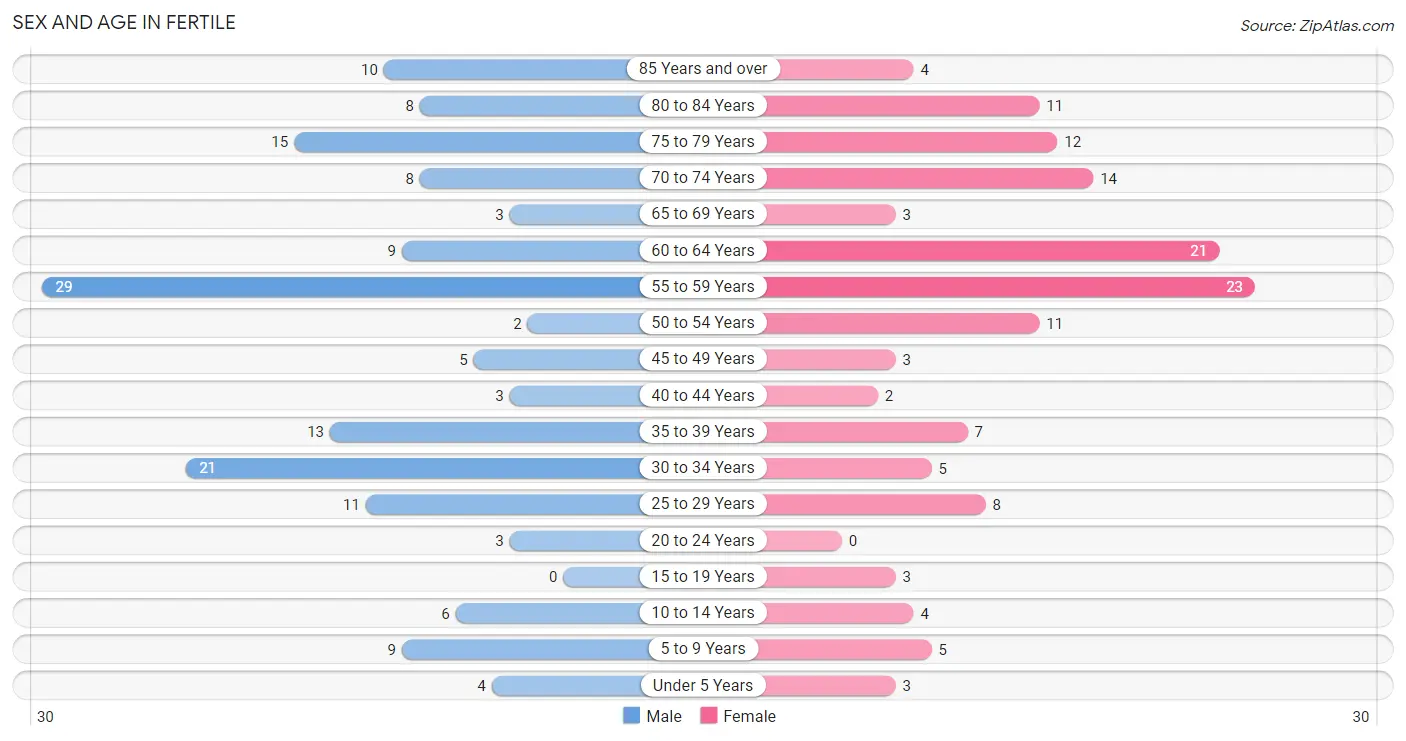
| Age Bracket | Male | Female |
| Under 5 Years | 4 (2.5%) | 3 (2.2%) |
| 5 to 9 Years | 9 (5.7%) | 5 (3.6%) |
| 10 to 14 Years | 6 (3.8%) | 4 (2.9%) |
| 15 to 19 Years | 0 (0.0%) | 3 (2.2%) |
| 20 to 24 Years | 3 (1.9%) | 0 (0.0%) |
| 25 to 29 Years | 11 (6.9%) | 8 (5.8%) |
| 30 to 34 Years | 21 (13.2%) | 5 (3.6%) |
| 35 to 39 Years | 13 (8.2%) | 7 (5.0%) |
| 40 to 44 Years | 3 (1.9%) | 2 (1.4%) |
| 45 to 49 Years | 5 (3.1%) | 3 (2.2%) |
| 50 to 54 Years | 2 (1.3%) | 11 (7.9%) |
| 55 to 59 Years | 29 (18.2%) | 23 (16.6%) |
| 60 to 64 Years | 9 (5.7%) | 21 (15.1%) |
| 65 to 69 Years | 3 (1.9%) | 3 (2.2%) |
| 70 to 74 Years | 8 (5.0%) | 14 (10.1%) |
| 75 to 79 Years | 15 (9.4%) | 12 (8.6%) |
| 80 to 84 Years | 8 (5.0%) | 11 (7.9%) |
| 85 Years and over | 10 (6.3%) | 4 (2.9%) |
| Total | 159 (100.0%) | 139 (100.0%) |
Families and Households in Fertile
Median Family Size in Fertile
The median family size in Fertile is 2.32 persons per family, with single female/mother families (2 | 1.9%) accounting for the largest median family size of 4 persons per family. On the other hand, married-couple families (100 | 97.1%) represent the smallest median family size with 2.28 persons per family.
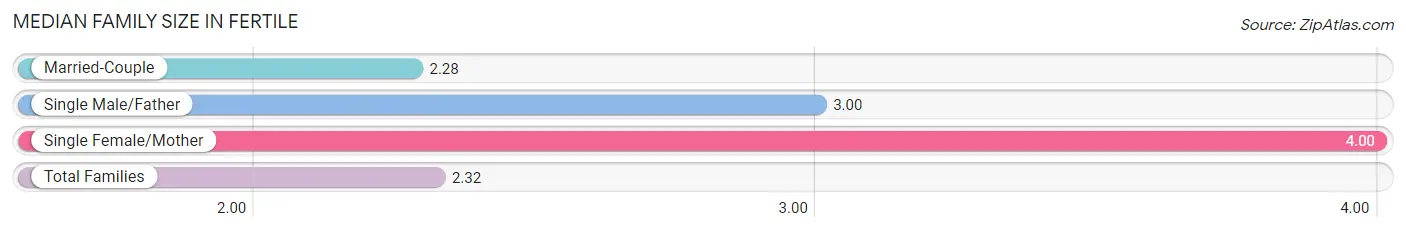
| Family Type | # Families | Family Size |
| Married-Couple | 100 (97.1%) | 2.28 |
| Single Male/Father | 1 (1.0%) | 3.00 |
| Single Female/Mother | 2 (1.9%) | 4.00 |
| Total Families | 103 (100.0%) | 2.32 |
Median Household Size in Fertile
The median household size in Fertile is 1.89 persons per household, with single female/mother households (2 | 1.3%) accounting for the largest median household size of 4 persons per household. non-family households (55 | 34.8%) represent the smallest median household size with 1.07 persons per household.
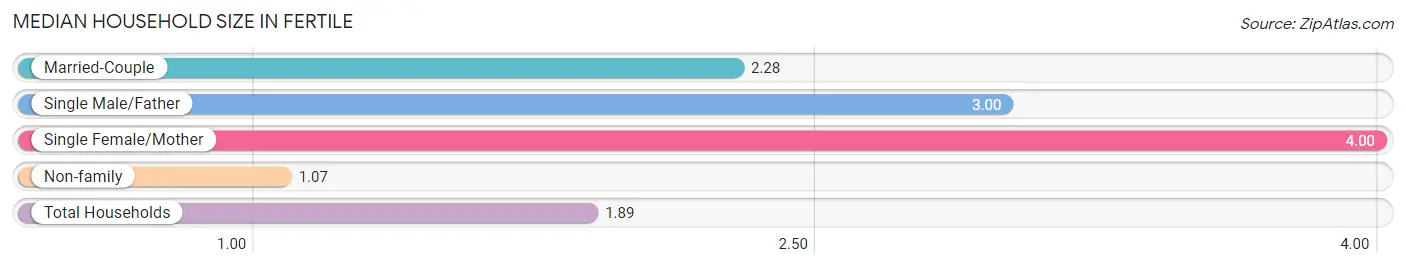
| Household Type | # Households | Household Size |
| Married-Couple | 100 (63.3%) | 2.28 |
| Single Male/Father | 1 (0.6%) | 3.00 |
| Single Female/Mother | 2 (1.3%) | 4.00 |
| Non-family | 55 (34.8%) | 1.07 |
| Total Households | 158 (100.0%) | 1.89 |
Household Size by Marriage Status in Fertile
Out of a total of 158 households in Fertile, 103 (65.2%) are family households, while 55 (34.8%) are nonfamily households. The most numerous type of family households are 2-person households, comprising 77, and the most common type of nonfamily households are 1-person households, comprising 50.
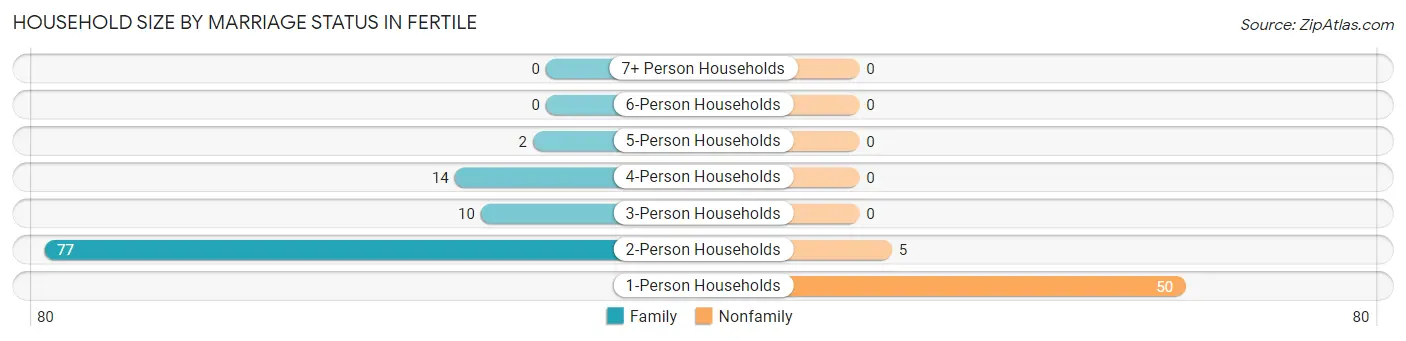
| Household Size | Family Households | Nonfamily Households |
| 1-Person Households | - | 50 (31.7%) |
| 2-Person Households | 77 (48.7%) | 5 (3.2%) |
| 3-Person Households | 10 (6.3%) | 0 (0.0%) |
| 4-Person Households | 14 (8.9%) | 0 (0.0%) |
| 5-Person Households | 2 (1.3%) | 0 (0.0%) |
| 6-Person Households | 0 (0.0%) | 0 (0.0%) |
| 7+ Person Households | 0 (0.0%) | 0 (0.0%) |
| Total | 103 (65.2%) | 55 (34.8%) |
Female Fertility in Fertile
Fertility by Age in Fertile
| Age Bracket | Women with Births | Births / 1,000 Women |
| 15 to 19 years | 0 (0.0%) | 0.0 |
| 20 to 34 years | 0 (0.0%) | 0.0 |
| 35 to 50 years | 0 (0.0%) | 0.0 |
| Total | 0 (0.0%) | 0.0 |
Fertility by Age by Marriage Status in Fertile
| Age Bracket | Married | Unmarried |
| 15 to 19 years | 0 (0.0%) | 0 (0.0%) |
| 20 to 34 years | 0 (0.0%) | 0 (0.0%) |
| 35 to 50 years | 0 (0.0%) | 0 (0.0%) |
| Total | 0 (0.0%) | 0 (0.0%) |
Fertility by Education in Fertile
| Educational Attainment | Women with Births | Births / 1,000 Women |
| Less than High School | 0 (0.0%) | 0.0 |
| High School Diploma | 0 (0.0%) | 0.0 |
| College or Associate's Degree | 0 (0.0%) | 0.0 |
| Bachelor's Degree | 0 (0.0%) | 0.0 |
| Graduate Degree | 0 (0.0%) | 0.0 |
| Total | 0 (0.0%) | 0.0 |
Fertility by Education by Marriage Status in Fertile
| Educational Attainment | Married | Unmarried |
| Less than High School | 0 (0.0%) | 0 (0.0%) |
| High School Diploma | 0 (0.0%) | 0 (0.0%) |
| College or Associate's Degree | 0 (0.0%) | 0 (0.0%) |
| Bachelor's Degree | 0 (0.0%) | 0 (0.0%) |
| Graduate Degree | 0 (0.0%) | 0 (0.0%) |
| Total | 0 (0.0%) | 0 (0.0%) |
Employment Characteristics in Fertile
Employment by Class of Employer in Fertile
Among the 171 employed individuals in Fertile, private company employees (118 | 69.0%), local government employees (21 | 12.3%), and not-for-profit organizations (17 | 9.9%) make up the most common classes of employment.
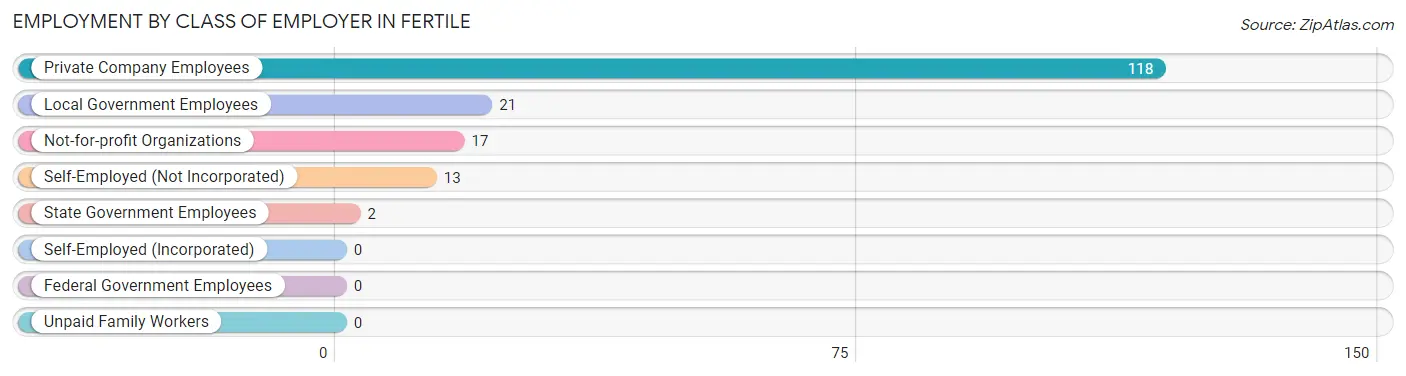
| Employer Class | # Employees | % Employees |
| Private Company Employees | 118 | 69.0% |
| Self-Employed (Incorporated) | 0 | 0.0% |
| Self-Employed (Not Incorporated) | 13 | 7.6% |
| Not-for-profit Organizations | 17 | 9.9% |
| Local Government Employees | 21 | 12.3% |
| State Government Employees | 2 | 1.2% |
| Federal Government Employees | 0 | 0.0% |
| Unpaid Family Workers | 0 | 0.0% |
| Total | 171 | 100.0% |
Employment Status by Age in Fertile
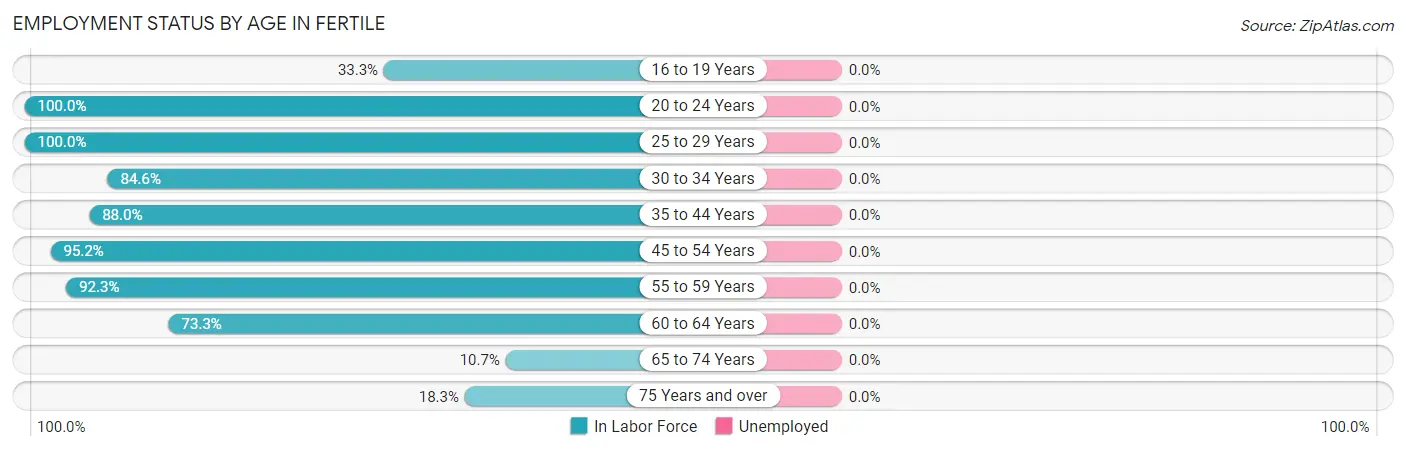
| Age Bracket | In Labor Force | Unemployed |
| 16 to 19 Years | 1 (33.3%) | 0 (0.0%) |
| 20 to 24 Years | 3 (100.0%) | 0 (0.0%) |
| 25 to 29 Years | 19 (100.0%) | 0 (0.0%) |
| 30 to 34 Years | 22 (84.6%) | 0 (0.0%) |
| 35 to 44 Years | 22 (88.0%) | 0 (0.0%) |
| 45 to 54 Years | 20 (95.2%) | 0 (0.0%) |
| 55 to 59 Years | 48 (92.3%) | 0 (0.0%) |
| 60 to 64 Years | 22 (73.3%) | 0 (0.0%) |
| 65 to 74 Years | 3 (10.7%) | 0 (0.0%) |
| 75 Years and over | 11 (18.3%) | 0 (0.0%) |
| Total | 171 (64.0%) | 0 (0.0%) |
Employment Status by Educational Attainment in Fertile
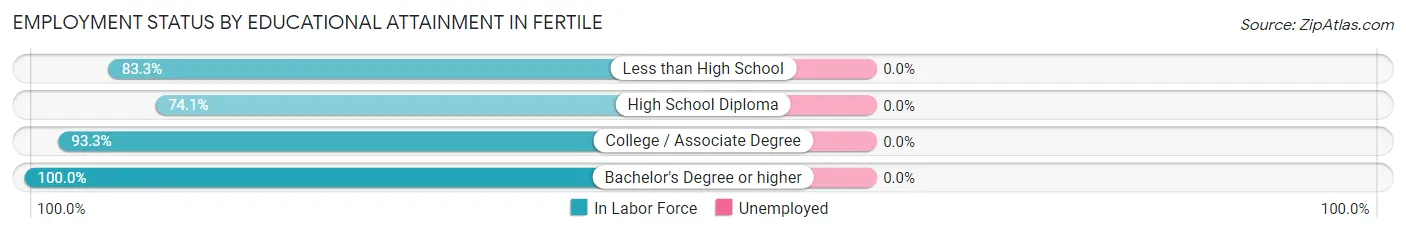
| Educational Attainment | In Labor Force | Unemployed |
| Less than High School | 5 (83.3%) | 0 (0.0%) |
| High School Diploma | 40 (74.1%) | 0 (0.0%) |
| College / Associate Degree | 70 (93.3%) | 0 (0.0%) |
| Bachelor's Degree or higher | 38 (100.0%) | 0 (0.0%) |
| Total | 153 (88.4%) | 0 (0.0%) |
Employment Occupations by Sex in Fertile
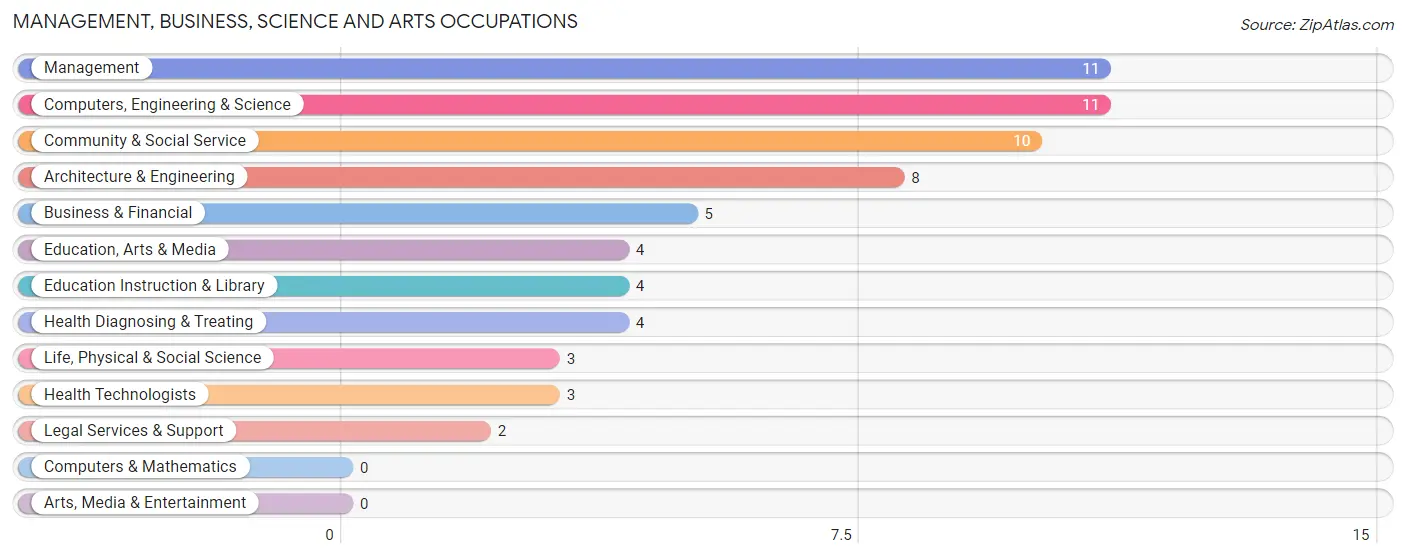
Management, Business, Science and Arts Occupations
The most common Management, Business, Science and Arts occupations in Fertile are Management (11 | 6.4%), Computers, Engineering & Science (11 | 6.4%), Community & Social Service (10 | 5.9%), Architecture & Engineering (8 | 4.7%), and Business & Financial (5 | 2.9%).
Management, Business, Science and Arts Occupations by Sex
Within the Management, Business, Science and Arts occupations in Fertile, the most male-oriented occupations are Architecture & Engineering (100.0%), Management (81.8%), and Computers, Engineering & Science (72.7%), while the most female-oriented occupations are Life, Physical & Social Science (100.0%), Legal Services & Support (100.0%), and Education Instruction & Library (100.0%).
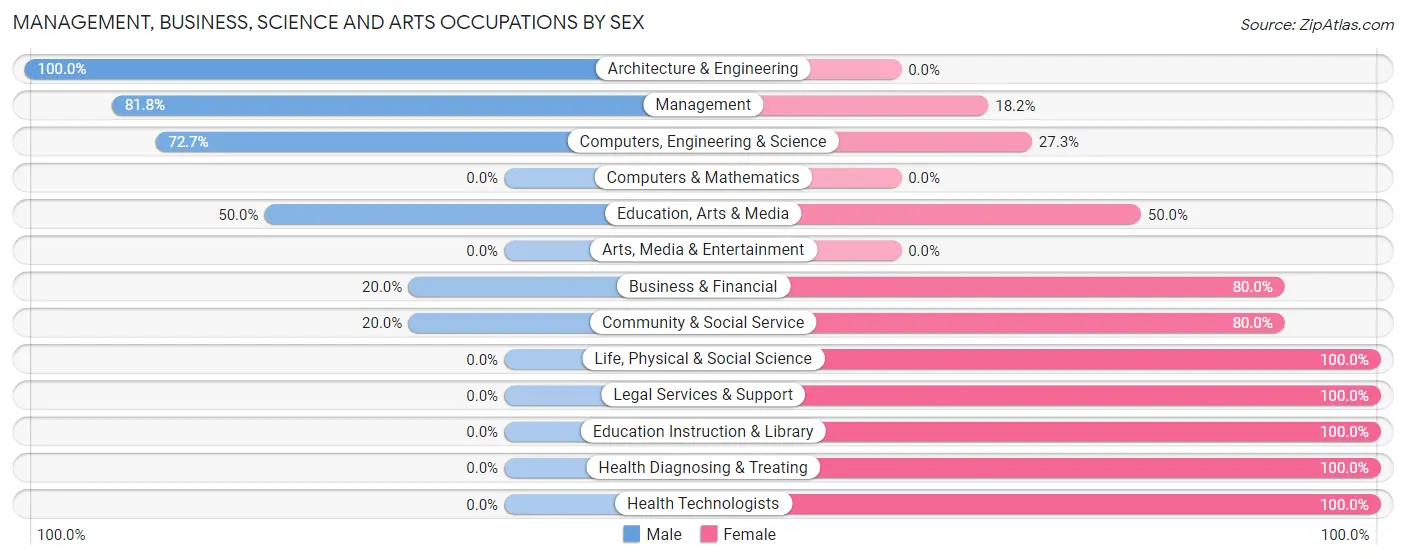
| Occupation | Male | Female |
| Management | 9 (81.8%) | 2 (18.2%) |
| Business & Financial | 1 (20.0%) | 4 (80.0%) |
| Computers, Engineering & Science | 8 (72.7%) | 3 (27.3%) |
| Computers & Mathematics | 0 (0.0%) | 0 (0.0%) |
| Architecture & Engineering | 8 (100.0%) | 0 (0.0%) |
| Life, Physical & Social Science | 0 (0.0%) | 3 (100.0%) |
| Community & Social Service | 2 (20.0%) | 8 (80.0%) |
| Education, Arts & Media | 2 (50.0%) | 2 (50.0%) |
| Legal Services & Support | 0 (0.0%) | 2 (100.0%) |
| Education Instruction & Library | 0 (0.0%) | 4 (100.0%) |
| Arts, Media & Entertainment | 0 (0.0%) | 0 (0.0%) |
| Health Diagnosing & Treating | 0 (0.0%) | 4 (100.0%) |
| Health Technologists | 0 (0.0%) | 3 (100.0%) |
| Total (Category) | 20 (48.8%) | 21 (51.2%) |
| Total (Overall) | 94 (55.0%) | 77 (45.0%) |
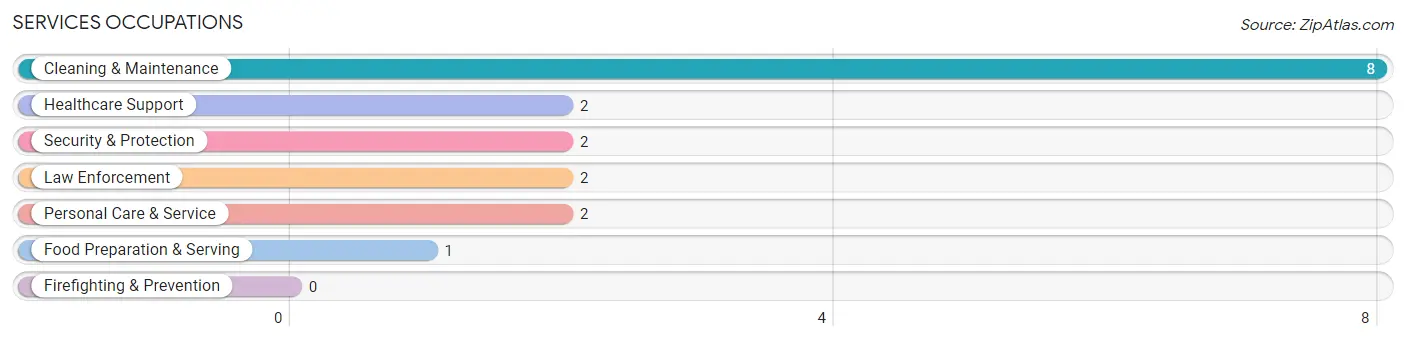
Services Occupations
The most common Services occupations in Fertile are Cleaning & Maintenance (8 | 4.7%), Healthcare Support (2 | 1.2%), Security & Protection (2 | 1.2%), Law Enforcement (2 | 1.2%), and Personal Care & Service (2 | 1.2%).
Services Occupations by Sex
Within the Services occupations in Fertile, the most male-oriented occupations are Security & Protection (100.0%), Law Enforcement (100.0%), and Cleaning & Maintenance (62.5%), while the most female-oriented occupations are Healthcare Support (100.0%), Food Preparation & Serving (100.0%), and Personal Care & Service (100.0%).
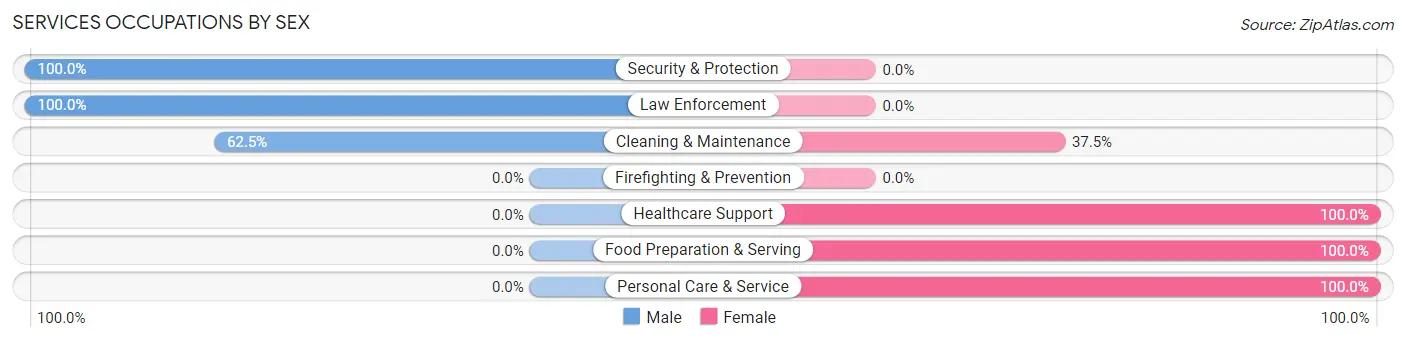
| Occupation | Male | Female |
| Healthcare Support | 0 (0.0%) | 2 (100.0%) |
| Security & Protection | 2 (100.0%) | 0 (0.0%) |
| Firefighting & Prevention | 0 (0.0%) | 0 (0.0%) |
| Law Enforcement | 2 (100.0%) | 0 (0.0%) |
| Food Preparation & Serving | 0 (0.0%) | 1 (100.0%) |
| Cleaning & Maintenance | 5 (62.5%) | 3 (37.5%) |
| Personal Care & Service | 0 (0.0%) | 2 (100.0%) |
| Total (Category) | 7 (46.7%) | 8 (53.3%) |
| Total (Overall) | 94 (55.0%) | 77 (45.0%) |
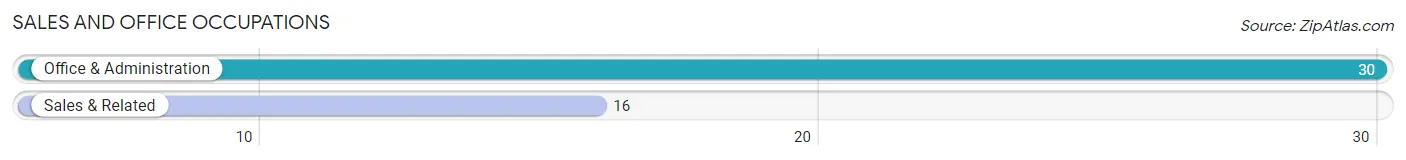
Sales and Office Occupations
The most common Sales and Office occupations in Fertile are Office & Administration (30 | 17.5%), and Sales & Related (16 | 9.4%).
Sales and Office Occupations by Sex

| Occupation | Male | Female |
| Sales & Related | 9 (56.2%) | 7 (43.8%) |
| Office & Administration | 0 (0.0%) | 30 (100.0%) |
| Total (Category) | 9 (19.6%) | 37 (80.4%) |
| Total (Overall) | 94 (55.0%) | 77 (45.0%) |
Natural Resources, Construction and Maintenance Occupations
The most common Natural Resources, Construction and Maintenance occupations in Fertile are Construction & Extraction (18 | 10.5%), and Installation, Maintenance & Repair (8 | 4.7%).
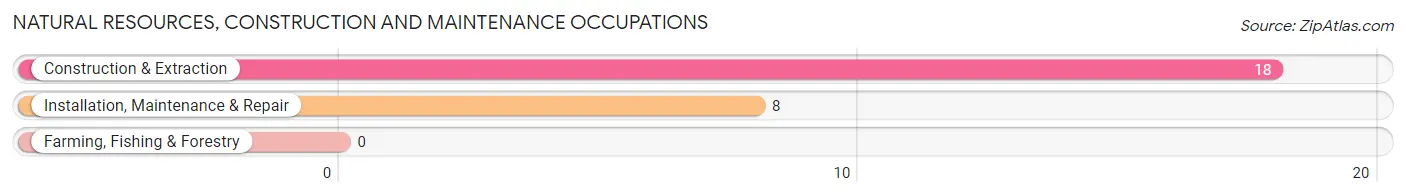
Natural Resources, Construction and Maintenance Occupations by Sex
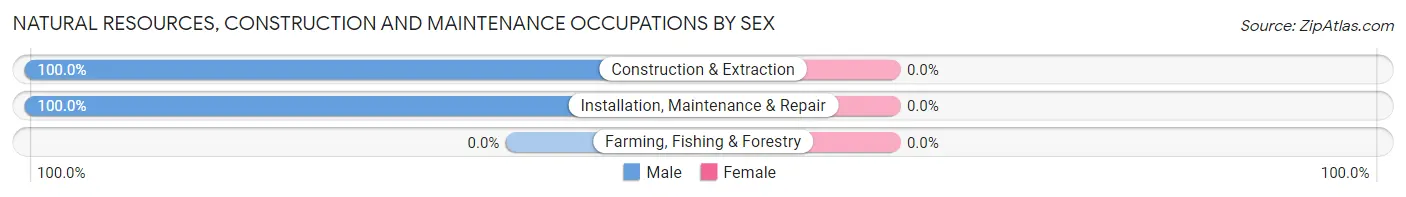
| Occupation | Male | Female |
| Farming, Fishing & Forestry | 0 (0.0%) | 0 (0.0%) |
| Construction & Extraction | 18 (100.0%) | 0 (0.0%) |
| Installation, Maintenance & Repair | 8 (100.0%) | 0 (0.0%) |
| Total (Category) | 26 (100.0%) | 0 (0.0%) |
| Total (Overall) | 94 (55.0%) | 77 (45.0%) |
Production, Transportation and Moving Occupations
The most common Production, Transportation and Moving occupations in Fertile are Material Moving (24 | 14.0%), Production (17 | 9.9%), and Transportation (2 | 1.2%).
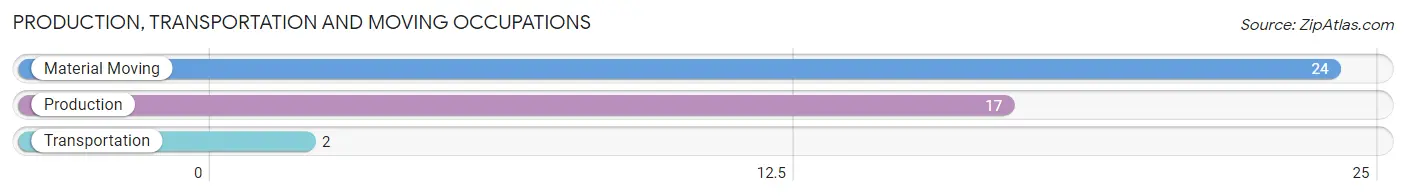
Production, Transportation and Moving Occupations by Sex
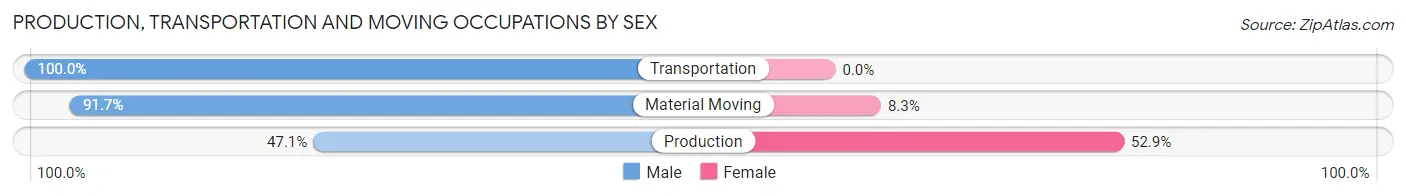
| Occupation | Male | Female |
| Production | 8 (47.1%) | 9 (52.9%) |
| Transportation | 2 (100.0%) | 0 (0.0%) |
| Material Moving | 22 (91.7%) | 2 (8.3%) |
| Total (Category) | 32 (74.4%) | 11 (25.6%) |
| Total (Overall) | 94 (55.0%) | 77 (45.0%) |
Employment Industries by Sex in Fertile
Employment Industries in Fertile
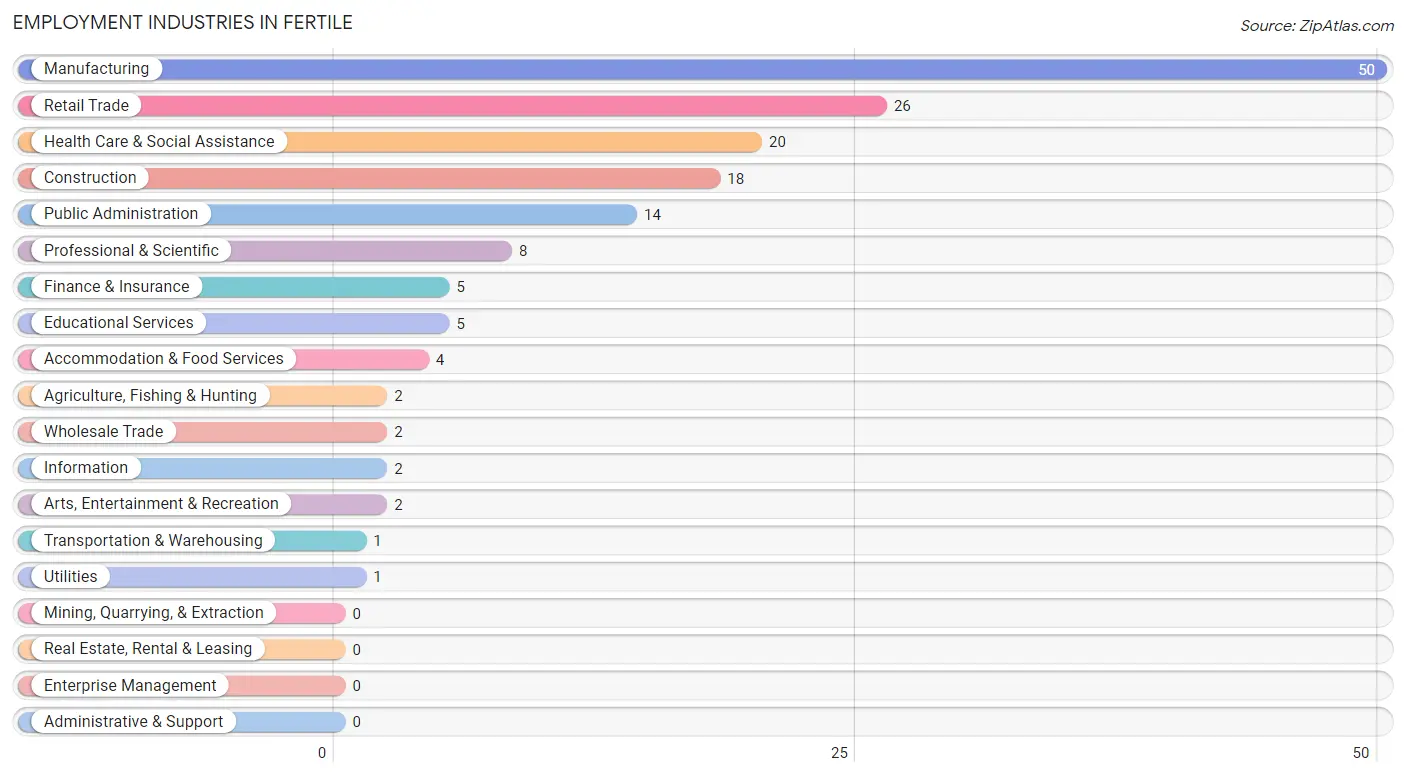
The major employment industries in Fertile include Manufacturing (50 | 29.2%), Retail Trade (26 | 15.2%), Health Care & Social Assistance (20 | 11.7%), Construction (18 | 10.5%), and Public Administration (14 | 8.2%).
Employment Industries by Sex in Fertile
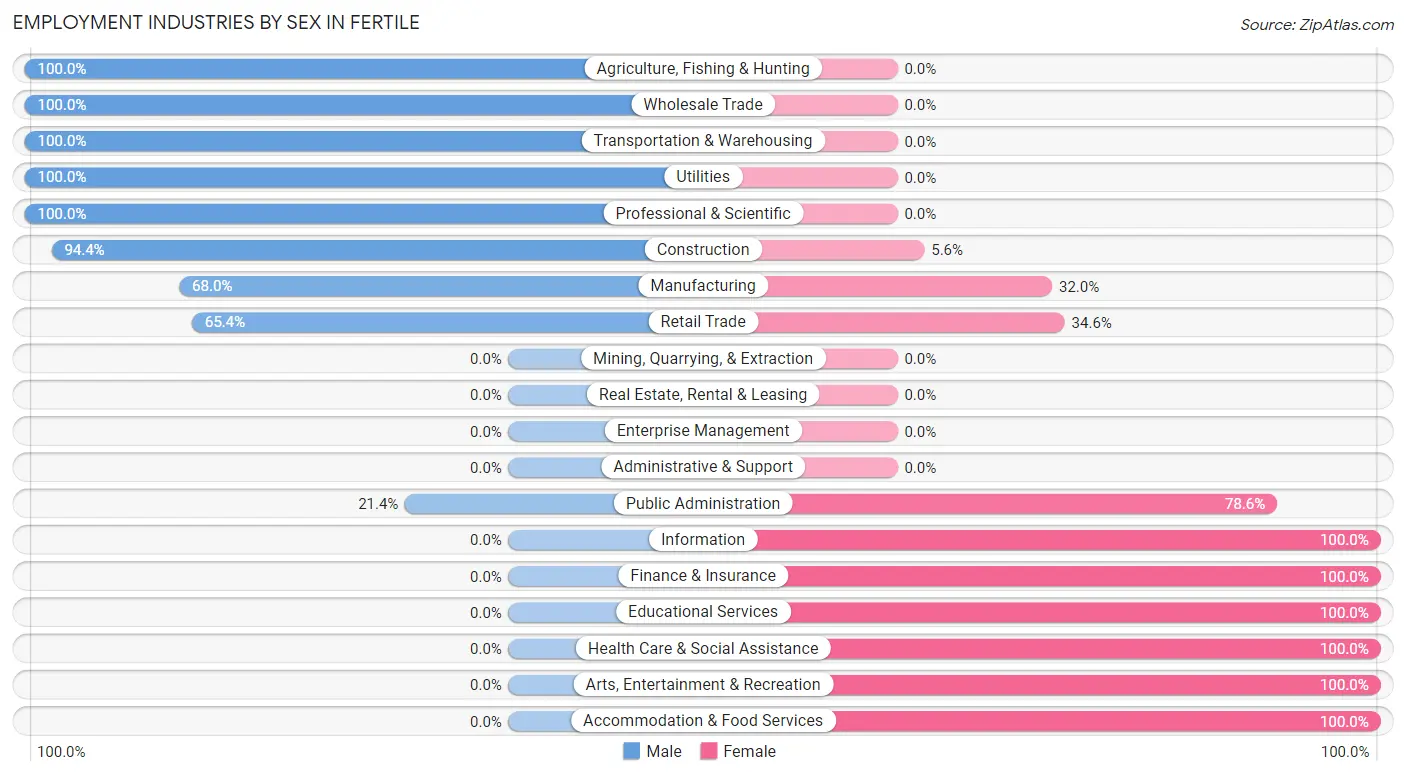
The Fertile industries that see more men than women are Agriculture, Fishing & Hunting (100.0%), Wholesale Trade (100.0%), and Transportation & Warehousing (100.0%), whereas the industries that tend to have a higher number of women are Information (100.0%), Finance & Insurance (100.0%), and Educational Services (100.0%).
| Industry | Male | Female |
| Agriculture, Fishing & Hunting | 2 (100.0%) | 0 (0.0%) |
| Mining, Quarrying, & Extraction | 0 (0.0%) | 0 (0.0%) |
| Construction | 17 (94.4%) | 1 (5.6%) |
| Manufacturing | 34 (68.0%) | 16 (32.0%) |
| Wholesale Trade | 2 (100.0%) | 0 (0.0%) |
| Retail Trade | 17 (65.4%) | 9 (34.6%) |
| Transportation & Warehousing | 1 (100.0%) | 0 (0.0%) |
| Utilities | 1 (100.0%) | 0 (0.0%) |
| Information | 0 (0.0%) | 2 (100.0%) |
| Finance & Insurance | 0 (0.0%) | 5 (100.0%) |
| Real Estate, Rental & Leasing | 0 (0.0%) | 0 (0.0%) |
| Professional & Scientific | 8 (100.0%) | 0 (0.0%) |
| Enterprise Management | 0 (0.0%) | 0 (0.0%) |
| Administrative & Support | 0 (0.0%) | 0 (0.0%) |
| Educational Services | 0 (0.0%) | 5 (100.0%) |
| Health Care & Social Assistance | 0 (0.0%) | 20 (100.0%) |
| Arts, Entertainment & Recreation | 0 (0.0%) | 2 (100.0%) |
| Accommodation & Food Services | 0 (0.0%) | 4 (100.0%) |
| Public Administration | 3 (21.4%) | 11 (78.6%) |
| Total | 94 (55.0%) | 77 (45.0%) |
Education in Fertile
School Enrollment in Fertile
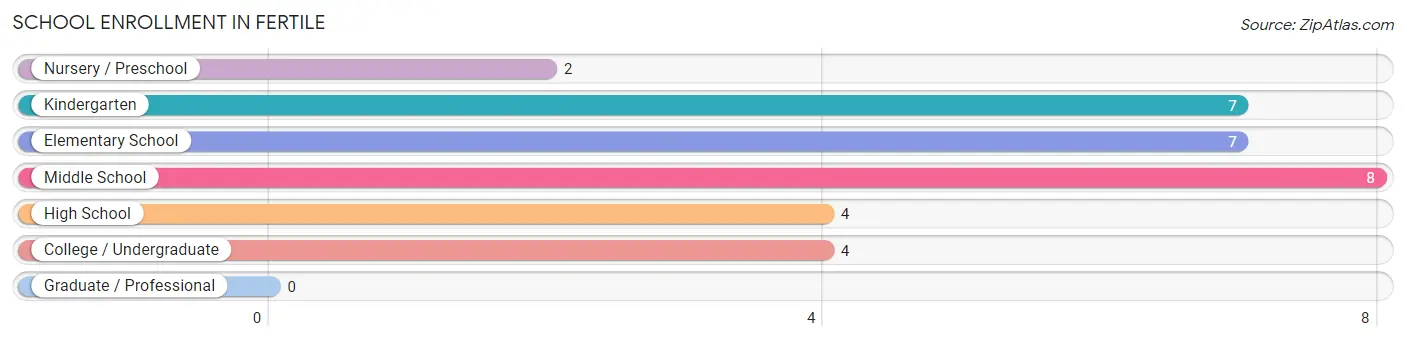
The most common levels of schooling among the 32 students in Fertile are middle school (8 | 25.0%), kindergarten (7 | 21.9%), and elementary school (7 | 21.9%).
| School Level | # Students | % Students |
| Nursery / Preschool | 2 | 6.2% |
| Kindergarten | 7 | 21.9% |
| Elementary School | 7 | 21.9% |
| Middle School | 8 | 25.0% |
| High School | 4 | 12.5% |
| College / Undergraduate | 4 | 12.5% |
| Graduate / Professional | 0 | 0.0% |
| Total | 32 | 100.0% |
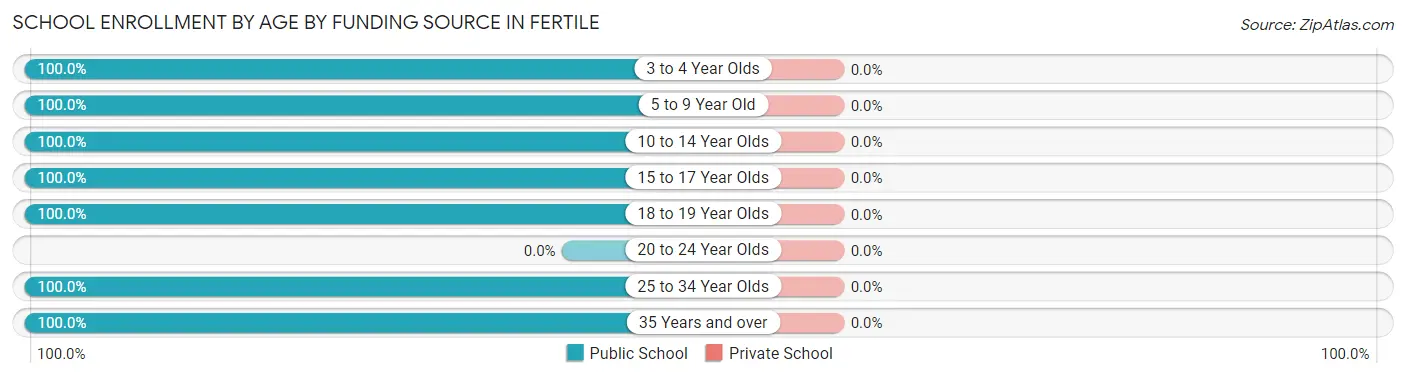
School Enrollment by Age by Funding Source in Fertile
| Age Bracket | Public School | Private School |
| 3 to 4 Year Olds | 1 (100.0%) | 0 (0.0%) |
| 5 to 9 Year Old | 13 (100.0%) | 0 (0.0%) |
| 10 to 14 Year Olds | 10 (100.0%) | 0 (0.0%) |
| 15 to 17 Year Olds | 2 (100.0%) | 0 (0.0%) |
| 18 to 19 Year Olds | 1 (100.0%) | 0 (0.0%) |
| 20 to 24 Year Olds | 0 (0.0%) | 0 (0.0%) |
| 25 to 34 Year Olds | 1 (100.0%) | 0 (0.0%) |
| 35 Years and over | 4 (100.0%) | 0 (0.0%) |
| Total | 32 (100.0%) | 0 (0.0%) |
Educational Attainment by Field of Study in Fertile
Business (14 | 29.8%), science & technology (7 | 14.9%), liberal arts & history (5 | 10.6%), arts & humanities (5 | 10.6%), and education (4 | 8.5%) are the most common fields of study among 47 individuals in Fertile who have obtained a bachelor's degree or higher.
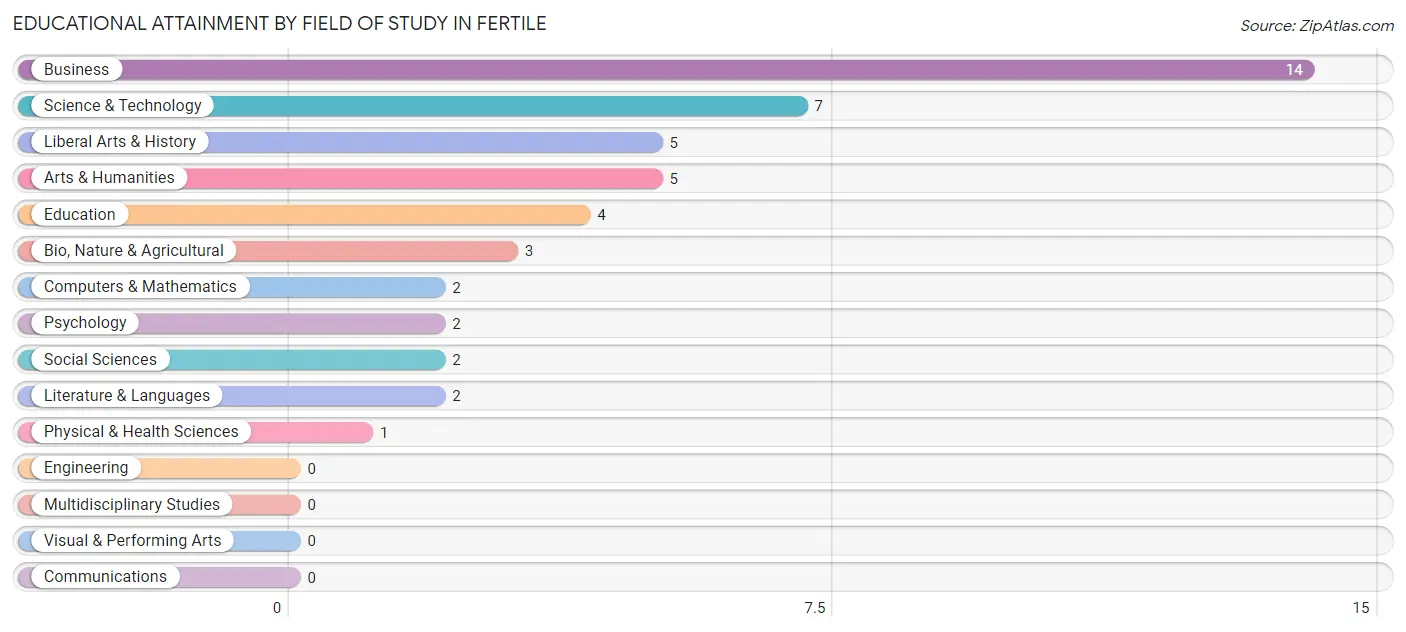
| Field of Study | # Graduates | % Graduates |
| Computers & Mathematics | 2 | 4.3% |
| Bio, Nature & Agricultural | 3 | 6.4% |
| Physical & Health Sciences | 1 | 2.1% |
| Psychology | 2 | 4.3% |
| Social Sciences | 2 | 4.3% |
| Engineering | 0 | 0.0% |
| Multidisciplinary Studies | 0 | 0.0% |
| Science & Technology | 7 | 14.9% |
| Business | 14 | 29.8% |
| Education | 4 | 8.5% |
| Literature & Languages | 2 | 4.3% |
| Liberal Arts & History | 5 | 10.6% |
| Visual & Performing Arts | 0 | 0.0% |
| Communications | 0 | 0.0% |
| Arts & Humanities | 5 | 10.6% |
| Total | 47 | 100.0% |
Transportation & Commute in Fertile
Vehicle Availability by Sex in Fertile
The most prevalent vehicle ownership categories in Fertile are males with 2 vehicles (54, accounting for 57.5%) and females with 2 vehicles (33, making up 70.1%).
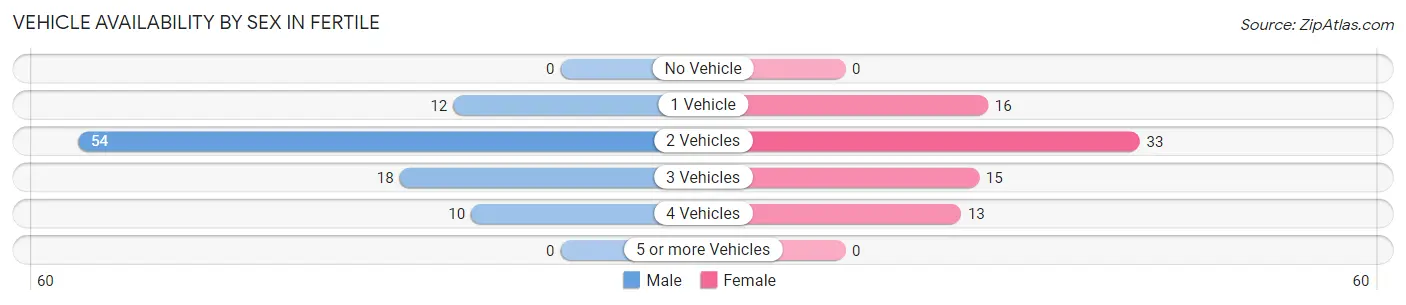
| Vehicles Available | Male | Female |
| No Vehicle | 0 (0.0%) | 0 (0.0%) |
| 1 Vehicle | 12 (12.8%) | 16 (20.8%) |
| 2 Vehicles | 54 (57.5%) | 33 (42.9%) |
| 3 Vehicles | 18 (19.2%) | 15 (19.5%) |
| 4 Vehicles | 10 (10.6%) | 13 (16.9%) |
| 5 or more Vehicles | 0 (0.0%) | 0 (0.0%) |
| Total | 94 (100.0%) | 77 (100.0%) |
Commute Time in Fertile
The most frequently occuring commute durations in Fertile are 15 to 19 minutes (39 commuters, 24.5%), 20 to 24 minutes (37 commuters, 23.3%), and 30 to 34 minutes (30 commuters, 18.9%).
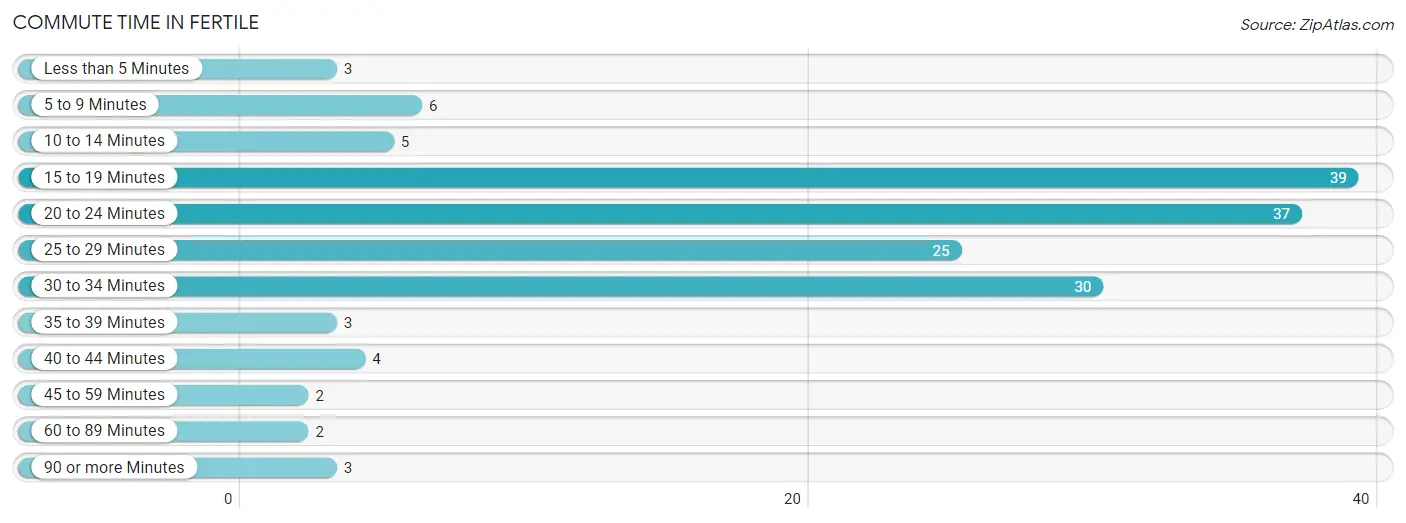
| Commute Time | # Commuters | % Commuters |
| Less than 5 Minutes | 3 | 1.9% |
| 5 to 9 Minutes | 6 | 3.8% |
| 10 to 14 Minutes | 5 | 3.1% |
| 15 to 19 Minutes | 39 | 24.5% |
| 20 to 24 Minutes | 37 | 23.3% |
| 25 to 29 Minutes | 25 | 15.7% |
| 30 to 34 Minutes | 30 | 18.9% |
| 35 to 39 Minutes | 3 | 1.9% |
| 40 to 44 Minutes | 4 | 2.5% |
| 45 to 59 Minutes | 2 | 1.3% |
| 60 to 89 Minutes | 2 | 1.3% |
| 90 or more Minutes | 3 | 1.9% |
Commute Time by Sex in Fertile
The most common commute times in Fertile are 30 to 34 minutes (21 commuters, 23.3%) for males and 15 to 19 minutes (20 commuters, 29.0%) for females.
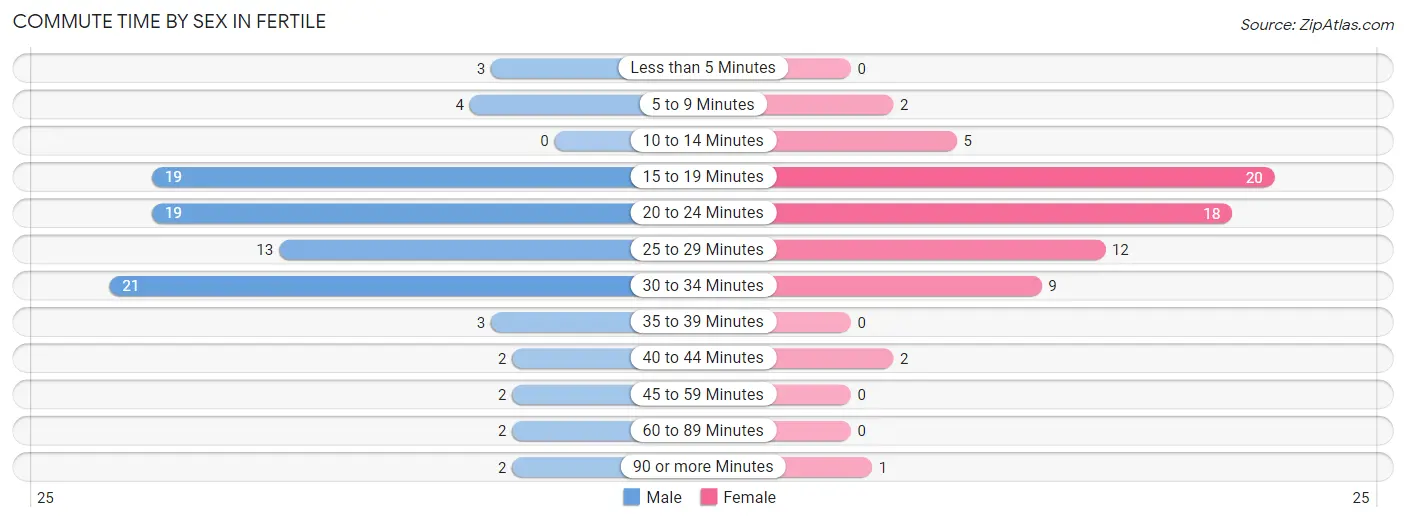
| Commute Time | Male | Female |
| Less than 5 Minutes | 3 (3.3%) | 0 (0.0%) |
| 5 to 9 Minutes | 4 (4.4%) | 2 (2.9%) |
| 10 to 14 Minutes | 0 (0.0%) | 5 (7.2%) |
| 15 to 19 Minutes | 19 (21.1%) | 20 (29.0%) |
| 20 to 24 Minutes | 19 (21.1%) | 18 (26.1%) |
| 25 to 29 Minutes | 13 (14.4%) | 12 (17.4%) |
| 30 to 34 Minutes | 21 (23.3%) | 9 (13.0%) |
| 35 to 39 Minutes | 3 (3.3%) | 0 (0.0%) |
| 40 to 44 Minutes | 2 (2.2%) | 2 (2.9%) |
| 45 to 59 Minutes | 2 (2.2%) | 0 (0.0%) |
| 60 to 89 Minutes | 2 (2.2%) | 0 (0.0%) |
| 90 or more Minutes | 2 (2.2%) | 1 (1.5%) |
Time of Departure to Work by Sex in Fertile
The most frequent times of departure to work in Fertile are 6:30 AM to 6:59 AM (17, 18.9%) for males and 7:30 AM to 7:59 AM (18, 26.1%) for females.
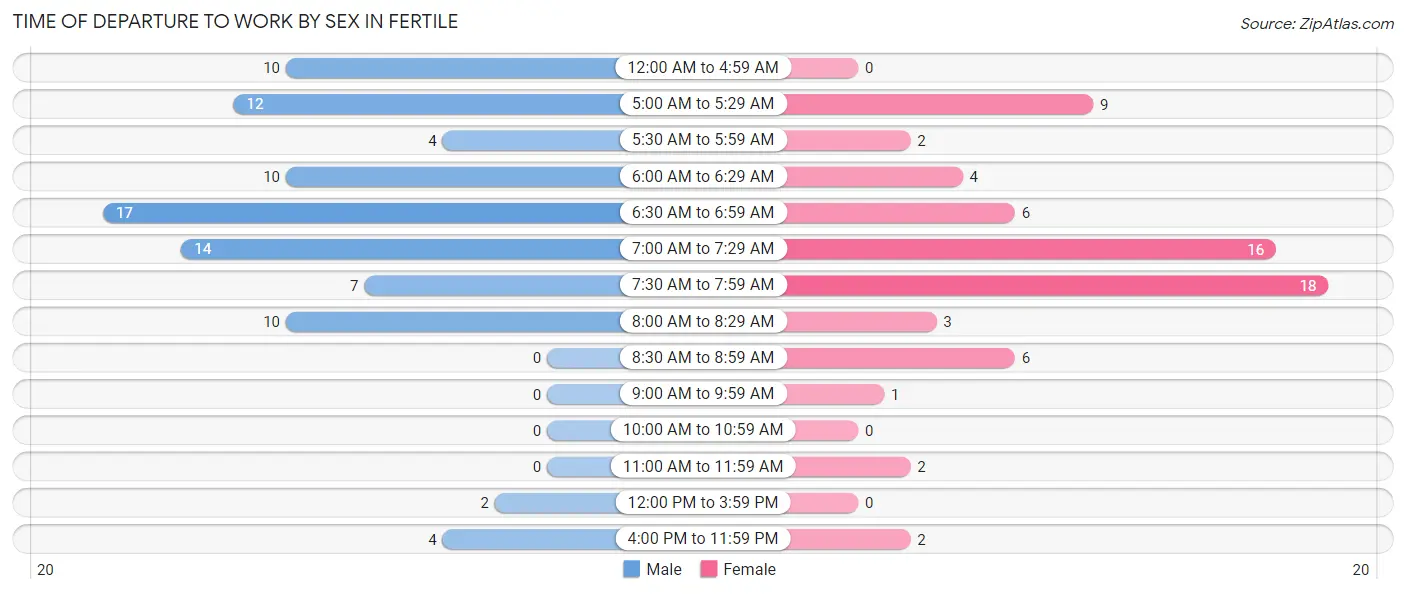
| Time of Departure | Male | Female |
| 12:00 AM to 4:59 AM | 10 (11.1%) | 0 (0.0%) |
| 5:00 AM to 5:29 AM | 12 (13.3%) | 9 (13.0%) |
| 5:30 AM to 5:59 AM | 4 (4.4%) | 2 (2.9%) |
| 6:00 AM to 6:29 AM | 10 (11.1%) | 4 (5.8%) |
| 6:30 AM to 6:59 AM | 17 (18.9%) | 6 (8.7%) |
| 7:00 AM to 7:29 AM | 14 (15.6%) | 16 (23.2%) |
| 7:30 AM to 7:59 AM | 7 (7.8%) | 18 (26.1%) |
| 8:00 AM to 8:29 AM | 10 (11.1%) | 3 (4.3%) |
| 8:30 AM to 8:59 AM | 0 (0.0%) | 6 (8.7%) |
| 9:00 AM to 9:59 AM | 0 (0.0%) | 1 (1.5%) |
| 10:00 AM to 10:59 AM | 0 (0.0%) | 0 (0.0%) |
| 11:00 AM to 11:59 AM | 0 (0.0%) | 2 (2.9%) |
| 12:00 PM to 3:59 PM | 2 (2.2%) | 0 (0.0%) |
| 4:00 PM to 11:59 PM | 4 (4.4%) | 2 (2.9%) |
| Total | 90 (100.0%) | 69 (100.0%) |
Housing Occupancy in Fertile
Occupancy by Ownership in Fertile
Of the total 158 dwellings in Fertile, owner-occupied units account for 137 (86.7%), while renter-occupied units make up 21 (13.3%).
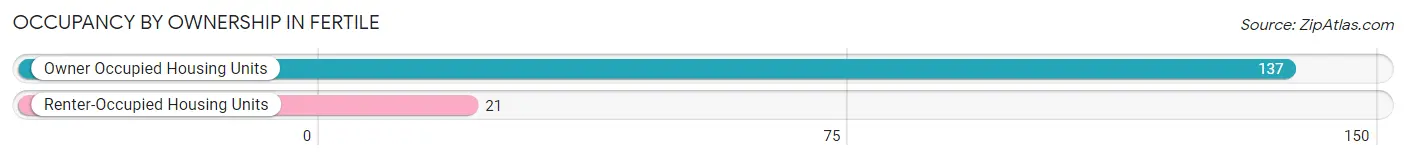
| Occupancy | # Housing Units | % Housing Units |
| Owner Occupied Housing Units | 137 | 86.7% |
| Renter-Occupied Housing Units | 21 | 13.3% |
| Total Occupied Housing Units | 158 | 100.0% |
Occupancy by Household Size in Fertile
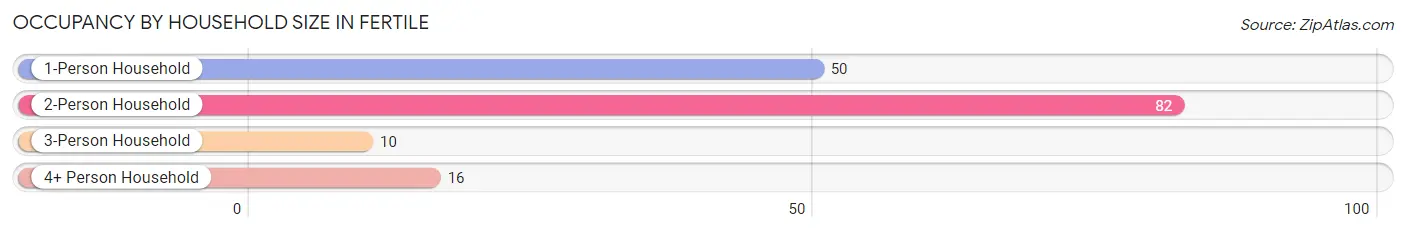
| Household Size | # Housing Units | % Housing Units |
| 1-Person Household | 50 | 31.7% |
| 2-Person Household | 82 | 51.9% |
| 3-Person Household | 10 | 6.3% |
| 4+ Person Household | 16 | 10.1% |
| Total Housing Units | 158 | 100.0% |
Occupancy by Ownership by Household Size in Fertile
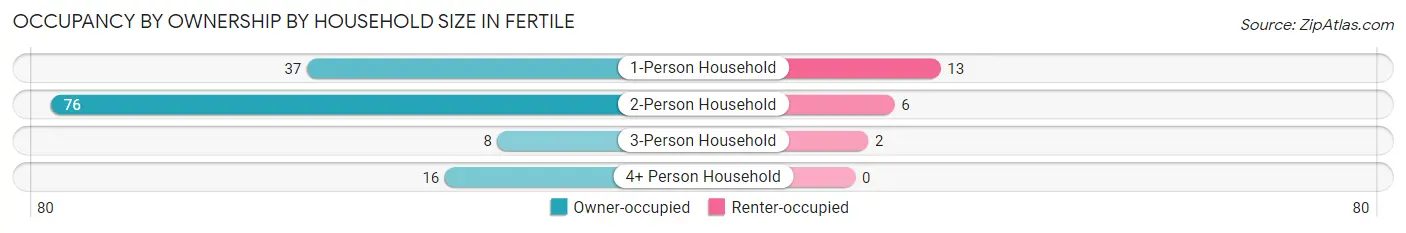
| Household Size | Owner-occupied | Renter-occupied |
| 1-Person Household | 37 (74.0%) | 13 (26.0%) |
| 2-Person Household | 76 (92.7%) | 6 (7.3%) |
| 3-Person Household | 8 (80.0%) | 2 (20.0%) |
| 4+ Person Household | 16 (100.0%) | 0 (0.0%) |
| Total Housing Units | 137 (86.7%) | 21 (13.3%) |
Occupancy by Educational Attainment in Fertile
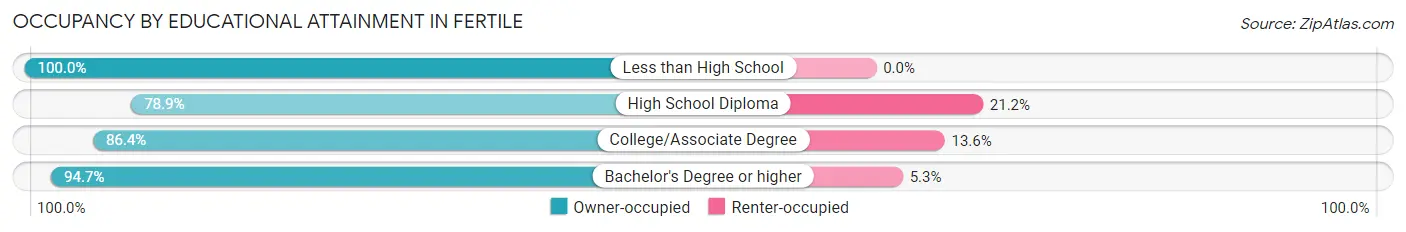
| Household Size | Owner-occupied | Renter-occupied |
| Less than High School | 9 (100.0%) | 0 (0.0%) |
| High School Diploma | 41 (78.8%) | 11 (21.1%) |
| College/Associate Degree | 51 (86.4%) | 8 (13.6%) |
| Bachelor's Degree or higher | 36 (94.7%) | 2 (5.3%) |
Occupancy by Age of Householder in Fertile
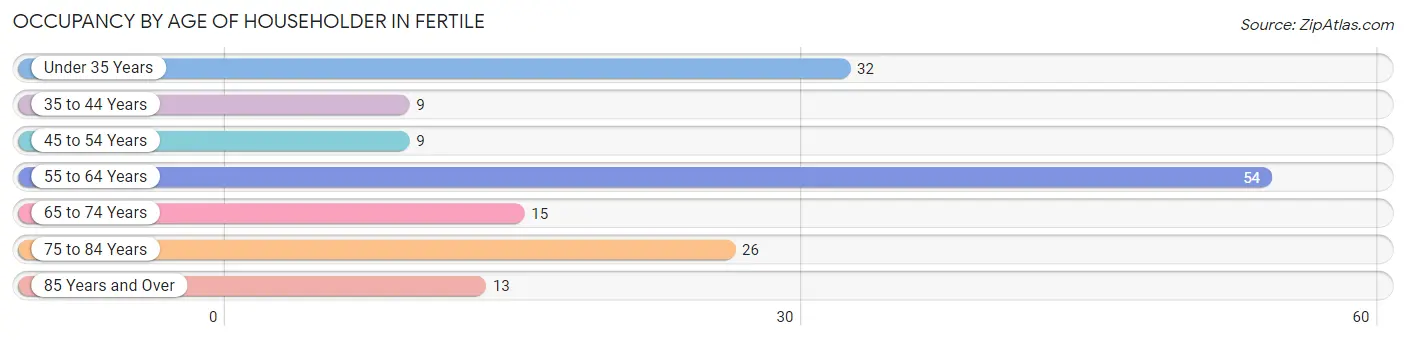
| Age Bracket | # Households | % Households |
| Under 35 Years | 32 | 20.3% |
| 35 to 44 Years | 9 | 5.7% |
| 45 to 54 Years | 9 | 5.7% |
| 55 to 64 Years | 54 | 34.2% |
| 65 to 74 Years | 15 | 9.5% |
| 75 to 84 Years | 26 | 16.5% |
| 85 Years and Over | 13 | 8.2% |
| Total | 158 | 100.0% |
Housing Finances in Fertile
Median Income by Occupancy in Fertile
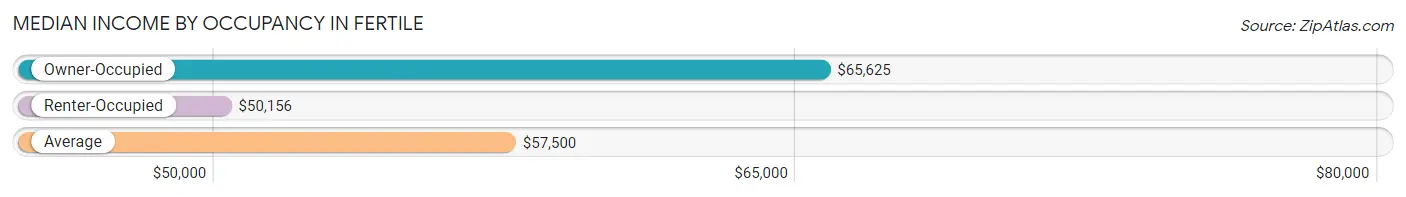
| Occupancy Type | # Households | Median Income |
| Owner-Occupied | 137 (86.7%) | $65,625 |
| Renter-Occupied | 21 (13.3%) | $50,156 |
| Average | 158 (100.0%) | $57,500 |
Occupancy by Householder Income Bracket in Fertile
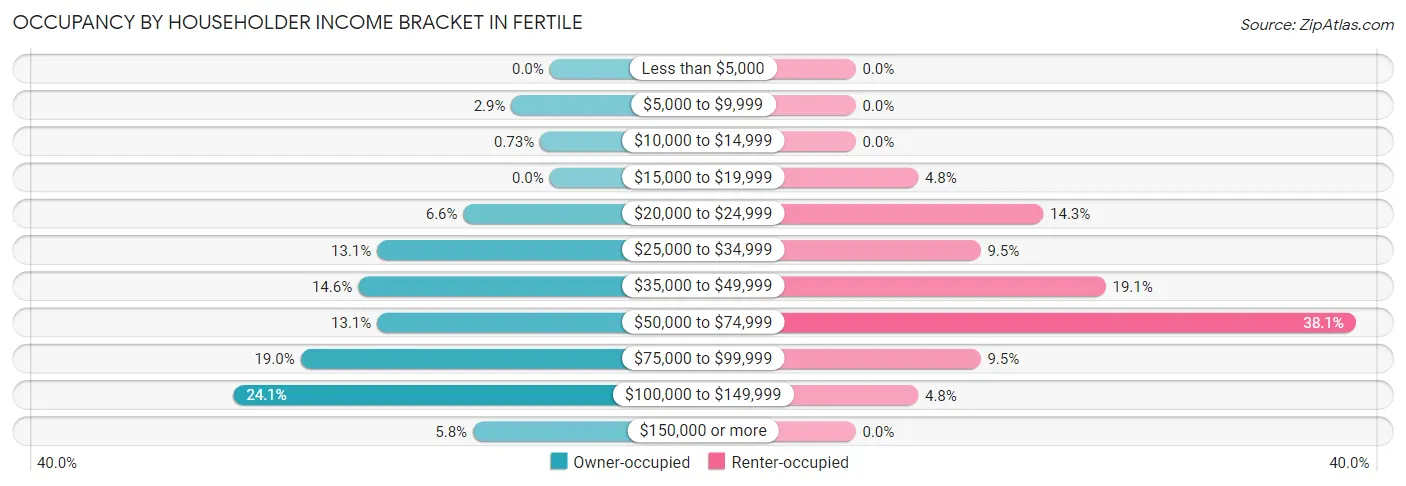
| Income Bracket | Owner-occupied | Renter-occupied |
| Less than $5,000 | 0 (0.0%) | 0 (0.0%) |
| $5,000 to $9,999 | 4 (2.9%) | 0 (0.0%) |
| $10,000 to $14,999 | 1 (0.7%) | 0 (0.0%) |
| $15,000 to $19,999 | 0 (0.0%) | 1 (4.8%) |
| $20,000 to $24,999 | 9 (6.6%) | 3 (14.3%) |
| $25,000 to $34,999 | 18 (13.1%) | 2 (9.5%) |
| $35,000 to $49,999 | 20 (14.6%) | 4 (19.1%) |
| $50,000 to $74,999 | 18 (13.1%) | 8 (38.1%) |
| $75,000 to $99,999 | 26 (19.0%) | 2 (9.5%) |
| $100,000 to $149,999 | 33 (24.1%) | 1 (4.8%) |
| $150,000 or more | 8 (5.8%) | 0 (0.0%) |
| Total | 137 (100.0%) | 21 (100.0%) |
Monthly Housing Cost Tiers in Fertile
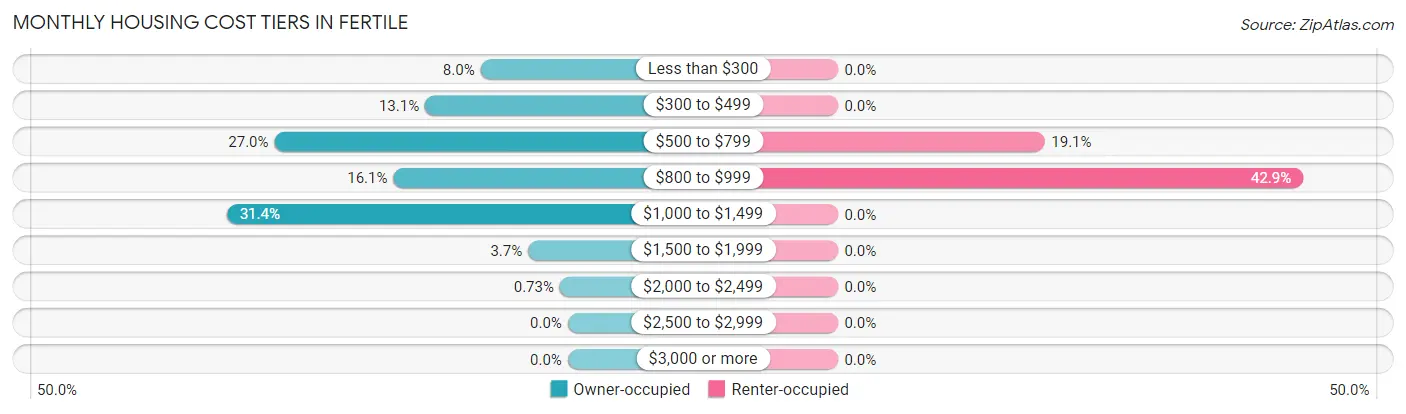
| Monthly Cost | Owner-occupied | Renter-occupied |
| Less than $300 | 11 (8.0%) | 0 (0.0%) |
| $300 to $499 | 18 (13.1%) | 0 (0.0%) |
| $500 to $799 | 37 (27.0%) | 4 (19.1%) |
| $800 to $999 | 22 (16.1%) | 9 (42.9%) |
| $1,000 to $1,499 | 43 (31.4%) | 0 (0.0%) |
| $1,500 to $1,999 | 5 (3.6%) | 0 (0.0%) |
| $2,000 to $2,499 | 1 (0.7%) | 0 (0.0%) |
| $2,500 to $2,999 | 0 (0.0%) | 0 (0.0%) |
| $3,000 or more | 0 (0.0%) | 0 (0.0%) |
| Total | 137 (100.0%) | 21 (100.0%) |
Physical Housing Characteristics in Fertile
Housing Structures in Fertile
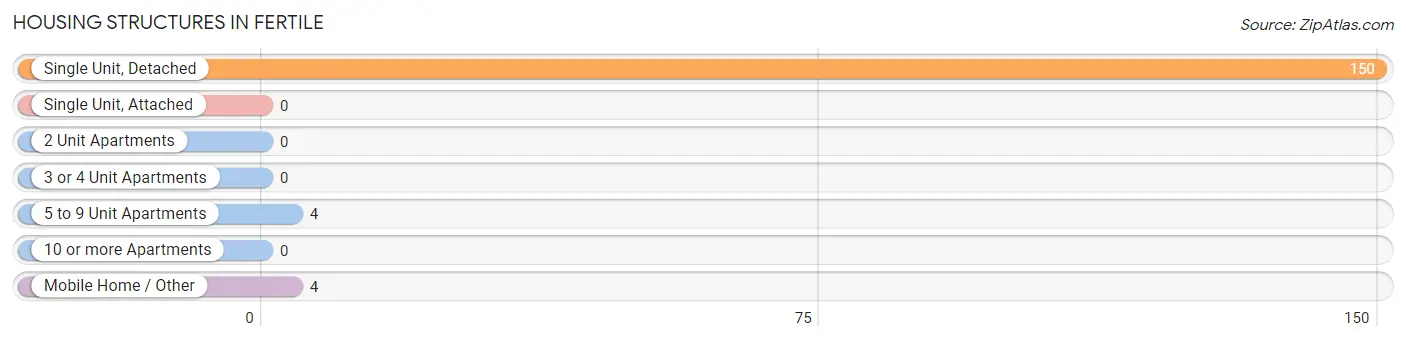
| Structure Type | # Housing Units | % Housing Units |
| Single Unit, Detached | 150 | 94.9% |
| Single Unit, Attached | 0 | 0.0% |
| 2 Unit Apartments | 0 | 0.0% |
| 3 or 4 Unit Apartments | 0 | 0.0% |
| 5 to 9 Unit Apartments | 4 | 2.5% |
| 10 or more Apartments | 0 | 0.0% |
| Mobile Home / Other | 4 | 2.5% |
| Total | 158 | 100.0% |
Housing Structures by Occupancy in Fertile
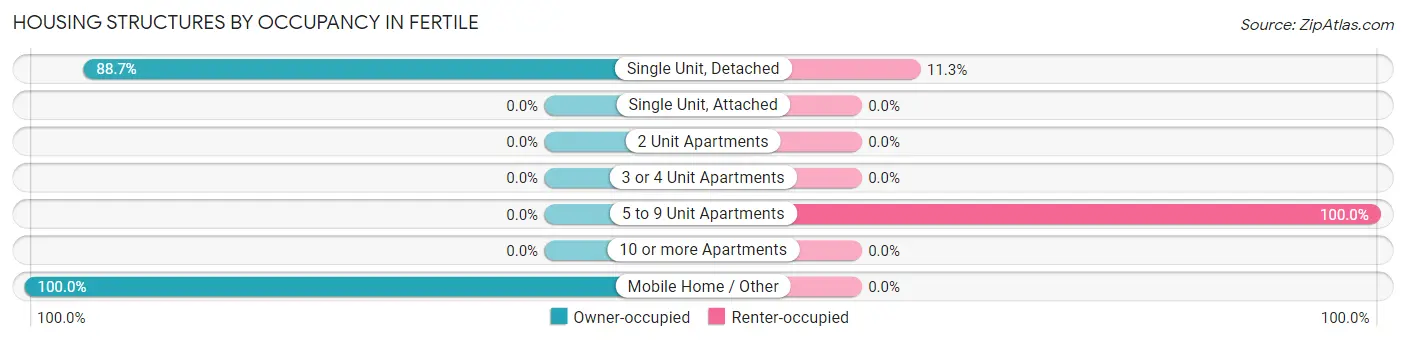
| Structure Type | Owner-occupied | Renter-occupied |
| Single Unit, Detached | 133 (88.7%) | 17 (11.3%) |
| Single Unit, Attached | 0 (0.0%) | 0 (0.0%) |
| 2 Unit Apartments | 0 (0.0%) | 0 (0.0%) |
| 3 or 4 Unit Apartments | 0 (0.0%) | 0 (0.0%) |
| 5 to 9 Unit Apartments | 0 (0.0%) | 4 (100.0%) |
| 10 or more Apartments | 0 (0.0%) | 0 (0.0%) |
| Mobile Home / Other | 4 (100.0%) | 0 (0.0%) |
| Total | 137 (86.7%) | 21 (13.3%) |
Housing Structures by Number of Rooms in Fertile
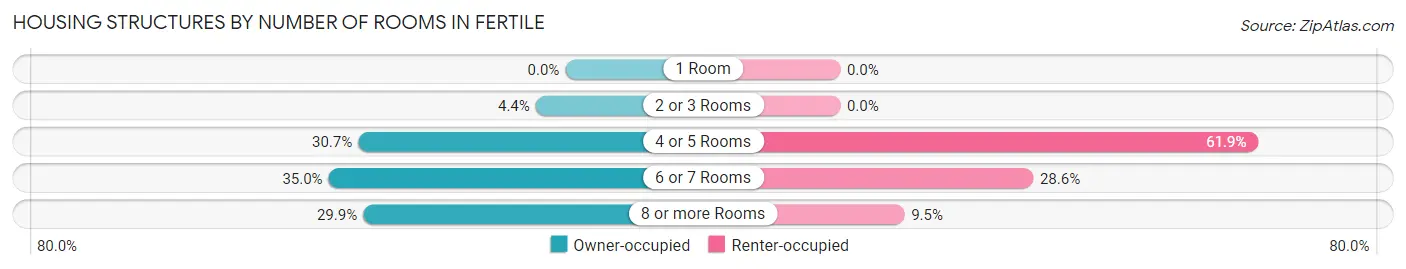
| Number of Rooms | Owner-occupied | Renter-occupied |
| 1 Room | 0 (0.0%) | 0 (0.0%) |
| 2 or 3 Rooms | 6 (4.4%) | 0 (0.0%) |
| 4 or 5 Rooms | 42 (30.7%) | 13 (61.9%) |
| 6 or 7 Rooms | 48 (35.0%) | 6 (28.6%) |
| 8 or more Rooms | 41 (29.9%) | 2 (9.5%) |
| Total | 137 (100.0%) | 21 (100.0%) |
Housing Structure by Heating Type in Fertile
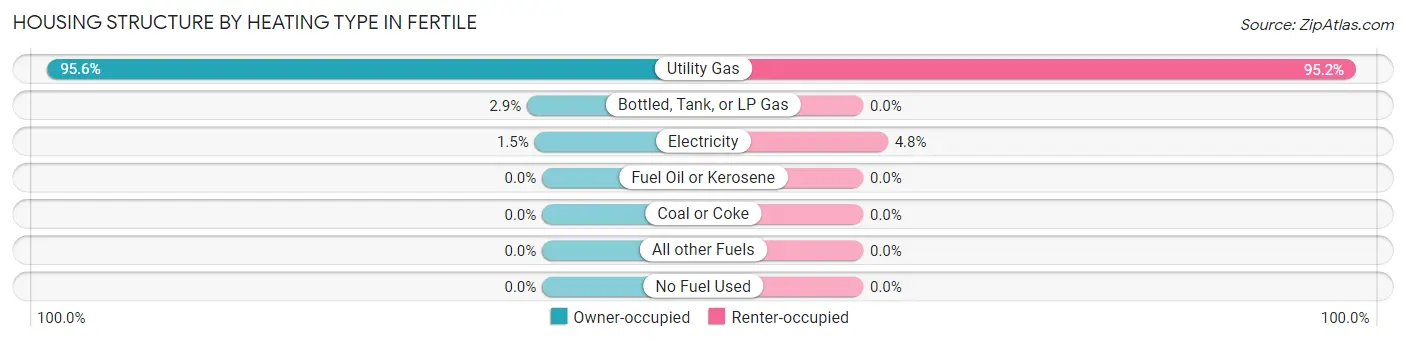
| Heating Type | Owner-occupied | Renter-occupied |
| Utility Gas | 131 (95.6%) | 20 (95.2%) |
| Bottled, Tank, or LP Gas | 4 (2.9%) | 0 (0.0%) |
| Electricity | 2 (1.5%) | 1 (4.8%) |
| Fuel Oil or Kerosene | 0 (0.0%) | 0 (0.0%) |
| Coal or Coke | 0 (0.0%) | 0 (0.0%) |
| All other Fuels | 0 (0.0%) | 0 (0.0%) |
| No Fuel Used | 0 (0.0%) | 0 (0.0%) |
| Total | 137 (100.0%) | 21 (100.0%) |
Household Vehicle Usage in Fertile
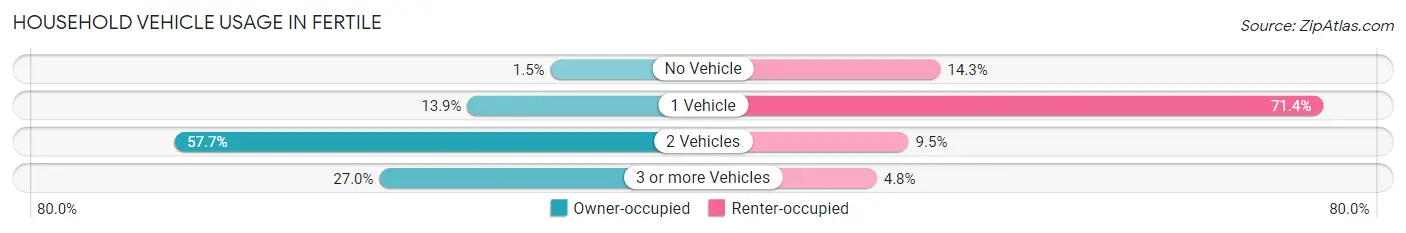
| Vehicles per Household | Owner-occupied | Renter-occupied |
| No Vehicle | 2 (1.5%) | 3 (14.3%) |
| 1 Vehicle | 19 (13.9%) | 15 (71.4%) |
| 2 Vehicles | 79 (57.7%) | 2 (9.5%) |
| 3 or more Vehicles | 37 (27.0%) | 1 (4.8%) |
| Total | 137 (100.0%) | 21 (100.0%) |
Real Estate & Mortgages in Fertile
Real Estate and Mortgage Overview in Fertile
| Characteristic | Without Mortgage | With Mortgage |
| Housing Units | 62 | 75 |
| Median Property Value | $135,000 | $106,300 |
| Median Household Income | $43,750 | $5 |
| Monthly Housing Costs | $536 | $0 |
| Real Estate Taxes | $1,417 | $0 |
Property Value by Mortgage Status in Fertile
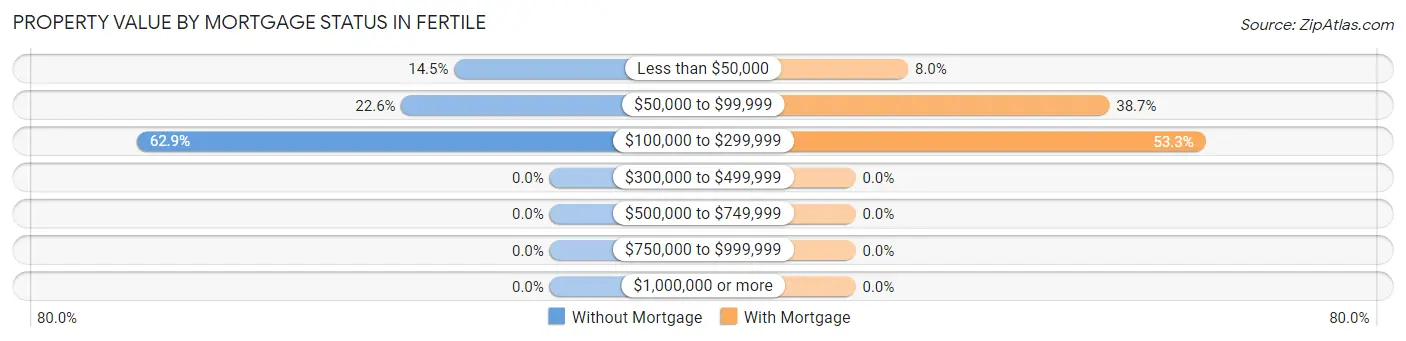
| Property Value | Without Mortgage | With Mortgage |
| Less than $50,000 | 9 (14.5%) | 6 (8.0%) |
| $50,000 to $99,999 | 14 (22.6%) | 29 (38.7%) |
| $100,000 to $299,999 | 39 (62.9%) | 40 (53.3%) |
| $300,000 to $499,999 | 0 (0.0%) | 0 (0.0%) |
| $500,000 to $749,999 | 0 (0.0%) | 0 (0.0%) |
| $750,000 to $999,999 | 0 (0.0%) | 0 (0.0%) |
| $1,000,000 or more | 0 (0.0%) | 0 (0.0%) |
| Total | 62 (100.0%) | 75 (100.0%) |
Household Income by Mortgage Status in Fertile
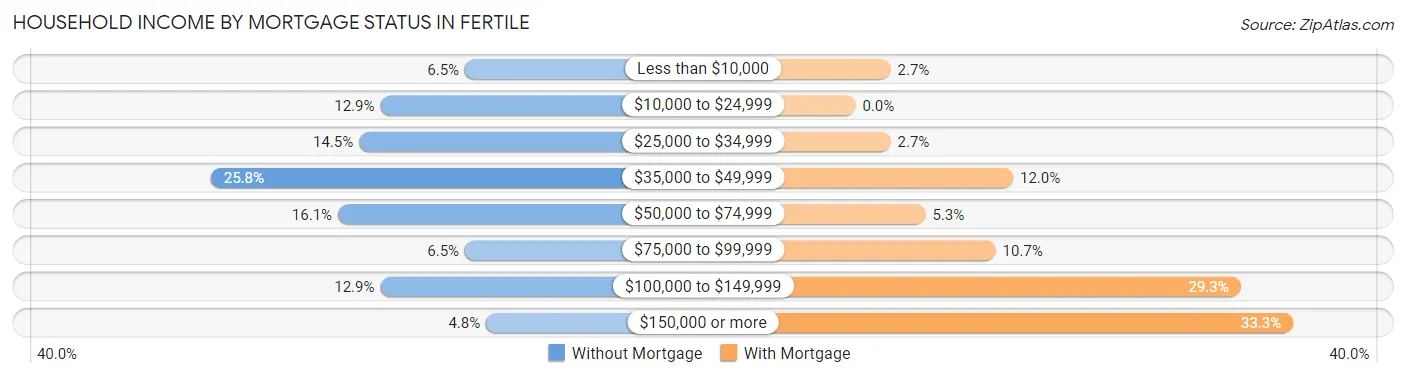
| Household Income | Without Mortgage | With Mortgage |
| Less than $10,000 | 4 (6.5%) | 2 (2.7%) |
| $10,000 to $24,999 | 8 (12.9%) | 0 (0.0%) |
| $25,000 to $34,999 | 9 (14.5%) | 2 (2.7%) |
| $35,000 to $49,999 | 16 (25.8%) | 9 (12.0%) |
| $50,000 to $74,999 | 10 (16.1%) | 4 (5.3%) |
| $75,000 to $99,999 | 4 (6.5%) | 8 (10.7%) |
| $100,000 to $149,999 | 8 (12.9%) | 22 (29.3%) |
| $150,000 or more | 3 (4.8%) | 25 (33.3%) |
| Total | 62 (100.0%) | 75 (100.0%) |
Property Value to Household Income Ratio in Fertile
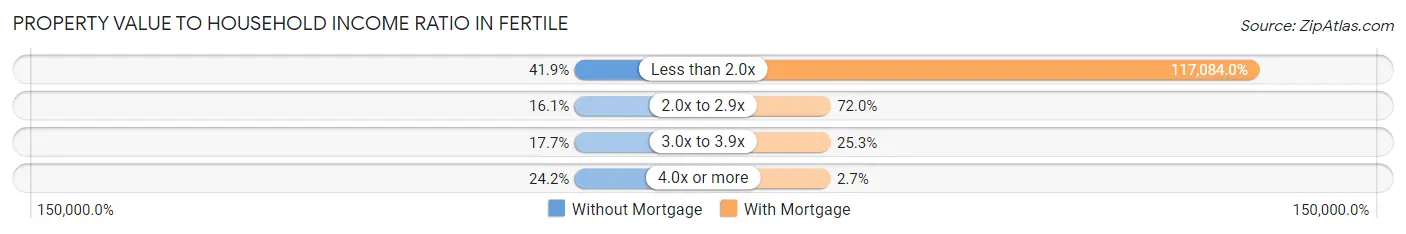
| Value-to-Income Ratio | Without Mortgage | With Mortgage |
| Less than 2.0x | 26 (41.9%) | 87,813 (117,084.0%) |
| 2.0x to 2.9x | 10 (16.1%) | 54 (72.0%) |
| 3.0x to 3.9x | 11 (17.7%) | 19 (25.3%) |
| 4.0x or more | 15 (24.2%) | 2 (2.7%) |
| Total | 62 (100.0%) | 75 (100.0%) |
Real Estate Taxes by Mortgage Status in Fertile
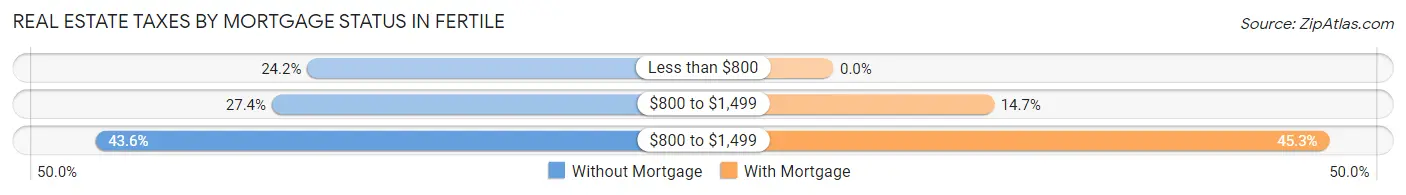
| Property Taxes | Without Mortgage | With Mortgage |
| Less than $800 | 15 (24.2%) | 0 (0.0%) |
| $800 to $1,499 | 17 (27.4%) | 11 (14.7%) |
| $800 to $1,499 | 27 (43.5%) | 34 (45.3%) |
| Total | 62 (100.0%) | 75 (100.0%) |
Health & Disability in Fertile
Health Insurance Coverage by Age in Fertile
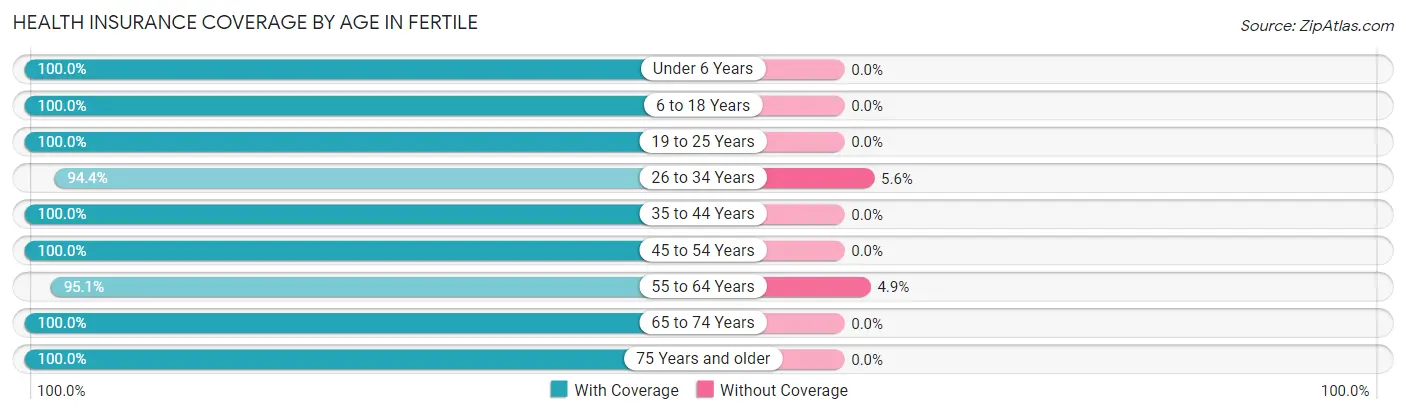
| Age Bracket | With Coverage | Without Coverage |
| Under 6 Years | 11 (100.0%) | 0 (0.0%) |
| 6 to 18 Years | 23 (100.0%) | 0 (0.0%) |
| 19 to 25 Years | 12 (100.0%) | 0 (0.0%) |
| 26 to 34 Years | 34 (94.4%) | 2 (5.6%) |
| 35 to 44 Years | 25 (100.0%) | 0 (0.0%) |
| 45 to 54 Years | 21 (100.0%) | 0 (0.0%) |
| 55 to 64 Years | 78 (95.1%) | 4 (4.9%) |
| 65 to 74 Years | 28 (100.0%) | 0 (0.0%) |
| 75 Years and older | 60 (100.0%) | 0 (0.0%) |
| Total | 292 (98.0%) | 6 (2.0%) |
Health Insurance Coverage by Citizenship Status in Fertile
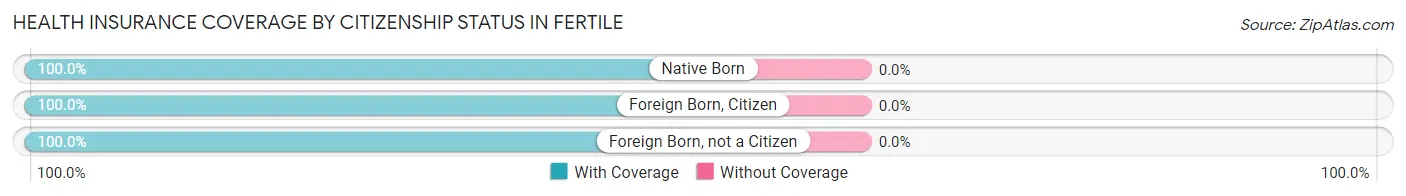
| Citizenship Status | With Coverage | Without Coverage |
| Native Born | 11 (100.0%) | 0 (0.0%) |
| Foreign Born, Citizen | 23 (100.0%) | 0 (0.0%) |
| Foreign Born, not a Citizen | 12 (100.0%) | 0 (0.0%) |
Health Insurance Coverage by Household Income in Fertile
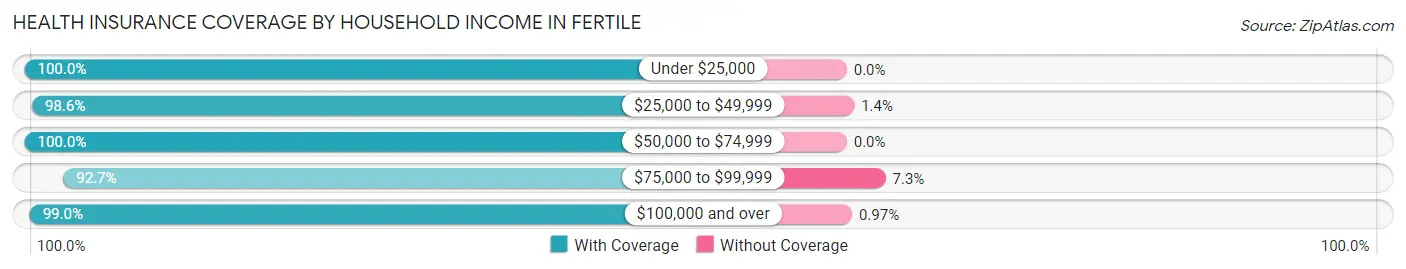
| Household Income | With Coverage | Without Coverage |
| Under $25,000 | 30 (100.0%) | 0 (0.0%) |
| $25,000 to $49,999 | 71 (98.6%) | 1 (1.4%) |
| $50,000 to $74,999 | 38 (100.0%) | 0 (0.0%) |
| $75,000 to $99,999 | 51 (92.7%) | 4 (7.3%) |
| $100,000 and over | 102 (99.0%) | 1 (1.0%) |
Public vs Private Health Insurance Coverage by Age in Fertile
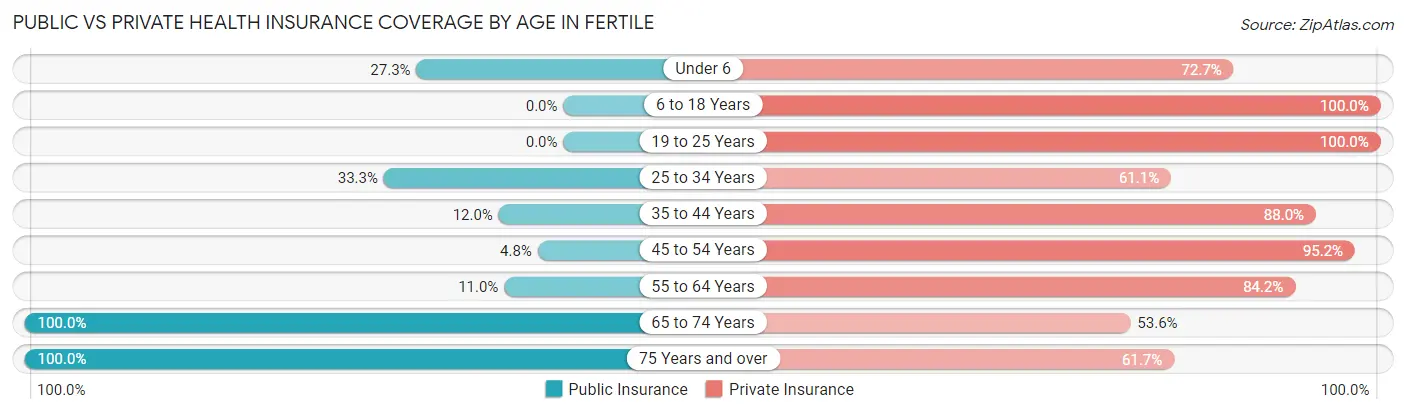
| Age Bracket | Public Insurance | Private Insurance |
| Under 6 | 3 (27.3%) | 8 (72.7%) |
| 6 to 18 Years | 0 (0.0%) | 23 (100.0%) |
| 19 to 25 Years | 0 (0.0%) | 12 (100.0%) |
| 25 to 34 Years | 12 (33.3%) | 22 (61.1%) |
| 35 to 44 Years | 3 (12.0%) | 22 (88.0%) |
| 45 to 54 Years | 1 (4.8%) | 20 (95.2%) |
| 55 to 64 Years | 9 (11.0%) | 69 (84.2%) |
| 65 to 74 Years | 28 (100.0%) | 15 (53.6%) |
| 75 Years and over | 60 (100.0%) | 37 (61.7%) |
| Total | 116 (38.9%) | 228 (76.5%) |
Disability Status by Sex by Age in Fertile
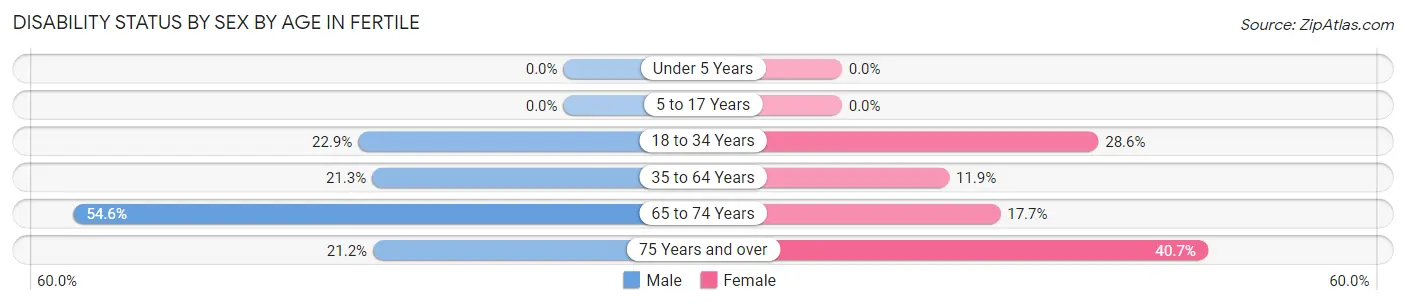
| Age Bracket | Male | Female |
| Under 5 Years | 0 (0.0%) | 0 (0.0%) |
| 5 to 17 Years | 0 (0.0%) | 0 (0.0%) |
| 18 to 34 Years | 8 (22.9%) | 4 (28.6%) |
| 35 to 64 Years | 13 (21.3%) | 8 (11.9%) |
| 65 to 74 Years | 6 (54.5%) | 3 (17.6%) |
| 75 Years and over | 7 (21.2%) | 11 (40.7%) |
Disability Class by Sex by Age in Fertile
Disability Class: Hearing Difficulty
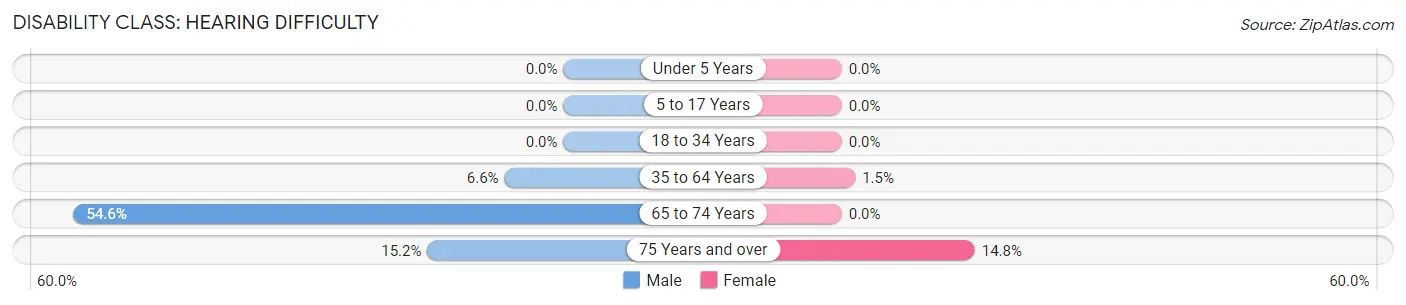
| Age Bracket | Male | Female |
| Under 5 Years | 0 (0.0%) | 0 (0.0%) |
| 5 to 17 Years | 0 (0.0%) | 0 (0.0%) |
| 18 to 34 Years | 0 (0.0%) | 0 (0.0%) |
| 35 to 64 Years | 4 (6.6%) | 1 (1.5%) |
| 65 to 74 Years | 6 (54.5%) | 0 (0.0%) |
| 75 Years and over | 5 (15.1%) | 4 (14.8%) |
Disability Class: Vision Difficulty
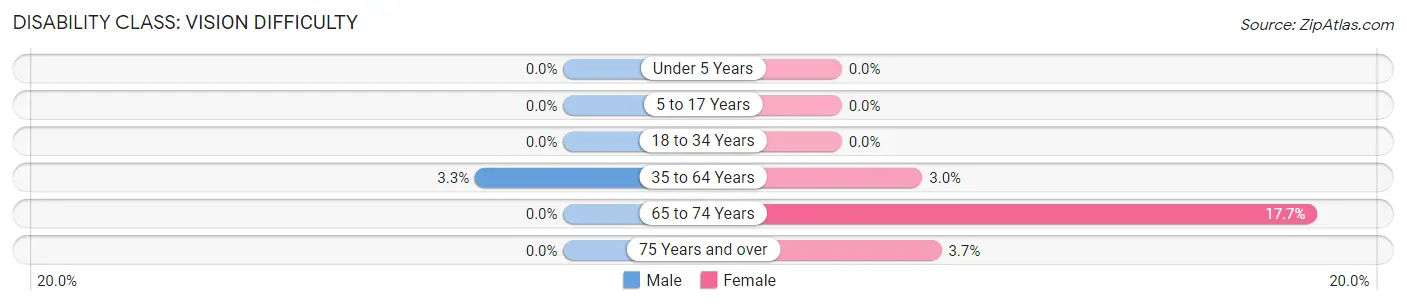
| Age Bracket | Male | Female |
| Under 5 Years | 0 (0.0%) | 0 (0.0%) |
| 5 to 17 Years | 0 (0.0%) | 0 (0.0%) |
| 18 to 34 Years | 0 (0.0%) | 0 (0.0%) |
| 35 to 64 Years | 2 (3.3%) | 2 (3.0%) |
| 65 to 74 Years | 0 (0.0%) | 3 (17.6%) |
| 75 Years and over | 0 (0.0%) | 1 (3.7%) |
Disability Class: Cognitive Difficulty
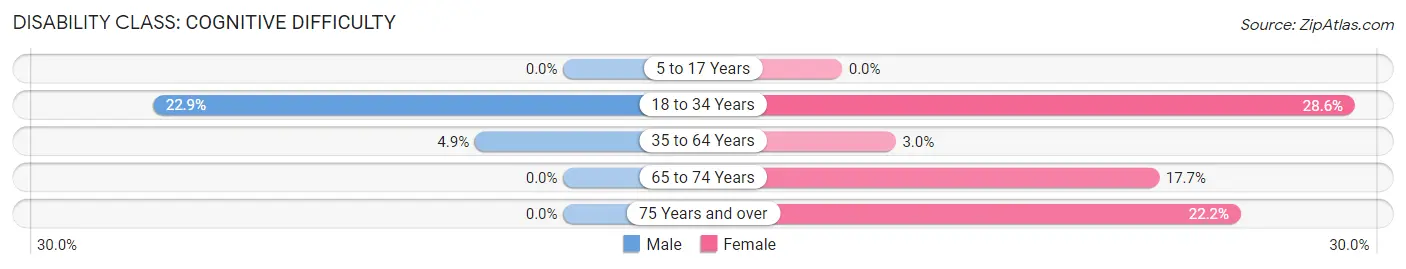
| Age Bracket | Male | Female |
| 5 to 17 Years | 0 (0.0%) | 0 (0.0%) |
| 18 to 34 Years | 8 (22.9%) | 4 (28.6%) |
| 35 to 64 Years | 3 (4.9%) | 2 (3.0%) |
| 65 to 74 Years | 0 (0.0%) | 3 (17.6%) |
| 75 Years and over | 0 (0.0%) | 6 (22.2%) |
Disability Class: Ambulatory Difficulty
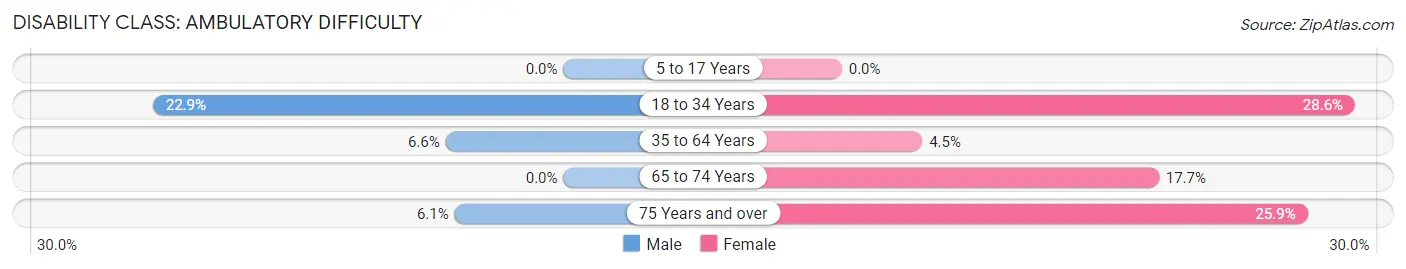
| Age Bracket | Male | Female |
| 5 to 17 Years | 0 (0.0%) | 0 (0.0%) |
| 18 to 34 Years | 8 (22.9%) | 4 (28.6%) |
| 35 to 64 Years | 4 (6.6%) | 3 (4.5%) |
| 65 to 74 Years | 0 (0.0%) | 3 (17.6%) |
| 75 Years and over | 2 (6.1%) | 7 (25.9%) |
Disability Class: Self-Care Difficulty
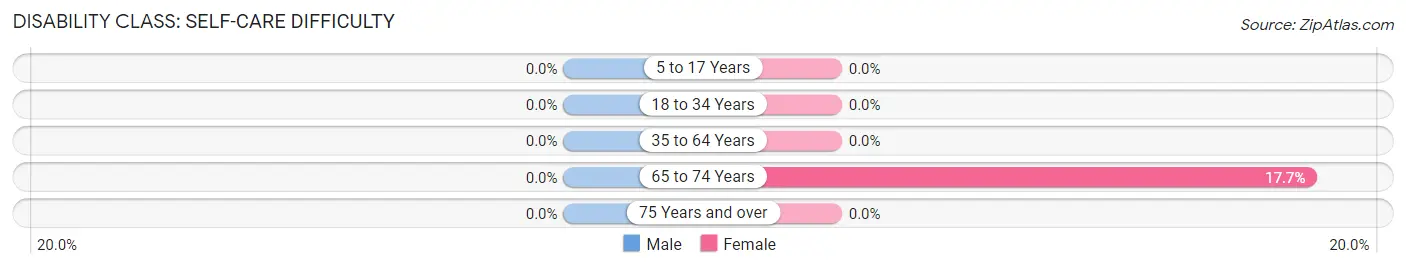
| Age Bracket | Male | Female |
| 5 to 17 Years | 0 (0.0%) | 0 (0.0%) |
| 18 to 34 Years | 0 (0.0%) | 0 (0.0%) |
| 35 to 64 Years | 0 (0.0%) | 0 (0.0%) |
| 65 to 74 Years | 0 (0.0%) | 3 (17.6%) |
| 75 Years and over | 0 (0.0%) | 0 (0.0%) |
Technology Access in Fertile
Computing Device Access in Fertile
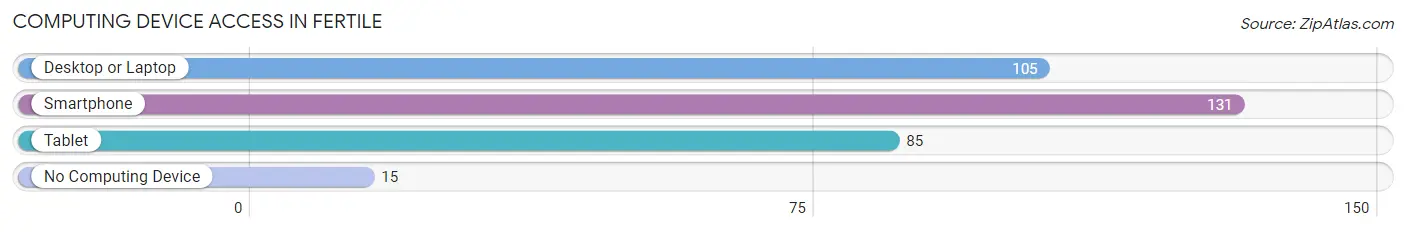
| Device Type | # Households | % Households |
| Desktop or Laptop | 105 | 66.5% |
| Smartphone | 131 | 82.9% |
| Tablet | 85 | 53.8% |
| No Computing Device | 15 | 9.5% |
| Total | 158 | 100.0% |
Internet Access in Fertile
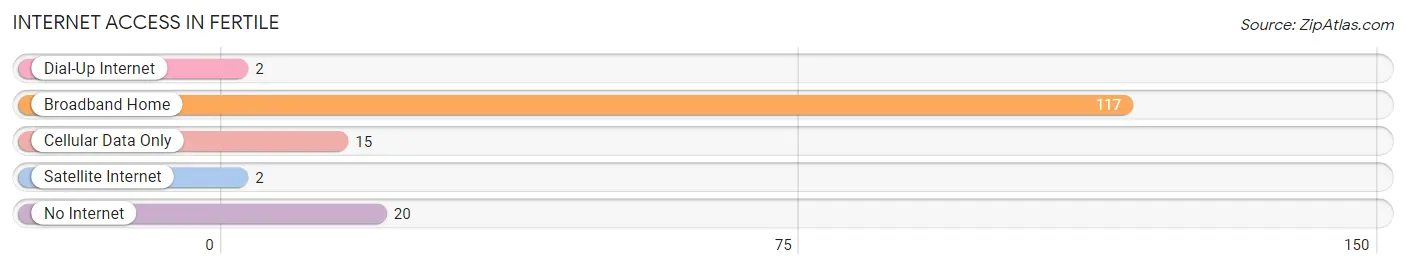
| Internet Type | # Households | % Households |
| Dial-Up Internet | 2 | 1.3% |
| Broadband Home | 117 | 74.1% |
| Cellular Data Only | 15 | 9.5% |
| Satellite Internet | 2 | 1.3% |
| No Internet | 20 | 12.7% |
| Total | 158 | 100.0% |
Fertile Summary
Fertile, Iowa is a small city located in Worth County in the northern part of the state. It is situated on the banks of the Shell Rock River and is home to a population of just over 1,000 people. The city is known for its agricultural heritage and is home to a variety of businesses, including a grain elevator, a feed mill, and a lumber yard.
Geography
Fertile is located in Worth County, Iowa, in the northern part of the state. It is situated on the banks of the Shell Rock River, which flows through the city. The city is located in the Driftless Area, which is characterized by its rolling hills and valleys. The city is surrounded by farmland and is home to a variety of wildlife, including deer, wild turkeys, and bald eagles.
The city has a total area of 1.2 square miles, all of which is land. The city has a humid continental climate, with hot summers and cold winters. The average temperature in the summer is around 75 degrees Fahrenheit, and the average temperature in the winter is around 20 degrees Fahrenheit.
Economy
Fertile is a small city with a population of just over 1,000 people. The city is known for its agricultural heritage and is home to a variety of businesses, including a grain elevator, a feed mill, and a lumber yard. The city is also home to a variety of small businesses, including restaurants, retail stores, and service providers.
The city is home to a variety of industries, including manufacturing, agriculture, and tourism. The city is home to a variety of manufacturing companies, including a plastics manufacturer, a metal fabricator, and a machine shop. The city is also home to a variety of agricultural businesses, including a dairy farm, a hog farm, and a grain elevator. The city is also home to a variety of tourist attractions, including a golf course, a museum, and a historic theater.
Demographics
As of the 2010 census, the population of Fertile was 1,039. The racial makeup of the city was 97.3% White, 0.3% African American, 0.2% Native American, 0.2% Asian, 0.1% Pacific Islander, 0.7% from other races, and 1.3% from two or more races. Hispanic or Latino of any race were 1.7% of the population.
The median income for a household in the city was $41,250, and the median income for a family was $50,000. The per capita income for the city was $19,945. About 8.3% of families and 10.2% of the population were below the poverty line, including 14.3% of those under age 18 and 8.3% of those age 65 or over.
Conclusion
Fertile, Iowa is a small city located in Worth County in the northern part of the state. It is situated on the banks of the Shell Rock River and is home to a population of just over 1,000 people. The city is known for its agricultural heritage and is home to a variety of businesses, including a grain elevator, a feed mill, and a lumber yard. The city has a humid continental climate, with hot summers and cold winters. The city is home to a variety of industries, including manufacturing, agriculture, and tourism. The racial makeup of the city was 97.3% White, 0.3% African American, 0.2% Native American, 0.2% Asian, 0.1% Pacific Islander, 0.7% from other races, and 1.3% from two or more races. The median income for a household in the city was $41,250, and the median income for a family was $50,000. Fertile is a small city with a rich history and a vibrant economy.
Common Questions
What is Per Capita Income in Fertile?
Per Capita income in Fertile is $37,907.
What is the Median Family Income in Fertile?
Median Family Income in Fertile is $80,750.
What is the Median Household income in Fertile?
Median Household Income in Fertile is $57,500.
What is Income or Wage Gap in Fertile?
Income or Wage Gap in Fertile is 26.9%.
Women in Fertile earn 73.1 cents for every dollar earned by a man.
What is Inequality or Gini Index in Fertile?
Inequality or Gini Index in Fertile is 0.35.
What is the Total Population of Fertile?
Total Population of Fertile is 298.
What is the Total Male Population of Fertile?
Total Male Population of Fertile is 159.
What is the Total Female Population of Fertile?
Total Female Population of Fertile is 139.
What is the Ratio of Males per 100 Females in Fertile?
There are 114.39 Males per 100 Females in Fertile.
What is the Ratio of Females per 100 Males in Fertile?
There are 87.42 Females per 100 Males in Fertile.
What is the Median Population Age in Fertile?
Median Population Age in Fertile is 57.7 Years.
What is the Average Family Size in Fertile
Average Family Size in Fertile is 2.3 People.
What is the Average Household Size in Fertile
Average Household Size in Fertile is 1.9 People.
How Large is the Labor Force in Fertile?
There are 171 People in the Labor Forcein in Fertile.
What is the Percentage of People in the Labor Force in Fertile?
64.0% of People are in the Labor Force in Fertile.