Delaware, IA Map & Demographics
Delaware Map
Delaware Overview
$34,073
PER CAPITA INCOME
$68,250
AVG FAMILY INCOME
$68,125
AVG HOUSEHOLD INCOME
0.33
INEQUALITY / GINI INDEX
141
TOTAL POPULATION
69
MALE POPULATION
72
FEMALE POPULATION
95.83
MALES / 100 FEMALES
104.35
FEMALES / 100 MALES
55.0
MEDIAN AGE
2.8
AVG FAMILY SIZE
2.1
AVG HOUSEHOLD SIZE
79
LABOR FORCE [ PEOPLE ]
67.5%
PERCENT IN LABOR FORCE
Delaware Zip Codes
Delaware Area Codes
Income in Delaware
Income Overview in Delaware
Per Capita Income in Delaware is $34,073, while median incomes of families and households are $68,250 and $68,125 respectively.
| Characteristic | Number | Measure |
| Per Capita Income | 141 | $34,073 |
| Median Family Income | 37 | $68,250 |
| Mean Family Income | 37 | $80,746 |
| Median Household Income | 68 | $68,125 |
| Mean Household Income | 68 | $72,968 |
| Income Deficit | 37 | $0 |
| Wage / Income Gap (%) | 141 | 0.00% |
| Wage / Income Gap ($) | 141 | 100.00¢ per $1 |
| Gini / Inequality Index | 141 | 0.33 |
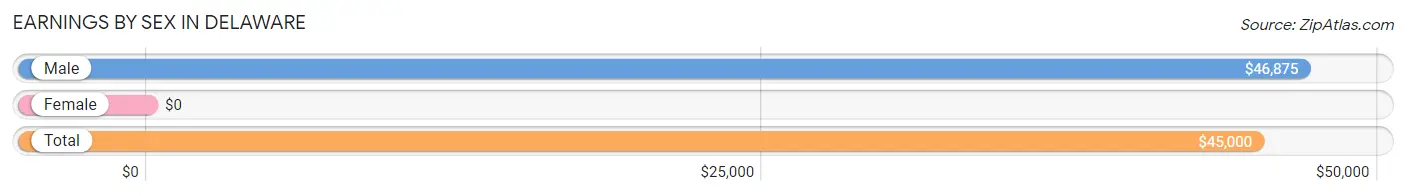
Earnings by Sex in Delaware
| Sex | Number | Average Earnings |
| Male | 43 (47.8%) | $46,875 |
| Female | 47 (52.2%) | $0 |
| Total | 90 (100.0%) | $45,000 |
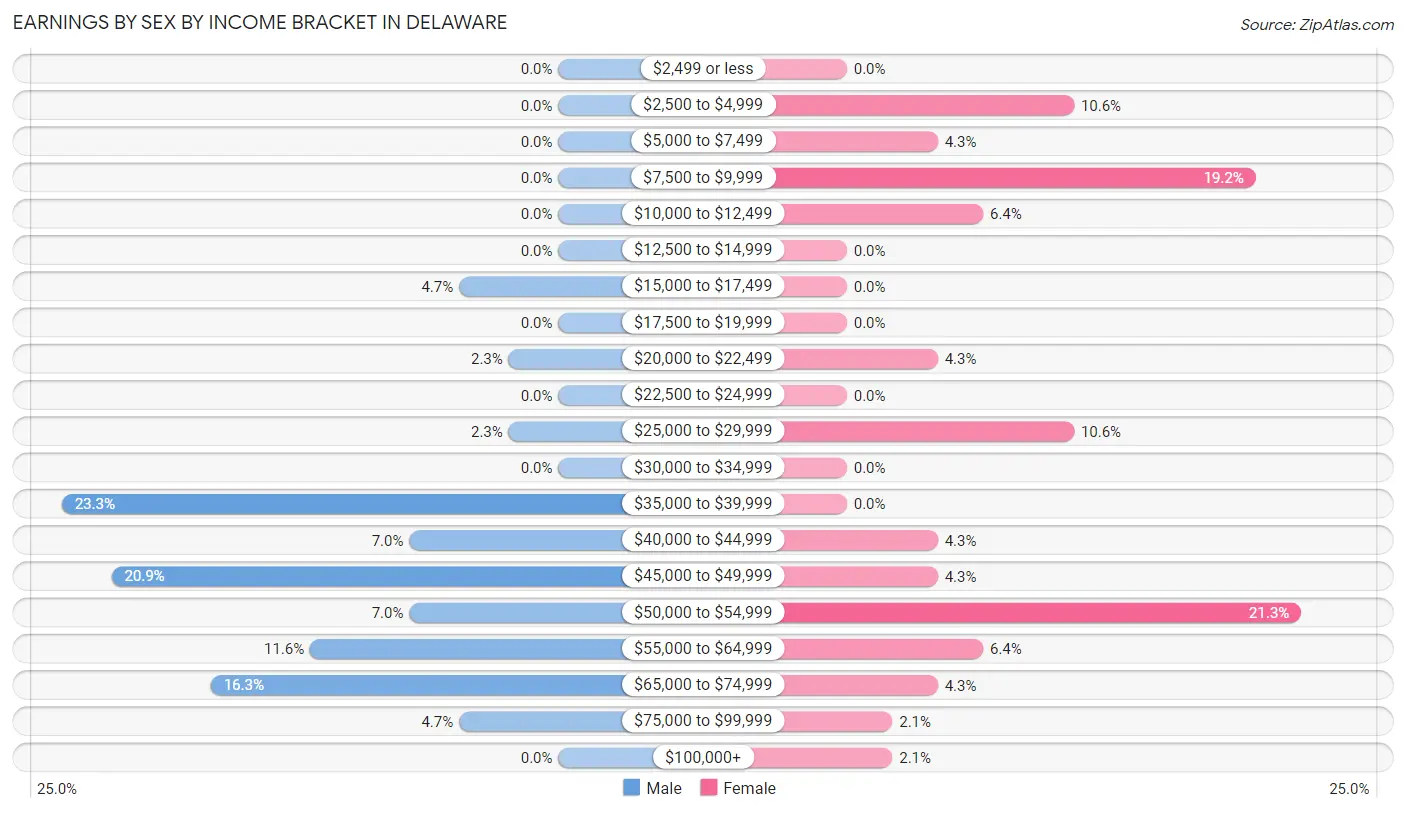
Earnings by Sex by Income Bracket in Delaware
The most common earnings brackets in Delaware are $35,000 to $39,999 for men (10 | 23.3%) and $50,000 to $54,999 for women (10 | 21.3%).
| Income | Male | Female |
| $2,499 or less | 0 (0.0%) | 0 (0.0%) |
| $2,500 to $4,999 | 0 (0.0%) | 5 (10.6%) |
| $5,000 to $7,499 | 0 (0.0%) | 2 (4.3%) |
| $7,500 to $9,999 | 0 (0.0%) | 9 (19.2%) |
| $10,000 to $12,499 | 0 (0.0%) | 3 (6.4%) |
| $12,500 to $14,999 | 0 (0.0%) | 0 (0.0%) |
| $15,000 to $17,499 | 2 (4.6%) | 0 (0.0%) |
| $17,500 to $19,999 | 0 (0.0%) | 0 (0.0%) |
| $20,000 to $22,499 | 1 (2.3%) | 2 (4.3%) |
| $22,500 to $24,999 | 0 (0.0%) | 0 (0.0%) |
| $25,000 to $29,999 | 1 (2.3%) | 5 (10.6%) |
| $30,000 to $34,999 | 0 (0.0%) | 0 (0.0%) |
| $35,000 to $39,999 | 10 (23.3%) | 0 (0.0%) |
| $40,000 to $44,999 | 3 (7.0%) | 2 (4.3%) |
| $45,000 to $49,999 | 9 (20.9%) | 2 (4.3%) |
| $50,000 to $54,999 | 3 (7.0%) | 10 (21.3%) |
| $55,000 to $64,999 | 5 (11.6%) | 3 (6.4%) |
| $65,000 to $74,999 | 7 (16.3%) | 2 (4.3%) |
| $75,000 to $99,999 | 2 (4.6%) | 1 (2.1%) |
| $100,000+ | 0 (0.0%) | 1 (2.1%) |
| Total | 43 (100.0%) | 47 (100.0%) |
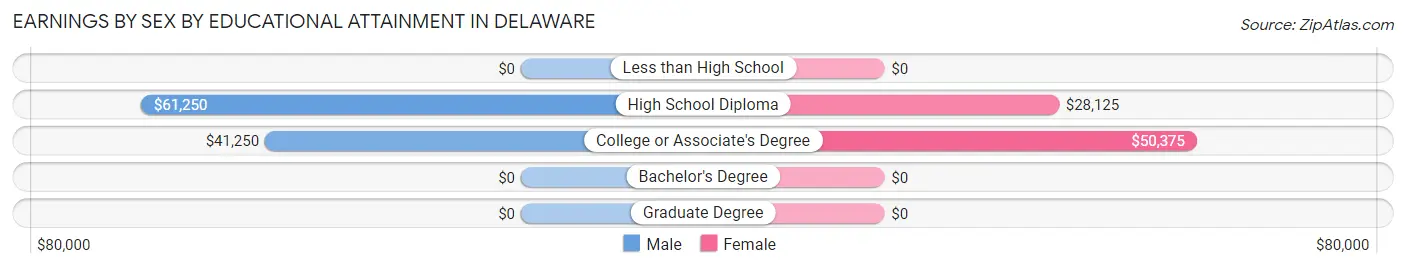
Earnings by Sex by Educational Attainment in Delaware
Average earnings in Delaware are $46,458 for men and $46,250 for women, a difference of 0.4%. Men with an educational attainment of high school diploma enjoy the highest average annual earnings of $61,250, while those with college or associate's degree education earn the least with $41,250. Women with an educational attainment of college or associate's degree earn the most with the average annual earnings of $50,375, while those with high school diploma education have the smallest earnings of $28,125.
| Educational Attainment | Male Income | Female Income |
| Less than High School | - | - |
| High School Diploma | $61,250 | $28,125 |
| College or Associate's Degree | $41,250 | $50,375 |
| Bachelor's Degree | - | - |
| Graduate Degree | - | - |
| Total | $46,458 | $46,250 |
Family Income in Delaware
Family Income Brackets in Delaware
According to the Delaware family income data, there are 10 families falling into the $50,000 to $74,999 income range, which is the most common income bracket and makes up 27.0% of all families.
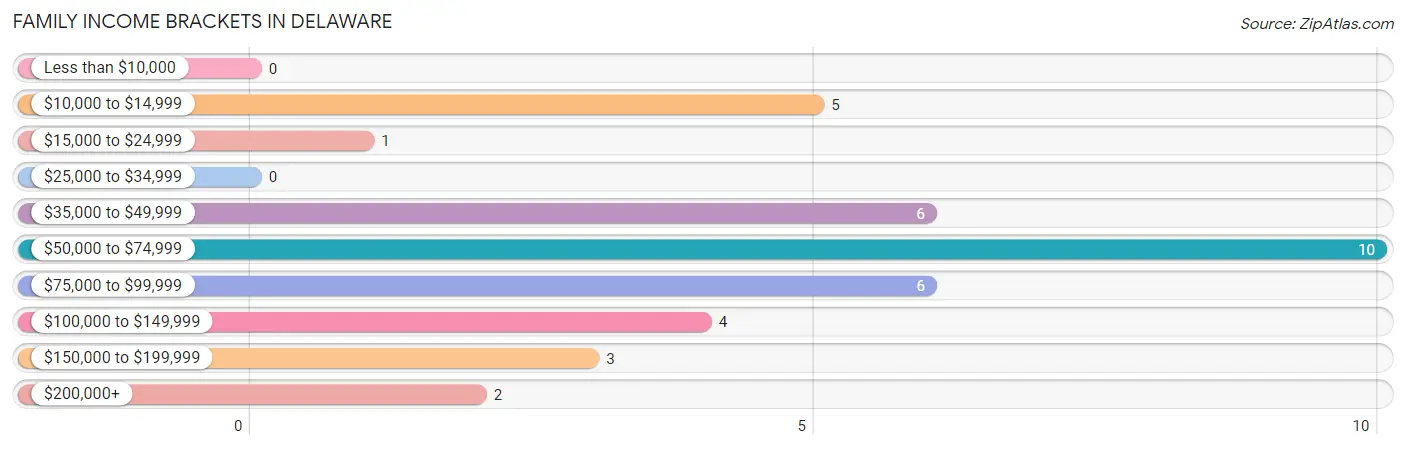
| Income Bracket | # Families | % Families |
| Less than $10,000 | 0 | 0.0% |
| $10,000 to $14,999 | 5 | 13.5% |
| $15,000 to $24,999 | 1 | 2.7% |
| $25,000 to $34,999 | 0 | 0.0% |
| $35,000 to $49,999 | 6 | 16.2% |
| $50,000 to $74,999 | 10 | 27.0% |
| $75,000 to $99,999 | 6 | 16.2% |
| $100,000 to $149,999 | 4 | 10.8% |
| $150,000 to $199,999 | 3 | 8.1% |
| $200,000+ | 2 | 5.4% |
Family Income by Famaliy Size in Delaware
2-person families (22 | 59.5%) account for the highest median family income in Delaware with $68,000 per family, while 2-person families (22 | 59.5%) have the highest median income of $34,000 per family member.
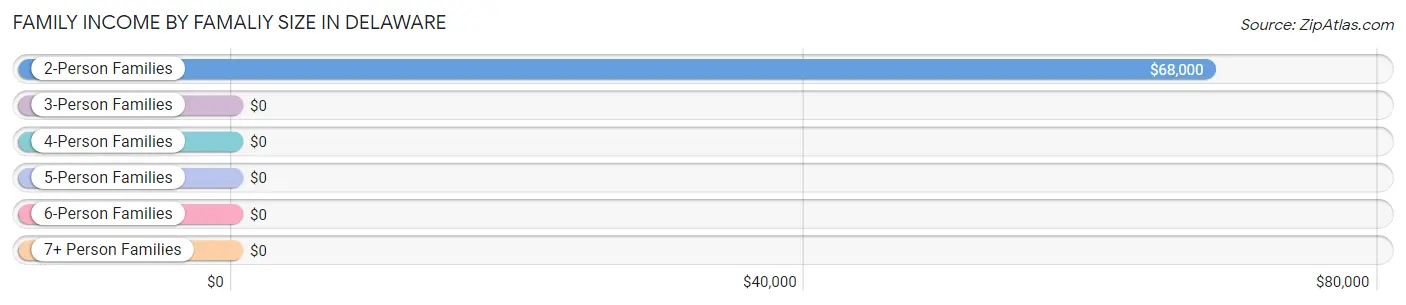
| Income Bracket | # Families | Median Income |
| 2-Person Families | 22 (59.5%) | $68,000 |
| 3-Person Families | 4 (10.8%) | $0 |
| 4-Person Families | 8 (21.6%) | $0 |
| 5-Person Families | 3 (8.1%) | $0 |
| 6-Person Families | 0 (0.0%) | $0 |
| 7+ Person Families | 0 (0.0%) | $0 |
| Total | 37 (100.0%) | $68,250 |
Family Income by Number of Earners in Delaware
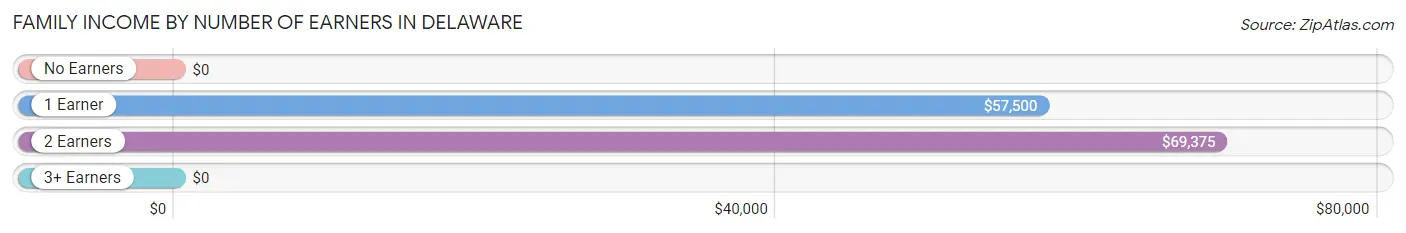
| Number of Earners | # Families | Median Income |
| No Earners | 4 (10.8%) | $0 |
| 1 Earner | 10 (27.0%) | $57,500 |
| 2 Earners | 21 (56.8%) | $69,375 |
| 3+ Earners | 2 (5.4%) | $0 |
| Total | 37 (100.0%) | $68,250 |
Household Income in Delaware
Household Income Brackets in Delaware
With 18 households falling in the category, the $75,000 to $99,999 income range is the most frequent in Delaware, accounting for 26.5% of all households.
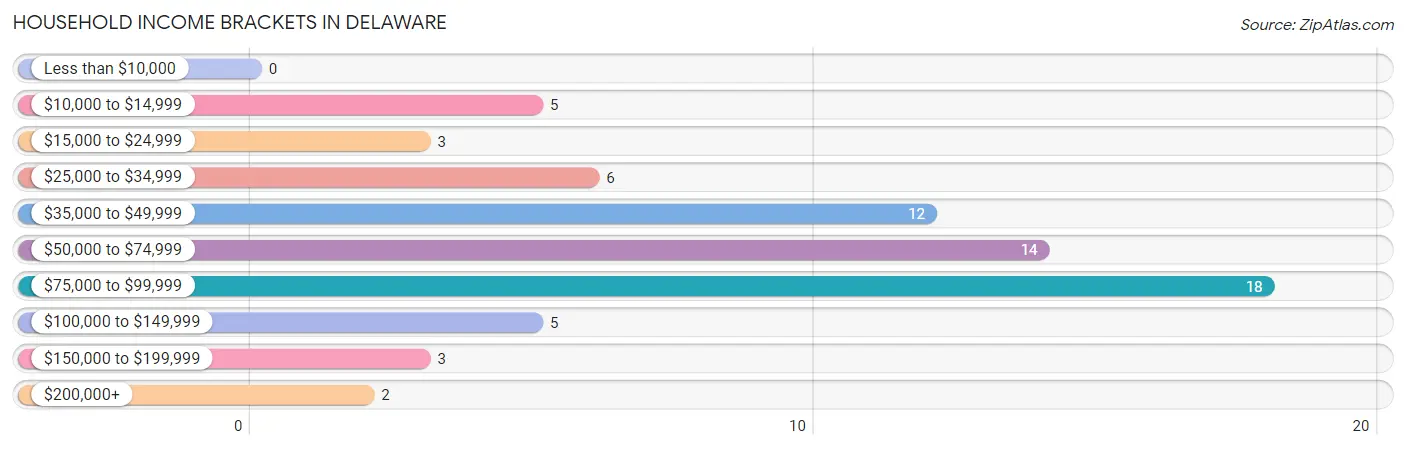
| Income Bracket | # Households | % Households |
| Less than $10,000 | 0 | 0.0% |
| $10,000 to $14,999 | 5 | 7.4% |
| $15,000 to $24,999 | 3 | 4.4% |
| $25,000 to $34,999 | 6 | 8.8% |
| $35,000 to $49,999 | 12 | 17.6% |
| $50,000 to $74,999 | 14 | 20.6% |
| $75,000 to $99,999 | 18 | 26.5% |
| $100,000 to $149,999 | 5 | 7.4% |
| $150,000 to $199,999 | 3 | 4.4% |
| $200,000+ | 2 | 2.9% |
Household Income by Householder Age in Delaware
The median household income in Delaware is $68,125, with the highest median household income of $90,625 found in the 45 to 64 years age bracket for the primary householder. A total of 30 households (44.1%) fall into this category. Meanwhile, the 15 to 24 years age bracket for the primary householder has the lowest median household income of $0, with 7 households (10.3%) in this group.
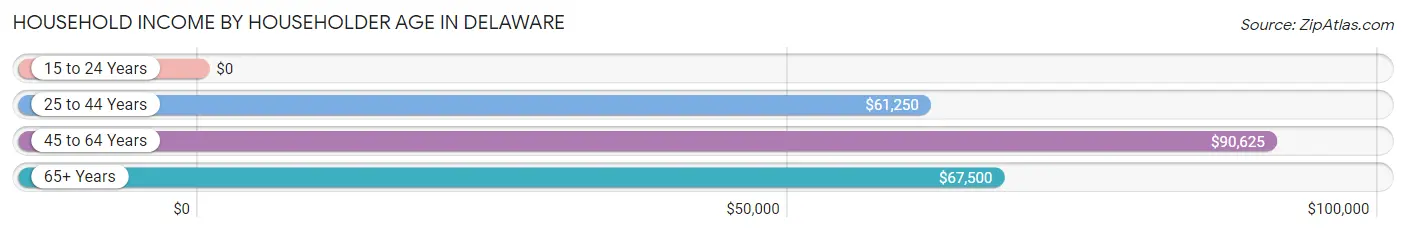
| Income Bracket | # Households | Median Income |
| 15 to 24 Years | 7 (10.3%) | $0 |
| 25 to 44 Years | 9 (13.2%) | $61,250 |
| 45 to 64 Years | 30 (44.1%) | $90,625 |
| 65+ Years | 22 (32.4%) | $67,500 |
| Total | 68 (100.0%) | $68,125 |
Poverty in Delaware
Income Below Poverty by Sex and Age in Delaware
With 17.4% poverty level for males and 15.3% for females among the residents of Delaware, under 5 year old males and 18 to 24 year old females are the most vulnerable to poverty, with 12 males (80.0%) and 11 females (100.0%) in their respective age groups living below the poverty level.
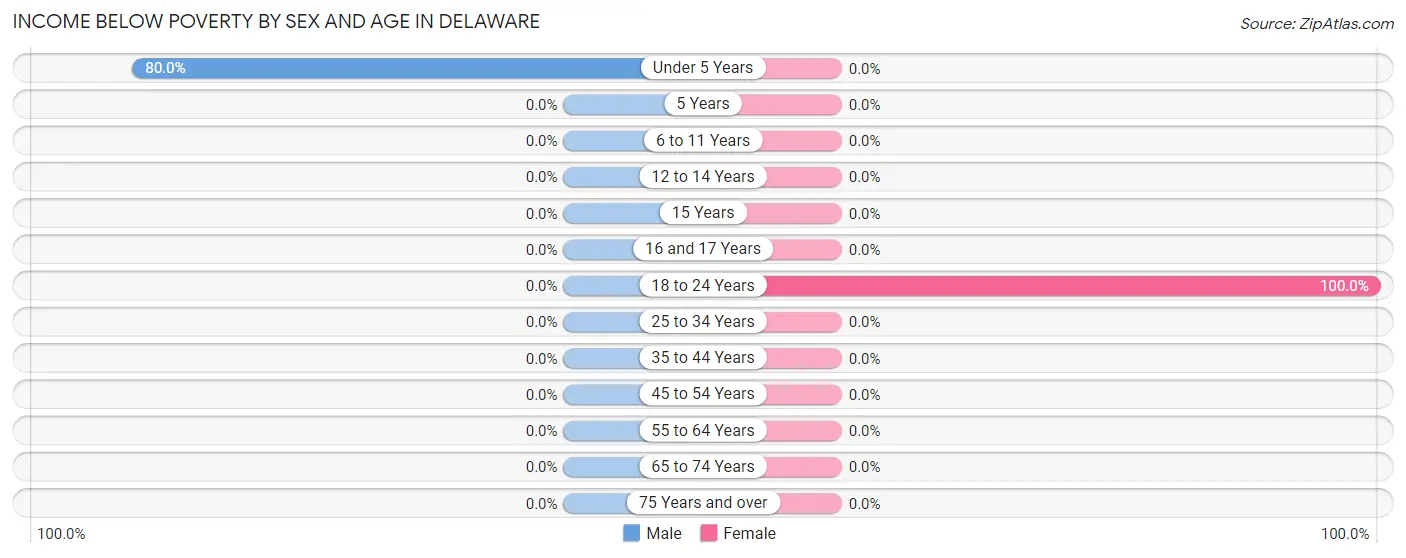
| Age Bracket | Male | Female |
| Under 5 Years | 12 (80.0%) | 0 (0.0%) |
| 5 Years | 0 (0.0%) | 0 (0.0%) |
| 6 to 11 Years | 0 (0.0%) | 0 (0.0%) |
| 12 to 14 Years | 0 (0.0%) | 0 (0.0%) |
| 15 Years | 0 (0.0%) | 0 (0.0%) |
| 16 and 17 Years | 0 (0.0%) | 0 (0.0%) |
| 18 to 24 Years | 0 (0.0%) | 11 (100.0%) |
| 25 to 34 Years | 0 (0.0%) | 0 (0.0%) |
| 35 to 44 Years | 0 (0.0%) | 0 (0.0%) |
| 45 to 54 Years | 0 (0.0%) | 0 (0.0%) |
| 55 to 64 Years | 0 (0.0%) | 0 (0.0%) |
| 65 to 74 Years | 0 (0.0%) | 0 (0.0%) |
| 75 Years and over | 0 (0.0%) | 0 (0.0%) |
| Total | 12 (17.4%) | 11 (15.3%) |
Income Above Poverty by Sex and Age in Delaware
According to the poverty statistics in Delaware, males aged 6 to 11 years and females aged under 5 years are the age groups that are most secure financially, with 100.0% of males and 100.0% of females in these age groups living above the poverty line.
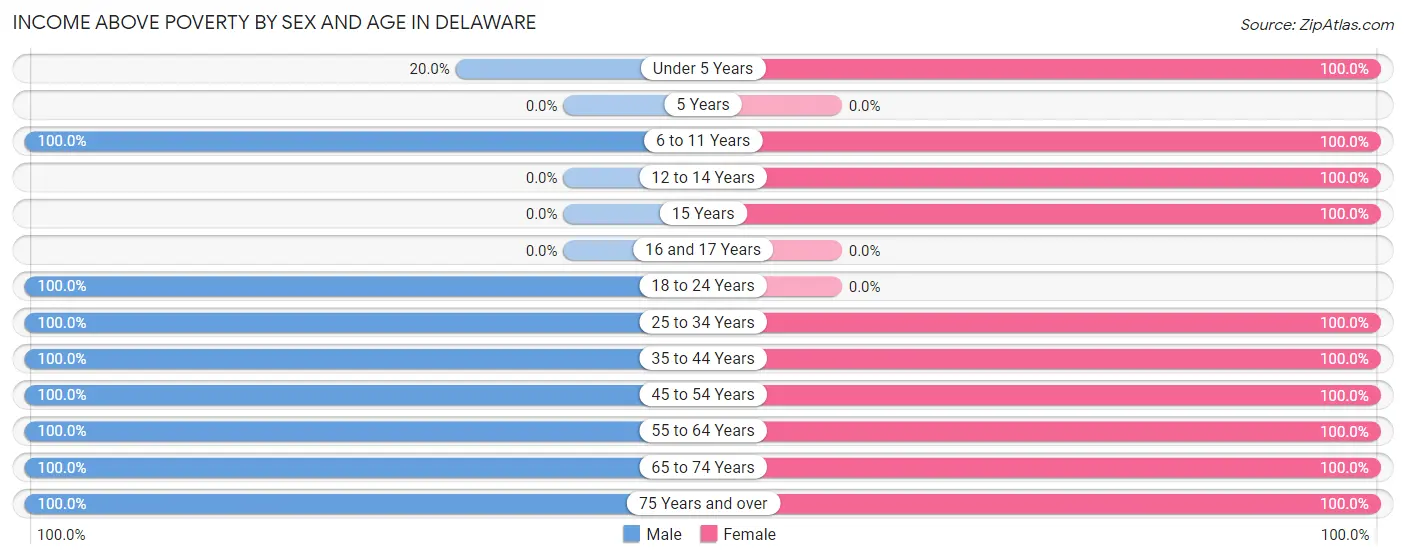
| Age Bracket | Male | Female |
| Under 5 Years | 3 (20.0%) | 1 (100.0%) |
| 5 Years | 0 (0.0%) | 0 (0.0%) |
| 6 to 11 Years | 1 (100.0%) | 3 (100.0%) |
| 12 to 14 Years | 0 (0.0%) | 2 (100.0%) |
| 15 Years | 0 (0.0%) | 2 (100.0%) |
| 16 and 17 Years | 0 (0.0%) | 0 (0.0%) |
| 18 to 24 Years | 2 (100.0%) | 0 (0.0%) |
| 25 to 34 Years | 5 (100.0%) | 3 (100.0%) |
| 35 to 44 Years | 4 (100.0%) | 4 (100.0%) |
| 45 to 54 Years | 11 (100.0%) | 7 (100.0%) |
| 55 to 64 Years | 15 (100.0%) | 23 (100.0%) |
| 65 to 74 Years | 11 (100.0%) | 12 (100.0%) |
| 75 Years and over | 5 (100.0%) | 4 (100.0%) |
| Total | 57 (82.6%) | 61 (84.7%) |
Income Below Poverty Among Married-Couple Families in Delaware
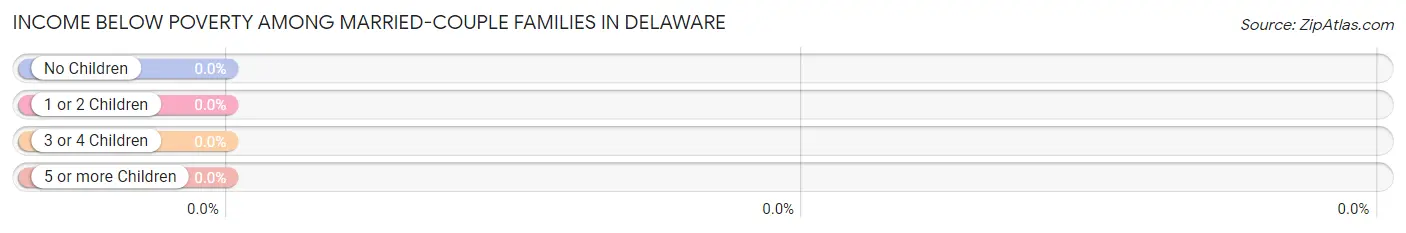
| Children | Above Poverty | Below Poverty |
| No Children | 27 (100.0%) | 0 (0.0%) |
| 1 or 2 Children | 1 (100.0%) | 0 (0.0%) |
| 3 or 4 Children | 3 (100.0%) | 0 (0.0%) |
| 5 or more Children | 0 (0.0%) | 0 (0.0%) |
| Total | 31 (100.0%) | 0 (0.0%) |
Income Below Poverty Among Single-Parent Households in Delaware
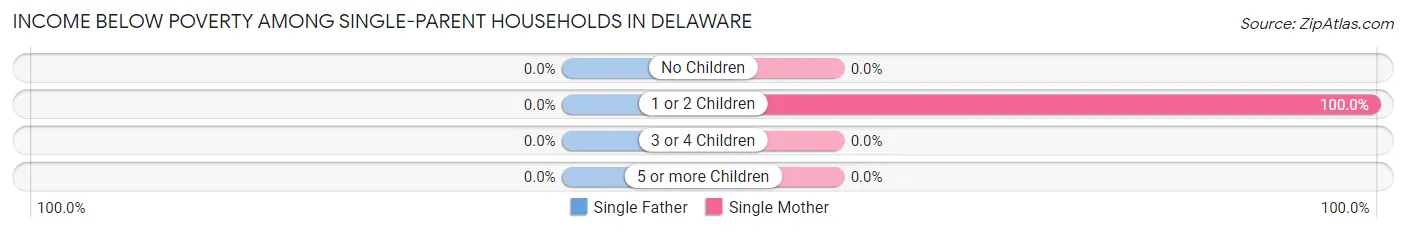
| Children | Single Father | Single Mother |
| No Children | 0 (0.0%) | 0 (0.0%) |
| 1 or 2 Children | 0 (0.0%) | 5 (100.0%) |
| 3 or 4 Children | 0 (0.0%) | 0 (0.0%) |
| 5 or more Children | 0 (0.0%) | 0 (0.0%) |
| Total | 0 (0.0%) | 5 (100.0%) |
Income Below Poverty Among Married-Couple vs Single-Parent Households in Delaware
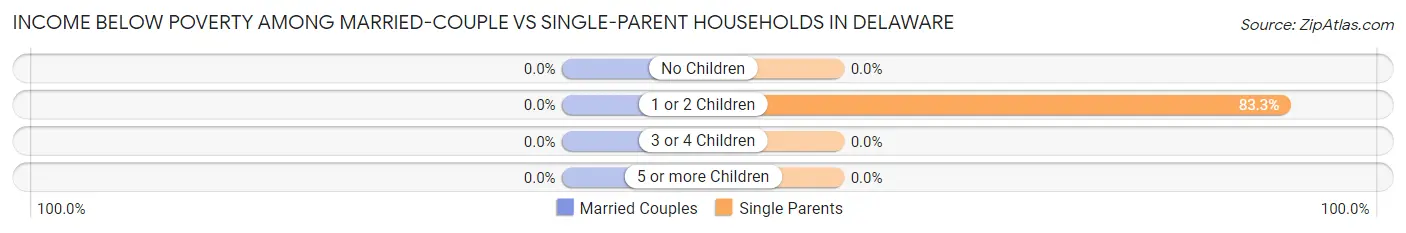
| Children | Married-Couple Families | Single-Parent Households |
| No Children | 0 (0.0%) | 0 (0.0%) |
| 1 or 2 Children | 0 (0.0%) | 5 (83.3%) |
| 3 or 4 Children | 0 (0.0%) | 0 (0.0%) |
| 5 or more Children | 0 (0.0%) | 0 (0.0%) |
| Total | 0 (0.0%) | 5 (83.3%) |
Race in Delaware
The most populous races in Delaware are White / Caucasian (132 | 93.6%), Two or more Races (9 | 6.4%), and Hispanic or Latino (6 | 4.3%).
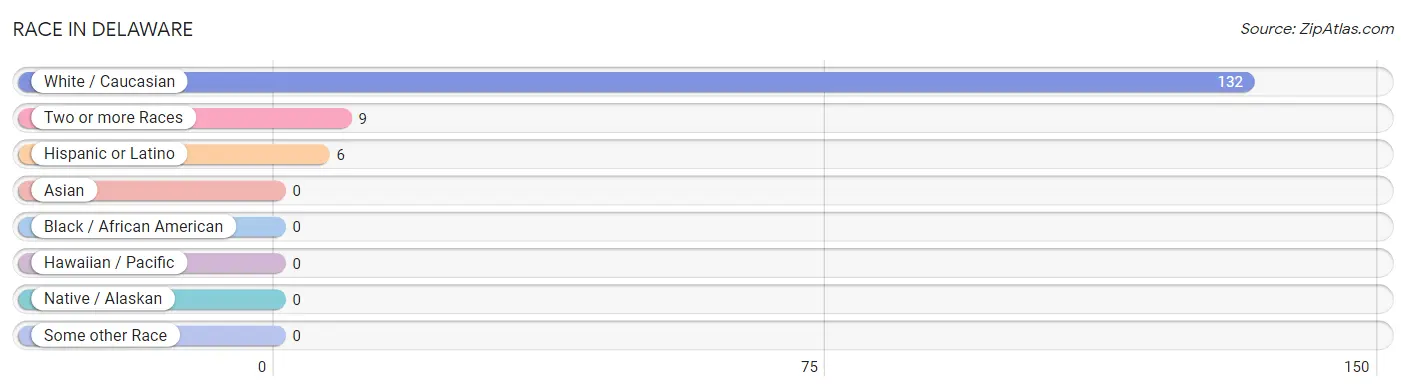
| Race | # Population | % Population |
| Asian | 0 | 0.0% |
| Black / African American | 0 | 0.0% |
| Hawaiian / Pacific | 0 | 0.0% |
| Hispanic or Latino | 6 | 4.3% |
| Native / Alaskan | 0 | 0.0% |
| White / Caucasian | 132 | 93.6% |
| Two or more Races | 9 | 6.4% |
| Some other Race | 0 | 0.0% |
| Total | 141 | 100.0% |
Ancestry in Delaware
The most populous ancestries reported in Delaware are German (46 | 32.6%), English (21 | 14.9%), American (10 | 7.1%), Irish (9 | 6.4%), and Spaniard (6 | 4.3%), together accounting for 65.2% of all Delaware residents.
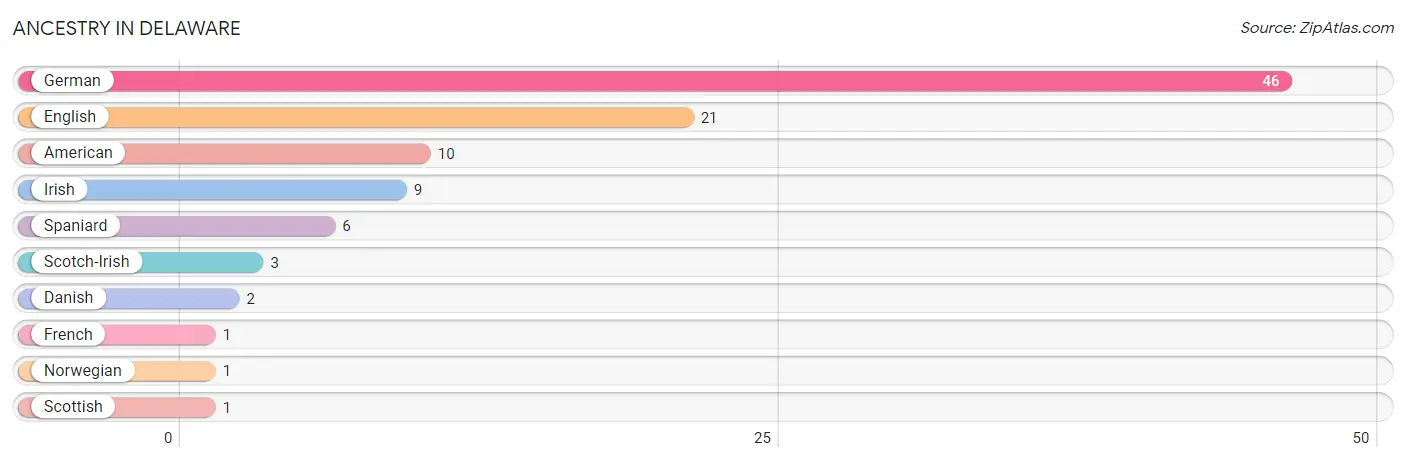
| Ancestry | # Population | % Population |
| American | 10 | 7.1% |
| Danish | 2 | 1.4% |
| English | 21 | 14.9% |
| French | 1 | 0.7% |
| German | 46 | 32.6% |
| Irish | 9 | 6.4% |
| Norwegian | 1 | 0.7% |
| Scotch-Irish | 3 | 2.1% |
| Scottish | 1 | 0.7% |
| Spaniard | 6 | 4.3% | View All 10 Rows |
Immigrants in Delaware

| Immigration Origin | # Population | % Population | View All 0 Rows |
Sex and Age in Delaware
Sex and Age in Delaware
The most populous age groups in Delaware are Under 5 Years (15 | 21.7%) for men and 55 to 59 Years (21 | 29.2%) for women.
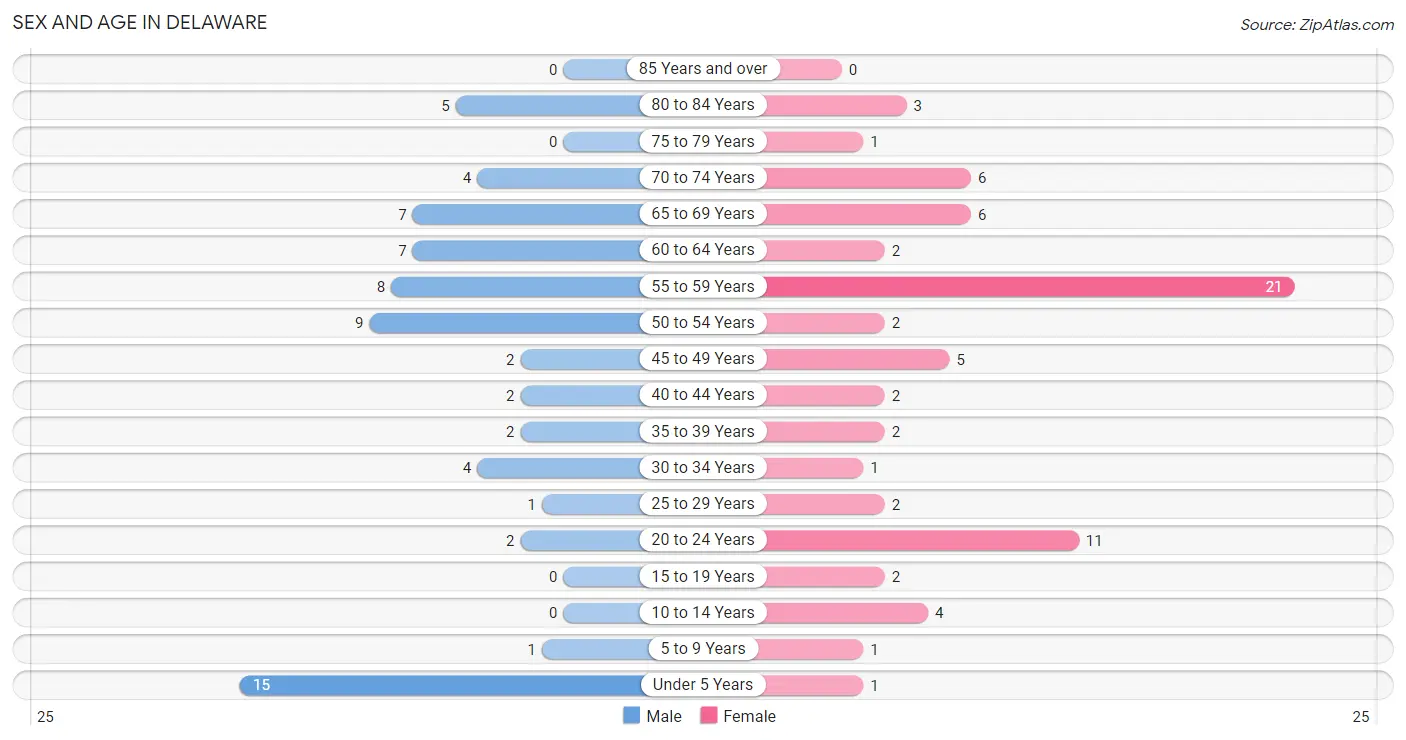
| Age Bracket | Male | Female |
| Under 5 Years | 15 (21.7%) | 1 (1.4%) |
| 5 to 9 Years | 1 (1.5%) | 1 (1.4%) |
| 10 to 14 Years | 0 (0.0%) | 4 (5.6%) |
| 15 to 19 Years | 0 (0.0%) | 2 (2.8%) |
| 20 to 24 Years | 2 (2.9%) | 11 (15.3%) |
| 25 to 29 Years | 1 (1.5%) | 2 (2.8%) |
| 30 to 34 Years | 4 (5.8%) | 1 (1.4%) |
| 35 to 39 Years | 2 (2.9%) | 2 (2.8%) |
| 40 to 44 Years | 2 (2.9%) | 2 (2.8%) |
| 45 to 49 Years | 2 (2.9%) | 5 (6.9%) |
| 50 to 54 Years | 9 (13.0%) | 2 (2.8%) |
| 55 to 59 Years | 8 (11.6%) | 21 (29.2%) |
| 60 to 64 Years | 7 (10.1%) | 2 (2.8%) |
| 65 to 69 Years | 7 (10.1%) | 6 (8.3%) |
| 70 to 74 Years | 4 (5.8%) | 6 (8.3%) |
| 75 to 79 Years | 0 (0.0%) | 1 (1.4%) |
| 80 to 84 Years | 5 (7.2%) | 3 (4.2%) |
| 85 Years and over | 0 (0.0%) | 0 (0.0%) |
| Total | 69 (100.0%) | 72 (100.0%) |
Families and Households in Delaware
Median Family Size in Delaware
The median family size in Delaware is 2.81 persons per family, with single female/mother families (5 | 13.5%) accounting for the largest median family size of 4.6 persons per family. On the other hand, single male/father families (1 | 2.7%) represent the smallest median family size with 2.00 persons per family.
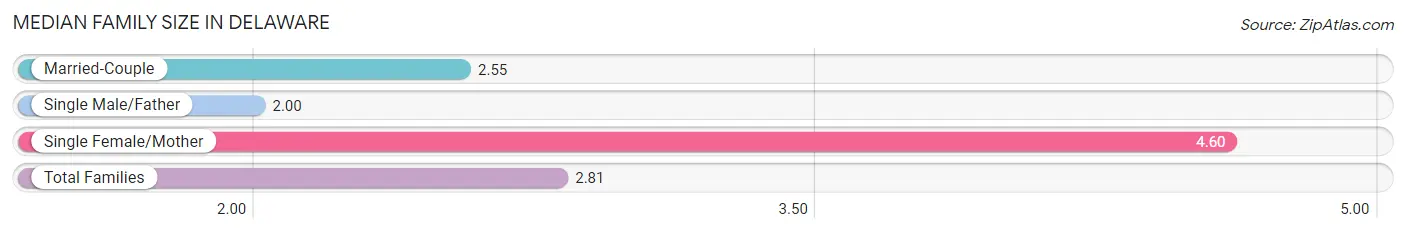
| Family Type | # Families | Family Size |
| Married-Couple | 31 (83.8%) | 2.55 |
| Single Male/Father | 1 (2.7%) | 2.00 |
| Single Female/Mother | 5 (13.5%) | 4.60 |
| Total Families | 37 (100.0%) | 2.81 |
Median Household Size in Delaware
The median household size in Delaware is 2.07 persons per household, with single female/mother households (5 | 7.3%) accounting for the largest median household size of 4.6 persons per household. non-family households (31 | 45.6%) represent the smallest median household size with 1.19 persons per household.
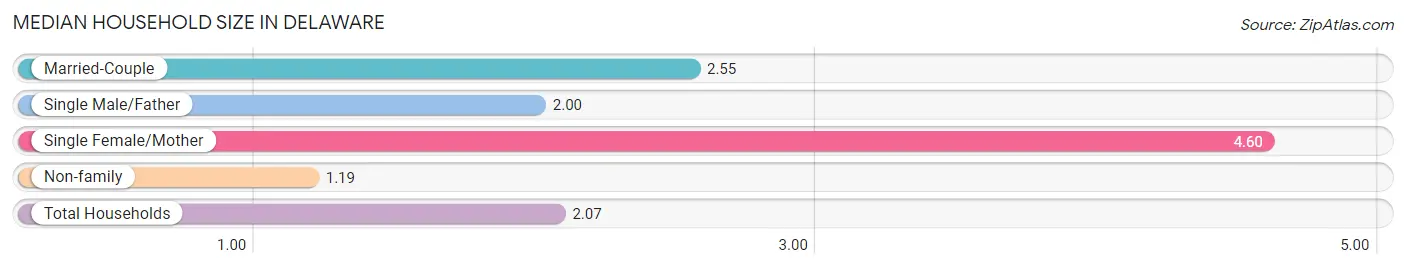
| Household Type | # Households | Household Size |
| Married-Couple | 31 (45.6%) | 2.55 |
| Single Male/Father | 1 (1.5%) | 2.00 |
| Single Female/Mother | 5 (7.3%) | 4.60 |
| Non-family | 31 (45.6%) | 1.19 |
| Total Households | 68 (100.0%) | 2.07 |
Household Size by Marriage Status in Delaware
Out of a total of 68 households in Delaware, 37 (54.4%) are family households, while 31 (45.6%) are nonfamily households. The most numerous type of family households are 2-person households, comprising 22, and the most common type of nonfamily households are 1-person households, comprising 21.
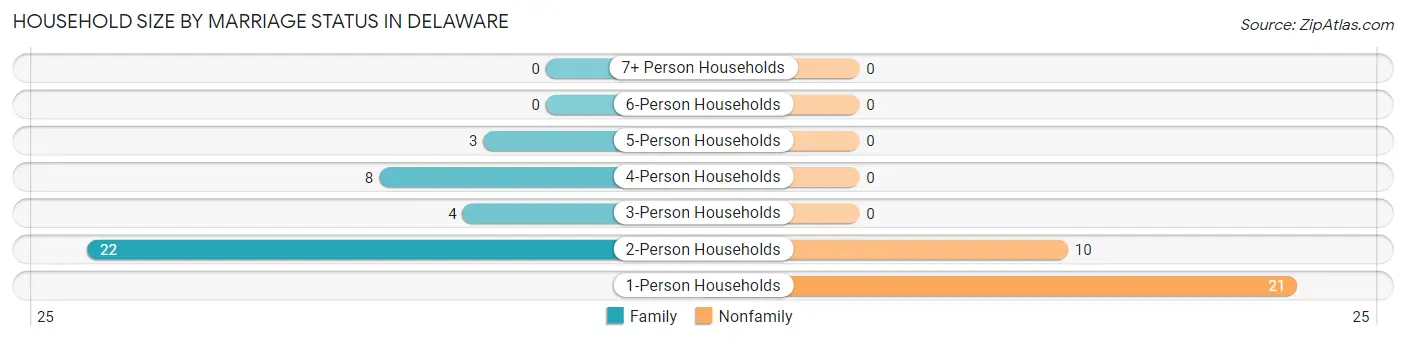
| Household Size | Family Households | Nonfamily Households |
| 1-Person Households | - | 21 (30.9%) |
| 2-Person Households | 22 (32.4%) | 10 (14.7%) |
| 3-Person Households | 4 (5.9%) | 0 (0.0%) |
| 4-Person Households | 8 (11.8%) | 0 (0.0%) |
| 5-Person Households | 3 (4.4%) | 0 (0.0%) |
| 6-Person Households | 0 (0.0%) | 0 (0.0%) |
| 7+ Person Households | 0 (0.0%) | 0 (0.0%) |
| Total | 37 (54.4%) | 31 (45.6%) |
Female Fertility in Delaware
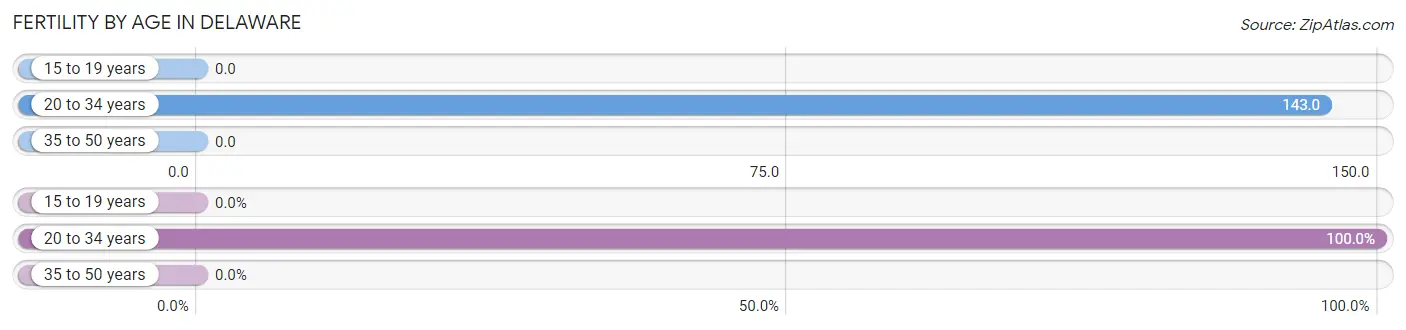
Fertility by Age in Delaware
Average fertility rate in Delaware is 80.0 births per 1,000 women. Women in the age bracket of 20 to 34 years have the highest fertility rate with 143.0 births per 1,000 women. Women in the age bracket of 20 to 34 years acount for 100.0% of all women with births.
| Age Bracket | Women with Births | Births / 1,000 Women |
| 15 to 19 years | 0 (0.0%) | 0.0 |
| 20 to 34 years | 2 (100.0%) | 143.0 |
| 35 to 50 years | 0 (0.0%) | 0.0 |
| Total | 2 (100.0%) | 80.0 |
Fertility by Age by Marriage Status in Delaware
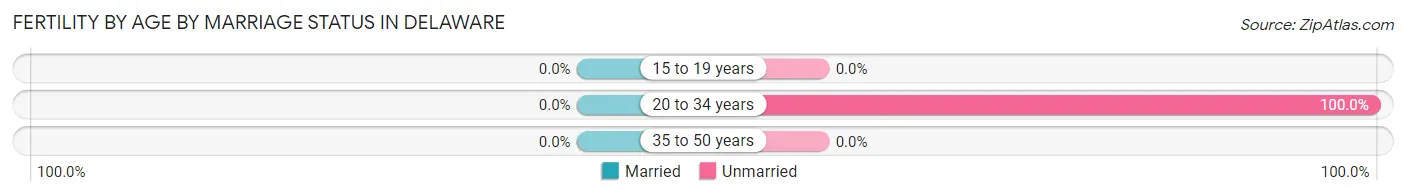
| Age Bracket | Married | Unmarried |
| 15 to 19 years | 0 (0.0%) | 0 (0.0%) |
| 20 to 34 years | 0 (0.0%) | 2 (100.0%) |
| 35 to 50 years | 0 (0.0%) | 0 (0.0%) |
| Total | 0 (0.0%) | 2 (100.0%) |
Fertility by Education in Delaware
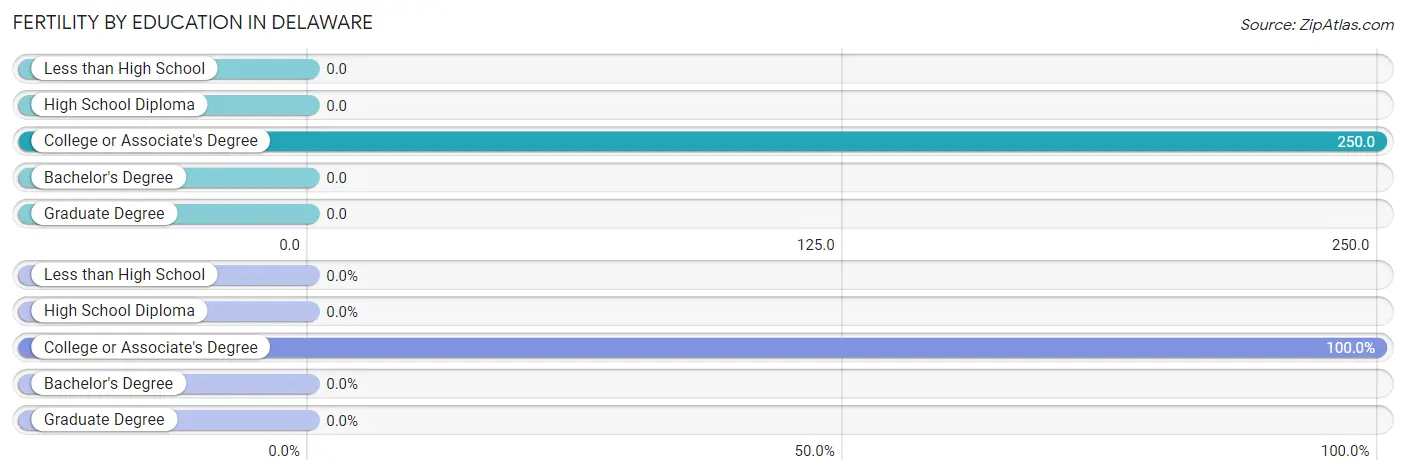
| Educational Attainment | Women with Births | Births / 1,000 Women |
| Less than High School | 0 (0.0%) | 0.0 |
| High School Diploma | 0 (0.0%) | 0.0 |
| College or Associate's Degree | 2 (100.0%) | 250.0 |
| Bachelor's Degree | 0 (0.0%) | 0.0 |
| Graduate Degree | 0 (0.0%) | 0.0 |
| Total | 2 (100.0%) | 80.0 |
Fertility by Education by Marriage Status in Delaware
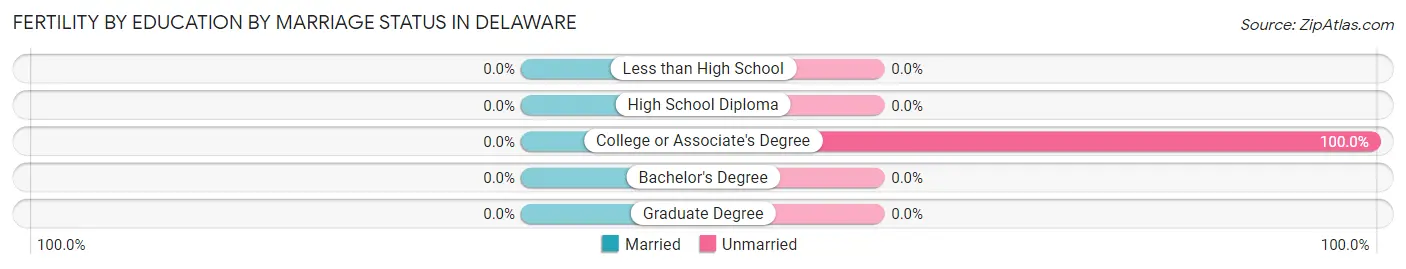
| Educational Attainment | Married | Unmarried |
| Less than High School | 0 (0.0%) | 0 (0.0%) |
| High School Diploma | 0 (0.0%) | 0 (0.0%) |
| College or Associate's Degree | 0 (0.0%) | 2 (100.0%) |
| Bachelor's Degree | 0 (0.0%) | 0 (0.0%) |
| Graduate Degree | 0 (0.0%) | 0 (0.0%) |
| Total | 0 (0.0%) | 2 (100.0%) |
Employment Characteristics in Delaware
Employment by Class of Employer in Delaware
Among the 78 employed individuals in Delaware, private company employees (57 | 73.1%), not-for-profit organizations (8 | 10.3%), and self-employed (incorporated) (3 | 3.8%) make up the most common classes of employment.
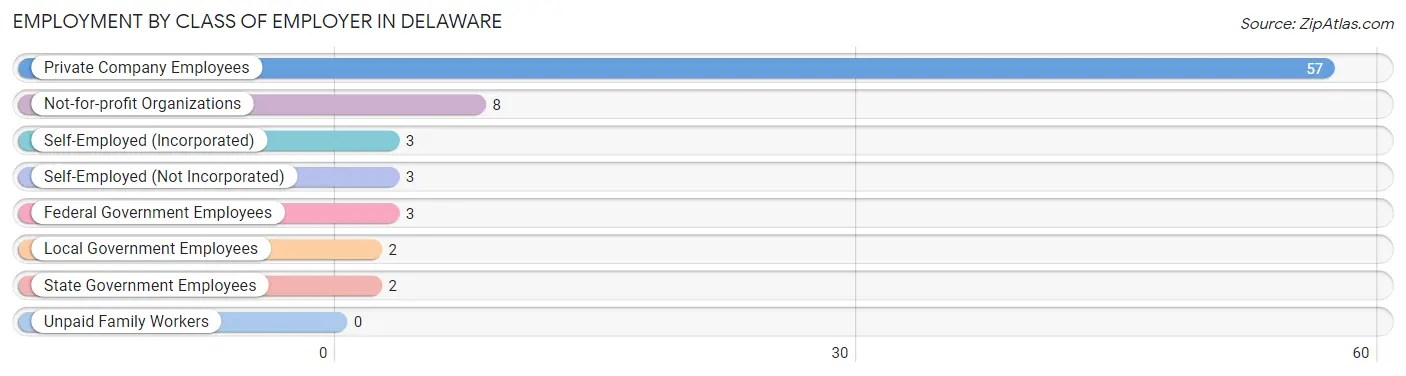
| Employer Class | # Employees | % Employees |
| Private Company Employees | 57 | 73.1% |
| Self-Employed (Incorporated) | 3 | 3.8% |
| Self-Employed (Not Incorporated) | 3 | 3.8% |
| Not-for-profit Organizations | 8 | 10.3% |
| Local Government Employees | 2 | 2.6% |
| State Government Employees | 2 | 2.6% |
| Federal Government Employees | 3 | 3.8% |
| Unpaid Family Workers | 0 | 0.0% |
| Total | 78 | 100.0% |
Employment Status by Age in Delaware
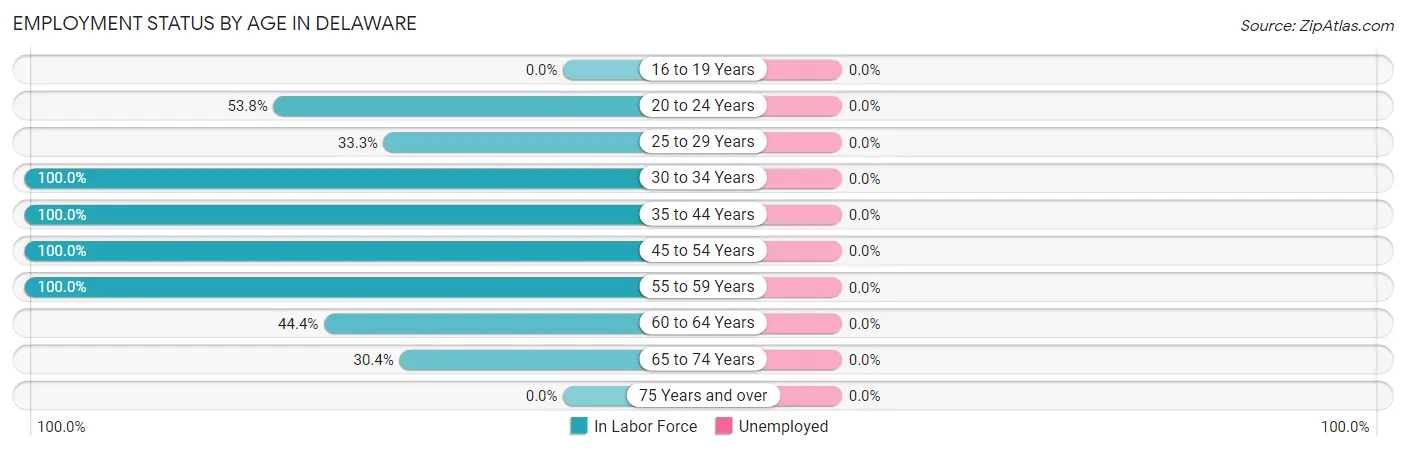
| Age Bracket | In Labor Force | Unemployed |
| 16 to 19 Years | 0 (0.0%) | 0 (0.0%) |
| 20 to 24 Years | 7 (53.8%) | 0 (0.0%) |
| 25 to 29 Years | 1 (33.3%) | 0 (0.0%) |
| 30 to 34 Years | 5 (100.0%) | 0 (0.0%) |
| 35 to 44 Years | 8 (100.0%) | 0 (0.0%) |
| 45 to 54 Years | 18 (100.0%) | 0 (0.0%) |
| 55 to 59 Years | 29 (100.0%) | 0 (0.0%) |
| 60 to 64 Years | 4 (44.4%) | 0 (0.0%) |
| 65 to 74 Years | 7 (30.4%) | 0 (0.0%) |
| 75 Years and over | 0 (0.0%) | 0 (0.0%) |
| Total | 79 (67.5%) | 0 (0.0%) |
Employment Status by Educational Attainment in Delaware
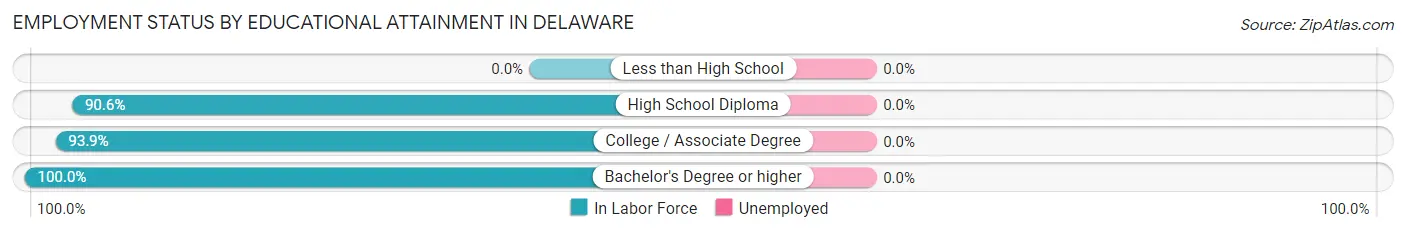
| Educational Attainment | In Labor Force | Unemployed |
| Less than High School | 0 (0.0%) | 0 (0.0%) |
| High School Diploma | 29 (90.6%) | 0 (0.0%) |
| College / Associate Degree | 31 (93.9%) | 0 (0.0%) |
| Bachelor's Degree or higher | 5 (100.0%) | 0 (0.0%) |
| Total | 65 (90.3%) | 0 (0.0%) |
Employment Occupations by Sex in Delaware
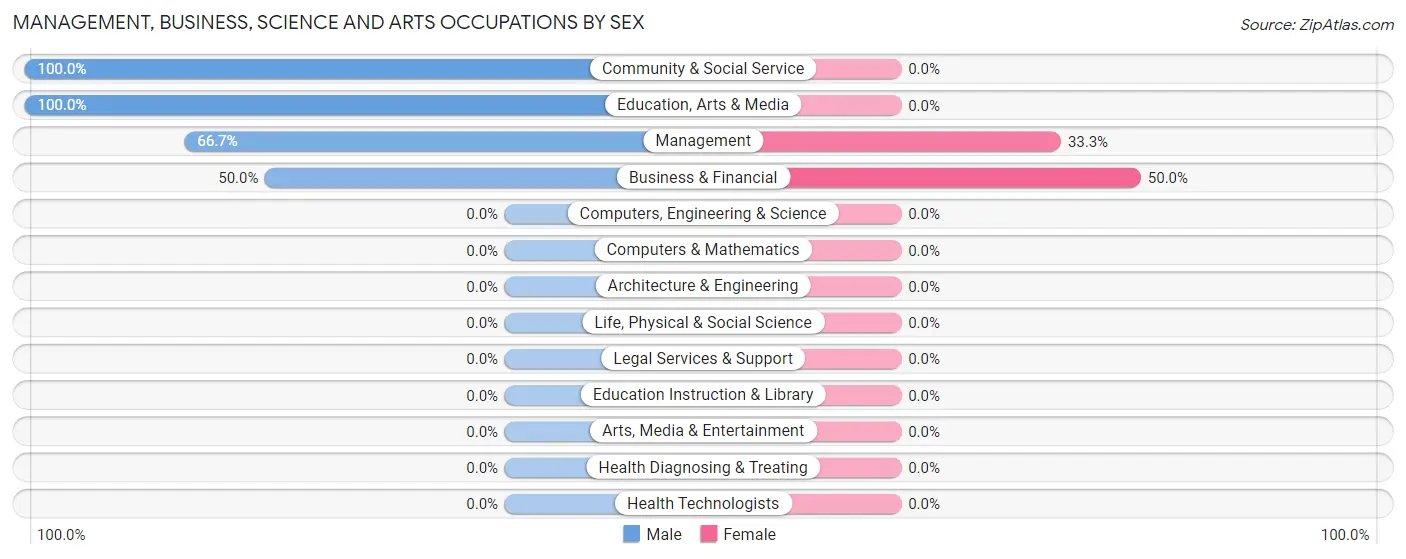
Management, Business, Science and Arts Occupations
The most common Management, Business, Science and Arts occupations in Delaware are Business & Financial (4 | 5.1%), Management (3 | 3.8%), Community & Social Service (3 | 3.8%), and Education, Arts & Media (3 | 3.8%).
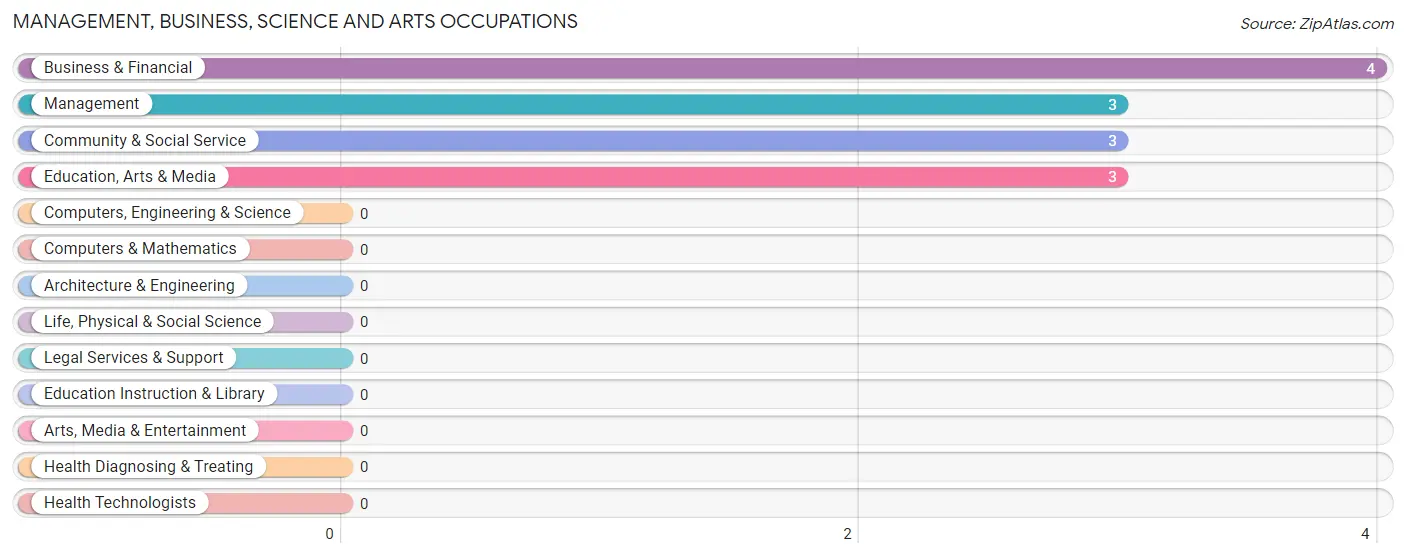
Management, Business, Science and Arts Occupations by Sex
Within the Management, Business, Science and Arts occupations in Delaware, the most male-oriented occupations are Community & Social Service (100.0%), Education, Arts & Media (100.0%), and Management (66.7%), while the most female-oriented occupations are Business & Financial (50.0%), and Management (33.3%).
| Occupation | Male | Female |
| Management | 2 (66.7%) | 1 (33.3%) |
| Business & Financial | 2 (50.0%) | 2 (50.0%) |
| Computers, Engineering & Science | 0 (0.0%) | 0 (0.0%) |
| Computers & Mathematics | 0 (0.0%) | 0 (0.0%) |
| Architecture & Engineering | 0 (0.0%) | 0 (0.0%) |
| Life, Physical & Social Science | 0 (0.0%) | 0 (0.0%) |
| Community & Social Service | 3 (100.0%) | 0 (0.0%) |
| Education, Arts & Media | 3 (100.0%) | 0 (0.0%) |
| Legal Services & Support | 0 (0.0%) | 0 (0.0%) |
| Education Instruction & Library | 0 (0.0%) | 0 (0.0%) |
| Arts, Media & Entertainment | 0 (0.0%) | 0 (0.0%) |
| Health Diagnosing & Treating | 0 (0.0%) | 0 (0.0%) |
| Health Technologists | 0 (0.0%) | 0 (0.0%) |
| Total (Category) | 7 (70.0%) | 3 (30.0%) |
| Total (Overall) | 41 (51.9%) | 38 (48.1%) |
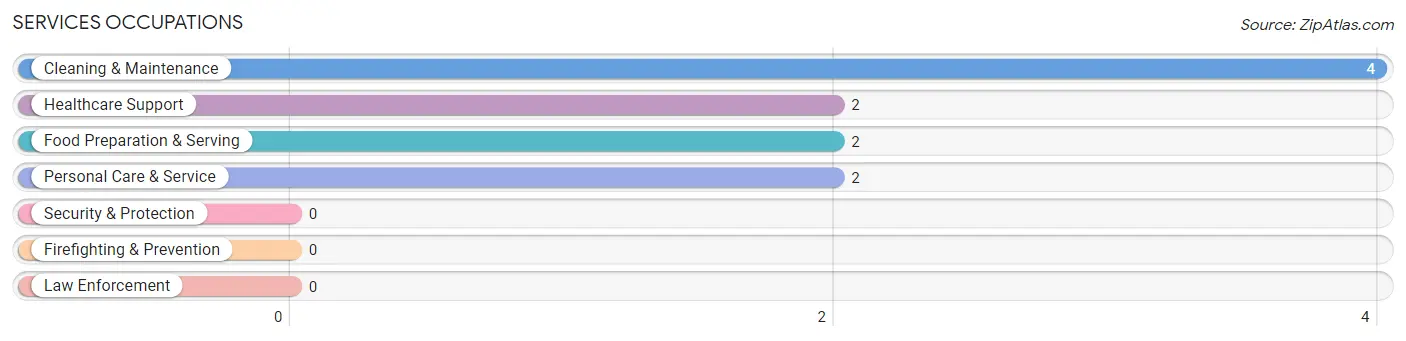
Services Occupations
The most common Services occupations in Delaware are Cleaning & Maintenance (4 | 5.1%), Healthcare Support (2 | 2.5%), Food Preparation & Serving (2 | 2.5%), and Personal Care & Service (2 | 2.5%).
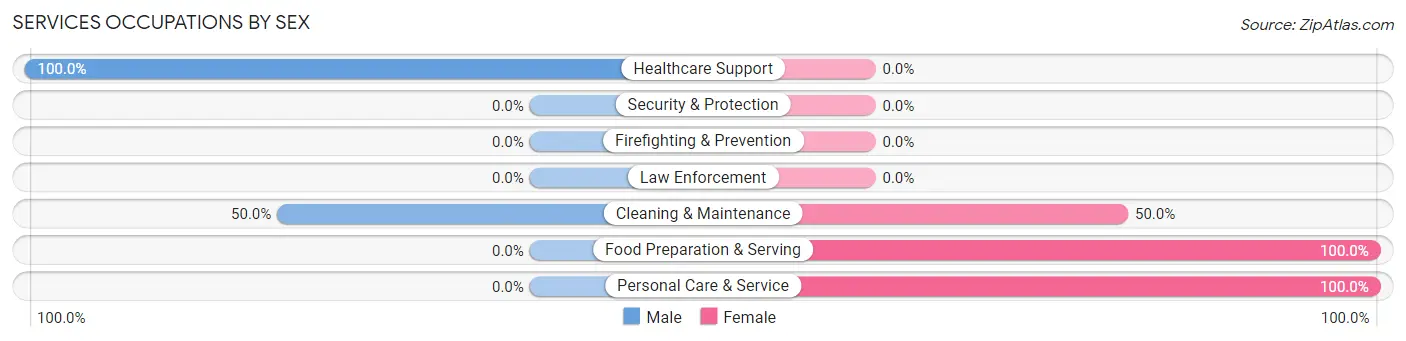
Services Occupations by Sex
Within the Services occupations in Delaware, the most male-oriented occupations are Healthcare Support (100.0%), and Cleaning & Maintenance (50.0%), while the most female-oriented occupations are Food Preparation & Serving (100.0%), Personal Care & Service (100.0%), and Cleaning & Maintenance (50.0%).
| Occupation | Male | Female |
| Healthcare Support | 2 (100.0%) | 0 (0.0%) |
| Security & Protection | 0 (0.0%) | 0 (0.0%) |
| Firefighting & Prevention | 0 (0.0%) | 0 (0.0%) |
| Law Enforcement | 0 (0.0%) | 0 (0.0%) |
| Food Preparation & Serving | 0 (0.0%) | 2 (100.0%) |
| Cleaning & Maintenance | 2 (50.0%) | 2 (50.0%) |
| Personal Care & Service | 0 (0.0%) | 2 (100.0%) |
| Total (Category) | 4 (40.0%) | 6 (60.0%) |
| Total (Overall) | 41 (51.9%) | 38 (48.1%) |
Sales and Office Occupations
The most common Sales and Office occupations in Delaware are Office & Administration (14 | 17.7%), and Sales & Related (11 | 13.9%).

Sales and Office Occupations by Sex

| Occupation | Male | Female |
| Sales & Related | 7 (63.6%) | 4 (36.4%) |
| Office & Administration | 0 (0.0%) | 14 (100.0%) |
| Total (Category) | 7 (28.0%) | 18 (72.0%) |
| Total (Overall) | 41 (51.9%) | 38 (48.1%) |
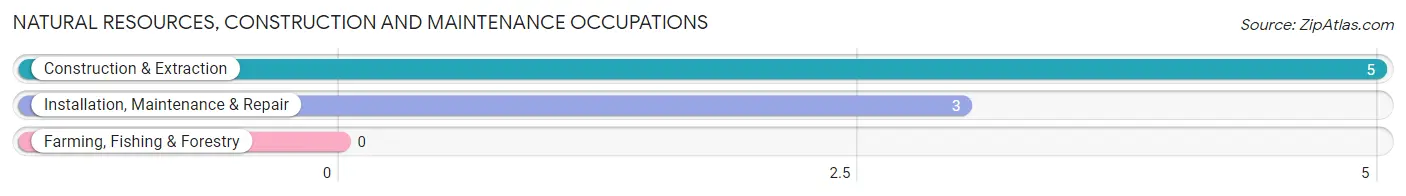
Natural Resources, Construction and Maintenance Occupations
The most common Natural Resources, Construction and Maintenance occupations in Delaware are Construction & Extraction (5 | 6.3%), and Installation, Maintenance & Repair (3 | 3.8%).
Natural Resources, Construction and Maintenance Occupations by Sex

| Occupation | Male | Female |
| Farming, Fishing & Forestry | 0 (0.0%) | 0 (0.0%) |
| Construction & Extraction | 5 (100.0%) | 0 (0.0%) |
| Installation, Maintenance & Repair | 3 (100.0%) | 0 (0.0%) |
| Total (Category) | 8 (100.0%) | 0 (0.0%) |
| Total (Overall) | 41 (51.9%) | 38 (48.1%) |
Production, Transportation and Moving Occupations
The most common Production, Transportation and Moving occupations in Delaware are Production (22 | 27.9%), Transportation (2 | 2.5%), and Material Moving (2 | 2.5%).
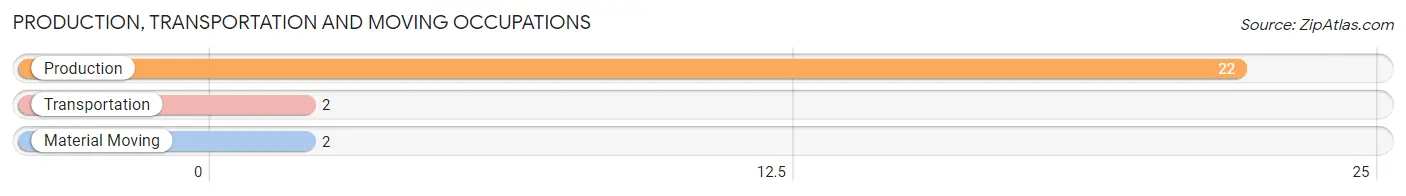
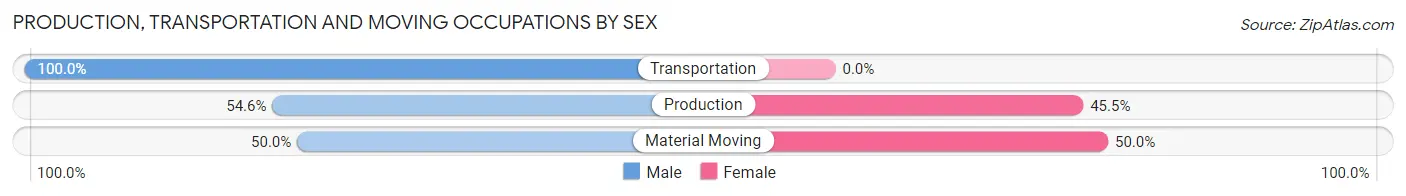
Production, Transportation and Moving Occupations by Sex
| Occupation | Male | Female |
| Production | 12 (54.5%) | 10 (45.5%) |
| Transportation | 2 (100.0%) | 0 (0.0%) |
| Material Moving | 1 (50.0%) | 1 (50.0%) |
| Total (Category) | 15 (57.7%) | 11 (42.3%) |
| Total (Overall) | 41 (51.9%) | 38 (48.1%) |
Employment Industries by Sex in Delaware
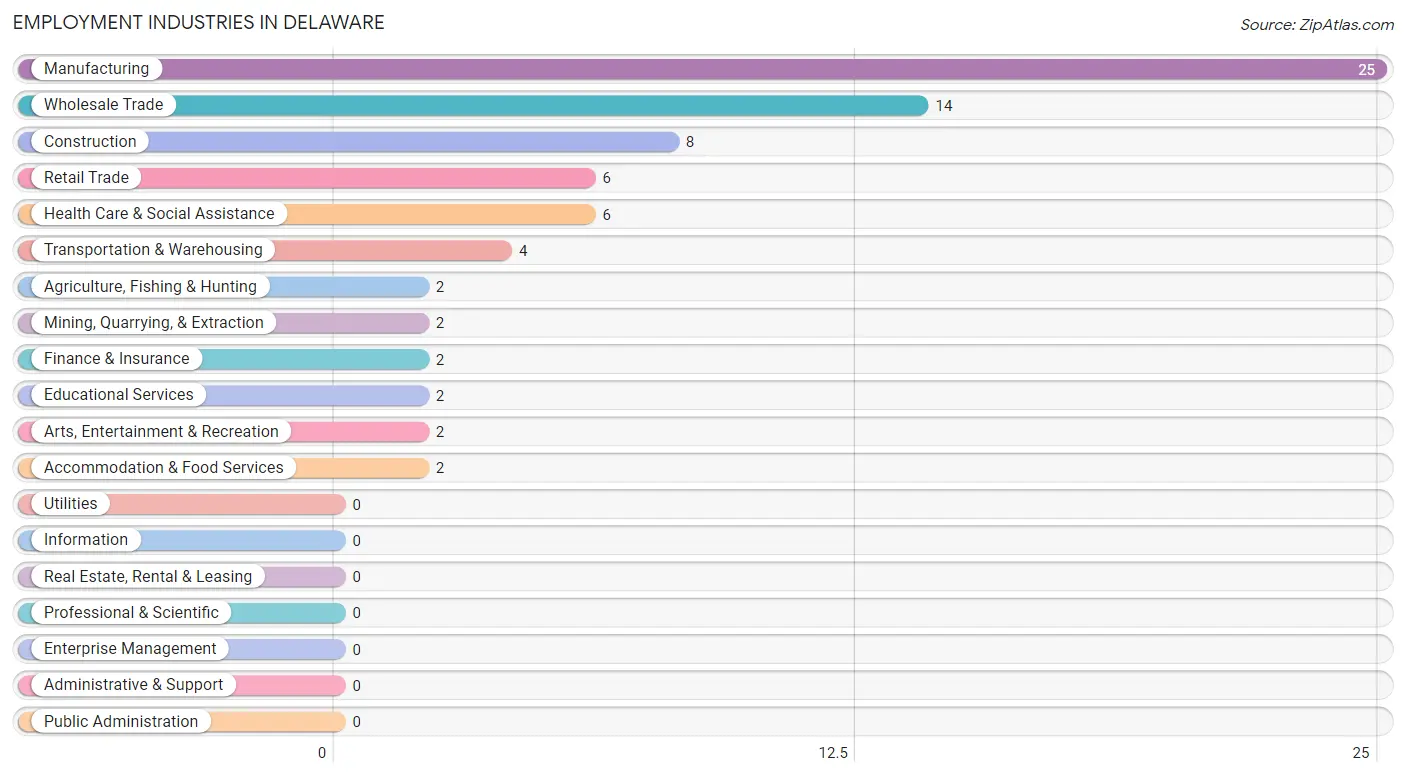
Employment Industries in Delaware
The major employment industries in Delaware include Manufacturing (25 | 31.7%), Wholesale Trade (14 | 17.7%), Construction (8 | 10.1%), Retail Trade (6 | 7.6%), and Health Care & Social Assistance (6 | 7.6%).
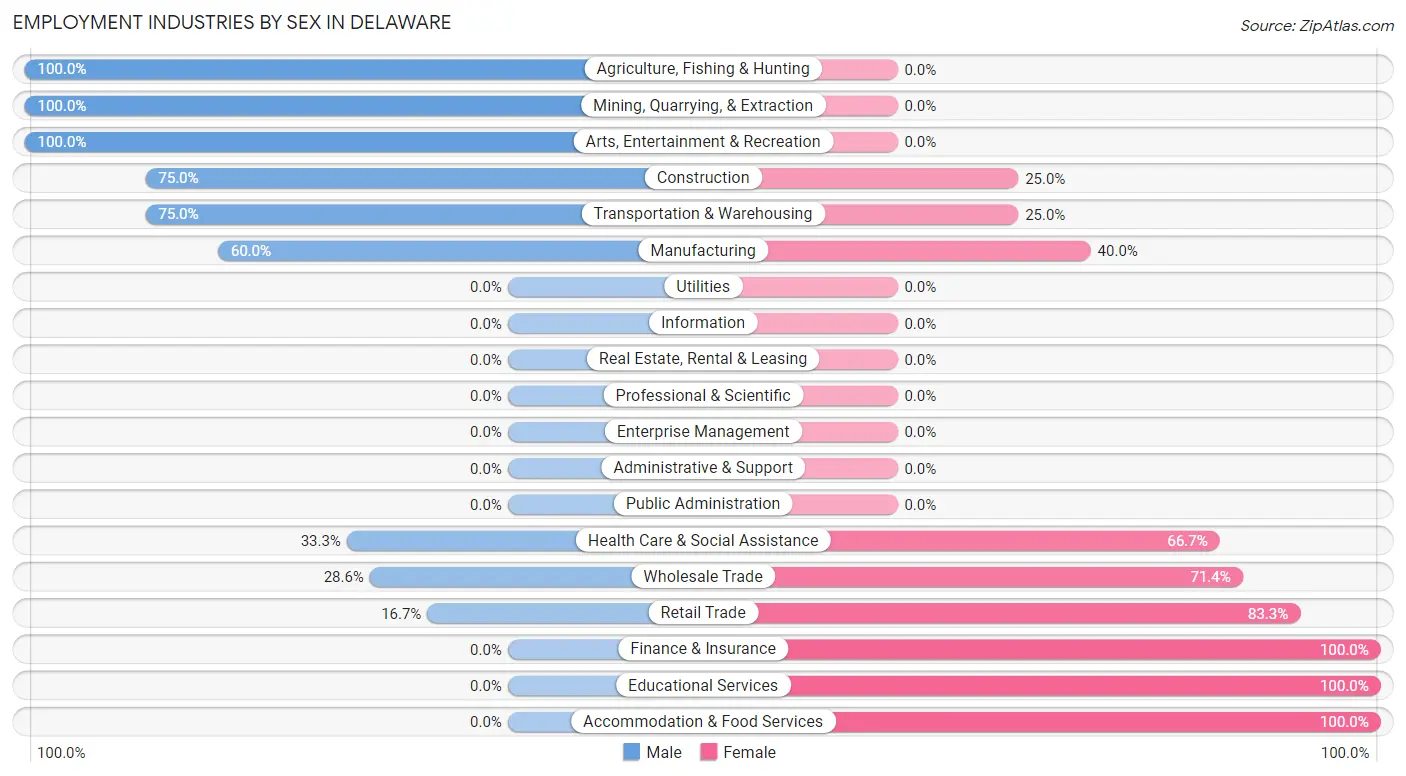
Employment Industries by Sex in Delaware
The Delaware industries that see more men than women are Agriculture, Fishing & Hunting (100.0%), Mining, Quarrying, & Extraction (100.0%), and Arts, Entertainment & Recreation (100.0%), whereas the industries that tend to have a higher number of women are Finance & Insurance (100.0%), Educational Services (100.0%), and Accommodation & Food Services (100.0%).
| Industry | Male | Female |
| Agriculture, Fishing & Hunting | 2 (100.0%) | 0 (0.0%) |
| Mining, Quarrying, & Extraction | 2 (100.0%) | 0 (0.0%) |
| Construction | 6 (75.0%) | 2 (25.0%) |
| Manufacturing | 15 (60.0%) | 10 (40.0%) |
| Wholesale Trade | 4 (28.6%) | 10 (71.4%) |
| Retail Trade | 1 (16.7%) | 5 (83.3%) |
| Transportation & Warehousing | 3 (75.0%) | 1 (25.0%) |
| Utilities | 0 (0.0%) | 0 (0.0%) |
| Information | 0 (0.0%) | 0 (0.0%) |
| Finance & Insurance | 0 (0.0%) | 2 (100.0%) |
| Real Estate, Rental & Leasing | 0 (0.0%) | 0 (0.0%) |
| Professional & Scientific | 0 (0.0%) | 0 (0.0%) |
| Enterprise Management | 0 (0.0%) | 0 (0.0%) |
| Administrative & Support | 0 (0.0%) | 0 (0.0%) |
| Educational Services | 0 (0.0%) | 2 (100.0%) |
| Health Care & Social Assistance | 2 (33.3%) | 4 (66.7%) |
| Arts, Entertainment & Recreation | 2 (100.0%) | 0 (0.0%) |
| Accommodation & Food Services | 0 (0.0%) | 2 (100.0%) |
| Public Administration | 0 (0.0%) | 0 (0.0%) |
| Total | 41 (51.9%) | 38 (48.1%) |
Education in Delaware
School Enrollment in Delaware
The most common levels of schooling among the 10 students in Delaware are middle school (4 | 40.0%), elementary school (2 | 20.0%), and high school (2 | 20.0%).
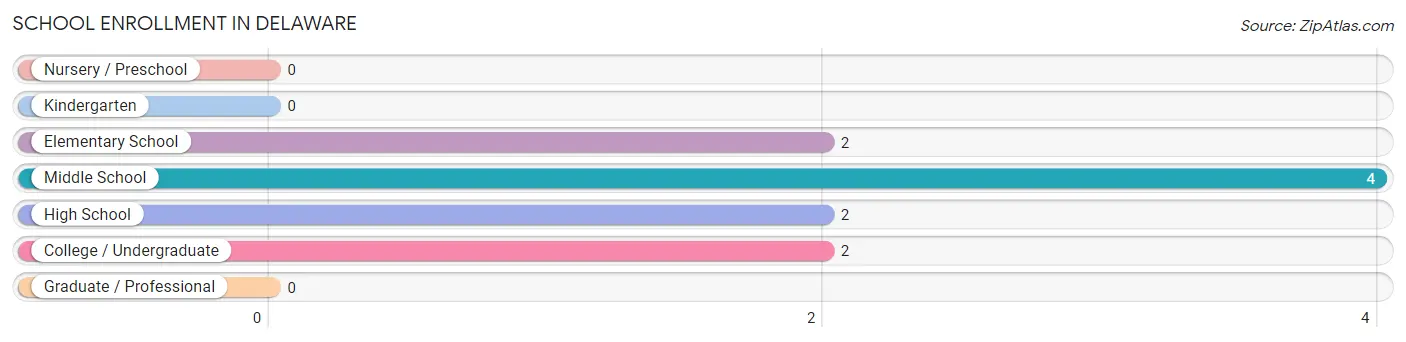
| School Level | # Students | % Students |
| Nursery / Preschool | 0 | 0.0% |
| Kindergarten | 0 | 0.0% |
| Elementary School | 2 | 20.0% |
| Middle School | 4 | 40.0% |
| High School | 2 | 20.0% |
| College / Undergraduate | 2 | 20.0% |
| Graduate / Professional | 0 | 0.0% |
| Total | 10 | 100.0% |
School Enrollment by Age by Funding Source in Delaware
Out of a total of 10 students who are enrolled in schools in Delaware, 2 (20.0%) attend a private institution, while the remaining 8 (80.0%) are enrolled in public schools. The age group of 25 to 34 year olds has the highest likelihood of being enrolled in private schools, with 2 (100.0% in the age bracket) enrolled. Conversely, the age group of 5 to 9 year old has the lowest likelihood of being enrolled in a private school, with 2 (100.0% in the age bracket) attending a public institution.
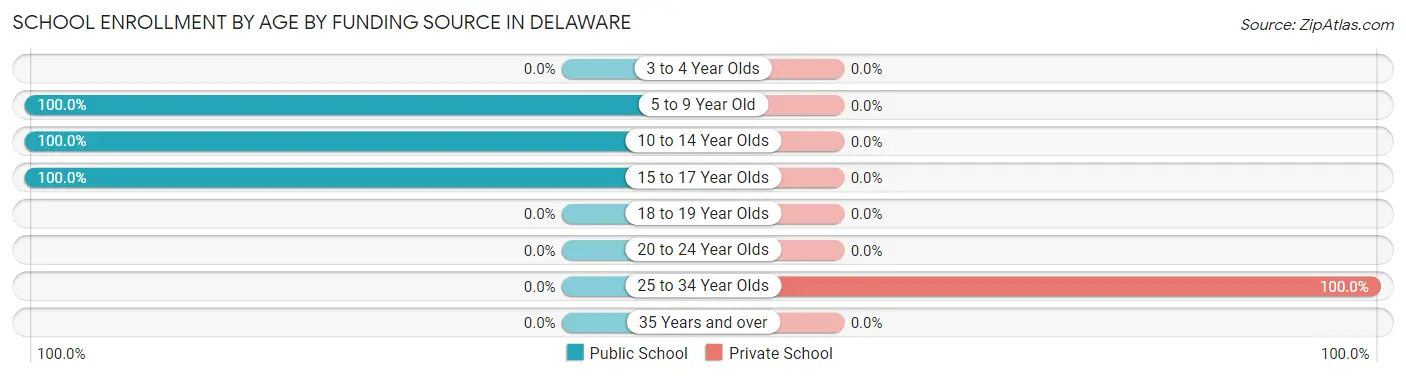
| Age Bracket | Public School | Private School |
| 3 to 4 Year Olds | 0 (0.0%) | 0 (0.0%) |
| 5 to 9 Year Old | 2 (100.0%) | 0 (0.0%) |
| 10 to 14 Year Olds | 4 (100.0%) | 0 (0.0%) |
| 15 to 17 Year Olds | 2 (100.0%) | 0 (0.0%) |
| 18 to 19 Year Olds | 0 (0.0%) | 0 (0.0%) |
| 20 to 24 Year Olds | 0 (0.0%) | 0 (0.0%) |
| 25 to 34 Year Olds | 0 (0.0%) | 2 (100.0%) |
| 35 Years and over | 0 (0.0%) | 0 (0.0%) |
| Total | 8 (80.0%) | 2 (20.0%) |
Educational Attainment by Field of Study in Delaware
Education (3 | 25.0%), business (2 | 16.7%), liberal arts & history (2 | 16.7%), communications (2 | 16.7%), and psychology (1 | 8.3%) are the most common fields of study among 12 individuals in Delaware who have obtained a bachelor's degree or higher.
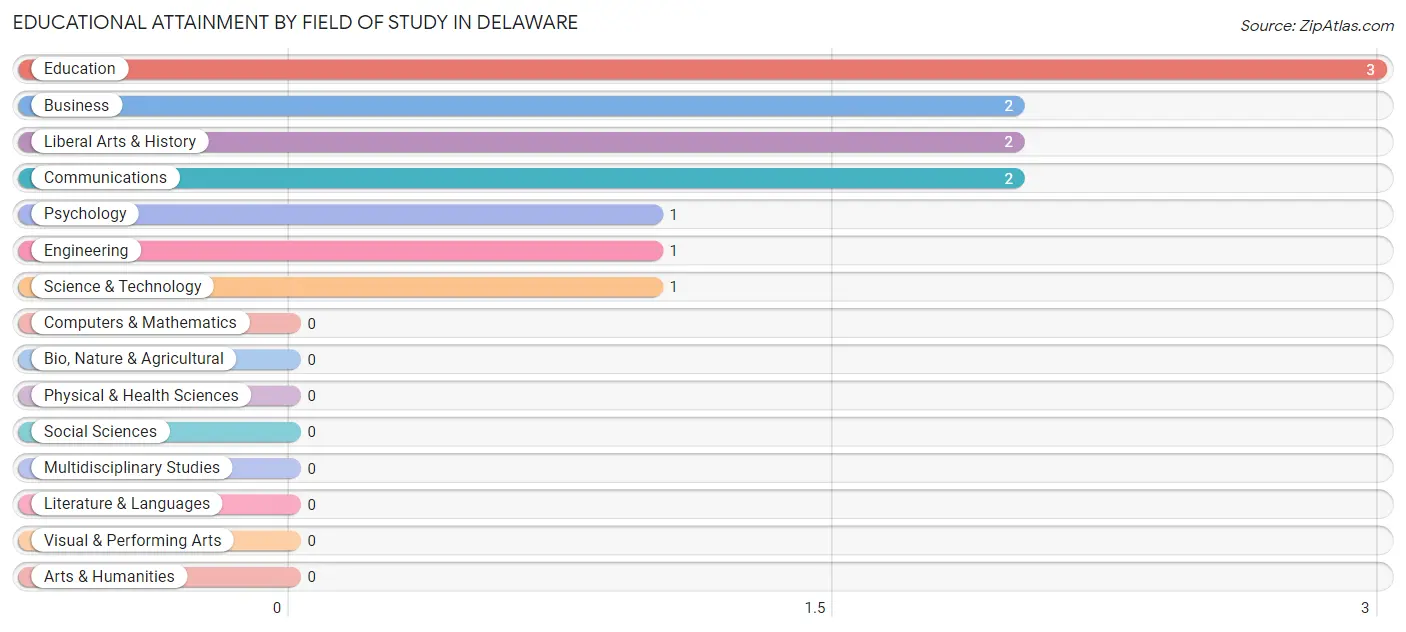
| Field of Study | # Graduates | % Graduates |
| Computers & Mathematics | 0 | 0.0% |
| Bio, Nature & Agricultural | 0 | 0.0% |
| Physical & Health Sciences | 0 | 0.0% |
| Psychology | 1 | 8.3% |
| Social Sciences | 0 | 0.0% |
| Engineering | 1 | 8.3% |
| Multidisciplinary Studies | 0 | 0.0% |
| Science & Technology | 1 | 8.3% |
| Business | 2 | 16.7% |
| Education | 3 | 25.0% |
| Literature & Languages | 0 | 0.0% |
| Liberal Arts & History | 2 | 16.7% |
| Visual & Performing Arts | 0 | 0.0% |
| Communications | 2 | 16.7% |
| Arts & Humanities | 0 | 0.0% |
| Total | 12 | 100.0% |
Transportation & Commute in Delaware
Vehicle Availability by Sex in Delaware
The most prevalent vehicle ownership categories in Delaware are males with 3 vehicles (18, accounting for 45.0%) and females with 3 vehicles (22, making up 47.4%).
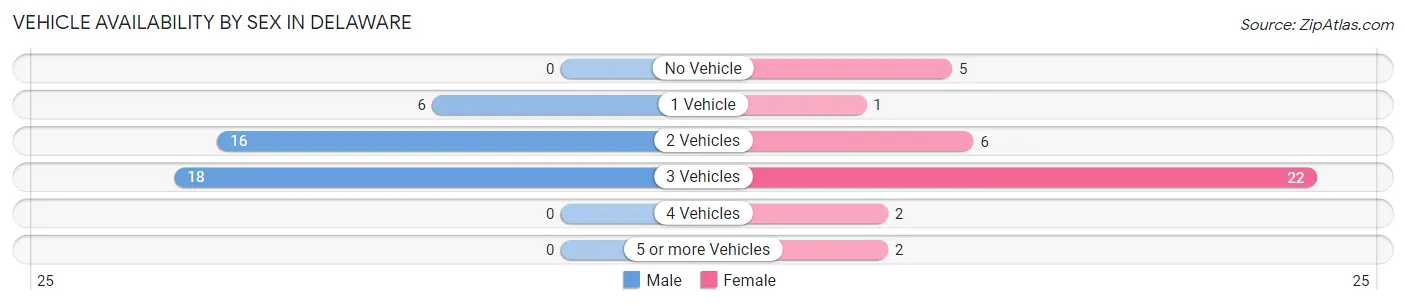
| Vehicles Available | Male | Female |
| No Vehicle | 0 (0.0%) | 5 (13.2%) |
| 1 Vehicle | 6 (15.0%) | 1 (2.6%) |
| 2 Vehicles | 16 (40.0%) | 6 (15.8%) |
| 3 Vehicles | 18 (45.0%) | 22 (57.9%) |
| 4 Vehicles | 0 (0.0%) | 2 (5.3%) |
| 5 or more Vehicles | 0 (0.0%) | 2 (5.3%) |
| Total | 40 (100.0%) | 38 (100.0%) |
Commute Time in Delaware
The most frequently occuring commute durations in Delaware are less than 5 minutes (15 commuters, 19.7%), 15 to 19 minutes (15 commuters, 19.7%), and 5 to 9 minutes (12 commuters, 15.8%).
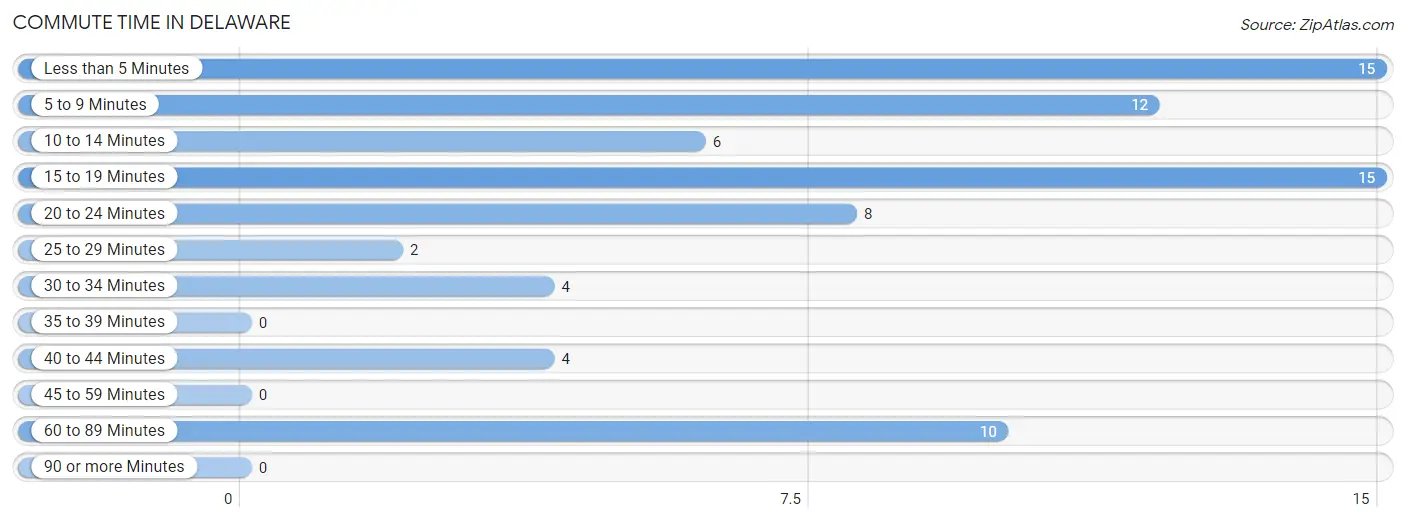
| Commute Time | # Commuters | % Commuters |
| Less than 5 Minutes | 15 | 19.7% |
| 5 to 9 Minutes | 12 | 15.8% |
| 10 to 14 Minutes | 6 | 7.9% |
| 15 to 19 Minutes | 15 | 19.7% |
| 20 to 24 Minutes | 8 | 10.5% |
| 25 to 29 Minutes | 2 | 2.6% |
| 30 to 34 Minutes | 4 | 5.3% |
| 35 to 39 Minutes | 0 | 0.0% |
| 40 to 44 Minutes | 4 | 5.3% |
| 45 to 59 Minutes | 0 | 0.0% |
| 60 to 89 Minutes | 10 | 13.2% |
| 90 or more Minutes | 0 | 0.0% |
Commute Time by Sex in Delaware
The most common commute times in Delaware are 15 to 19 minutes (12 commuters, 30.0%) for males and less than 5 minutes (10 commuters, 27.8%) for females.
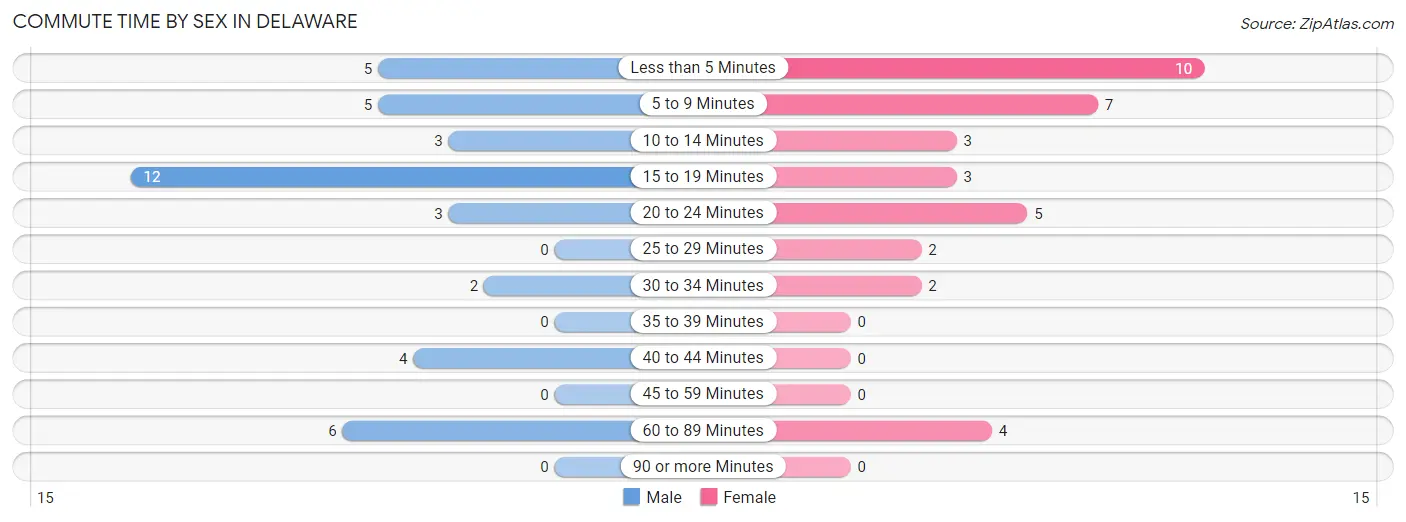
| Commute Time | Male | Female |
| Less than 5 Minutes | 5 (12.5%) | 10 (27.8%) |
| 5 to 9 Minutes | 5 (12.5%) | 7 (19.4%) |
| 10 to 14 Minutes | 3 (7.5%) | 3 (8.3%) |
| 15 to 19 Minutes | 12 (30.0%) | 3 (8.3%) |
| 20 to 24 Minutes | 3 (7.5%) | 5 (13.9%) |
| 25 to 29 Minutes | 0 (0.0%) | 2 (5.6%) |
| 30 to 34 Minutes | 2 (5.0%) | 2 (5.6%) |
| 35 to 39 Minutes | 0 (0.0%) | 0 (0.0%) |
| 40 to 44 Minutes | 4 (10.0%) | 0 (0.0%) |
| 45 to 59 Minutes | 0 (0.0%) | 0 (0.0%) |
| 60 to 89 Minutes | 6 (15.0%) | 4 (11.1%) |
| 90 or more Minutes | 0 (0.0%) | 0 (0.0%) |
Time of Departure to Work by Sex in Delaware
The most frequent times of departure to work in Delaware are 12:00 AM to 4:59 AM (10, 25.0%) for males and 6:30 AM to 6:59 AM (11, 30.6%) for females.
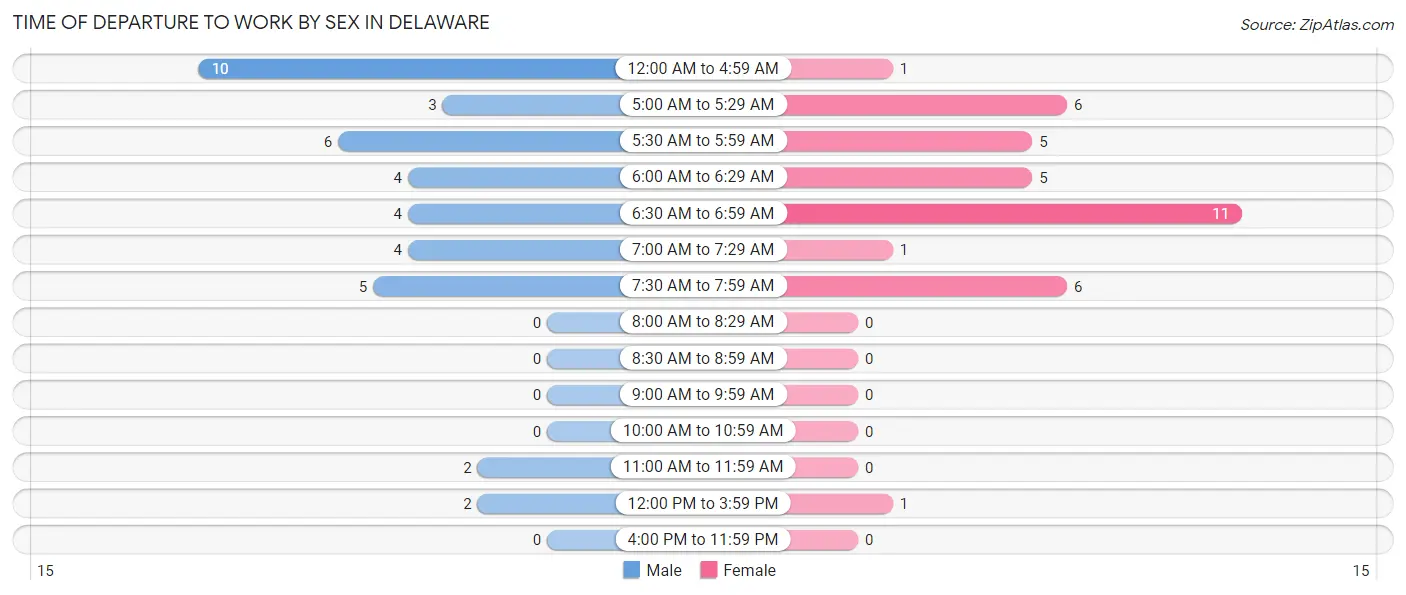
| Time of Departure | Male | Female |
| 12:00 AM to 4:59 AM | 10 (25.0%) | 1 (2.8%) |
| 5:00 AM to 5:29 AM | 3 (7.5%) | 6 (16.7%) |
| 5:30 AM to 5:59 AM | 6 (15.0%) | 5 (13.9%) |
| 6:00 AM to 6:29 AM | 4 (10.0%) | 5 (13.9%) |
| 6:30 AM to 6:59 AM | 4 (10.0%) | 11 (30.6%) |
| 7:00 AM to 7:29 AM | 4 (10.0%) | 1 (2.8%) |
| 7:30 AM to 7:59 AM | 5 (12.5%) | 6 (16.7%) |
| 8:00 AM to 8:29 AM | 0 (0.0%) | 0 (0.0%) |
| 8:30 AM to 8:59 AM | 0 (0.0%) | 0 (0.0%) |
| 9:00 AM to 9:59 AM | 0 (0.0%) | 0 (0.0%) |
| 10:00 AM to 10:59 AM | 0 (0.0%) | 0 (0.0%) |
| 11:00 AM to 11:59 AM | 2 (5.0%) | 0 (0.0%) |
| 12:00 PM to 3:59 PM | 2 (5.0%) | 1 (2.8%) |
| 4:00 PM to 11:59 PM | 0 (0.0%) | 0 (0.0%) |
| Total | 40 (100.0%) | 36 (100.0%) |
Housing Occupancy in Delaware
Occupancy by Ownership in Delaware
Of the total 68 dwellings in Delaware, owner-occupied units account for 48 (70.6%), while renter-occupied units make up 20 (29.4%).
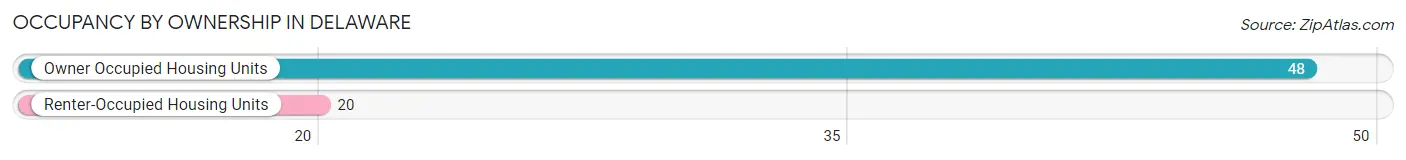
| Occupancy | # Housing Units | % Housing Units |
| Owner Occupied Housing Units | 48 | 70.6% |
| Renter-Occupied Housing Units | 20 | 29.4% |
| Total Occupied Housing Units | 68 | 100.0% |
Occupancy by Household Size in Delaware
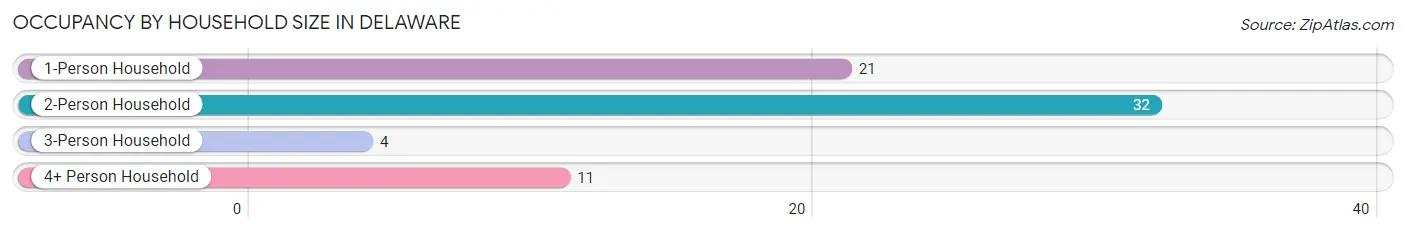
| Household Size | # Housing Units | % Housing Units |
| 1-Person Household | 21 | 30.9% |
| 2-Person Household | 32 | 47.1% |
| 3-Person Household | 4 | 5.9% |
| 4+ Person Household | 11 | 16.2% |
| Total Housing Units | 68 | 100.0% |
Occupancy by Ownership by Household Size in Delaware
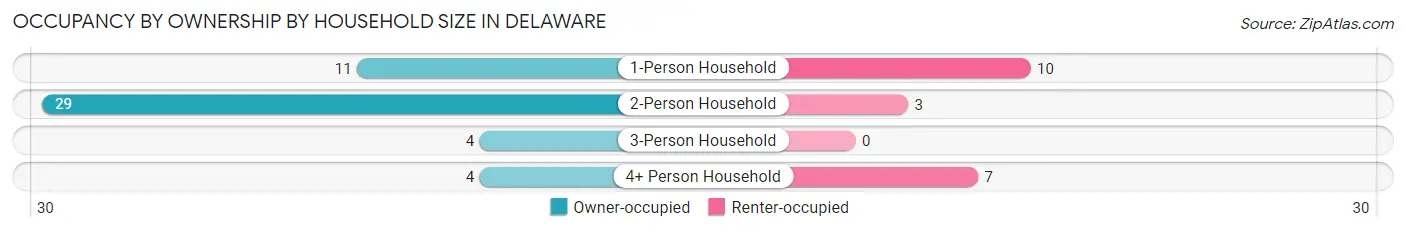
| Household Size | Owner-occupied | Renter-occupied |
| 1-Person Household | 11 (52.4%) | 10 (47.6%) |
| 2-Person Household | 29 (90.6%) | 3 (9.4%) |
| 3-Person Household | 4 (100.0%) | 0 (0.0%) |
| 4+ Person Household | 4 (36.4%) | 7 (63.6%) |
| Total Housing Units | 48 (70.6%) | 20 (29.4%) |
Occupancy by Educational Attainment in Delaware
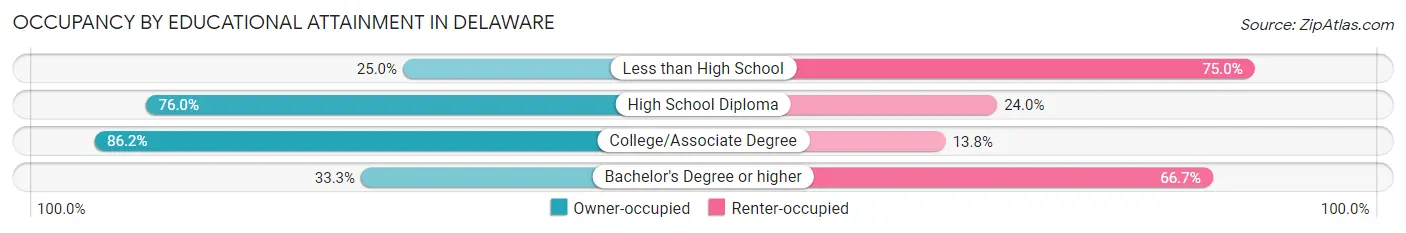
| Household Size | Owner-occupied | Renter-occupied |
| Less than High School | 2 (25.0%) | 6 (75.0%) |
| High School Diploma | 19 (76.0%) | 6 (24.0%) |
| College/Associate Degree | 25 (86.2%) | 4 (13.8%) |
| Bachelor's Degree or higher | 2 (33.3%) | 4 (66.7%) |
Occupancy by Age of Householder in Delaware
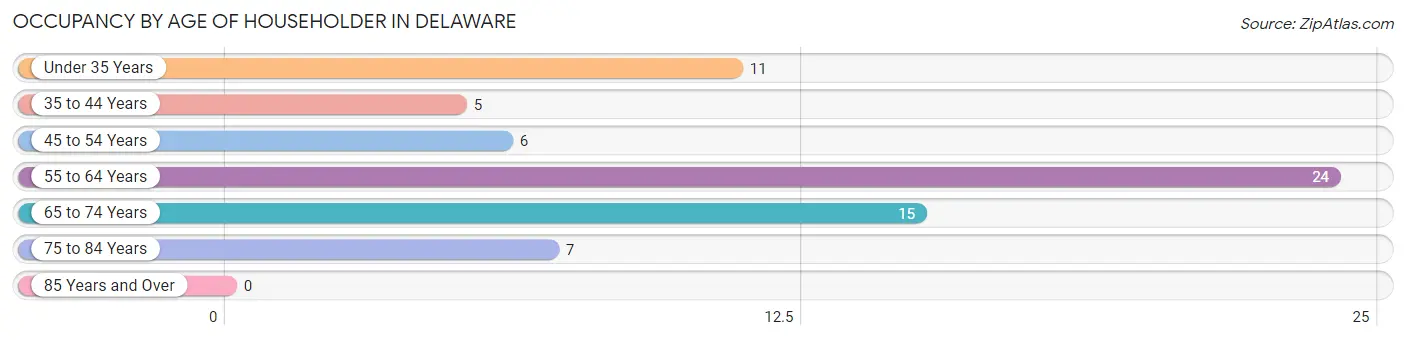
| Age Bracket | # Households | % Households |
| Under 35 Years | 11 | 16.2% |
| 35 to 44 Years | 5 | 7.3% |
| 45 to 54 Years | 6 | 8.8% |
| 55 to 64 Years | 24 | 35.3% |
| 65 to 74 Years | 15 | 22.1% |
| 75 to 84 Years | 7 | 10.3% |
| 85 Years and Over | 0 | 0.0% |
| Total | 68 | 100.0% |
Housing Finances in Delaware
Median Income by Occupancy in Delaware
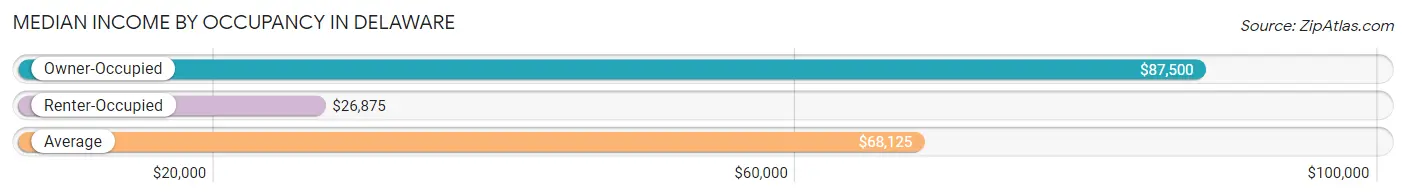
| Occupancy Type | # Households | Median Income |
| Owner-Occupied | 48 (70.6%) | $87,500 |
| Renter-Occupied | 20 (29.4%) | $26,875 |
| Average | 68 (100.0%) | $68,125 |
Occupancy by Householder Income Bracket in Delaware
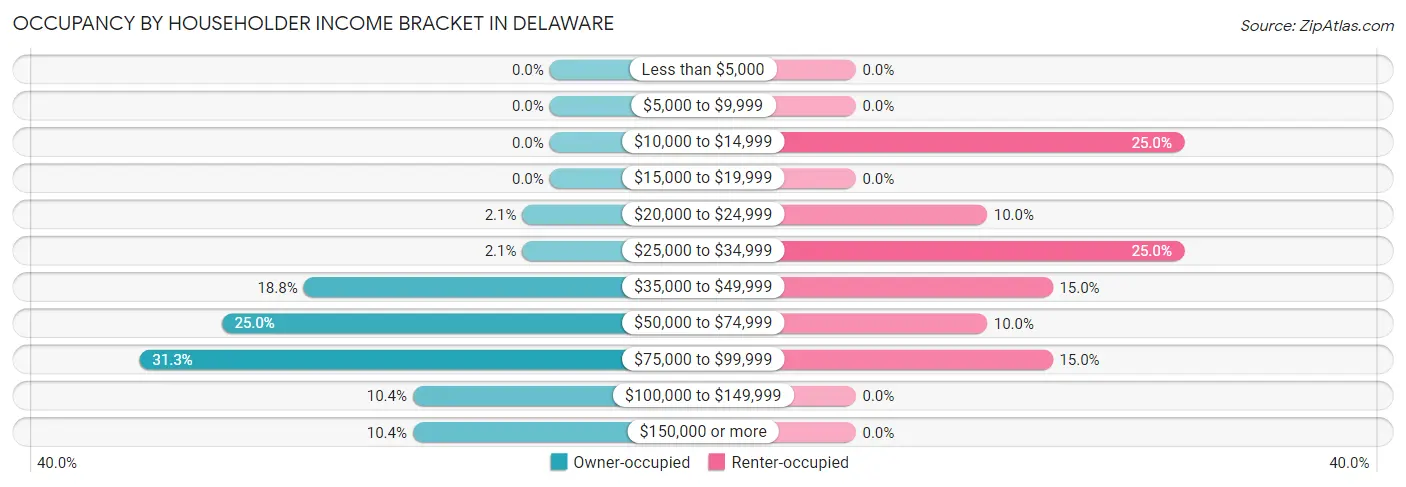
| Income Bracket | Owner-occupied | Renter-occupied |
| Less than $5,000 | 0 (0.0%) | 0 (0.0%) |
| $5,000 to $9,999 | 0 (0.0%) | 0 (0.0%) |
| $10,000 to $14,999 | 0 (0.0%) | 5 (25.0%) |
| $15,000 to $19,999 | 0 (0.0%) | 0 (0.0%) |
| $20,000 to $24,999 | 1 (2.1%) | 2 (10.0%) |
| $25,000 to $34,999 | 1 (2.1%) | 5 (25.0%) |
| $35,000 to $49,999 | 9 (18.8%) | 3 (15.0%) |
| $50,000 to $74,999 | 12 (25.0%) | 2 (10.0%) |
| $75,000 to $99,999 | 15 (31.2%) | 3 (15.0%) |
| $100,000 to $149,999 | 5 (10.4%) | 0 (0.0%) |
| $150,000 or more | 5 (10.4%) | 0 (0.0%) |
| Total | 48 (100.0%) | 20 (100.0%) |
Monthly Housing Cost Tiers in Delaware
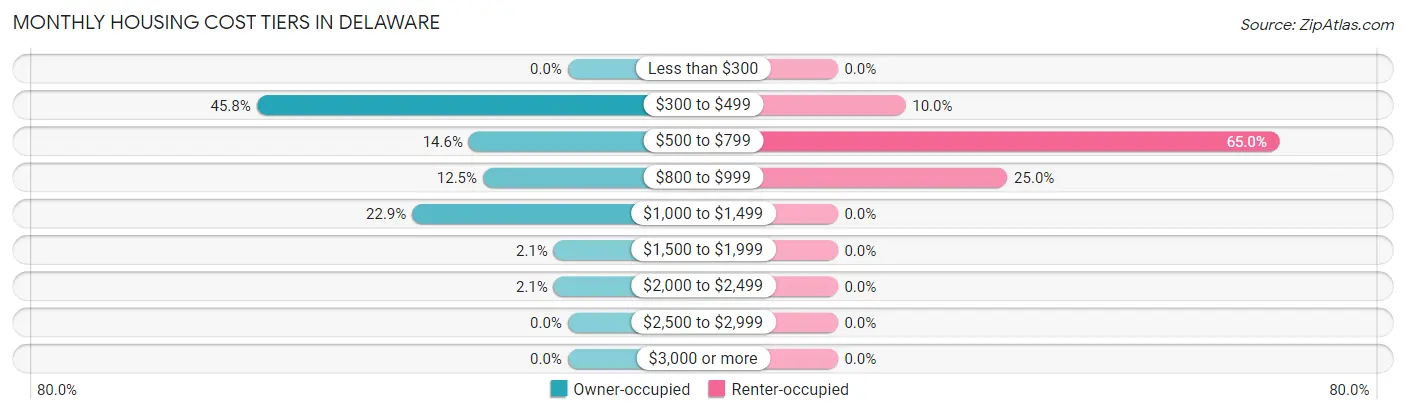
| Monthly Cost | Owner-occupied | Renter-occupied |
| Less than $300 | 0 (0.0%) | 0 (0.0%) |
| $300 to $499 | 22 (45.8%) | 2 (10.0%) |
| $500 to $799 | 7 (14.6%) | 13 (65.0%) |
| $800 to $999 | 6 (12.5%) | 5 (25.0%) |
| $1,000 to $1,499 | 11 (22.9%) | 0 (0.0%) |
| $1,500 to $1,999 | 1 (2.1%) | 0 (0.0%) |
| $2,000 to $2,499 | 1 (2.1%) | 0 (0.0%) |
| $2,500 to $2,999 | 0 (0.0%) | 0 (0.0%) |
| $3,000 or more | 0 (0.0%) | 0 (0.0%) |
| Total | 48 (100.0%) | 20 (100.0%) |
Physical Housing Characteristics in Delaware
Housing Structures in Delaware
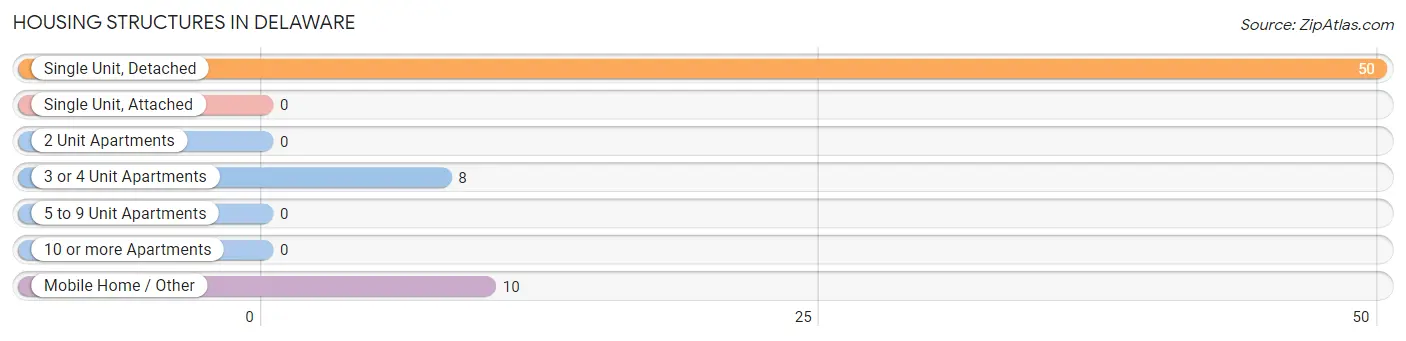
| Structure Type | # Housing Units | % Housing Units |
| Single Unit, Detached | 50 | 73.5% |
| Single Unit, Attached | 0 | 0.0% |
| 2 Unit Apartments | 0 | 0.0% |
| 3 or 4 Unit Apartments | 8 | 11.8% |
| 5 to 9 Unit Apartments | 0 | 0.0% |
| 10 or more Apartments | 0 | 0.0% |
| Mobile Home / Other | 10 | 14.7% |
| Total | 68 | 100.0% |
Housing Structures by Occupancy in Delaware
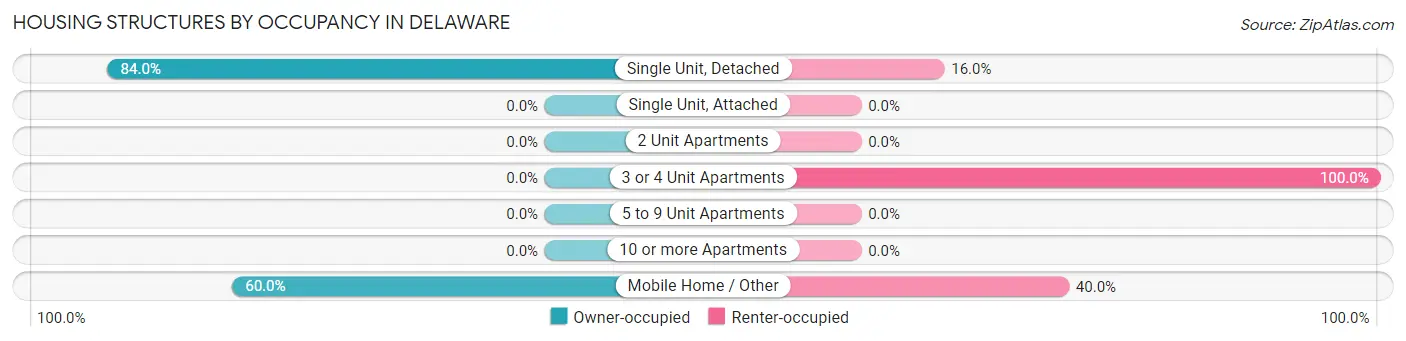
| Structure Type | Owner-occupied | Renter-occupied |
| Single Unit, Detached | 42 (84.0%) | 8 (16.0%) |
| Single Unit, Attached | 0 (0.0%) | 0 (0.0%) |
| 2 Unit Apartments | 0 (0.0%) | 0 (0.0%) |
| 3 or 4 Unit Apartments | 0 (0.0%) | 8 (100.0%) |
| 5 to 9 Unit Apartments | 0 (0.0%) | 0 (0.0%) |
| 10 or more Apartments | 0 (0.0%) | 0 (0.0%) |
| Mobile Home / Other | 6 (60.0%) | 4 (40.0%) |
| Total | 48 (70.6%) | 20 (29.4%) |
Housing Structures by Number of Rooms in Delaware
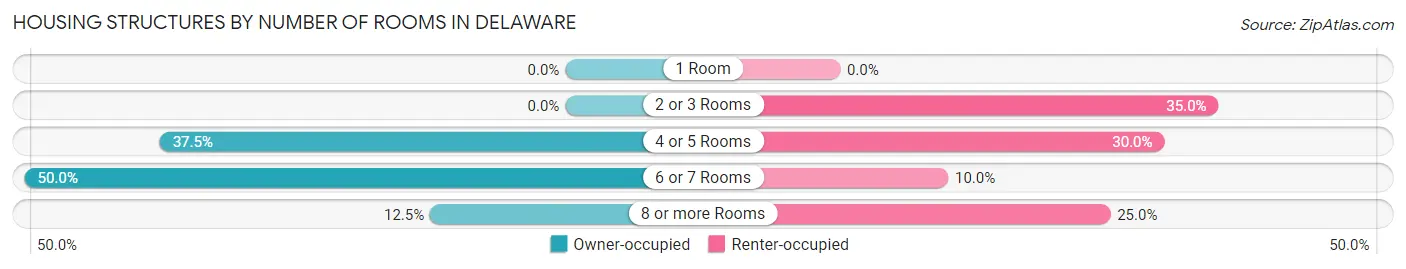
| Number of Rooms | Owner-occupied | Renter-occupied |
| 1 Room | 0 (0.0%) | 0 (0.0%) |
| 2 or 3 Rooms | 0 (0.0%) | 7 (35.0%) |
| 4 or 5 Rooms | 18 (37.5%) | 6 (30.0%) |
| 6 or 7 Rooms | 24 (50.0%) | 2 (10.0%) |
| 8 or more Rooms | 6 (12.5%) | 5 (25.0%) |
| Total | 48 (100.0%) | 20 (100.0%) |
Housing Structure by Heating Type in Delaware
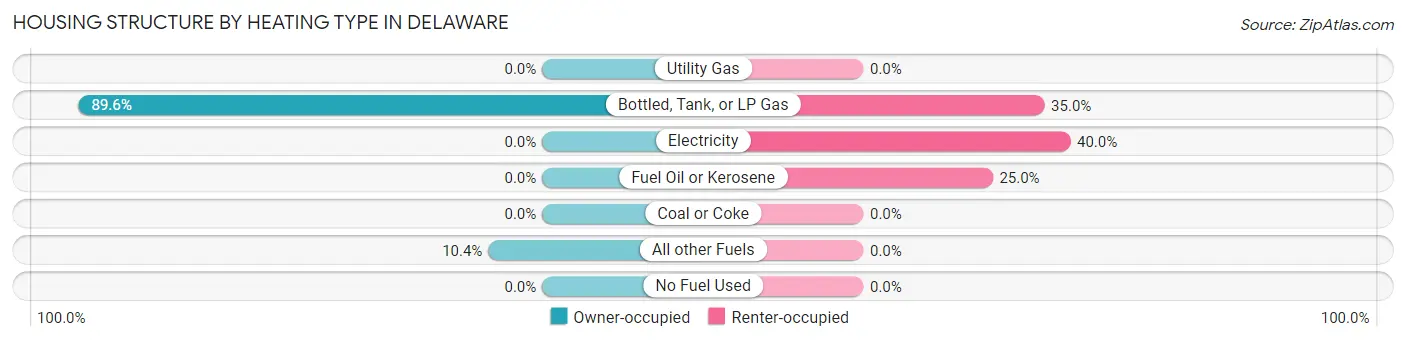
| Heating Type | Owner-occupied | Renter-occupied |
| Utility Gas | 0 (0.0%) | 0 (0.0%) |
| Bottled, Tank, or LP Gas | 43 (89.6%) | 7 (35.0%) |
| Electricity | 0 (0.0%) | 8 (40.0%) |
| Fuel Oil or Kerosene | 0 (0.0%) | 5 (25.0%) |
| Coal or Coke | 0 (0.0%) | 0 (0.0%) |
| All other Fuels | 5 (10.4%) | 0 (0.0%) |
| No Fuel Used | 0 (0.0%) | 0 (0.0%) |
| Total | 48 (100.0%) | 20 (100.0%) |
Household Vehicle Usage in Delaware
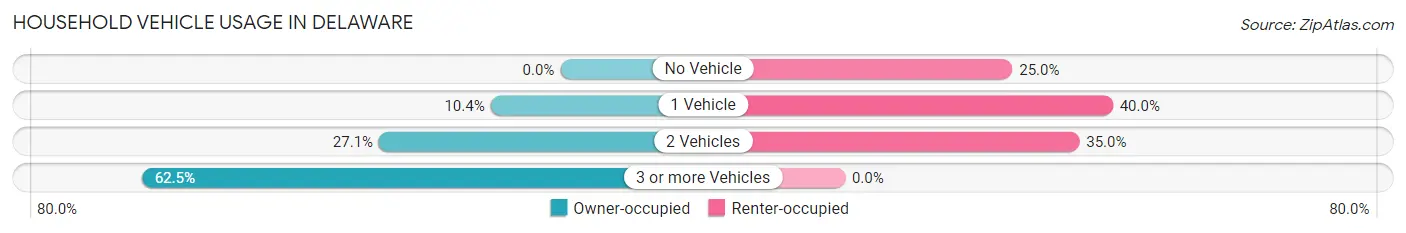
| Vehicles per Household | Owner-occupied | Renter-occupied |
| No Vehicle | 0 (0.0%) | 5 (25.0%) |
| 1 Vehicle | 5 (10.4%) | 8 (40.0%) |
| 2 Vehicles | 13 (27.1%) | 7 (35.0%) |
| 3 or more Vehicles | 30 (62.5%) | 0 (0.0%) |
| Total | 48 (100.0%) | 20 (100.0%) |
Real Estate & Mortgages in Delaware
Real Estate and Mortgage Overview in Delaware
| Characteristic | Without Mortgage | With Mortgage |
| Housing Units | 28 | 20 |
| Median Property Value | $134,400 | $145,000 |
| Median Household Income | $90,455 | $3 |
| Monthly Housing Costs | $453 | $0 |
| Real Estate Taxes | $1,676 | $1 |
Property Value by Mortgage Status in Delaware
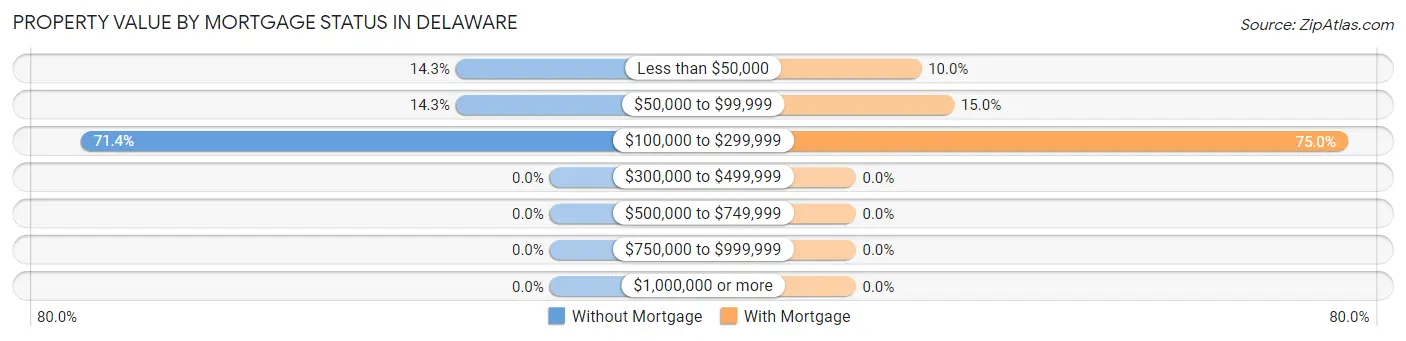
| Property Value | Without Mortgage | With Mortgage |
| Less than $50,000 | 4 (14.3%) | 2 (10.0%) |
| $50,000 to $99,999 | 4 (14.3%) | 3 (15.0%) |
| $100,000 to $299,999 | 20 (71.4%) | 15 (75.0%) |
| $300,000 to $499,999 | 0 (0.0%) | 0 (0.0%) |
| $500,000 to $749,999 | 0 (0.0%) | 0 (0.0%) |
| $750,000 to $999,999 | 0 (0.0%) | 0 (0.0%) |
| $1,000,000 or more | 0 (0.0%) | 0 (0.0%) |
| Total | 28 (100.0%) | 20 (100.0%) |
Household Income by Mortgage Status in Delaware
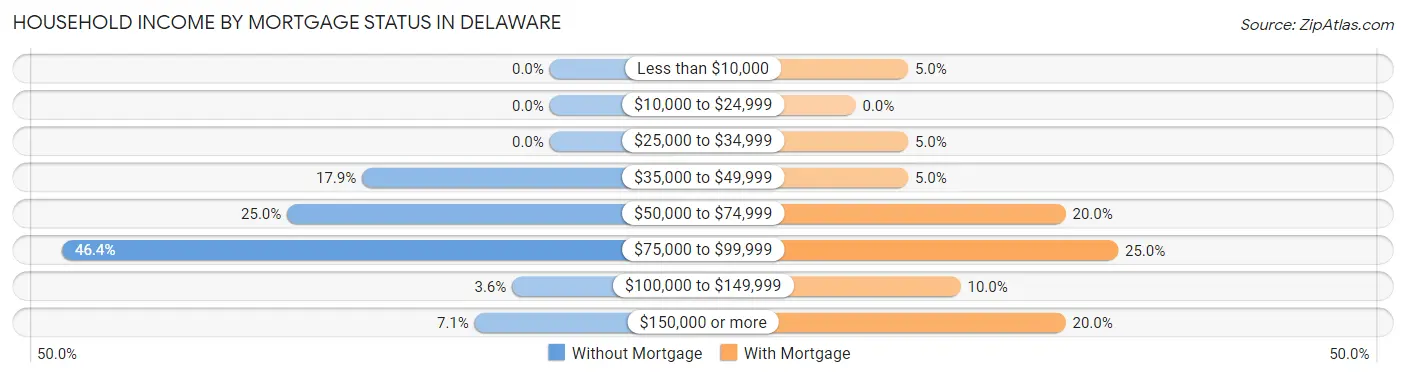
| Household Income | Without Mortgage | With Mortgage |
| Less than $10,000 | 0 (0.0%) | 1 (5.0%) |
| $10,000 to $24,999 | 0 (0.0%) | 0 (0.0%) |
| $25,000 to $34,999 | 0 (0.0%) | 1 (5.0%) |
| $35,000 to $49,999 | 5 (17.9%) | 1 (5.0%) |
| $50,000 to $74,999 | 7 (25.0%) | 4 (20.0%) |
| $75,000 to $99,999 | 13 (46.4%) | 5 (25.0%) |
| $100,000 to $149,999 | 1 (3.6%) | 2 (10.0%) |
| $150,000 or more | 2 (7.1%) | 4 (20.0%) |
| Total | 28 (100.0%) | 20 (100.0%) |
Property Value to Household Income Ratio in Delaware
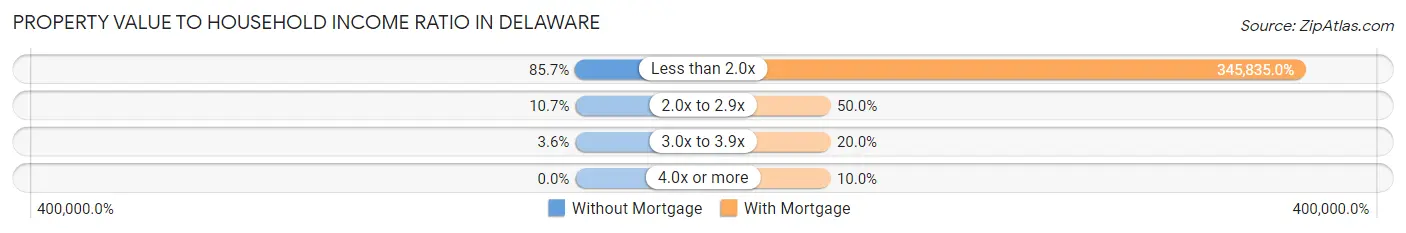
| Value-to-Income Ratio | Without Mortgage | With Mortgage |
| Less than 2.0x | 24 (85.7%) | 69,167 (345,835.0%) |
| 2.0x to 2.9x | 3 (10.7%) | 10 (50.0%) |
| 3.0x to 3.9x | 1 (3.6%) | 4 (20.0%) |
| 4.0x or more | 0 (0.0%) | 2 (10.0%) |
| Total | 28 (100.0%) | 20 (100.0%) |
Real Estate Taxes by Mortgage Status in Delaware
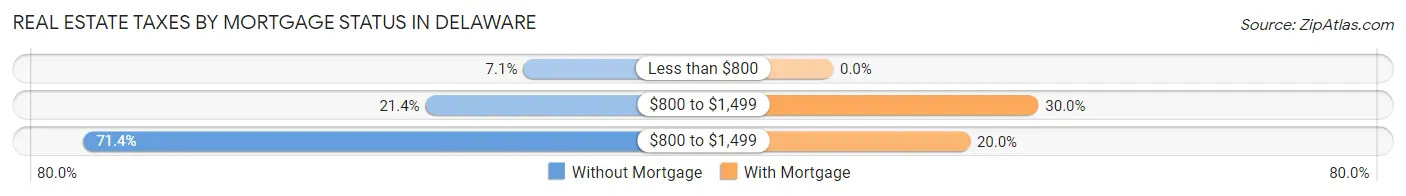
| Property Taxes | Without Mortgage | With Mortgage |
| Less than $800 | 2 (7.1%) | 0 (0.0%) |
| $800 to $1,499 | 6 (21.4%) | 6 (30.0%) |
| $800 to $1,499 | 20 (71.4%) | 4 (20.0%) |
| Total | 28 (100.0%) | 20 (100.0%) |
Health & Disability in Delaware
Health Insurance Coverage by Age in Delaware
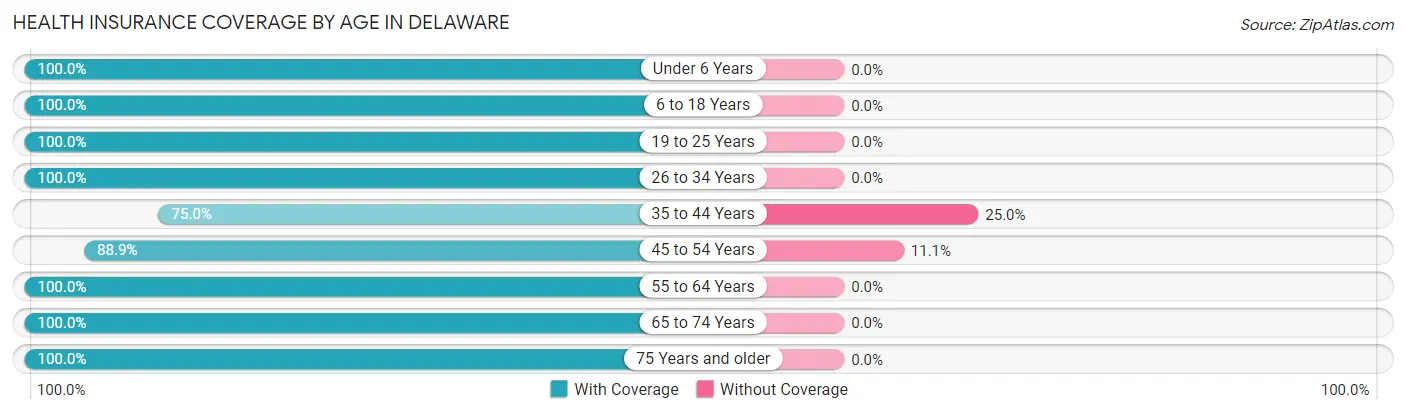
| Age Bracket | With Coverage | Without Coverage |
| Under 6 Years | 16 (100.0%) | 0 (0.0%) |
| 6 to 18 Years | 8 (100.0%) | 0 (0.0%) |
| 19 to 25 Years | 15 (100.0%) | 0 (0.0%) |
| 26 to 34 Years | 6 (100.0%) | 0 (0.0%) |
| 35 to 44 Years | 6 (75.0%) | 2 (25.0%) |
| 45 to 54 Years | 16 (88.9%) | 2 (11.1%) |
| 55 to 64 Years | 38 (100.0%) | 0 (0.0%) |
| 65 to 74 Years | 23 (100.0%) | 0 (0.0%) |
| 75 Years and older | 9 (100.0%) | 0 (0.0%) |
| Total | 137 (97.2%) | 4 (2.8%) |
Health Insurance Coverage by Citizenship Status in Delaware
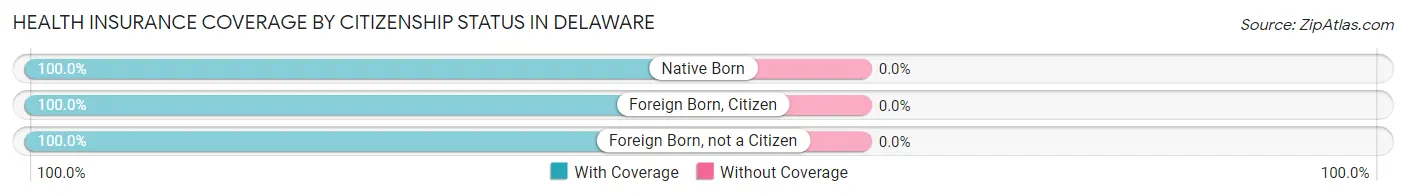
| Citizenship Status | With Coverage | Without Coverage |
| Native Born | 16 (100.0%) | 0 (0.0%) |
| Foreign Born, Citizen | 8 (100.0%) | 0 (0.0%) |
| Foreign Born, not a Citizen | 15 (100.0%) | 0 (0.0%) |
Health Insurance Coverage by Household Income in Delaware
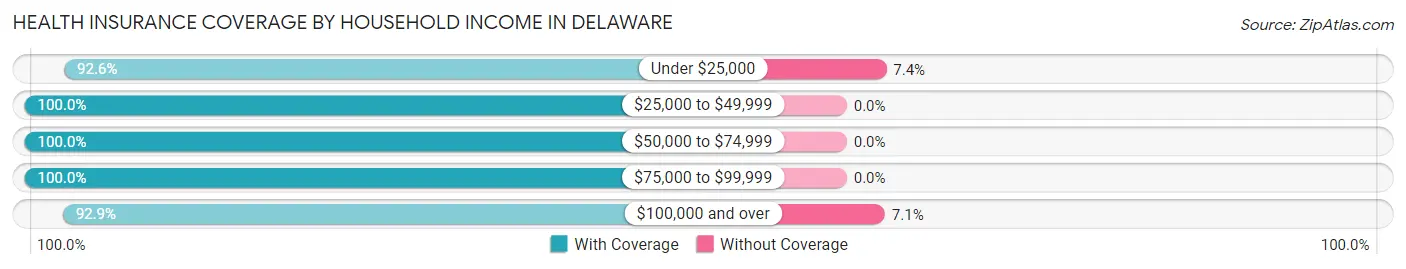
| Household Income | With Coverage | Without Coverage |
| Under $25,000 | 25 (92.6%) | 2 (7.4%) |
| $25,000 to $49,999 | 27 (100.0%) | 0 (0.0%) |
| $50,000 to $74,999 | 22 (100.0%) | 0 (0.0%) |
| $75,000 to $99,999 | 37 (100.0%) | 0 (0.0%) |
| $100,000 and over | 26 (92.9%) | 2 (7.1%) |
Public vs Private Health Insurance Coverage by Age in Delaware
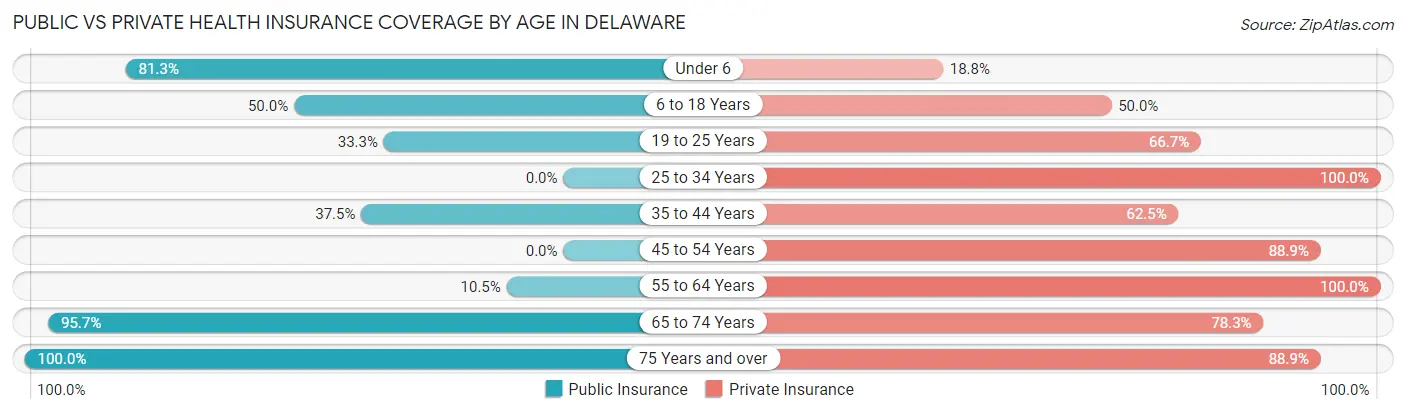
| Age Bracket | Public Insurance | Private Insurance |
| Under 6 | 13 (81.2%) | 3 (18.8%) |
| 6 to 18 Years | 4 (50.0%) | 4 (50.0%) |
| 19 to 25 Years | 5 (33.3%) | 10 (66.7%) |
| 25 to 34 Years | 0 (0.0%) | 6 (100.0%) |
| 35 to 44 Years | 3 (37.5%) | 5 (62.5%) |
| 45 to 54 Years | 0 (0.0%) | 16 (88.9%) |
| 55 to 64 Years | 4 (10.5%) | 38 (100.0%) |
| 65 to 74 Years | 22 (95.7%) | 18 (78.3%) |
| 75 Years and over | 9 (100.0%) | 8 (88.9%) |
| Total | 60 (42.5%) | 108 (76.6%) |
Disability Status by Sex by Age in Delaware
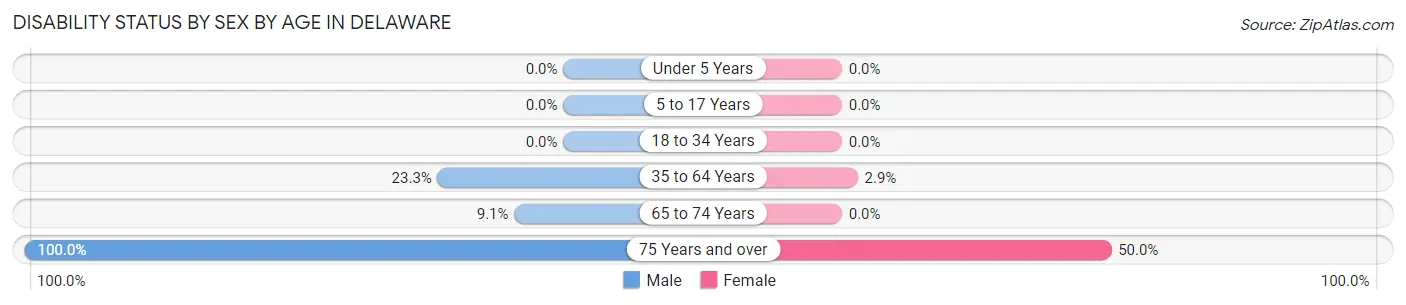
| Age Bracket | Male | Female |
| Under 5 Years | 0 (0.0%) | 0 (0.0%) |
| 5 to 17 Years | 0 (0.0%) | 0 (0.0%) |
| 18 to 34 Years | 0 (0.0%) | 0 (0.0%) |
| 35 to 64 Years | 7 (23.3%) | 1 (2.9%) |
| 65 to 74 Years | 1 (9.1%) | 0 (0.0%) |
| 75 Years and over | 5 (100.0%) | 2 (50.0%) |
Disability Class by Sex by Age in Delaware
Disability Class: Hearing Difficulty
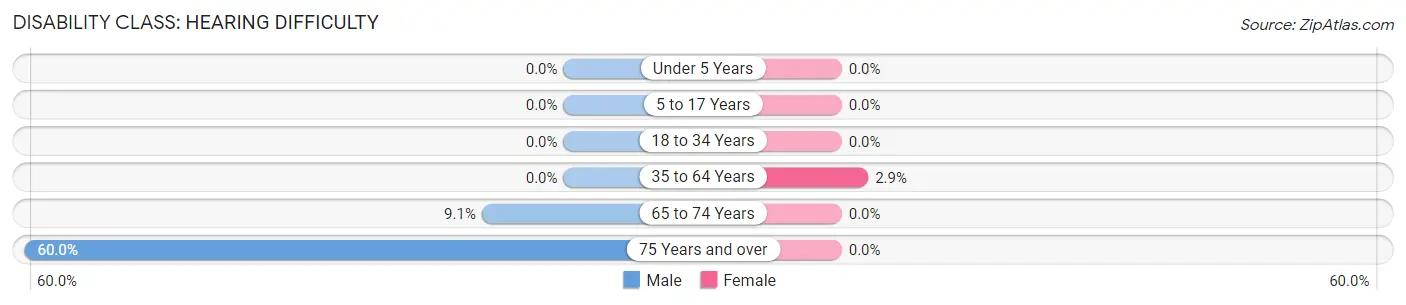
| Age Bracket | Male | Female |
| Under 5 Years | 0 (0.0%) | 0 (0.0%) |
| 5 to 17 Years | 0 (0.0%) | 0 (0.0%) |
| 18 to 34 Years | 0 (0.0%) | 0 (0.0%) |
| 35 to 64 Years | 0 (0.0%) | 1 (2.9%) |
| 65 to 74 Years | 1 (9.1%) | 0 (0.0%) |
| 75 Years and over | 3 (60.0%) | 0 (0.0%) |
Disability Class: Vision Difficulty
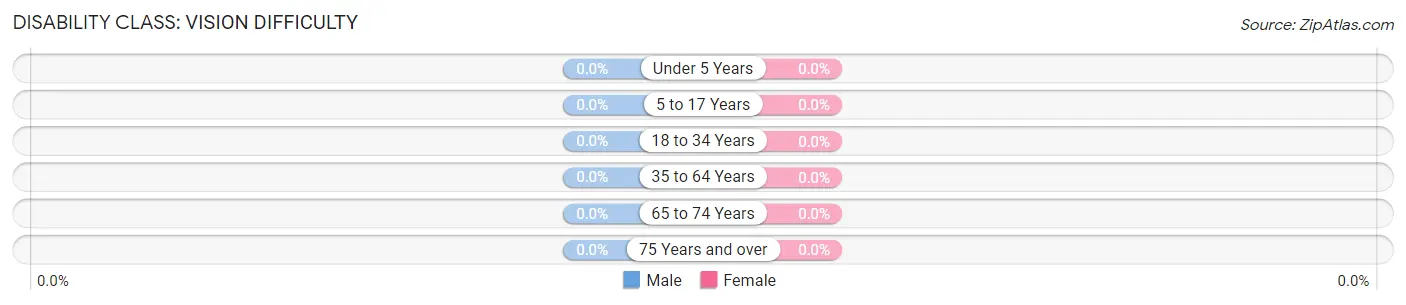
| Age Bracket | Male | Female |
| Under 5 Years | 0 (0.0%) | 0 (0.0%) |
| 5 to 17 Years | 0 (0.0%) | 0 (0.0%) |
| 18 to 34 Years | 0 (0.0%) | 0 (0.0%) |
| 35 to 64 Years | 0 (0.0%) | 0 (0.0%) |
| 65 to 74 Years | 0 (0.0%) | 0 (0.0%) |
| 75 Years and over | 0 (0.0%) | 0 (0.0%) |
Disability Class: Cognitive Difficulty
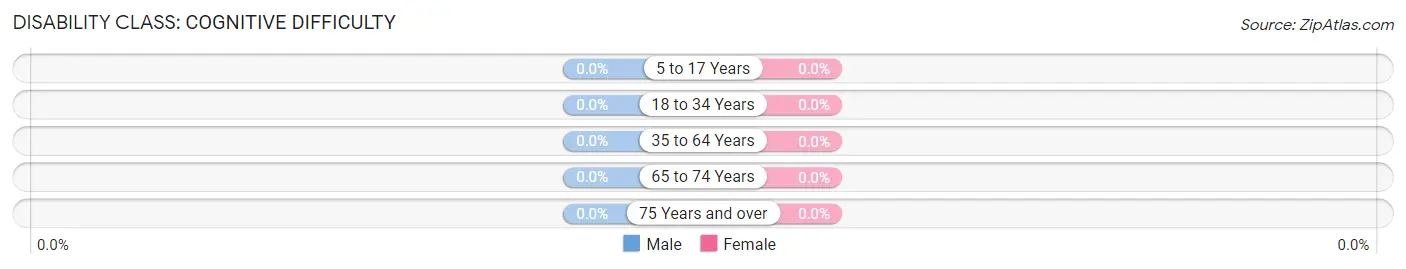
| Age Bracket | Male | Female |
| 5 to 17 Years | 0 (0.0%) | 0 (0.0%) |
| 18 to 34 Years | 0 (0.0%) | 0 (0.0%) |
| 35 to 64 Years | 0 (0.0%) | 0 (0.0%) |
| 65 to 74 Years | 0 (0.0%) | 0 (0.0%) |
| 75 Years and over | 0 (0.0%) | 0 (0.0%) |
Disability Class: Ambulatory Difficulty
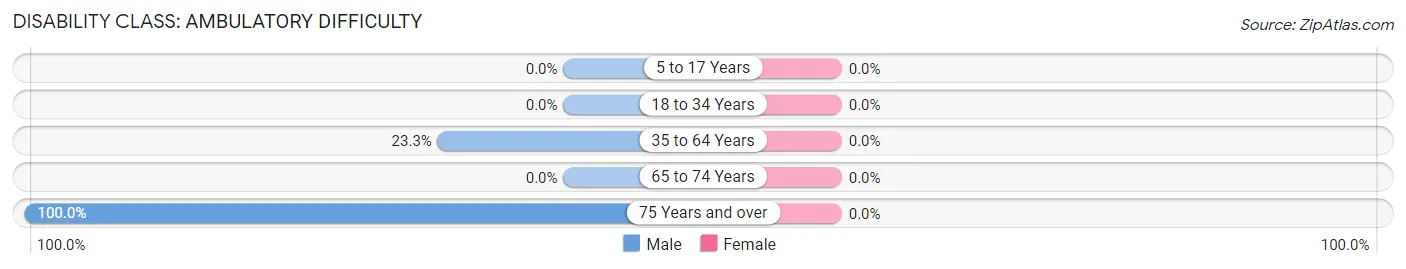
| Age Bracket | Male | Female |
| 5 to 17 Years | 0 (0.0%) | 0 (0.0%) |
| 18 to 34 Years | 0 (0.0%) | 0 (0.0%) |
| 35 to 64 Years | 7 (23.3%) | 0 (0.0%) |
| 65 to 74 Years | 0 (0.0%) | 0 (0.0%) |
| 75 Years and over | 5 (100.0%) | 0 (0.0%) |
Disability Class: Self-Care Difficulty
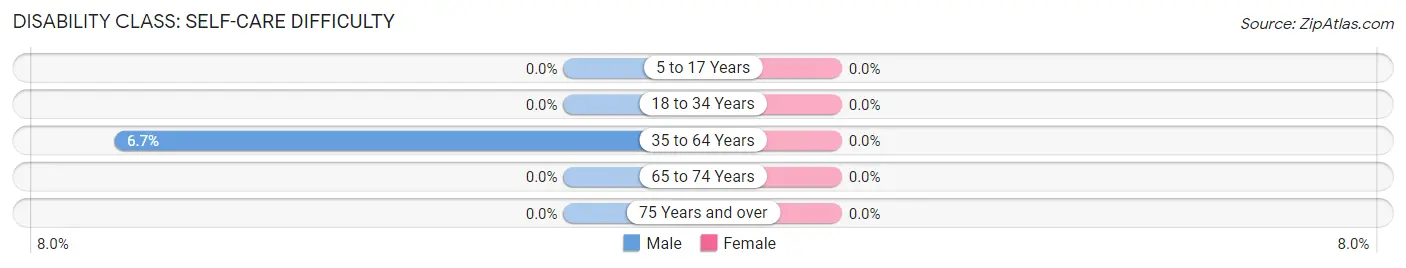
| Age Bracket | Male | Female |
| 5 to 17 Years | 0 (0.0%) | 0 (0.0%) |
| 18 to 34 Years | 0 (0.0%) | 0 (0.0%) |
| 35 to 64 Years | 2 (6.7%) | 0 (0.0%) |
| 65 to 74 Years | 0 (0.0%) | 0 (0.0%) |
| 75 Years and over | 0 (0.0%) | 0 (0.0%) |
Technology Access in Delaware
Computing Device Access in Delaware
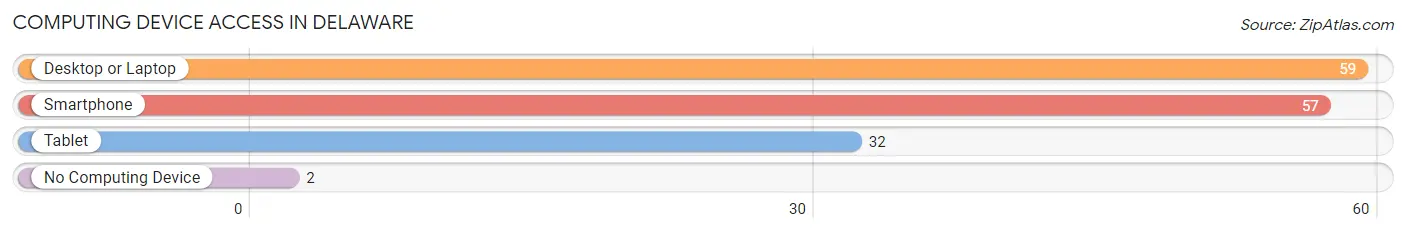
| Device Type | # Households | % Households |
| Desktop or Laptop | 59 | 86.8% |
| Smartphone | 57 | 83.8% |
| Tablet | 32 | 47.1% |
| No Computing Device | 2 | 2.9% |
| Total | 68 | 100.0% |
Internet Access in Delaware
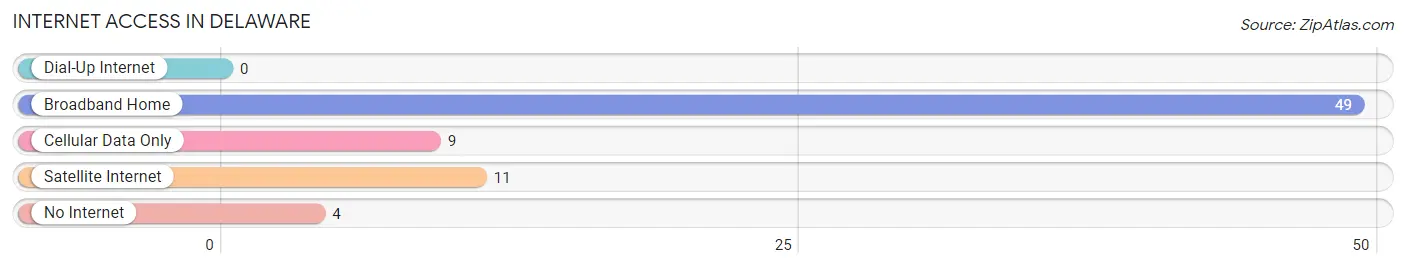
| Internet Type | # Households | % Households |
| Dial-Up Internet | 0 | 0.0% |
| Broadband Home | 49 | 72.1% |
| Cellular Data Only | 9 | 13.2% |
| Satellite Internet | 11 | 16.2% |
| No Internet | 4 | 5.9% |
| Total | 68 | 100.0% |
Delaware Summary
Delaware is a small town located in Delaware County, Iowa. It is situated in the rolling hills of the Driftless Area, a region of the Midwest that was not glaciated during the last ice age. The town is located along the banks of the Maquoketa River, and is home to a population of just over 1,000 people.
History
Delaware was first settled in 1837 by a group of settlers from Delaware County, New York. The town was originally known as “Delaware Center”, and was later renamed to “Delaware” in 1845. The town was officially incorporated in 1851.
During the Civil War, Delaware was a major stop on the Underground Railroad, with many of the town’s residents helping to provide shelter and assistance to runaway slaves.
In the late 19th century, Delaware was a major center for the production of brick and tile. The town was also home to a number of other industries, including a flour mill, a sawmill, and a creamery.
Geography
Delaware is located in the rolling hills of the Driftless Area, a region of the Midwest that was not glaciated during the last ice age. The town is situated along the banks of the Maquoketa River, and is surrounded by a number of small lakes and ponds.
The town is located approximately 25 miles east of Dubuque, Iowa, and is about a two-hour drive from both Des Moines and Cedar Rapids.
Economy
Delaware’s economy is largely based on agriculture and tourism. The town is home to a number of small businesses, including a grocery store, a hardware store, and a number of restaurants.
The town is also home to a number of small manufacturing companies, including a brick and tile factory, a sawmill, and a flour mill.
Demographics
As of the 2010 census, Delaware had a population of 1,039 people. The town is predominantly white, with a small Hispanic population. The median household income is $45,000, and the median home value is $125,000.
Delaware is served by the Maquoketa Valley Community School District, which includes a high school, a middle school, and an elementary school. The town is also home to a number of churches, including the United Methodist Church, the First Presbyterian Church, and the St. John’s Lutheran Church.
Conclusion
Delaware is a small town located in Delaware County, Iowa. It is situated in the rolling hills of the Driftless Area, and is home to a population of just over 1,000 people. The town’s economy is largely based on agriculture and tourism, and it is served by the Maquoketa Valley Community School District. Delaware is a predominantly white town, with a small Hispanic population, and a median household income of $45,000.
Common Questions
What is Per Capita Income in Delaware?
Per Capita income in Delaware is $34,073.
What is the Median Family Income in Delaware?
Median Family Income in Delaware is $68,250.
What is the Median Household income in Delaware?
Median Household Income in Delaware is $68,125.
What is Inequality or Gini Index in Delaware?
Inequality or Gini Index in Delaware is 0.33.
What is the Total Population of Delaware?
Total Population of Delaware is 141.
What is the Total Male Population of Delaware?
Total Male Population of Delaware is 69.
What is the Total Female Population of Delaware?
Total Female Population of Delaware is 72.
What is the Ratio of Males per 100 Females in Delaware?
There are 95.83 Males per 100 Females in Delaware.
What is the Ratio of Females per 100 Males in Delaware?
There are 104.35 Females per 100 Males in Delaware.
What is the Median Population Age in Delaware?
Median Population Age in Delaware is 55.0 Years.
What is the Average Family Size in Delaware
Average Family Size in Delaware is 2.8 People.
What is the Average Household Size in Delaware
Average Household Size in Delaware is 2.1 People.
How Large is the Labor Force in Delaware?
There are 79 People in the Labor Forcein in Delaware.
What is the Percentage of People in the Labor Force in Delaware?
67.5% of People are in the Labor Force in Delaware.