Columbus City, IA Map & Demographics
Columbus City Map
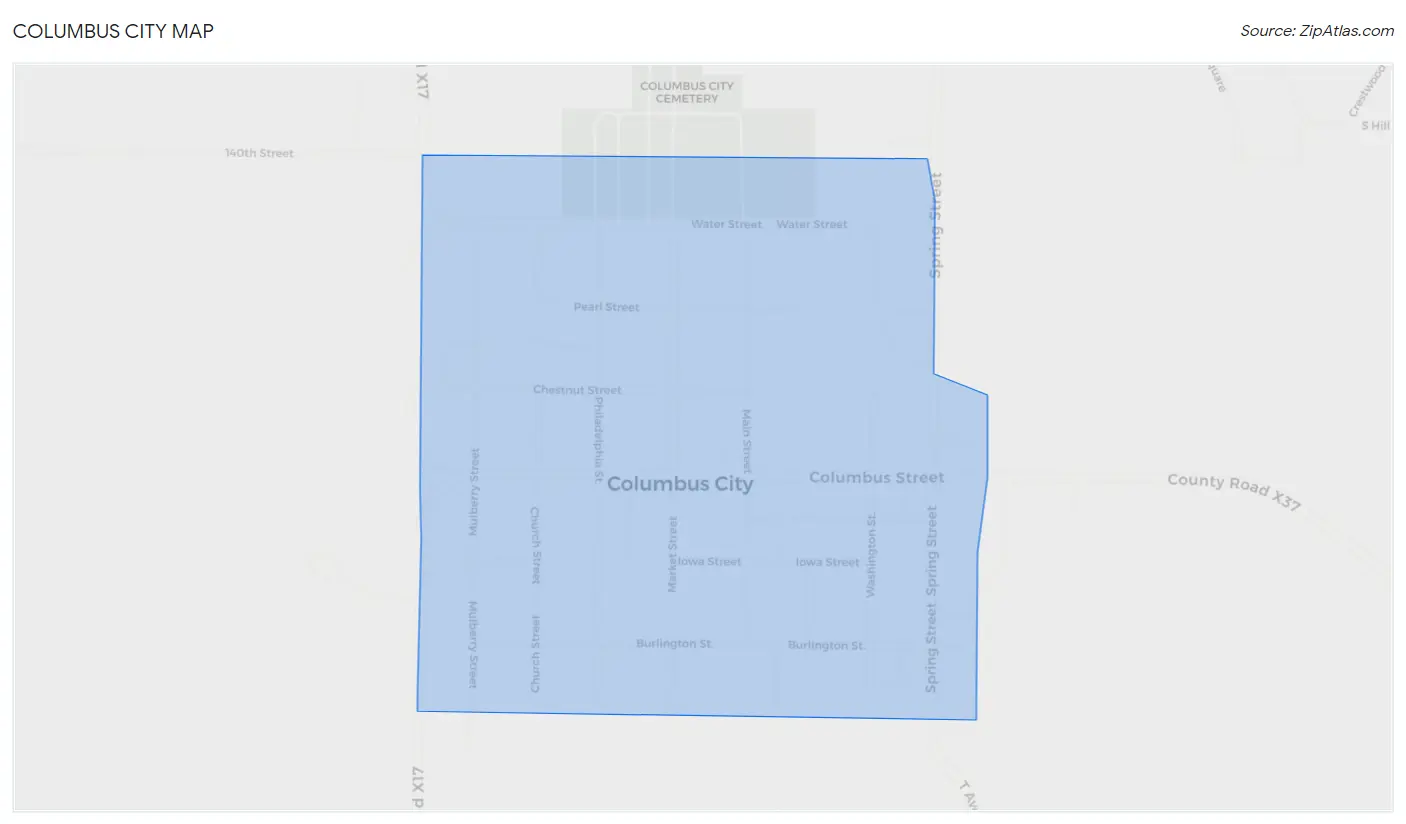
Columbus City Overview
$33,694
PER CAPITA INCOME
$82,083
AVG FAMILY INCOME
$63,750
AVG HOUSEHOLD INCOME
45.7%
WAGE / INCOME GAP [ % ]
54.3¢/ $1
WAGE / INCOME GAP [ $ ]
0.35
INEQUALITY / GINI INDEX
274
TOTAL POPULATION
151
MALE POPULATION
123
FEMALE POPULATION
122.76
MALES / 100 FEMALES
81.46
FEMALES / 100 MALES
54.9
MEDIAN AGE
2.8
AVG FAMILY SIZE
2.3
AVG HOUSEHOLD SIZE
150
LABOR FORCE [ PEOPLE ]
61.7%
PERCENT IN LABOR FORCE
4.7%
UNEMPLOYMENT RATE
Columbus City Zip Codes
Columbus City Area Codes
Income in Columbus City
Income Overview in Columbus City
Per Capita Income in Columbus City is $33,694, while median incomes of families and households are $82,083 and $63,750 respectively.
| Characteristic | Number | Measure |
| Per Capita Income | 274 | $33,694 |
| Median Family Income | 83 | $82,083 |
| Mean Family Income | 83 | $85,349 |
| Median Household Income | 120 | $63,750 |
| Mean Household Income | 120 | $75,449 |
| Income Deficit | 83 | $0 |
| Wage / Income Gap (%) | 274 | 45.67% |
| Wage / Income Gap ($) | 274 | 54.33¢ per $1 |
| Gini / Inequality Index | 274 | 0.35 |
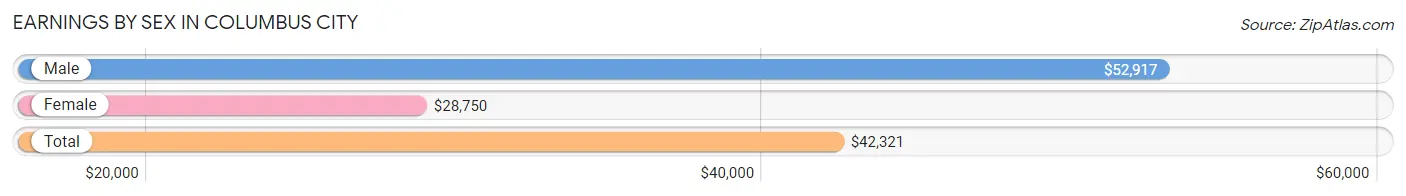
Earnings by Sex in Columbus City
Average Earnings in Columbus City are $42,321, $52,917 for men and $28,750 for women, a difference of 45.7%.
| Sex | Number | Average Earnings |
| Male | 97 (60.3%) | $52,917 |
| Female | 64 (39.8%) | $28,750 |
| Total | 161 (100.0%) | $42,321 |
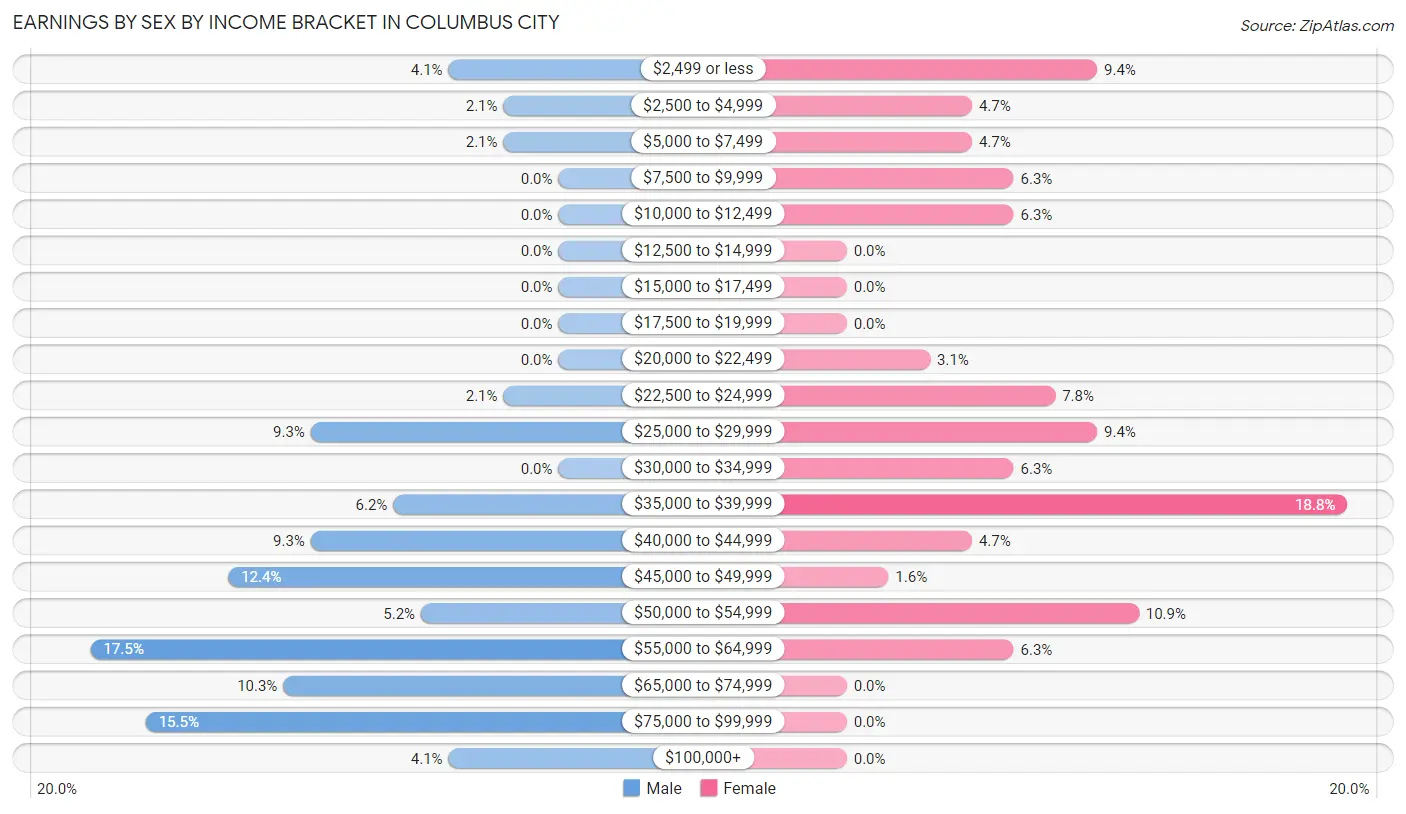
Earnings by Sex by Income Bracket in Columbus City
The most common earnings brackets in Columbus City are $55,000 to $64,999 for men (17 | 17.5%) and $35,000 to $39,999 for women (12 | 18.8%).
| Income | Male | Female |
| $2,499 or less | 4 (4.1%) | 6 (9.4%) |
| $2,500 to $4,999 | 2 (2.1%) | 3 (4.7%) |
| $5,000 to $7,499 | 2 (2.1%) | 3 (4.7%) |
| $7,500 to $9,999 | 0 (0.0%) | 4 (6.2%) |
| $10,000 to $12,499 | 0 (0.0%) | 4 (6.2%) |
| $12,500 to $14,999 | 0 (0.0%) | 0 (0.0%) |
| $15,000 to $17,499 | 0 (0.0%) | 0 (0.0%) |
| $17,500 to $19,999 | 0 (0.0%) | 0 (0.0%) |
| $20,000 to $22,499 | 0 (0.0%) | 2 (3.1%) |
| $22,500 to $24,999 | 2 (2.1%) | 5 (7.8%) |
| $25,000 to $29,999 | 9 (9.3%) | 6 (9.4%) |
| $30,000 to $34,999 | 0 (0.0%) | 4 (6.2%) |
| $35,000 to $39,999 | 6 (6.2%) | 12 (18.8%) |
| $40,000 to $44,999 | 9 (9.3%) | 3 (4.7%) |
| $45,000 to $49,999 | 12 (12.4%) | 1 (1.6%) |
| $50,000 to $54,999 | 5 (5.1%) | 7 (10.9%) |
| $55,000 to $64,999 | 17 (17.5%) | 4 (6.2%) |
| $65,000 to $74,999 | 10 (10.3%) | 0 (0.0%) |
| $75,000 to $99,999 | 15 (15.5%) | 0 (0.0%) |
| $100,000+ | 4 (4.1%) | 0 (0.0%) |
| Total | 97 (100.0%) | 64 (100.0%) |
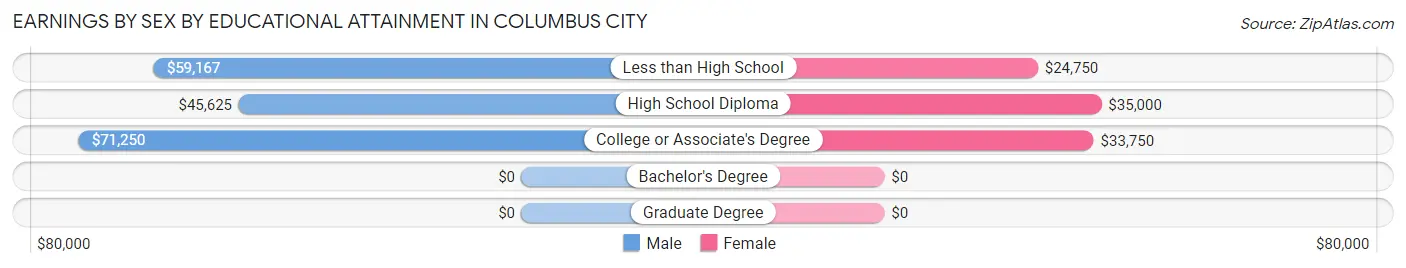
Earnings by Sex by Educational Attainment in Columbus City
Average earnings in Columbus City are $58,250 for men and $31,250 for women, a difference of 46.4%. Men with an educational attainment of college or associate's degree enjoy the highest average annual earnings of $71,250, while those with high school diploma education earn the least with $45,625. Women with an educational attainment of high school diploma earn the most with the average annual earnings of $35,000, while those with less than high school education have the smallest earnings of $24,750.
| Educational Attainment | Male Income | Female Income |
| Less than High School | $59,167 | $24,750 |
| High School Diploma | $45,625 | $35,000 |
| College or Associate's Degree | $71,250 | $33,750 |
| Bachelor's Degree | - | - |
| Graduate Degree | - | - |
| Total | $58,250 | $31,250 |
Family Income in Columbus City
Family Income Brackets in Columbus City
According to the Columbus City family income data, there are 25 families falling into the $75,000 to $99,999 income range, which is the most common income bracket and makes up 30.1% of all families.
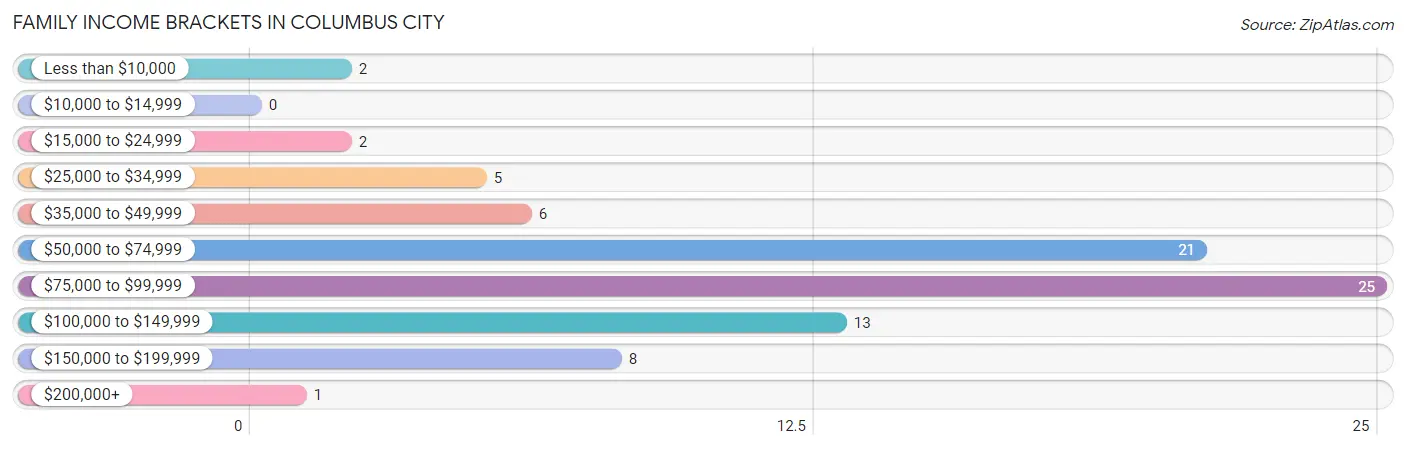
| Income Bracket | # Families | % Families |
| Less than $10,000 | 2 | 2.4% |
| $10,000 to $14,999 | 0 | 0.0% |
| $15,000 to $24,999 | 2 | 2.4% |
| $25,000 to $34,999 | 5 | 6.0% |
| $35,000 to $49,999 | 6 | 7.2% |
| $50,000 to $74,999 | 21 | 25.3% |
| $75,000 to $99,999 | 25 | 30.1% |
| $100,000 to $149,999 | 13 | 15.7% |
| $150,000 to $199,999 | 8 | 9.6% |
| $200,000+ | 1 | 1.2% |
Family Income by Famaliy Size in Columbus City
4-person families (25 | 30.1%) account for the highest median family income in Columbus City with $99,375 per family, while 2-person families (41 | 49.4%) have the highest median income of $31,125 per family member.
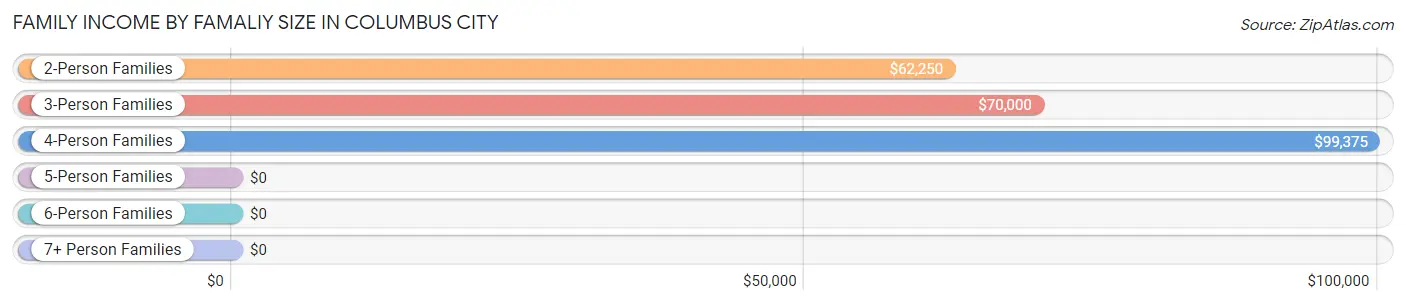
| Income Bracket | # Families | Median Income |
| 2-Person Families | 41 (49.4%) | $62,250 |
| 3-Person Families | 14 (16.9%) | $70,000 |
| 4-Person Families | 25 (30.1%) | $99,375 |
| 5-Person Families | 0 (0.0%) | $0 |
| 6-Person Families | 0 (0.0%) | $0 |
| 7+ Person Families | 3 (3.6%) | $0 |
| Total | 83 (100.0%) | $82,083 |
Family Income by Number of Earners in Columbus City
The median family income in Columbus City is $82,083, with families comprising 3+ earners (19) having the highest median family income of $131,250, while families with no earners (13) have the lowest median family income of $43,125, accounting for 22.9% and 15.7% of families, respectively.
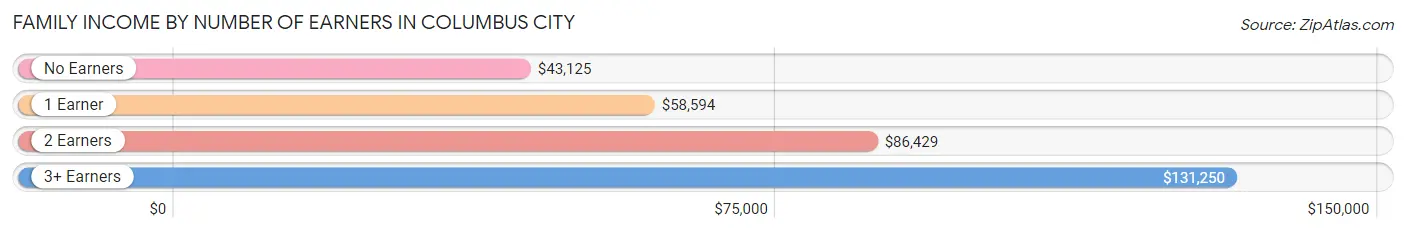
| Number of Earners | # Families | Median Income |
| No Earners | 13 (15.7%) | $43,125 |
| 1 Earner | 19 (22.9%) | $58,594 |
| 2 Earners | 32 (38.6%) | $86,429 |
| 3+ Earners | 19 (22.9%) | $131,250 |
| Total | 83 (100.0%) | $82,083 |
Household Income in Columbus City
Household Income Brackets in Columbus City
With 26 households falling in the category, the $75,000 to $99,999 income range is the most frequent in Columbus City, accounting for 21.7% of all households. In contrast, only 1 households (0.8%) fall into the $10,000 to $14,999 income bracket, making it the least populous group.
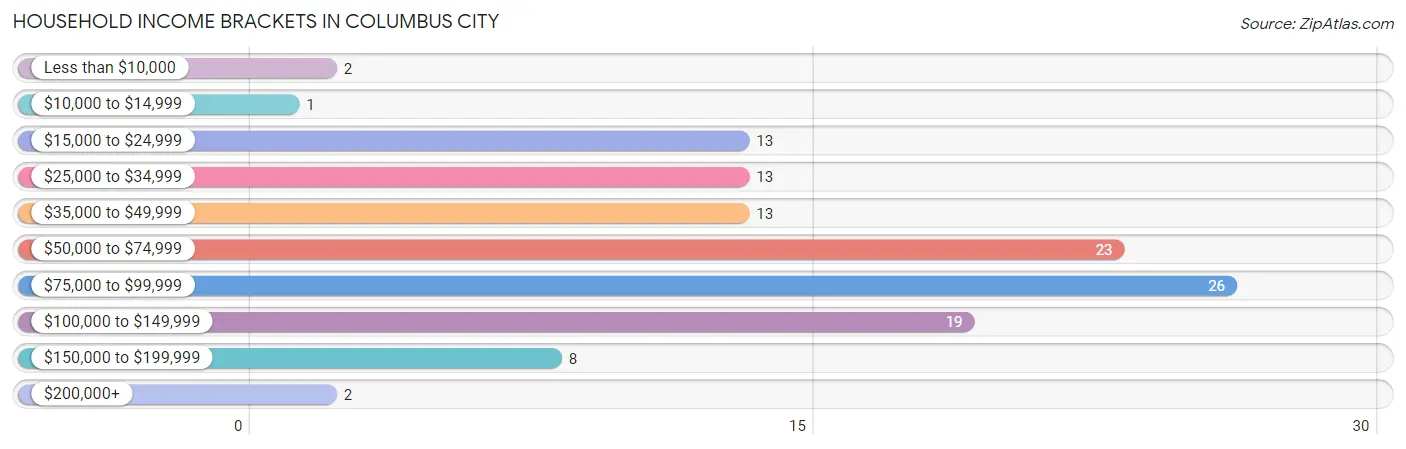
| Income Bracket | # Households | % Households |
| Less than $10,000 | 2 | 1.7% |
| $10,000 to $14,999 | 1 | 0.8% |
| $15,000 to $24,999 | 13 | 10.8% |
| $25,000 to $34,999 | 13 | 10.8% |
| $35,000 to $49,999 | 13 | 10.8% |
| $50,000 to $74,999 | 23 | 19.2% |
| $75,000 to $99,999 | 26 | 21.7% |
| $100,000 to $149,999 | 19 | 15.8% |
| $150,000 to $199,999 | 8 | 6.7% |
| $200,000+ | 2 | 1.7% |
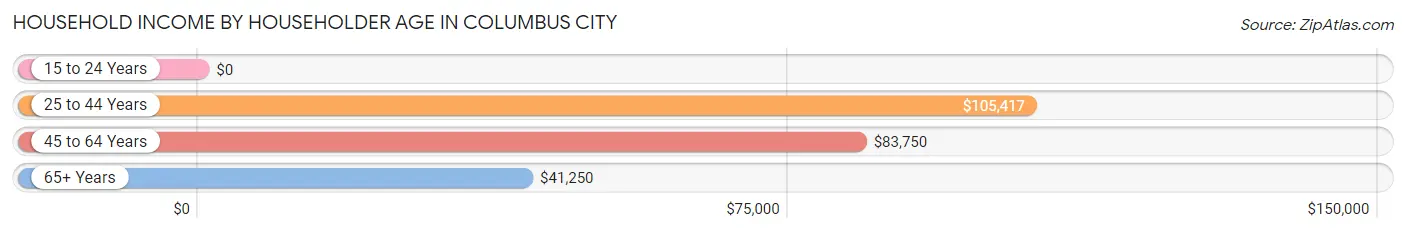
Household Income by Householder Age in Columbus City
The median household income in Columbus City is $63,750, with the highest median household income of $105,417 found in the 25 to 44 years age bracket for the primary householder. A total of 17 households (14.2%) fall into this category.
| Income Bracket | # Households | Median Income |
| 15 to 24 Years | 0 (0.0%) | $0 |
| 25 to 44 Years | 17 (14.2%) | $105,417 |
| 45 to 64 Years | 62 (51.7%) | $83,750 |
| 65+ Years | 41 (34.2%) | $41,250 |
| Total | 120 (100.0%) | $63,750 |
Poverty in Columbus City
Income Below Poverty by Sex and Age in Columbus City
With 2.6% poverty level for males and 6.5% for females among the residents of Columbus City, 75 year old and over males and 16 and 17 year old females are the most vulnerable to poverty, with 2 males (16.7%) and 1 females (33.3%) in their respective age groups living below the poverty level.
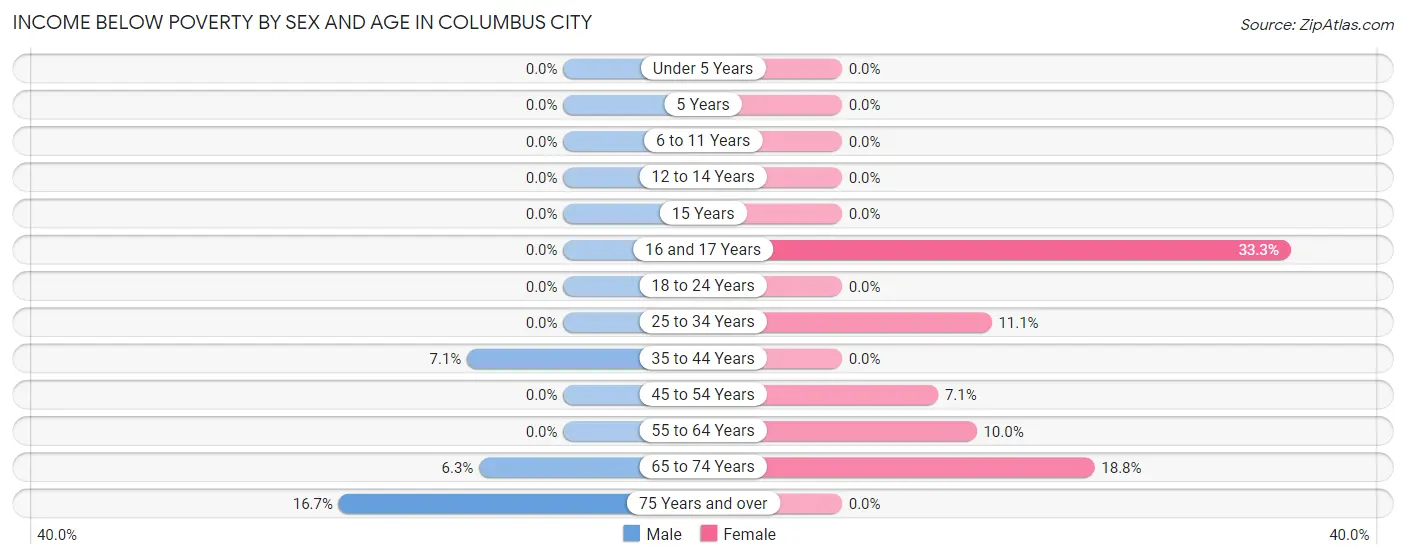
| Age Bracket | Male | Female |
| Under 5 Years | 0 (0.0%) | 0 (0.0%) |
| 5 Years | 0 (0.0%) | 0 (0.0%) |
| 6 to 11 Years | 0 (0.0%) | 0 (0.0%) |
| 12 to 14 Years | 0 (0.0%) | 0 (0.0%) |
| 15 Years | 0 (0.0%) | 0 (0.0%) |
| 16 and 17 Years | 0 (0.0%) | 1 (33.3%) |
| 18 to 24 Years | 0 (0.0%) | 0 (0.0%) |
| 25 to 34 Years | 0 (0.0%) | 1 (11.1%) |
| 35 to 44 Years | 1 (7.1%) | 0 (0.0%) |
| 45 to 54 Years | 0 (0.0%) | 1 (7.1%) |
| 55 to 64 Years | 0 (0.0%) | 2 (10.0%) |
| 65 to 74 Years | 1 (6.2%) | 3 (18.8%) |
| 75 Years and over | 2 (16.7%) | 0 (0.0%) |
| Total | 4 (2.6%) | 8 (6.5%) |
Income Above Poverty by Sex and Age in Columbus City
According to the poverty statistics in Columbus City, males aged under 5 years and females aged under 5 years are the age groups that are most secure financially, with 100.0% of males and 100.0% of females in these age groups living above the poverty line.
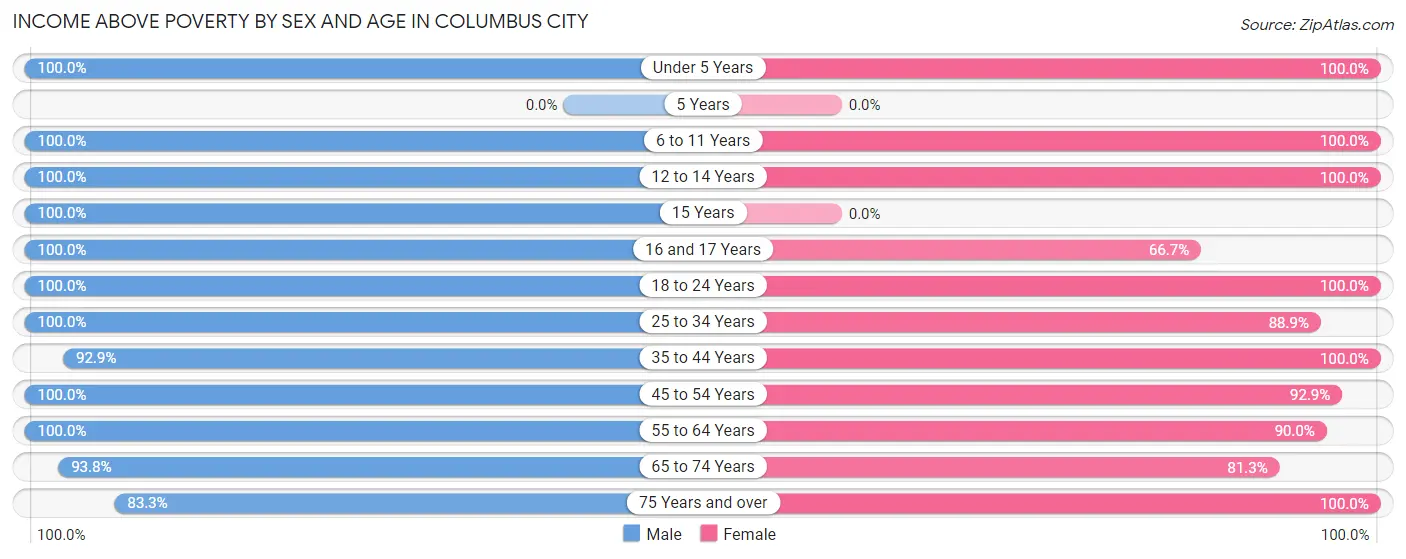
| Age Bracket | Male | Female |
| Under 5 Years | 2 (100.0%) | 4 (100.0%) |
| 5 Years | 0 (0.0%) | 0 (0.0%) |
| 6 to 11 Years | 5 (100.0%) | 6 (100.0%) |
| 12 to 14 Years | 2 (100.0%) | 10 (100.0%) |
| 15 Years | 2 (100.0%) | 0 (0.0%) |
| 16 and 17 Years | 4 (100.0%) | 2 (66.7%) |
| 18 to 24 Years | 15 (100.0%) | 6 (100.0%) |
| 25 to 34 Years | 14 (100.0%) | 8 (88.9%) |
| 35 to 44 Years | 13 (92.9%) | 16 (100.0%) |
| 45 to 54 Years | 12 (100.0%) | 13 (92.9%) |
| 55 to 64 Years | 53 (100.0%) | 18 (90.0%) |
| 65 to 74 Years | 15 (93.8%) | 13 (81.2%) |
| 75 Years and over | 10 (83.3%) | 19 (100.0%) |
| Total | 147 (97.4%) | 115 (93.5%) |
Income Below Poverty Among Married-Couple Families in Columbus City
The poverty statistics for married-couple families in Columbus City show that 4.3% or 3 of the total 70 families live below the poverty line. Families with 1 or 2 children have the highest poverty rate of 6.2%, comprising of 1 families. On the other hand, families with 3 or 4 children have the lowest poverty rate of 0.0%, which includes 0 families.
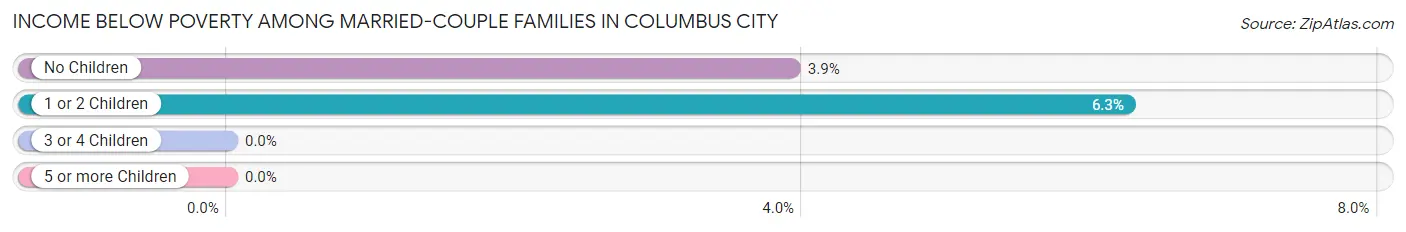
| Children | Above Poverty | Below Poverty |
| No Children | 49 (96.1%) | 2 (3.9%) |
| 1 or 2 Children | 15 (93.8%) | 1 (6.2%) |
| 3 or 4 Children | 3 (100.0%) | 0 (0.0%) |
| 5 or more Children | 0 (0.0%) | 0 (0.0%) |
| Total | 67 (95.7%) | 3 (4.3%) |
Income Below Poverty Among Single-Parent Households in Columbus City
| Children | Single Father | Single Mother |
| No Children | 0 (0.0%) | 0 (0.0%) |
| 1 or 2 Children | 0 (0.0%) | 0 (0.0%) |
| 3 or 4 Children | 0 (0.0%) | 0 (0.0%) |
| 5 or more Children | 0 (0.0%) | 0 (0.0%) |
| Total | 0 (0.0%) | 0 (0.0%) |
Income Below Poverty Among Married-Couple vs Single-Parent Households in Columbus City
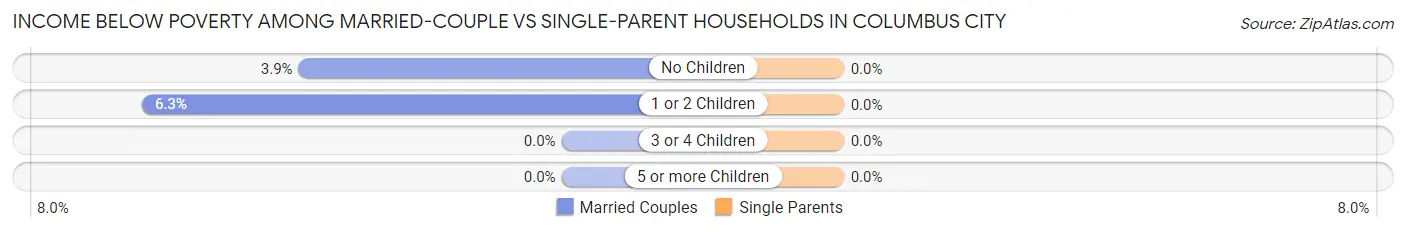
| Children | Married-Couple Families | Single-Parent Households |
| No Children | 2 (3.9%) | 0 (0.0%) |
| 1 or 2 Children | 1 (6.2%) | 0 (0.0%) |
| 3 or 4 Children | 0 (0.0%) | 0 (0.0%) |
| 5 or more Children | 0 (0.0%) | 0 (0.0%) |
| Total | 3 (4.3%) | 0 (0.0%) |
Race in Columbus City
The most populous races in Columbus City are White / Caucasian (161 | 58.8%), Hispanic or Latino (128 | 46.7%), and Some other Race (104 | 38.0%).
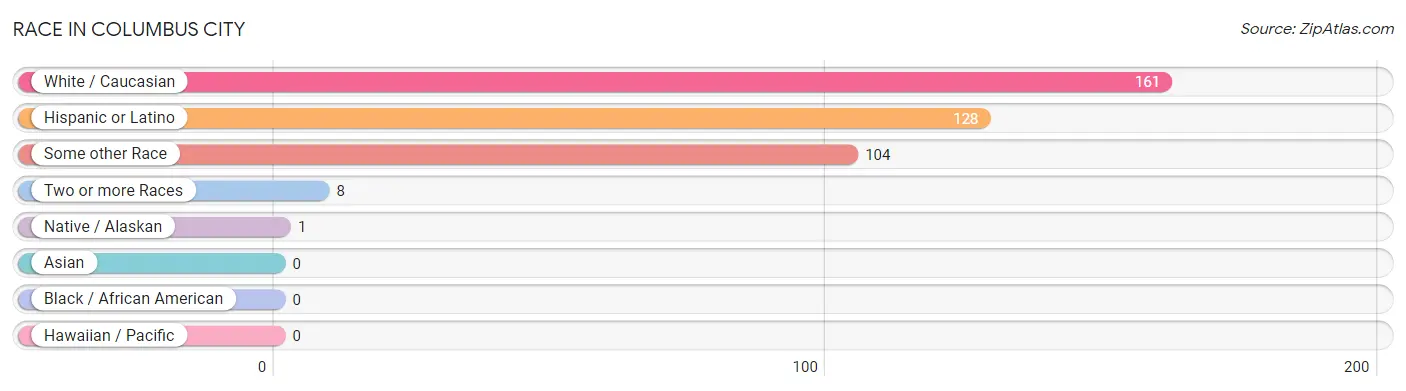
| Race | # Population | % Population |
| Asian | 0 | 0.0% |
| Black / African American | 0 | 0.0% |
| Hawaiian / Pacific | 0 | 0.0% |
| Hispanic or Latino | 128 | 46.7% |
| Native / Alaskan | 1 | 0.4% |
| White / Caucasian | 161 | 58.8% |
| Two or more Races | 8 | 2.9% |
| Some other Race | 104 | 38.0% |
| Total | 274 | 100.0% |
Ancestry in Columbus City
The most populous ancestries reported in Columbus City are Mexican (114 | 41.6%), German (40 | 14.6%), English (20 | 7.3%), Irish (16 | 5.8%), and American (12 | 4.4%), together accounting for 73.7% of all Columbus City residents.
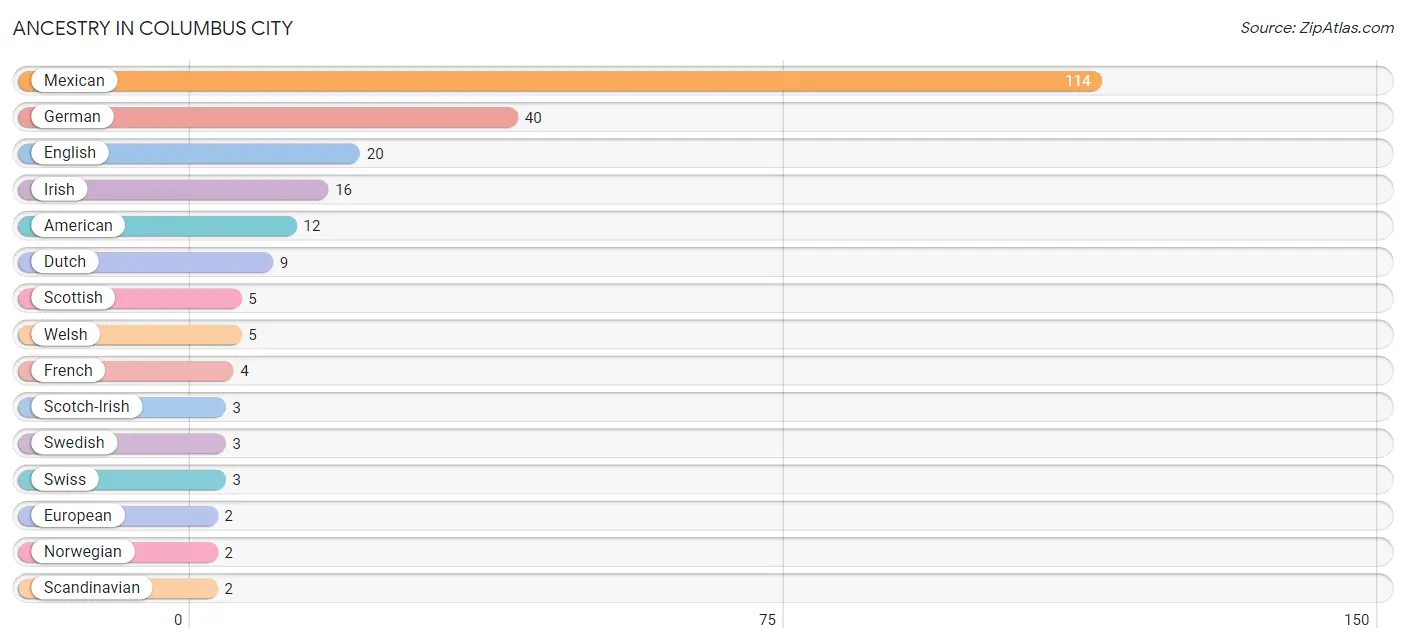
| Ancestry | # Population | % Population |
| American | 12 | 4.4% |
| Dutch | 9 | 3.3% |
| English | 20 | 7.3% |
| European | 2 | 0.7% |
| French | 4 | 1.5% |
| German | 40 | 14.6% |
| Greek | 1 | 0.4% |
| Irish | 16 | 5.8% |
| Mexican | 114 | 41.6% |
| Norwegian | 2 | 0.7% |
| Polish | 1 | 0.4% |
| Scandinavian | 2 | 0.7% |
| Scotch-Irish | 3 | 1.1% |
| Scottish | 5 | 1.8% |
| Swedish | 3 | 1.1% |
| Swiss | 3 | 1.1% |
| Welsh | 5 | 1.8% | View All 17 Rows |
Immigrants in Columbus City
The most numerous immigrant groups reported in Columbus City came from Central America (52 | 19.0%), Latin America (52 | 19.0%), Mexico (52 | 19.0%), Asia (2 | 0.7%), and Philippines (2 | 0.7%), together accounting for 58.4% of all Columbus City residents.
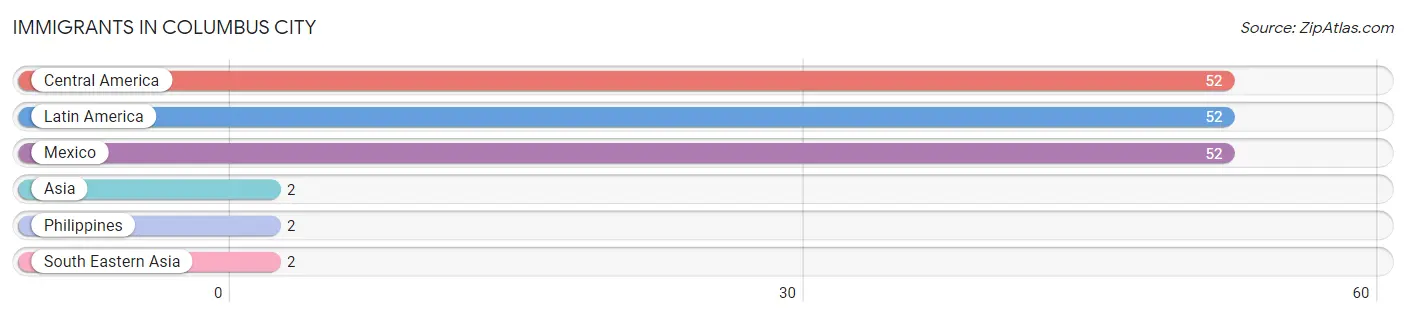
| Immigration Origin | # Population | % Population |
| Asia | 2 | 0.7% |
| Central America | 52 | 19.0% |
| Latin America | 52 | 19.0% |
| Mexico | 52 | 19.0% |
| Philippines | 2 | 0.7% |
| South Eastern Asia | 2 | 0.7% | View All 6 Rows |
Sex and Age in Columbus City
Sex and Age in Columbus City
The most populous age groups in Columbus City are 55 to 59 Years (35 | 23.2%) for men and 10 to 14 Years (15 | 12.2%) for women.
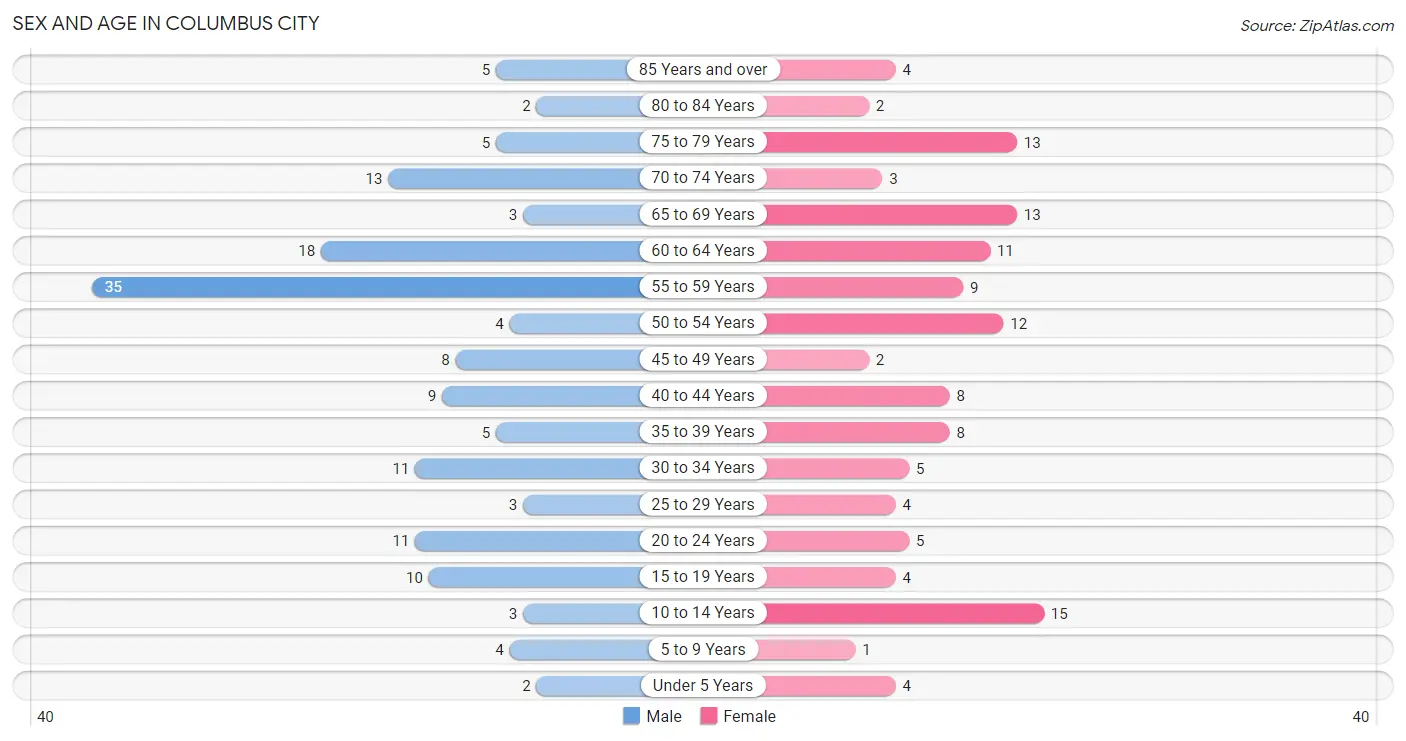
| Age Bracket | Male | Female |
| Under 5 Years | 2 (1.3%) | 4 (3.3%) |
| 5 to 9 Years | 4 (2.6%) | 1 (0.8%) |
| 10 to 14 Years | 3 (2.0%) | 15 (12.2%) |
| 15 to 19 Years | 10 (6.6%) | 4 (3.3%) |
| 20 to 24 Years | 11 (7.3%) | 5 (4.1%) |
| 25 to 29 Years | 3 (2.0%) | 4 (3.3%) |
| 30 to 34 Years | 11 (7.3%) | 5 (4.1%) |
| 35 to 39 Years | 5 (3.3%) | 8 (6.5%) |
| 40 to 44 Years | 9 (6.0%) | 8 (6.5%) |
| 45 to 49 Years | 8 (5.3%) | 2 (1.6%) |
| 50 to 54 Years | 4 (2.6%) | 12 (9.8%) |
| 55 to 59 Years | 35 (23.2%) | 9 (7.3%) |
| 60 to 64 Years | 18 (11.9%) | 11 (8.9%) |
| 65 to 69 Years | 3 (2.0%) | 13 (10.6%) |
| 70 to 74 Years | 13 (8.6%) | 3 (2.4%) |
| 75 to 79 Years | 5 (3.3%) | 13 (10.6%) |
| 80 to 84 Years | 2 (1.3%) | 2 (1.6%) |
| 85 Years and over | 5 (3.3%) | 4 (3.3%) |
| Total | 151 (100.0%) | 123 (100.0%) |
Families and Households in Columbus City
Median Family Size in Columbus City
The median family size in Columbus City is 2.75 persons per family, with single female/mother families (2 | 2.4%) accounting for the largest median family size of 8 persons per family. On the other hand, single male/father families (11 | 13.3%) represent the smallest median family size with 2.45 persons per family.
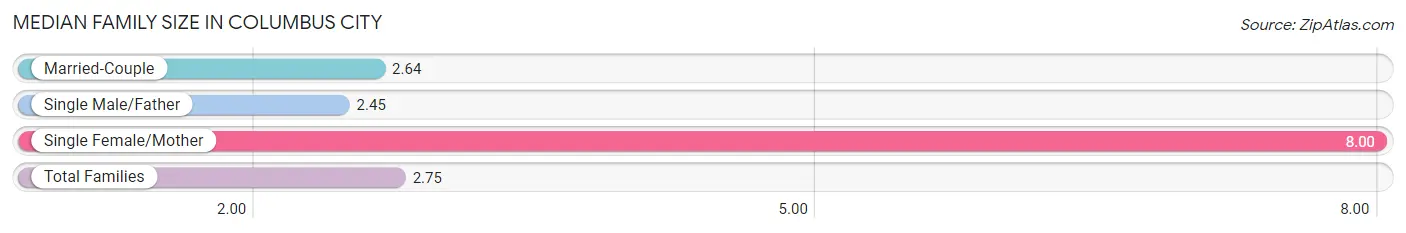
| Family Type | # Families | Family Size |
| Married-Couple | 70 (84.3%) | 2.64 |
| Single Male/Father | 11 (13.3%) | 2.45 |
| Single Female/Mother | 2 (2.4%) | 8.00 |
| Total Families | 83 (100.0%) | 2.75 |
Median Household Size in Columbus City
The median household size in Columbus City is 2.28 persons per household, with single female/mother households (2 | 1.7%) accounting for the largest median household size of 8.5 persons per household. non-family households (37 | 30.8%) represent the smallest median household size with 1.14 persons per household.
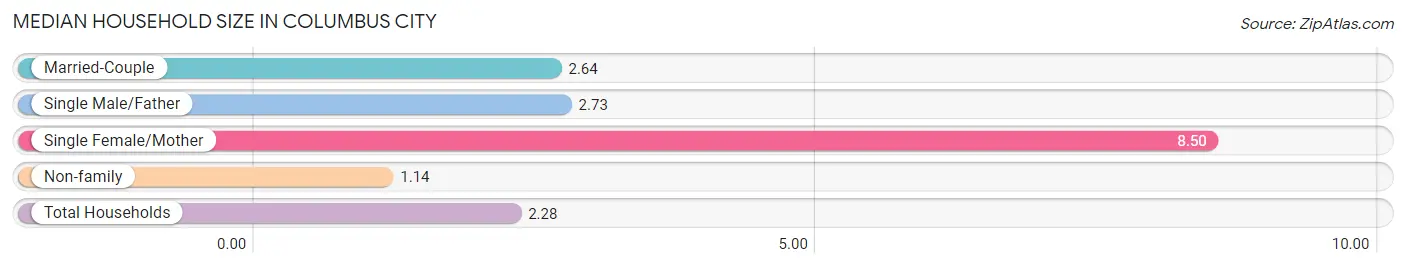
| Household Type | # Households | Household Size |
| Married-Couple | 70 (58.3%) | 2.64 |
| Single Male/Father | 11 (9.2%) | 2.73 |
| Single Female/Mother | 2 (1.7%) | 8.50 |
| Non-family | 37 (30.8%) | 1.14 |
| Total Households | 120 (100.0%) | 2.28 |
Household Size by Marriage Status in Columbus City
Out of a total of 120 households in Columbus City, 83 (69.2%) are family households, while 37 (30.8%) are nonfamily households. The most numerous type of family households are 2-person households, comprising 41, and the most common type of nonfamily households are 1-person households, comprising 32.
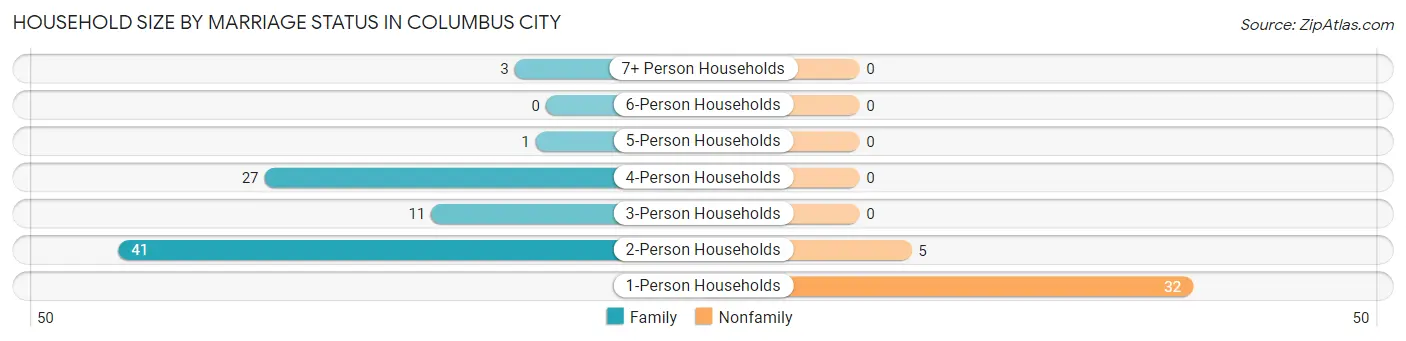
| Household Size | Family Households | Nonfamily Households |
| 1-Person Households | - | 32 (26.7%) |
| 2-Person Households | 41 (34.2%) | 5 (4.2%) |
| 3-Person Households | 11 (9.2%) | 0 (0.0%) |
| 4-Person Households | 27 (22.5%) | 0 (0.0%) |
| 5-Person Households | 1 (0.8%) | 0 (0.0%) |
| 6-Person Households | 0 (0.0%) | 0 (0.0%) |
| 7+ Person Households | 3 (2.5%) | 0 (0.0%) |
| Total | 83 (69.2%) | 37 (30.8%) |
Female Fertility in Columbus City
Fertility by Age in Columbus City
| Age Bracket | Women with Births | Births / 1,000 Women |
| 15 to 19 years | 0 (0.0%) | 0.0 |
| 20 to 34 years | 0 (0.0%) | 0.0 |
| 35 to 50 years | 0 (0.0%) | 0.0 |
| Total | 0 (0.0%) | 0.0 |
Fertility by Age by Marriage Status in Columbus City
| Age Bracket | Married | Unmarried |
| 15 to 19 years | 0 (0.0%) | 0 (0.0%) |
| 20 to 34 years | 0 (0.0%) | 0 (0.0%) |
| 35 to 50 years | 0 (0.0%) | 0 (0.0%) |
| Total | 0 (0.0%) | 0 (0.0%) |
Fertility by Education in Columbus City
| Educational Attainment | Women with Births | Births / 1,000 Women |
| Less than High School | 0 (0.0%) | 0.0 |
| High School Diploma | 0 (0.0%) | 0.0 |
| College or Associate's Degree | 0 (0.0%) | 0.0 |
| Bachelor's Degree | 0 (0.0%) | 0.0 |
| Graduate Degree | 0 (0.0%) | 0.0 |
| Total | 0 (0.0%) | 0.0 |
Fertility by Education by Marriage Status in Columbus City
| Educational Attainment | Married | Unmarried |
| Less than High School | 0 (0.0%) | 0 (0.0%) |
| High School Diploma | 0 (0.0%) | 0 (0.0%) |
| College or Associate's Degree | 0 (0.0%) | 0 (0.0%) |
| Bachelor's Degree | 0 (0.0%) | 0 (0.0%) |
| Graduate Degree | 0 (0.0%) | 0 (0.0%) |
| Total | 0 (0.0%) | 0 (0.0%) |
Employment Characteristics in Columbus City
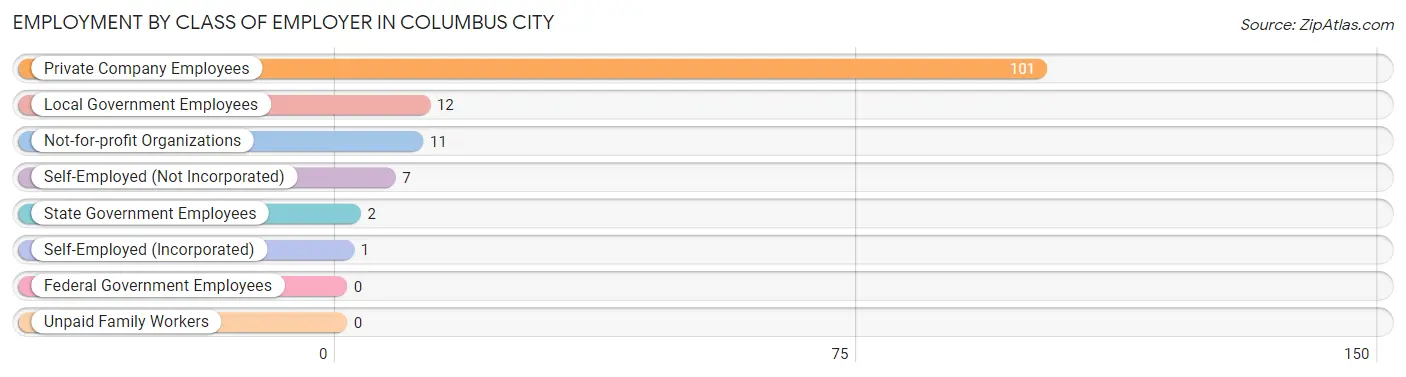
Employment by Class of Employer in Columbus City
Among the 134 employed individuals in Columbus City, private company employees (101 | 75.4%), local government employees (12 | 9.0%), and not-for-profit organizations (11 | 8.2%) make up the most common classes of employment.
| Employer Class | # Employees | % Employees |
| Private Company Employees | 101 | 75.4% |
| Self-Employed (Incorporated) | 1 | 0.7% |
| Self-Employed (Not Incorporated) | 7 | 5.2% |
| Not-for-profit Organizations | 11 | 8.2% |
| Local Government Employees | 12 | 9.0% |
| State Government Employees | 2 | 1.5% |
| Federal Government Employees | 0 | 0.0% |
| Unpaid Family Workers | 0 | 0.0% |
| Total | 134 | 100.0% |
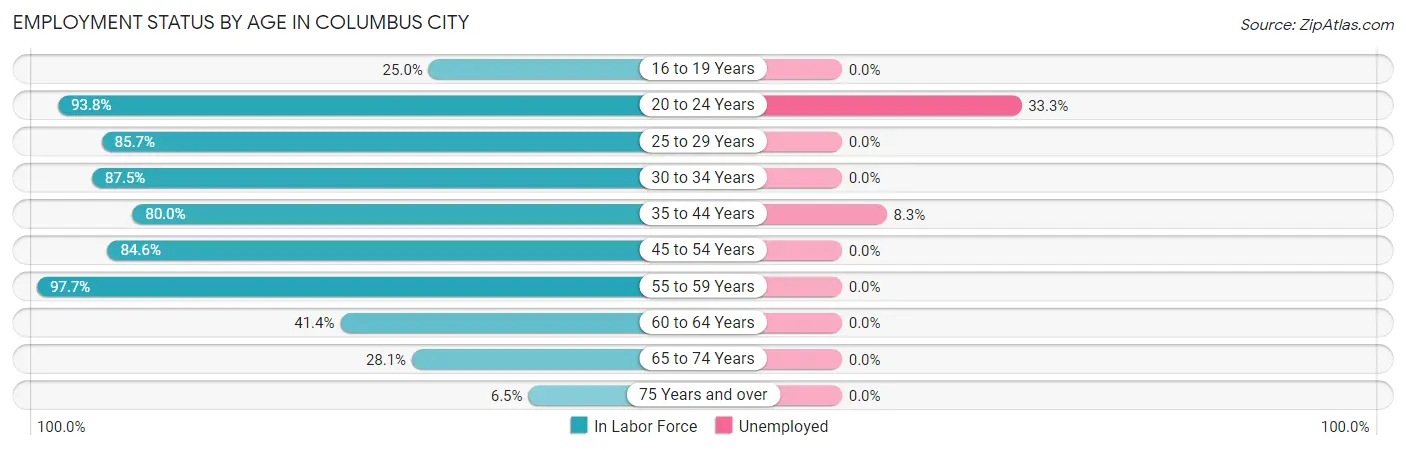
Employment Status by Age in Columbus City
According to the labor force statistics for Columbus City, out of the total population over 16 years of age (243), 61.7% or 150 individuals are in the labor force, with 4.7% or 7 of them unemployed. The age group with the highest labor force participation rate is 55 to 59 years, with 97.7% or 43 individuals in the labor force. Within the labor force, the 20 to 24 years age range has the highest percentage of unemployed individuals, with 33.3% or 5 of them being unemployed.
| Age Bracket | In Labor Force | Unemployed |
| 16 to 19 Years | 3 (25.0%) | 0 (0.0%) |
| 20 to 24 Years | 15 (93.8%) | 5 (33.3%) |
| 25 to 29 Years | 6 (85.7%) | 0 (0.0%) |
| 30 to 34 Years | 14 (87.5%) | 0 (0.0%) |
| 35 to 44 Years | 24 (80.0%) | 2 (8.3%) |
| 45 to 54 Years | 22 (84.6%) | 0 (0.0%) |
| 55 to 59 Years | 43 (97.7%) | 0 (0.0%) |
| 60 to 64 Years | 12 (41.4%) | 0 (0.0%) |
| 65 to 74 Years | 9 (28.1%) | 0 (0.0%) |
| 75 Years and over | 2 (6.5%) | 0 (0.0%) |
| Total | 150 (61.7%) | 7 (4.7%) |
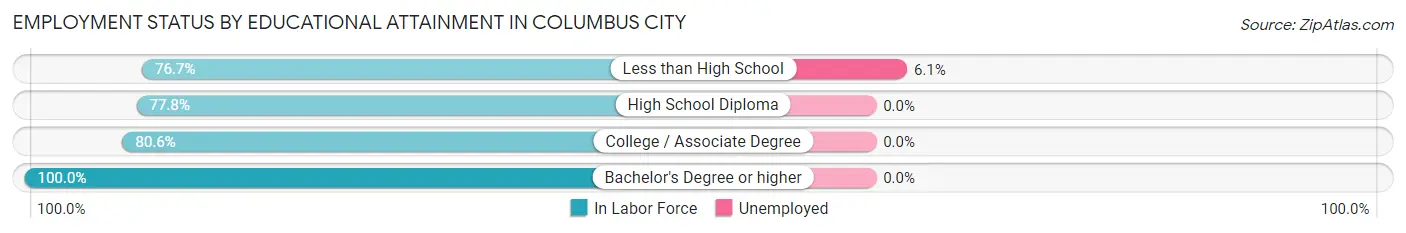
Employment Status by Educational Attainment in Columbus City
According to labor force statistics for Columbus City, 79.6% of individuals (121) out of the total population between 25 and 64 years of age (152) are in the labor force, with 1.7% or 2 of them being unemployed. The group with the highest labor force participation rate are those with the educational attainment of bachelor's degree or higher, with 100.0% or 10 individuals in the labor force. Within the labor force, individuals with less than high school education have the highest percentage of unemployment, with 6.1% or 2 of them being unemployed.
| Educational Attainment | In Labor Force | Unemployed |
| Less than High School | 33 (76.7%) | 3 (6.1%) |
| High School Diploma | 49 (77.8%) | 0 (0.0%) |
| College / Associate Degree | 29 (80.6%) | 0 (0.0%) |
| Bachelor's Degree or higher | 10 (100.0%) | 0 (0.0%) |
| Total | 121 (79.6%) | 3 (1.7%) |
Employment Occupations by Sex in Columbus City
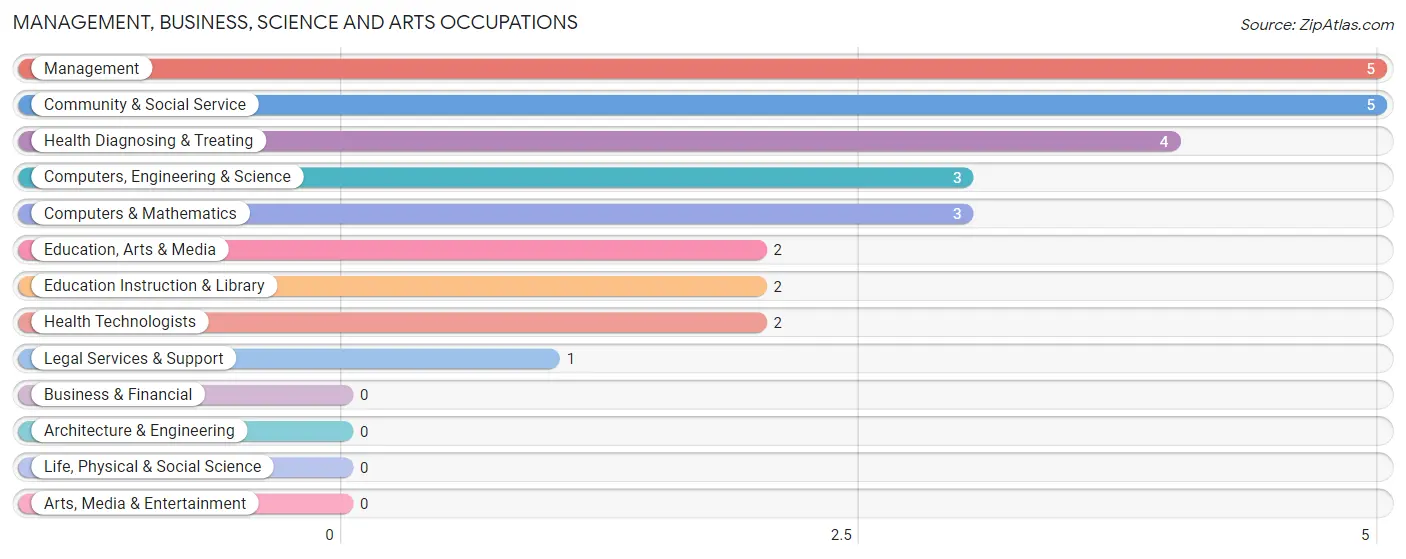
Management, Business, Science and Arts Occupations
The most common Management, Business, Science and Arts occupations in Columbus City are Management (5 | 3.5%), Community & Social Service (5 | 3.5%), Health Diagnosing & Treating (4 | 2.8%), Computers, Engineering & Science (3 | 2.1%), and Computers & Mathematics (3 | 2.1%).
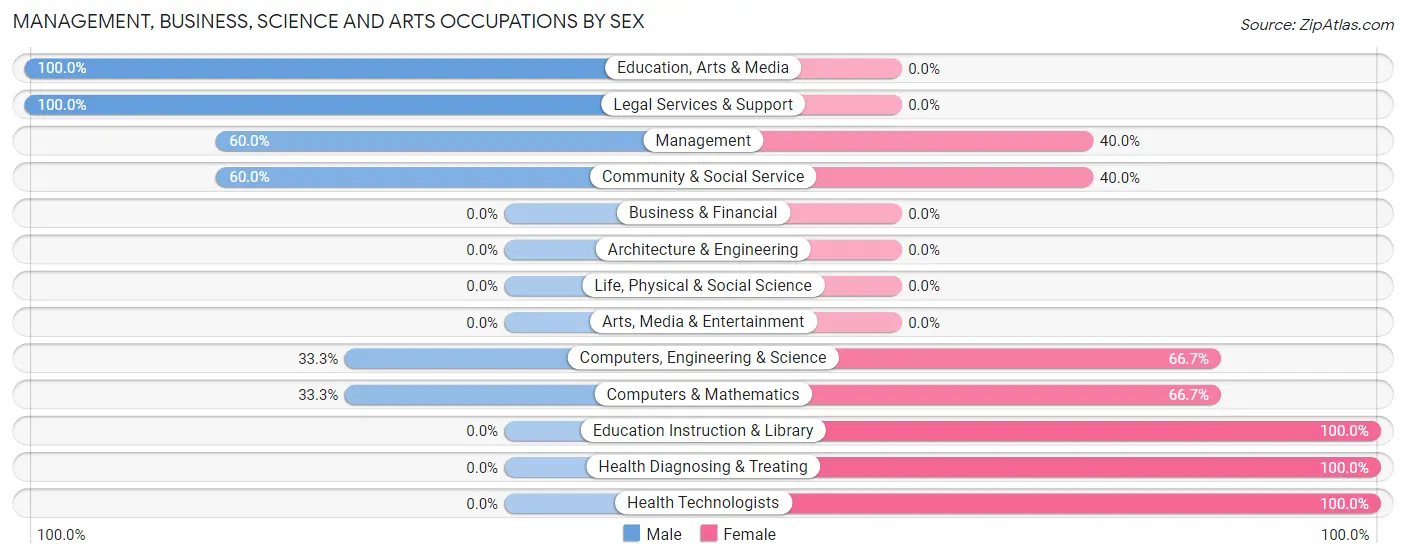
Management, Business, Science and Arts Occupations by Sex
Within the Management, Business, Science and Arts occupations in Columbus City, the most male-oriented occupations are Education, Arts & Media (100.0%), Legal Services & Support (100.0%), and Management (60.0%), while the most female-oriented occupations are Education Instruction & Library (100.0%), Health Diagnosing & Treating (100.0%), and Health Technologists (100.0%).
| Occupation | Male | Female |
| Management | 3 (60.0%) | 2 (40.0%) |
| Business & Financial | 0 (0.0%) | 0 (0.0%) |
| Computers, Engineering & Science | 1 (33.3%) | 2 (66.7%) |
| Computers & Mathematics | 1 (33.3%) | 2 (66.7%) |
| Architecture & Engineering | 0 (0.0%) | 0 (0.0%) |
| Life, Physical & Social Science | 0 (0.0%) | 0 (0.0%) |
| Community & Social Service | 3 (60.0%) | 2 (40.0%) |
| Education, Arts & Media | 2 (100.0%) | 0 (0.0%) |
| Legal Services & Support | 1 (100.0%) | 0 (0.0%) |
| Education Instruction & Library | 0 (0.0%) | 2 (100.0%) |
| Arts, Media & Entertainment | 0 (0.0%) | 0 (0.0%) |
| Health Diagnosing & Treating | 0 (0.0%) | 4 (100.0%) |
| Health Technologists | 0 (0.0%) | 2 (100.0%) |
| Total (Category) | 7 (41.2%) | 10 (58.8%) |
| Total (Overall) | 94 (65.7%) | 49 (34.3%) |
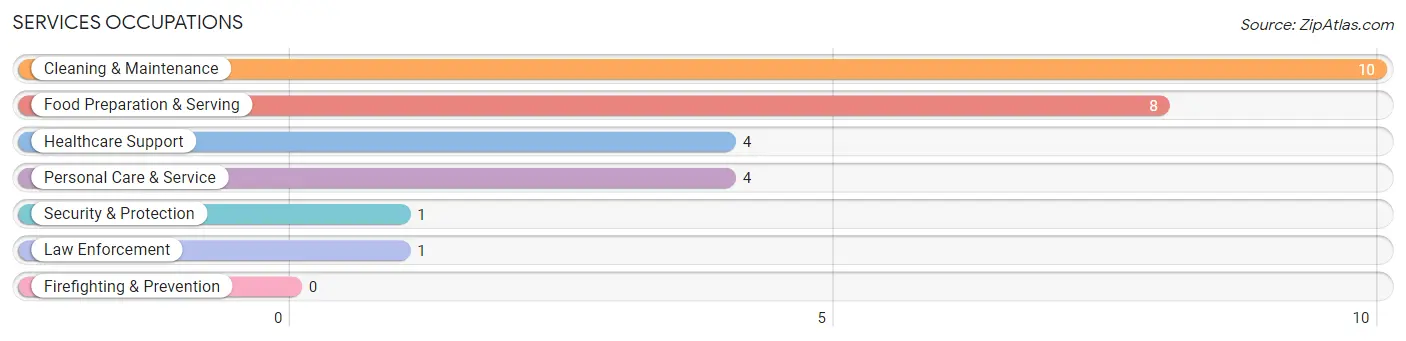
Services Occupations
The most common Services occupations in Columbus City are Cleaning & Maintenance (10 | 7.0%), Food Preparation & Serving (8 | 5.6%), Healthcare Support (4 | 2.8%), Personal Care & Service (4 | 2.8%), and Security & Protection (1 | 0.7%).
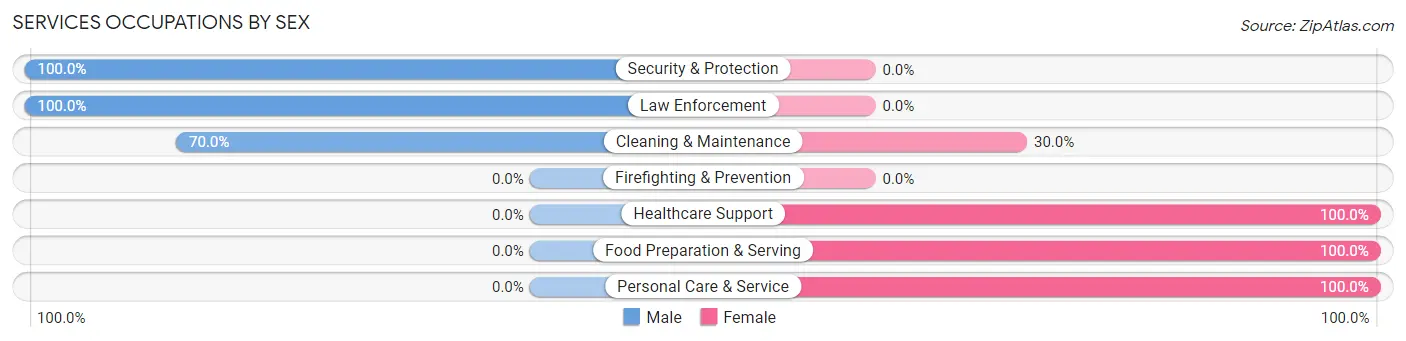
Services Occupations by Sex
Within the Services occupations in Columbus City, the most male-oriented occupations are Security & Protection (100.0%), Law Enforcement (100.0%), and Cleaning & Maintenance (70.0%), while the most female-oriented occupations are Healthcare Support (100.0%), Food Preparation & Serving (100.0%), and Personal Care & Service (100.0%).
| Occupation | Male | Female |
| Healthcare Support | 0 (0.0%) | 4 (100.0%) |
| Security & Protection | 1 (100.0%) | 0 (0.0%) |
| Firefighting & Prevention | 0 (0.0%) | 0 (0.0%) |
| Law Enforcement | 1 (100.0%) | 0 (0.0%) |
| Food Preparation & Serving | 0 (0.0%) | 8 (100.0%) |
| Cleaning & Maintenance | 7 (70.0%) | 3 (30.0%) |
| Personal Care & Service | 0 (0.0%) | 4 (100.0%) |
| Total (Category) | 8 (29.6%) | 19 (70.4%) |
| Total (Overall) | 94 (65.7%) | 49 (34.3%) |
Sales and Office Occupations
The most common Sales and Office occupations in Columbus City are Office & Administration (8 | 5.6%), and Sales & Related (3 | 2.1%).
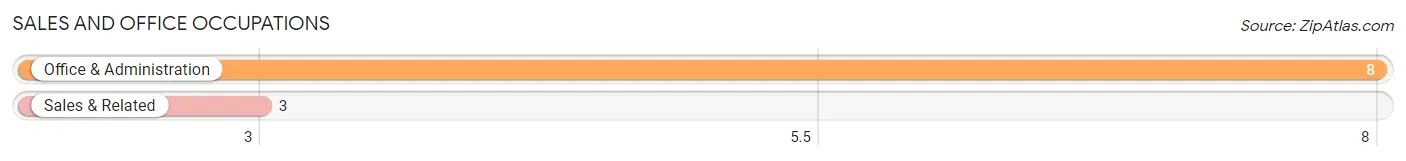
Sales and Office Occupations by Sex

| Occupation | Male | Female |
| Sales & Related | 2 (66.7%) | 1 (33.3%) |
| Office & Administration | 0 (0.0%) | 8 (100.0%) |
| Total (Category) | 2 (18.2%) | 9 (81.8%) |
| Total (Overall) | 94 (65.7%) | 49 (34.3%) |
Natural Resources, Construction and Maintenance Occupations
The most common Natural Resources, Construction and Maintenance occupations in Columbus City are Construction & Extraction (13 | 9.1%), Installation, Maintenance & Repair (11 | 7.7%), and Farming, Fishing & Forestry (9 | 6.3%).

Natural Resources, Construction and Maintenance Occupations by Sex

| Occupation | Male | Female |
| Farming, Fishing & Forestry | 9 (100.0%) | 0 (0.0%) |
| Construction & Extraction | 13 (100.0%) | 0 (0.0%) |
| Installation, Maintenance & Repair | 11 (100.0%) | 0 (0.0%) |
| Total (Category) | 33 (100.0%) | 0 (0.0%) |
| Total (Overall) | 94 (65.7%) | 49 (34.3%) |
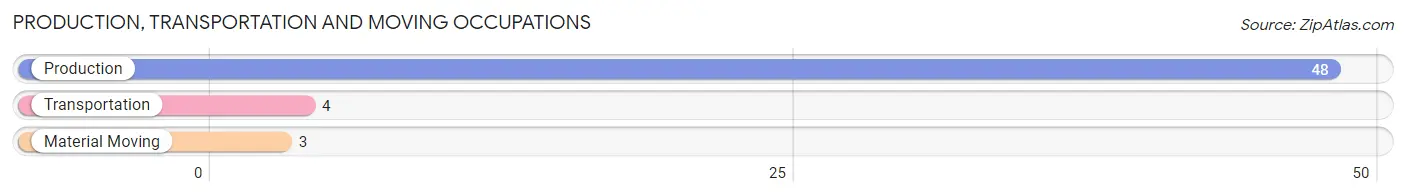
Production, Transportation and Moving Occupations
The most common Production, Transportation and Moving occupations in Columbus City are Production (48 | 33.6%), Transportation (4 | 2.8%), and Material Moving (3 | 2.1%).
Production, Transportation and Moving Occupations by Sex
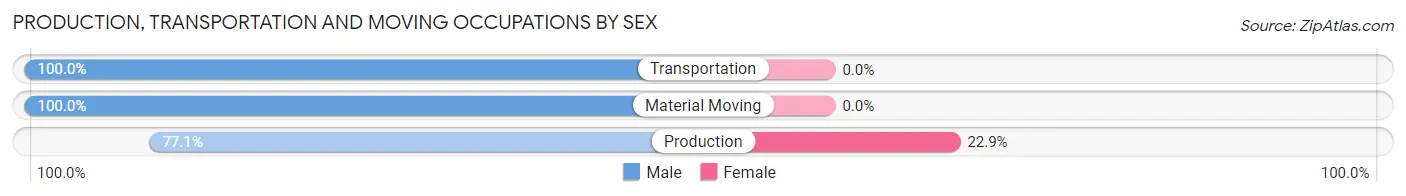
| Occupation | Male | Female |
| Production | 37 (77.1%) | 11 (22.9%) |
| Transportation | 4 (100.0%) | 0 (0.0%) |
| Material Moving | 3 (100.0%) | 0 (0.0%) |
| Total (Category) | 44 (80.0%) | 11 (20.0%) |
| Total (Overall) | 94 (65.7%) | 49 (34.3%) |
Employment Industries by Sex in Columbus City
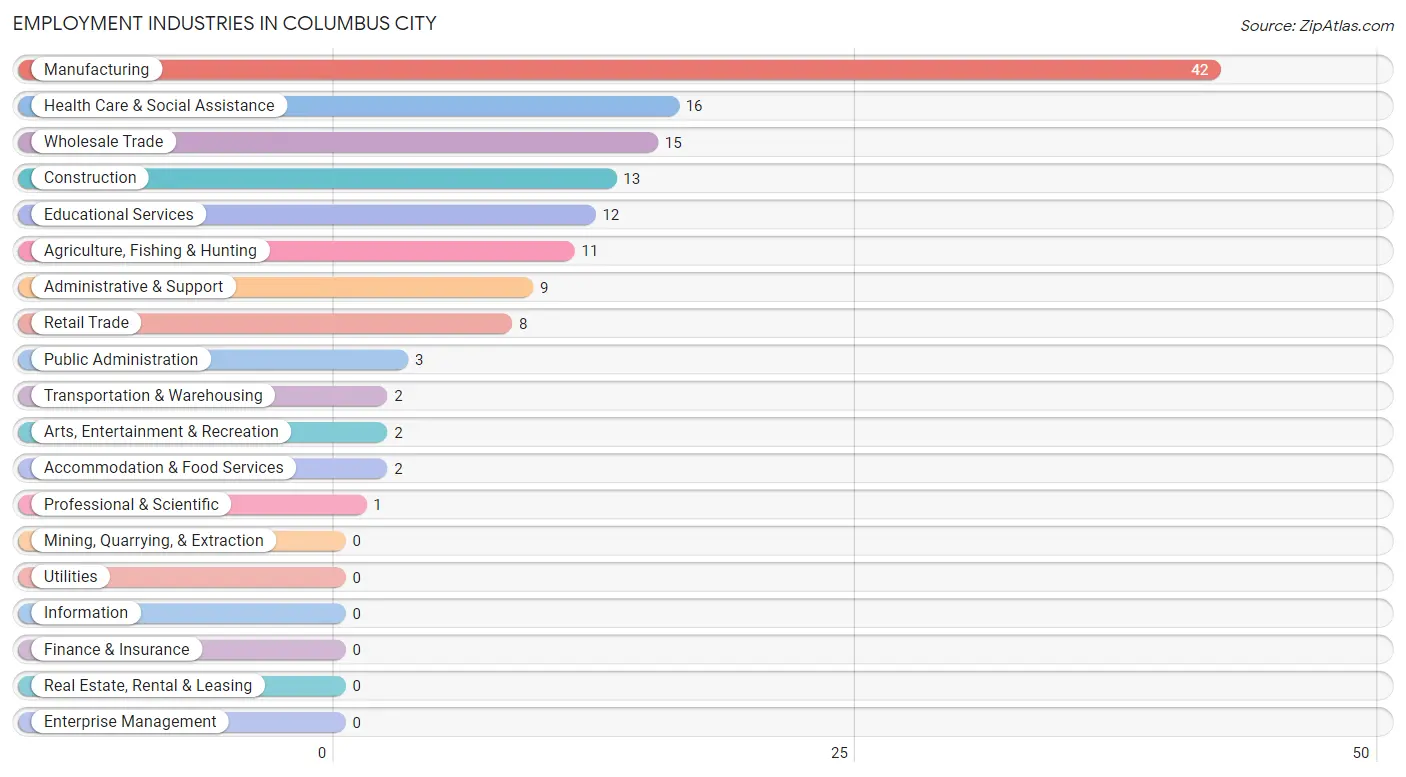
Employment Industries in Columbus City
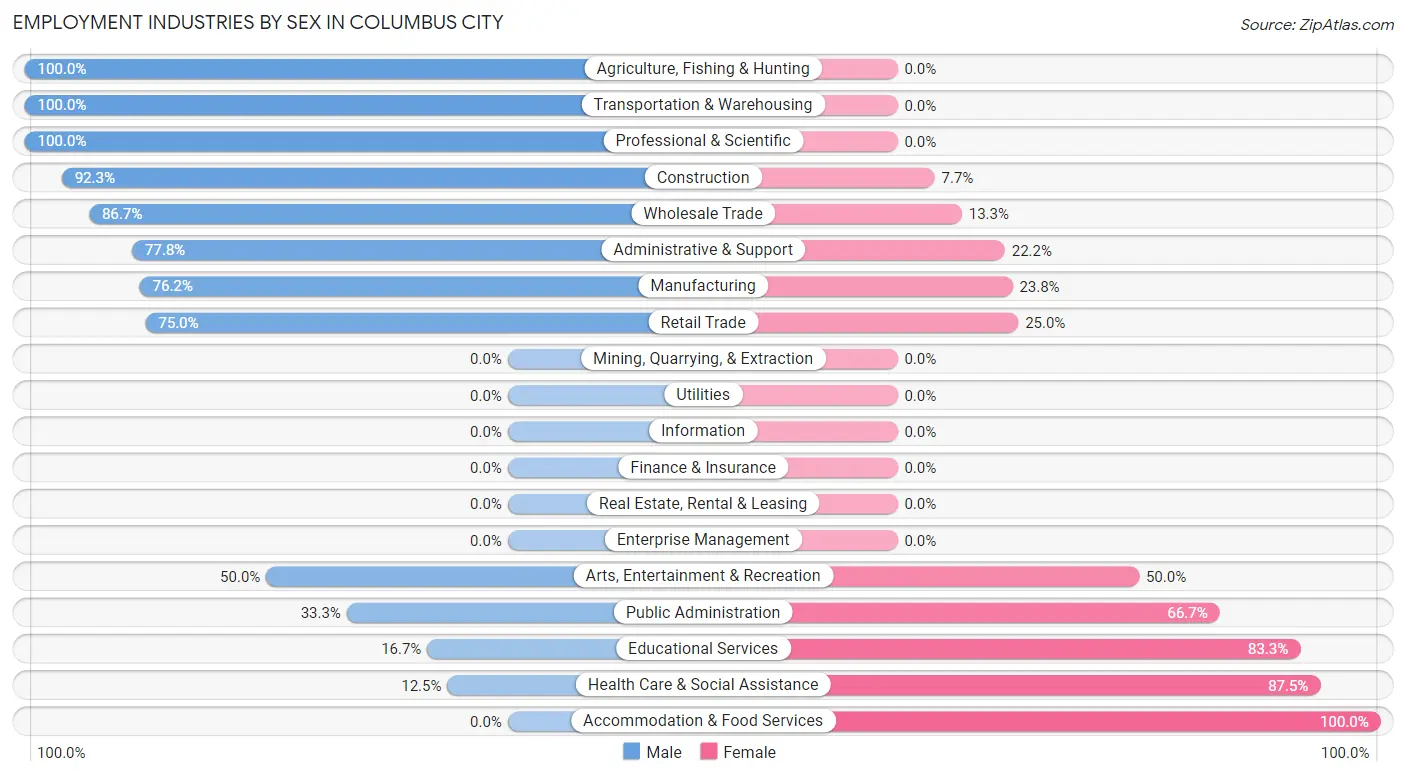
The major employment industries in Columbus City include Manufacturing (42 | 29.4%), Health Care & Social Assistance (16 | 11.2%), Wholesale Trade (15 | 10.5%), Construction (13 | 9.1%), and Educational Services (12 | 8.4%).
Employment Industries by Sex in Columbus City
The Columbus City industries that see more men than women are Agriculture, Fishing & Hunting (100.0%), Transportation & Warehousing (100.0%), and Professional & Scientific (100.0%), whereas the industries that tend to have a higher number of women are Accommodation & Food Services (100.0%), Health Care & Social Assistance (87.5%), and Educational Services (83.3%).
| Industry | Male | Female |
| Agriculture, Fishing & Hunting | 11 (100.0%) | 0 (0.0%) |
| Mining, Quarrying, & Extraction | 0 (0.0%) | 0 (0.0%) |
| Construction | 12 (92.3%) | 1 (7.7%) |
| Manufacturing | 32 (76.2%) | 10 (23.8%) |
| Wholesale Trade | 13 (86.7%) | 2 (13.3%) |
| Retail Trade | 6 (75.0%) | 2 (25.0%) |
| Transportation & Warehousing | 2 (100.0%) | 0 (0.0%) |
| Utilities | 0 (0.0%) | 0 (0.0%) |
| Information | 0 (0.0%) | 0 (0.0%) |
| Finance & Insurance | 0 (0.0%) | 0 (0.0%) |
| Real Estate, Rental & Leasing | 0 (0.0%) | 0 (0.0%) |
| Professional & Scientific | 1 (100.0%) | 0 (0.0%) |
| Enterprise Management | 0 (0.0%) | 0 (0.0%) |
| Administrative & Support | 7 (77.8%) | 2 (22.2%) |
| Educational Services | 2 (16.7%) | 10 (83.3%) |
| Health Care & Social Assistance | 2 (12.5%) | 14 (87.5%) |
| Arts, Entertainment & Recreation | 1 (50.0%) | 1 (50.0%) |
| Accommodation & Food Services | 0 (0.0%) | 2 (100.0%) |
| Public Administration | 1 (33.3%) | 2 (66.7%) |
| Total | 94 (65.7%) | 49 (34.3%) |
Education in Columbus City
School Enrollment in Columbus City
The most common levels of schooling among the 47 students in Columbus City are middle school (17 | 36.2%), college / undergraduate (15 | 31.9%), and high school (10 | 21.3%).
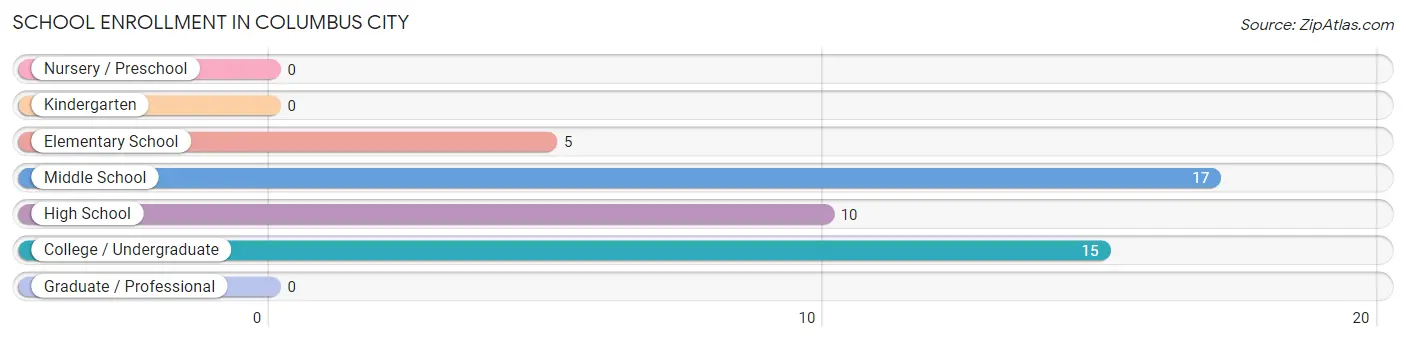
| School Level | # Students | % Students |
| Nursery / Preschool | 0 | 0.0% |
| Kindergarten | 0 | 0.0% |
| Elementary School | 5 | 10.6% |
| Middle School | 17 | 36.2% |
| High School | 10 | 21.3% |
| College / Undergraduate | 15 | 31.9% |
| Graduate / Professional | 0 | 0.0% |
| Total | 47 | 100.0% |
School Enrollment by Age by Funding Source in Columbus City
Out of a total of 47 students who are enrolled in schools in Columbus City, 3 (6.4%) attend a private institution, while the remaining 44 (93.6%) are enrolled in public schools. The age group of 35 years and over has the highest likelihood of being enrolled in private schools, with 2 (40.0% in the age bracket) enrolled. Conversely, the age group of 5 to 9 year old has the lowest likelihood of being enrolled in a private school, with 5 (100.0% in the age bracket) attending a public institution.
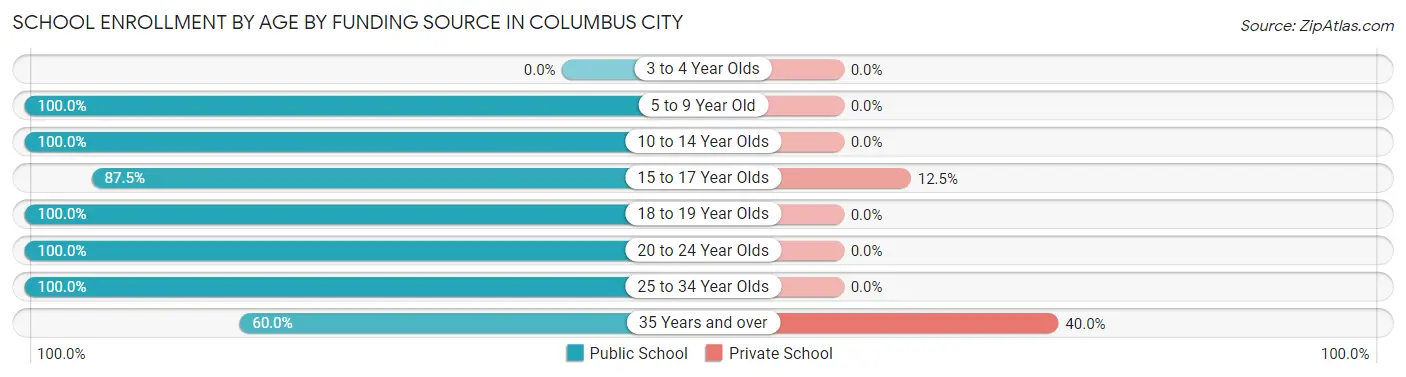
| Age Bracket | Public School | Private School |
| 3 to 4 Year Olds | 0 (0.0%) | 0 (0.0%) |
| 5 to 9 Year Old | 5 (100.0%) | 0 (0.0%) |
| 10 to 14 Year Olds | 18 (100.0%) | 0 (0.0%) |
| 15 to 17 Year Olds | 7 (87.5%) | 1 (12.5%) |
| 18 to 19 Year Olds | 3 (100.0%) | 0 (0.0%) |
| 20 to 24 Year Olds | 7 (100.0%) | 0 (0.0%) |
| 25 to 34 Year Olds | 1 (100.0%) | 0 (0.0%) |
| 35 Years and over | 3 (60.0%) | 2 (40.0%) |
| Total | 44 (93.6%) | 3 (6.4%) |
Educational Attainment by Field of Study in Columbus City
Liberal arts & history (9 | 60.0%), business (2 | 13.3%), education (2 | 13.3%), and communications (2 | 13.3%) are the most common fields of study among 15 individuals in Columbus City who have obtained a bachelor's degree or higher.
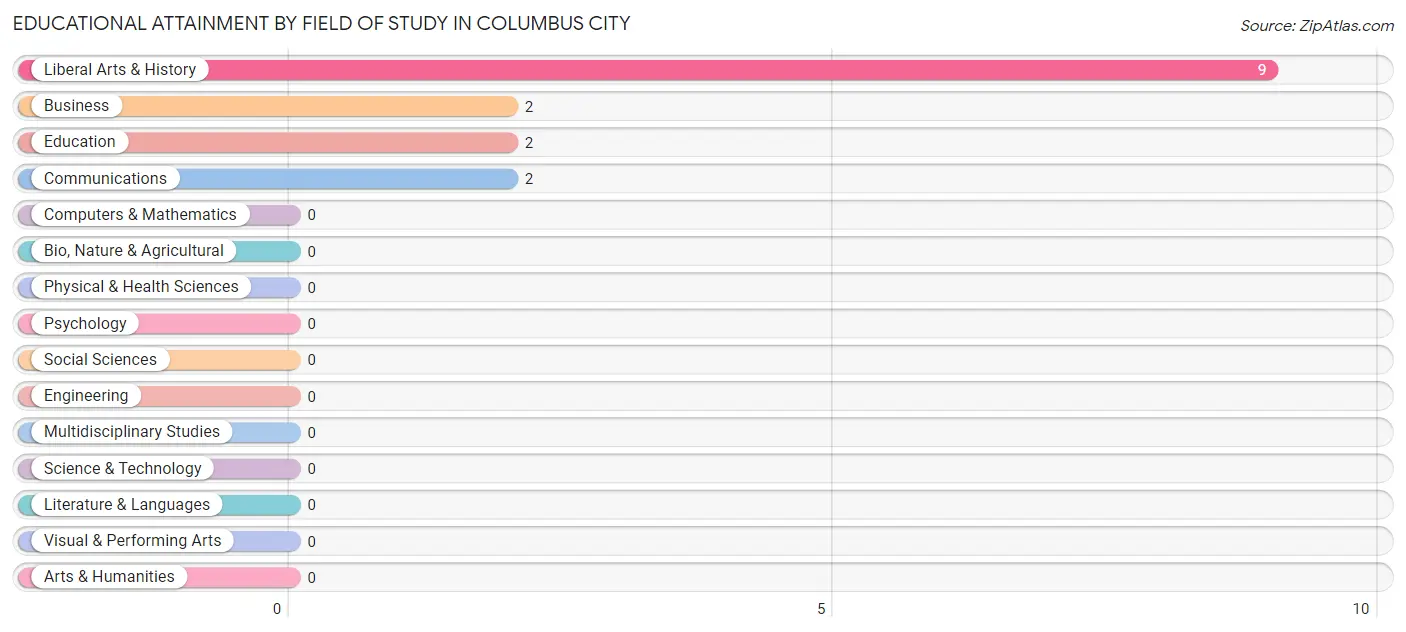
| Field of Study | # Graduates | % Graduates |
| Computers & Mathematics | 0 | 0.0% |
| Bio, Nature & Agricultural | 0 | 0.0% |
| Physical & Health Sciences | 0 | 0.0% |
| Psychology | 0 | 0.0% |
| Social Sciences | 0 | 0.0% |
| Engineering | 0 | 0.0% |
| Multidisciplinary Studies | 0 | 0.0% |
| Science & Technology | 0 | 0.0% |
| Business | 2 | 13.3% |
| Education | 2 | 13.3% |
| Literature & Languages | 0 | 0.0% |
| Liberal Arts & History | 9 | 60.0% |
| Visual & Performing Arts | 0 | 0.0% |
| Communications | 2 | 13.3% |
| Arts & Humanities | 0 | 0.0% |
| Total | 15 | 100.0% |
Transportation & Commute in Columbus City
Vehicle Availability by Sex in Columbus City
The most prevalent vehicle ownership categories in Columbus City are males with 2 vehicles (38, accounting for 43.7%) and females with 2 vehicles (22, making up 80.8%).
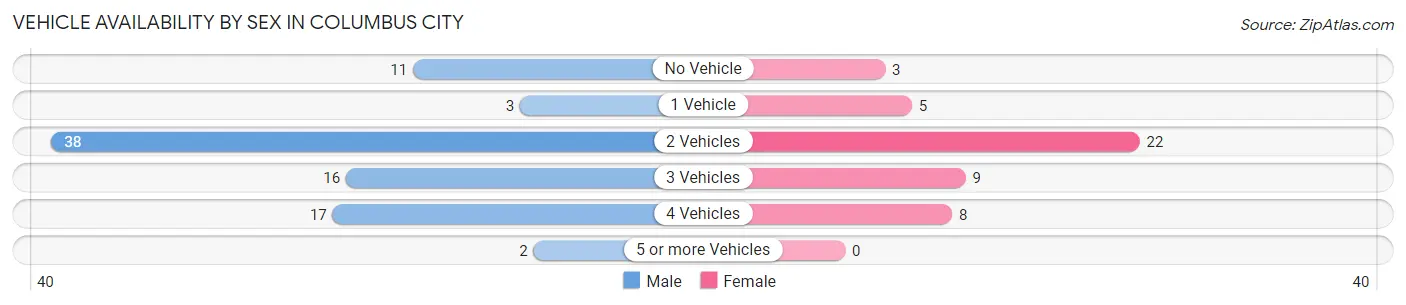
| Vehicles Available | Male | Female |
| No Vehicle | 11 (12.6%) | 3 (6.4%) |
| 1 Vehicle | 3 (3.5%) | 5 (10.6%) |
| 2 Vehicles | 38 (43.7%) | 22 (46.8%) |
| 3 Vehicles | 16 (18.4%) | 9 (19.2%) |
| 4 Vehicles | 17 (19.5%) | 8 (17.0%) |
| 5 or more Vehicles | 2 (2.3%) | 0 (0.0%) |
| Total | 87 (100.0%) | 47 (100.0%) |
Commute Time in Columbus City
The most frequently occuring commute durations in Columbus City are 10 to 14 minutes (22 commuters, 16.8%), 45 to 59 minutes (21 commuters, 16.0%), and 30 to 34 minutes (18 commuters, 13.7%).
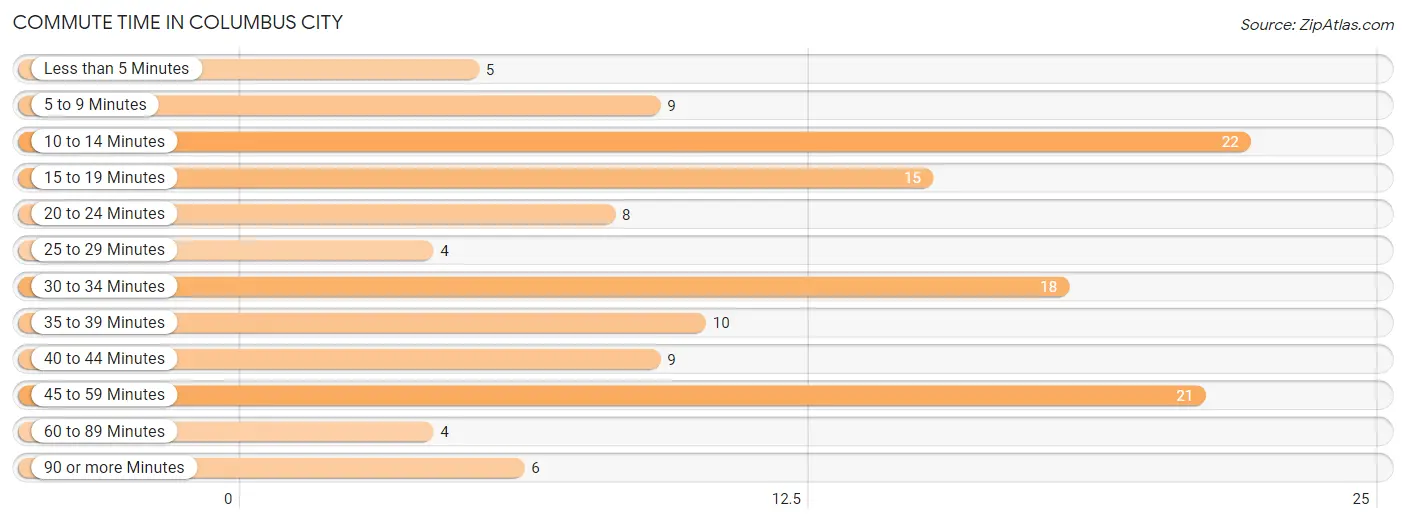
| Commute Time | # Commuters | % Commuters |
| Less than 5 Minutes | 5 | 3.8% |
| 5 to 9 Minutes | 9 | 6.9% |
| 10 to 14 Minutes | 22 | 16.8% |
| 15 to 19 Minutes | 15 | 11.5% |
| 20 to 24 Minutes | 8 | 6.1% |
| 25 to 29 Minutes | 4 | 3.0% |
| 30 to 34 Minutes | 18 | 13.7% |
| 35 to 39 Minutes | 10 | 7.6% |
| 40 to 44 Minutes | 9 | 6.9% |
| 45 to 59 Minutes | 21 | 16.0% |
| 60 to 89 Minutes | 4 | 3.0% |
| 90 or more Minutes | 6 | 4.6% |
Commute Time by Sex in Columbus City
The most common commute times in Columbus City are 30 to 34 minutes (17 commuters, 19.5%) for males and 10 to 14 minutes (10 commuters, 22.7%) for females.
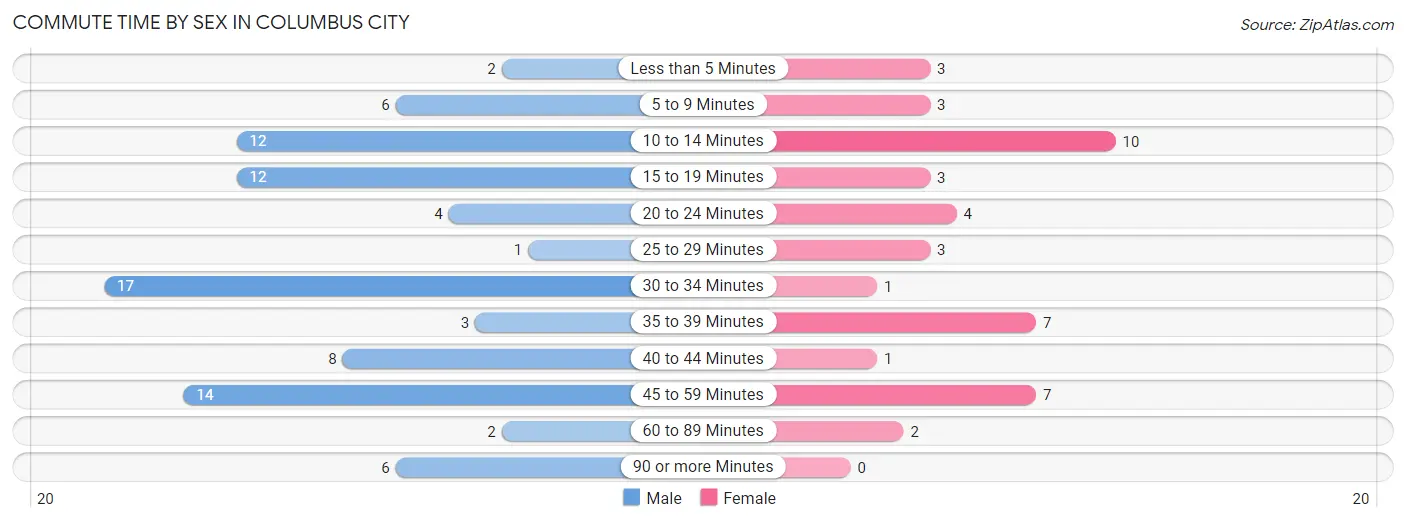
| Commute Time | Male | Female |
| Less than 5 Minutes | 2 (2.3%) | 3 (6.8%) |
| 5 to 9 Minutes | 6 (6.9%) | 3 (6.8%) |
| 10 to 14 Minutes | 12 (13.8%) | 10 (22.7%) |
| 15 to 19 Minutes | 12 (13.8%) | 3 (6.8%) |
| 20 to 24 Minutes | 4 (4.6%) | 4 (9.1%) |
| 25 to 29 Minutes | 1 (1.1%) | 3 (6.8%) |
| 30 to 34 Minutes | 17 (19.5%) | 1 (2.3%) |
| 35 to 39 Minutes | 3 (3.5%) | 7 (15.9%) |
| 40 to 44 Minutes | 8 (9.2%) | 1 (2.3%) |
| 45 to 59 Minutes | 14 (16.1%) | 7 (15.9%) |
| 60 to 89 Minutes | 2 (2.3%) | 2 (4.5%) |
| 90 or more Minutes | 6 (6.9%) | 0 (0.0%) |
Time of Departure to Work by Sex in Columbus City
The most frequent times of departure to work in Columbus City are 6:00 AM to 6:29 AM (26, 29.9%) for males and 5:30 AM to 5:59 AM (10, 22.7%) for females.
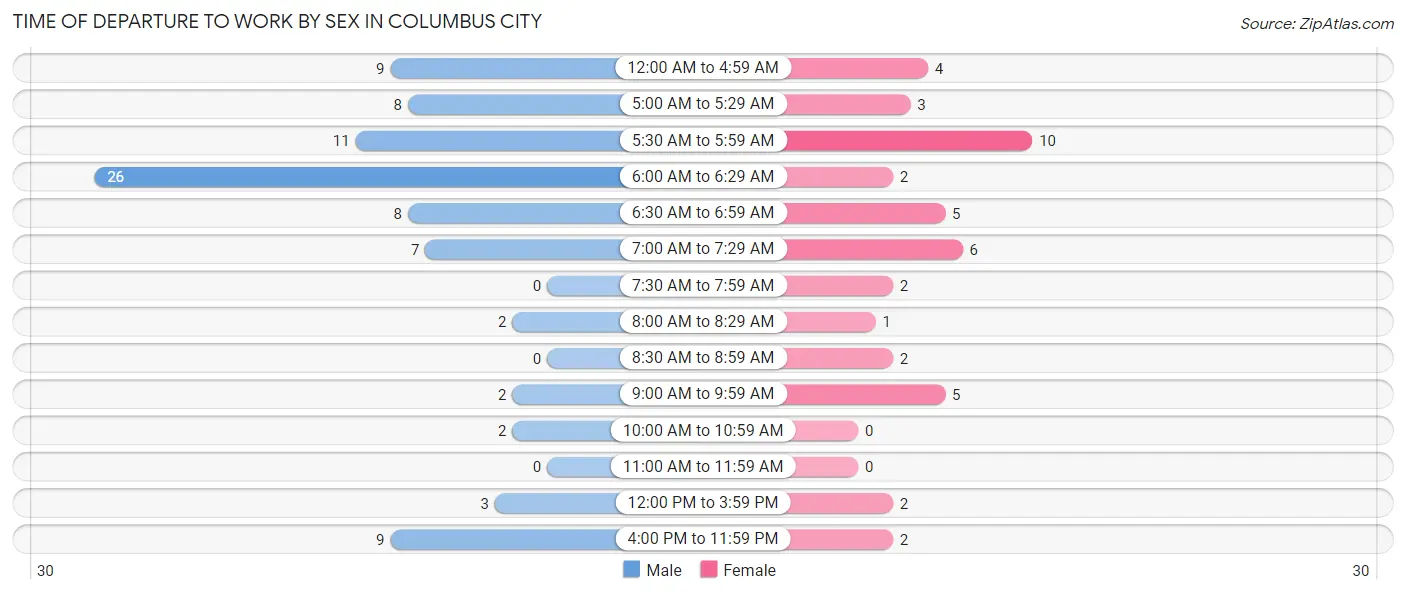
| Time of Departure | Male | Female |
| 12:00 AM to 4:59 AM | 9 (10.3%) | 4 (9.1%) |
| 5:00 AM to 5:29 AM | 8 (9.2%) | 3 (6.8%) |
| 5:30 AM to 5:59 AM | 11 (12.6%) | 10 (22.7%) |
| 6:00 AM to 6:29 AM | 26 (29.9%) | 2 (4.5%) |
| 6:30 AM to 6:59 AM | 8 (9.2%) | 5 (11.4%) |
| 7:00 AM to 7:29 AM | 7 (8.1%) | 6 (13.6%) |
| 7:30 AM to 7:59 AM | 0 (0.0%) | 2 (4.5%) |
| 8:00 AM to 8:29 AM | 2 (2.3%) | 1 (2.3%) |
| 8:30 AM to 8:59 AM | 0 (0.0%) | 2 (4.5%) |
| 9:00 AM to 9:59 AM | 2 (2.3%) | 5 (11.4%) |
| 10:00 AM to 10:59 AM | 2 (2.3%) | 0 (0.0%) |
| 11:00 AM to 11:59 AM | 0 (0.0%) | 0 (0.0%) |
| 12:00 PM to 3:59 PM | 3 (3.5%) | 2 (4.5%) |
| 4:00 PM to 11:59 PM | 9 (10.3%) | 2 (4.5%) |
| Total | 87 (100.0%) | 44 (100.0%) |
Housing Occupancy in Columbus City
Occupancy by Ownership in Columbus City
Of the total 120 dwellings in Columbus City, owner-occupied units account for 117 (97.5%), while renter-occupied units make up 3 (2.5%).
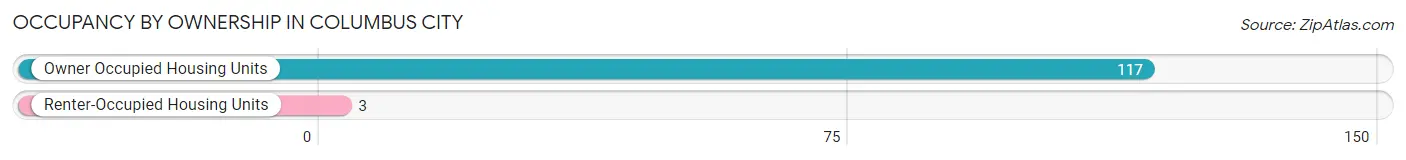
| Occupancy | # Housing Units | % Housing Units |
| Owner Occupied Housing Units | 117 | 97.5% |
| Renter-Occupied Housing Units | 3 | 2.5% |
| Total Occupied Housing Units | 120 | 100.0% |
Occupancy by Household Size in Columbus City
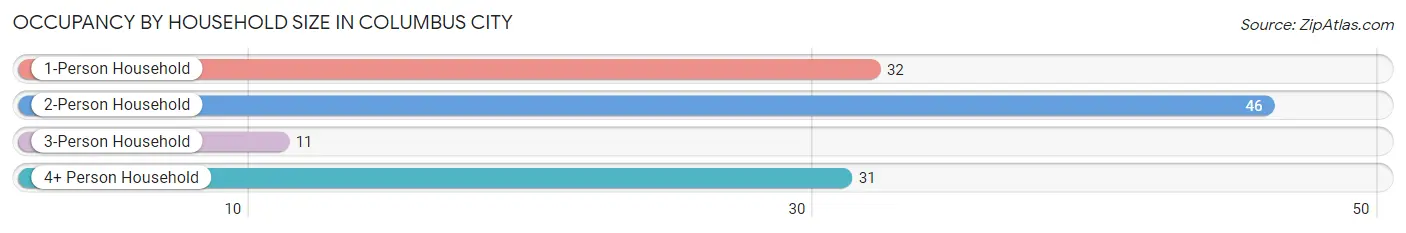
| Household Size | # Housing Units | % Housing Units |
| 1-Person Household | 32 | 26.7% |
| 2-Person Household | 46 | 38.3% |
| 3-Person Household | 11 | 9.2% |
| 4+ Person Household | 31 | 25.8% |
| Total Housing Units | 120 | 100.0% |
Occupancy by Ownership by Household Size in Columbus City
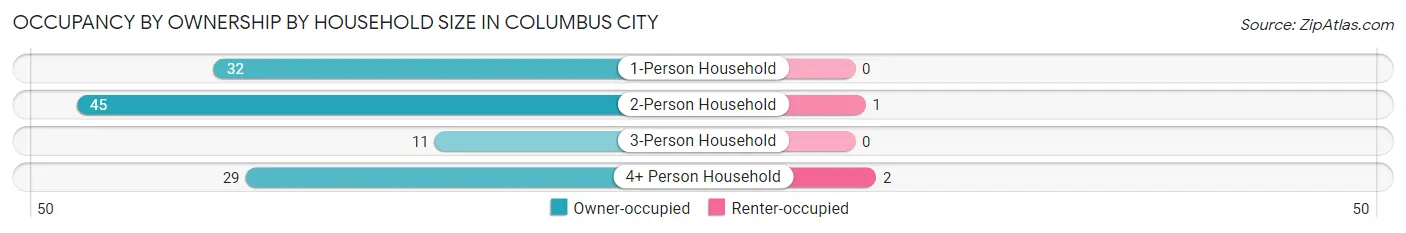
| Household Size | Owner-occupied | Renter-occupied |
| 1-Person Household | 32 (100.0%) | 0 (0.0%) |
| 2-Person Household | 45 (97.8%) | 1 (2.2%) |
| 3-Person Household | 11 (100.0%) | 0 (0.0%) |
| 4+ Person Household | 29 (93.5%) | 2 (6.5%) |
| Total Housing Units | 117 (97.5%) | 3 (2.5%) |
Occupancy by Educational Attainment in Columbus City
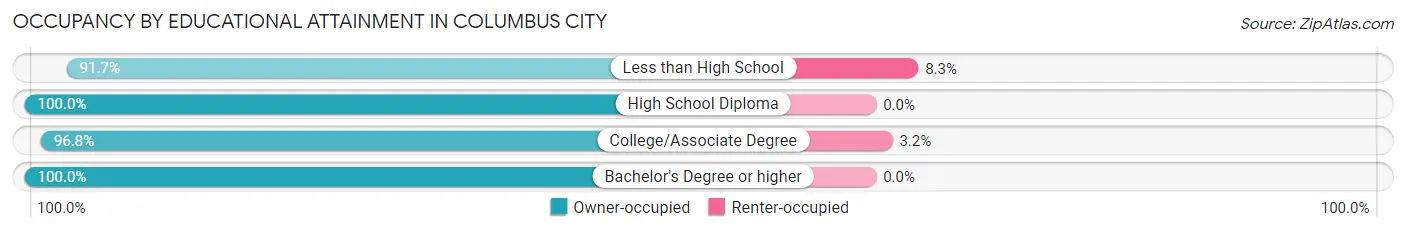
| Household Size | Owner-occupied | Renter-occupied |
| Less than High School | 22 (91.7%) | 2 (8.3%) |
| High School Diploma | 54 (100.0%) | 0 (0.0%) |
| College/Associate Degree | 30 (96.8%) | 1 (3.2%) |
| Bachelor's Degree or higher | 11 (100.0%) | 0 (0.0%) |
Occupancy by Age of Householder in Columbus City
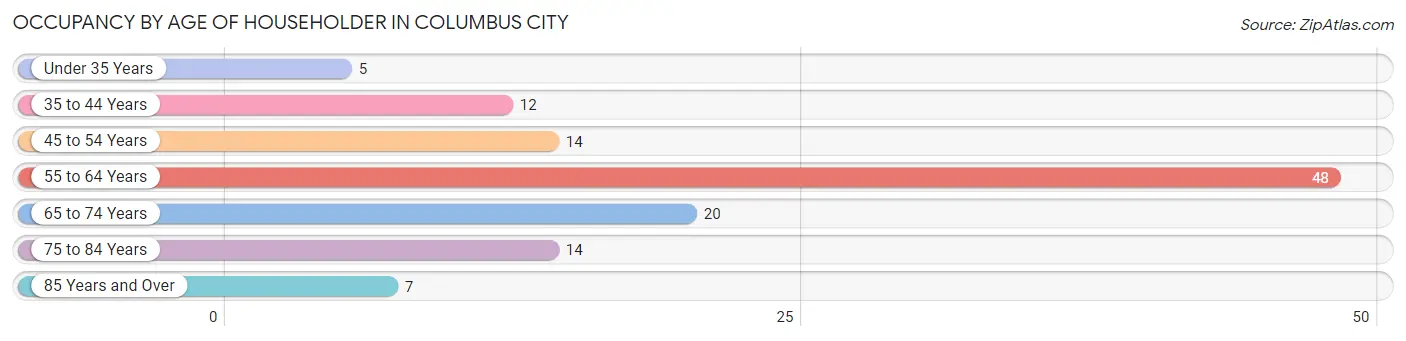
| Age Bracket | # Households | % Households |
| Under 35 Years | 5 | 4.2% |
| 35 to 44 Years | 12 | 10.0% |
| 45 to 54 Years | 14 | 11.7% |
| 55 to 64 Years | 48 | 40.0% |
| 65 to 74 Years | 20 | 16.7% |
| 75 to 84 Years | 14 | 11.7% |
| 85 Years and Over | 7 | 5.8% |
| Total | 120 | 100.0% |
Housing Finances in Columbus City
Median Income by Occupancy in Columbus City
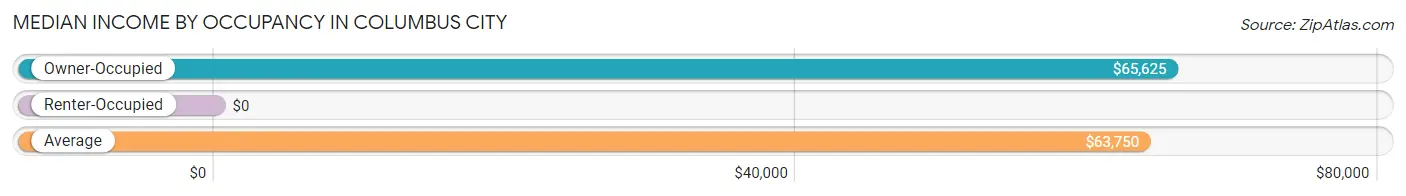
| Occupancy Type | # Households | Median Income |
| Owner-Occupied | 117 (97.5%) | $65,625 |
| Renter-Occupied | 3 (2.5%) | $0 |
| Average | 120 (100.0%) | $63,750 |
Occupancy by Householder Income Bracket in Columbus City
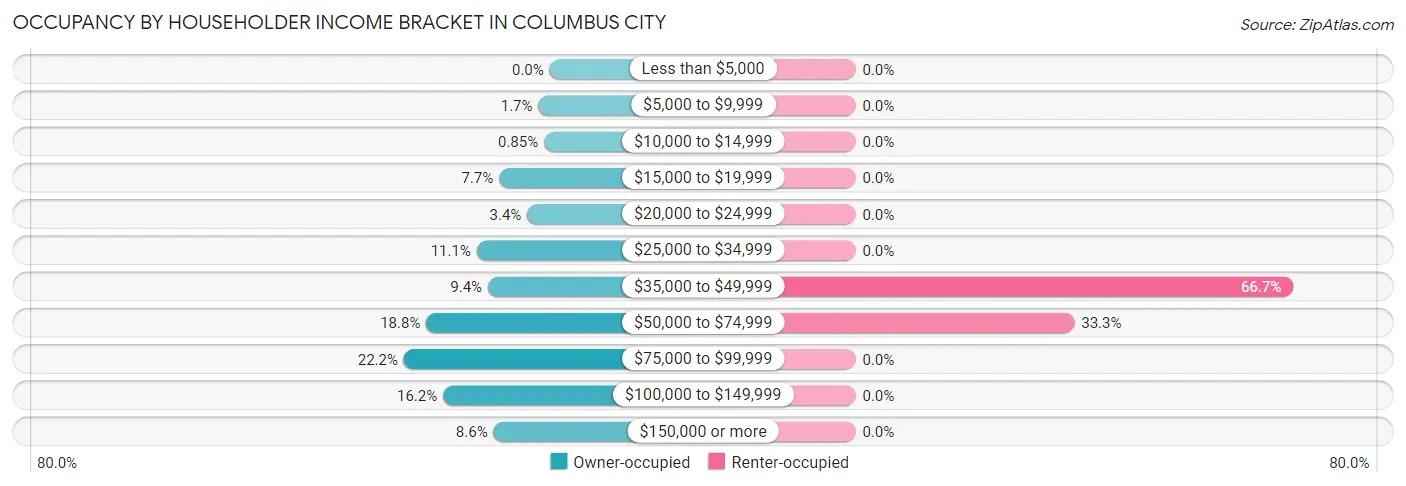
| Income Bracket | Owner-occupied | Renter-occupied |
| Less than $5,000 | 0 (0.0%) | 0 (0.0%) |
| $5,000 to $9,999 | 2 (1.7%) | 0 (0.0%) |
| $10,000 to $14,999 | 1 (0.9%) | 0 (0.0%) |
| $15,000 to $19,999 | 9 (7.7%) | 0 (0.0%) |
| $20,000 to $24,999 | 4 (3.4%) | 0 (0.0%) |
| $25,000 to $34,999 | 13 (11.1%) | 0 (0.0%) |
| $35,000 to $49,999 | 11 (9.4%) | 2 (66.7%) |
| $50,000 to $74,999 | 22 (18.8%) | 1 (33.3%) |
| $75,000 to $99,999 | 26 (22.2%) | 0 (0.0%) |
| $100,000 to $149,999 | 19 (16.2%) | 0 (0.0%) |
| $150,000 or more | 10 (8.6%) | 0 (0.0%) |
| Total | 117 (100.0%) | 3 (100.0%) |
Monthly Housing Cost Tiers in Columbus City
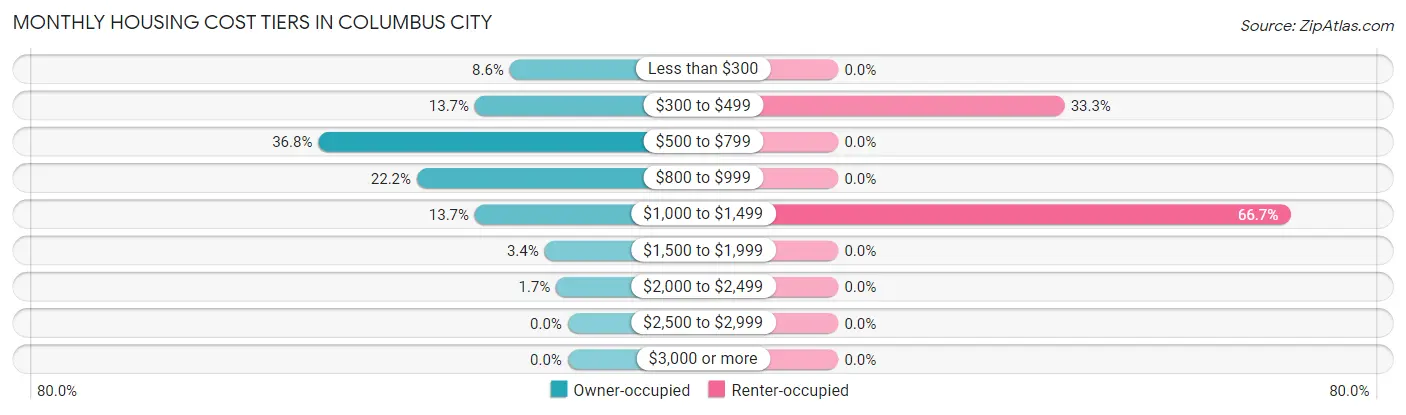
| Monthly Cost | Owner-occupied | Renter-occupied |
| Less than $300 | 10 (8.6%) | 0 (0.0%) |
| $300 to $499 | 16 (13.7%) | 1 (33.3%) |
| $500 to $799 | 43 (36.7%) | 0 (0.0%) |
| $800 to $999 | 26 (22.2%) | 0 (0.0%) |
| $1,000 to $1,499 | 16 (13.7%) | 2 (66.7%) |
| $1,500 to $1,999 | 4 (3.4%) | 0 (0.0%) |
| $2,000 to $2,499 | 2 (1.7%) | 0 (0.0%) |
| $2,500 to $2,999 | 0 (0.0%) | 0 (0.0%) |
| $3,000 or more | 0 (0.0%) | 0 (0.0%) |
| Total | 117 (100.0%) | 3 (100.0%) |
Physical Housing Characteristics in Columbus City
Housing Structures in Columbus City
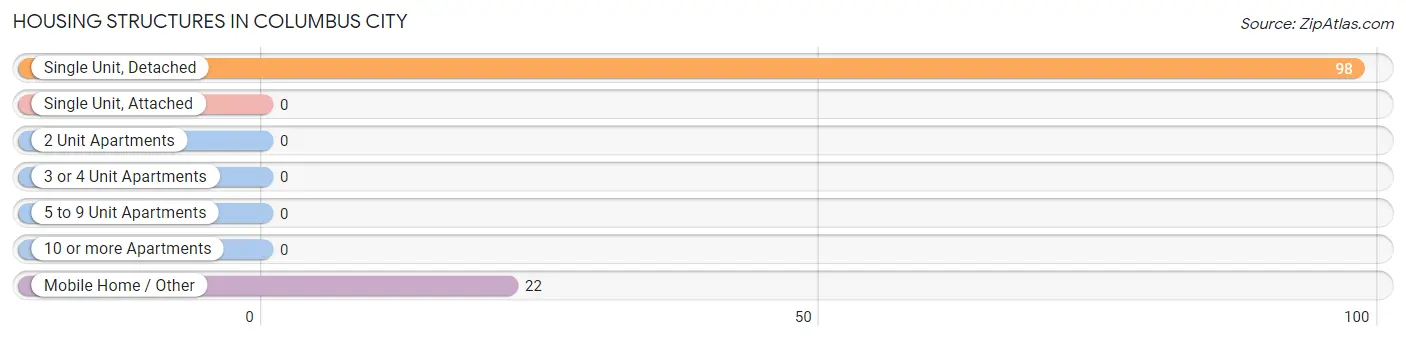
| Structure Type | # Housing Units | % Housing Units |
| Single Unit, Detached | 98 | 81.7% |
| Single Unit, Attached | 0 | 0.0% |
| 2 Unit Apartments | 0 | 0.0% |
| 3 or 4 Unit Apartments | 0 | 0.0% |
| 5 to 9 Unit Apartments | 0 | 0.0% |
| 10 or more Apartments | 0 | 0.0% |
| Mobile Home / Other | 22 | 18.3% |
| Total | 120 | 100.0% |
Housing Structures by Occupancy in Columbus City
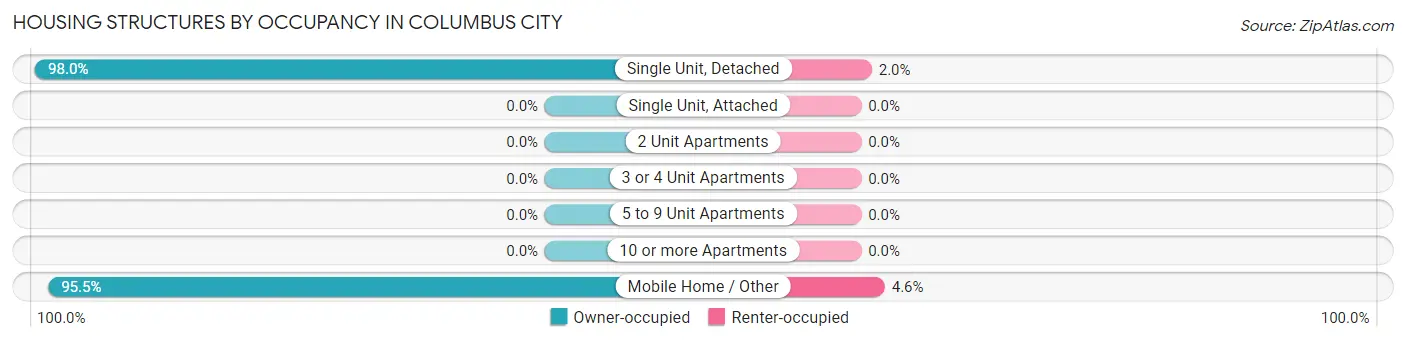
| Structure Type | Owner-occupied | Renter-occupied |
| Single Unit, Detached | 96 (98.0%) | 2 (2.0%) |
| Single Unit, Attached | 0 (0.0%) | 0 (0.0%) |
| 2 Unit Apartments | 0 (0.0%) | 0 (0.0%) |
| 3 or 4 Unit Apartments | 0 (0.0%) | 0 (0.0%) |
| 5 to 9 Unit Apartments | 0 (0.0%) | 0 (0.0%) |
| 10 or more Apartments | 0 (0.0%) | 0 (0.0%) |
| Mobile Home / Other | 21 (95.5%) | 1 (4.5%) |
| Total | 117 (97.5%) | 3 (2.5%) |
Housing Structures by Number of Rooms in Columbus City
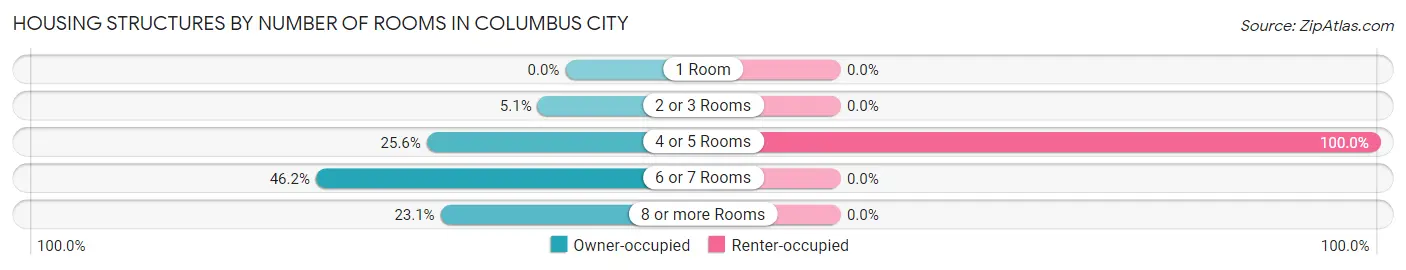
| Number of Rooms | Owner-occupied | Renter-occupied |
| 1 Room | 0 (0.0%) | 0 (0.0%) |
| 2 or 3 Rooms | 6 (5.1%) | 0 (0.0%) |
| 4 or 5 Rooms | 30 (25.6%) | 3 (100.0%) |
| 6 or 7 Rooms | 54 (46.2%) | 0 (0.0%) |
| 8 or more Rooms | 27 (23.1%) | 0 (0.0%) |
| Total | 117 (100.0%) | 3 (100.0%) |
Housing Structure by Heating Type in Columbus City
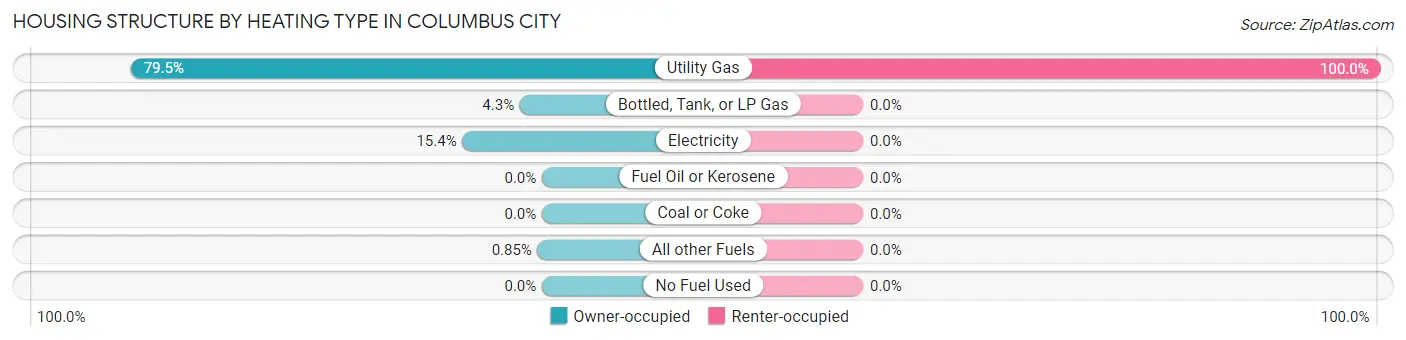
| Heating Type | Owner-occupied | Renter-occupied |
| Utility Gas | 93 (79.5%) | 3 (100.0%) |
| Bottled, Tank, or LP Gas | 5 (4.3%) | 0 (0.0%) |
| Electricity | 18 (15.4%) | 0 (0.0%) |
| Fuel Oil or Kerosene | 0 (0.0%) | 0 (0.0%) |
| Coal or Coke | 0 (0.0%) | 0 (0.0%) |
| All other Fuels | 1 (0.9%) | 0 (0.0%) |
| No Fuel Used | 0 (0.0%) | 0 (0.0%) |
| Total | 117 (100.0%) | 3 (100.0%) |
Household Vehicle Usage in Columbus City
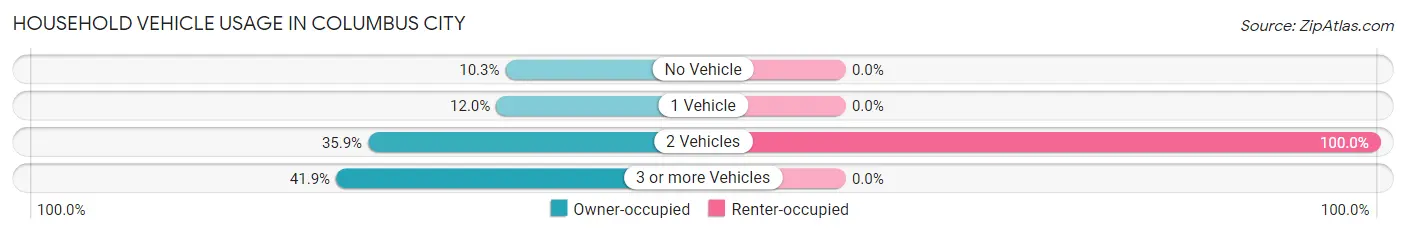
| Vehicles per Household | Owner-occupied | Renter-occupied |
| No Vehicle | 12 (10.3%) | 0 (0.0%) |
| 1 Vehicle | 14 (12.0%) | 0 (0.0%) |
| 2 Vehicles | 42 (35.9%) | 3 (100.0%) |
| 3 or more Vehicles | 49 (41.9%) | 0 (0.0%) |
| Total | 117 (100.0%) | 3 (100.0%) |
Real Estate & Mortgages in Columbus City
Real Estate and Mortgage Overview in Columbus City
| Characteristic | Without Mortgage | With Mortgage |
| Housing Units | 65 | 52 |
| Median Property Value | $91,700 | $104,200 |
| Median Household Income | $57,708 | $8 |
| Monthly Housing Costs | $536 | $0 |
| Real Estate Taxes | $1,200 | $1 |
Property Value by Mortgage Status in Columbus City
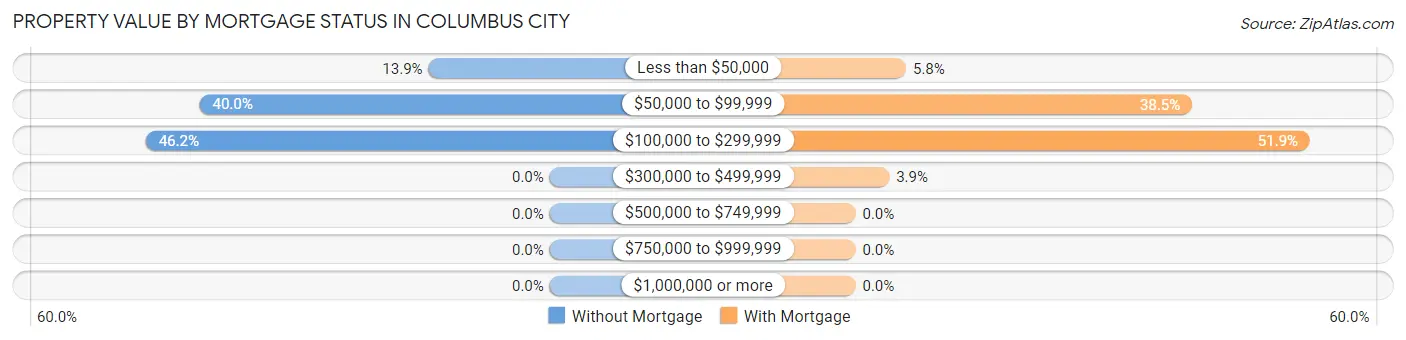
| Property Value | Without Mortgage | With Mortgage |
| Less than $50,000 | 9 (13.9%) | 3 (5.8%) |
| $50,000 to $99,999 | 26 (40.0%) | 20 (38.5%) |
| $100,000 to $299,999 | 30 (46.2%) | 27 (51.9%) |
| $300,000 to $499,999 | 0 (0.0%) | 2 (3.8%) |
| $500,000 to $749,999 | 0 (0.0%) | 0 (0.0%) |
| $750,000 to $999,999 | 0 (0.0%) | 0 (0.0%) |
| $1,000,000 or more | 0 (0.0%) | 0 (0.0%) |
| Total | 65 (100.0%) | 52 (100.0%) |
Household Income by Mortgage Status in Columbus City
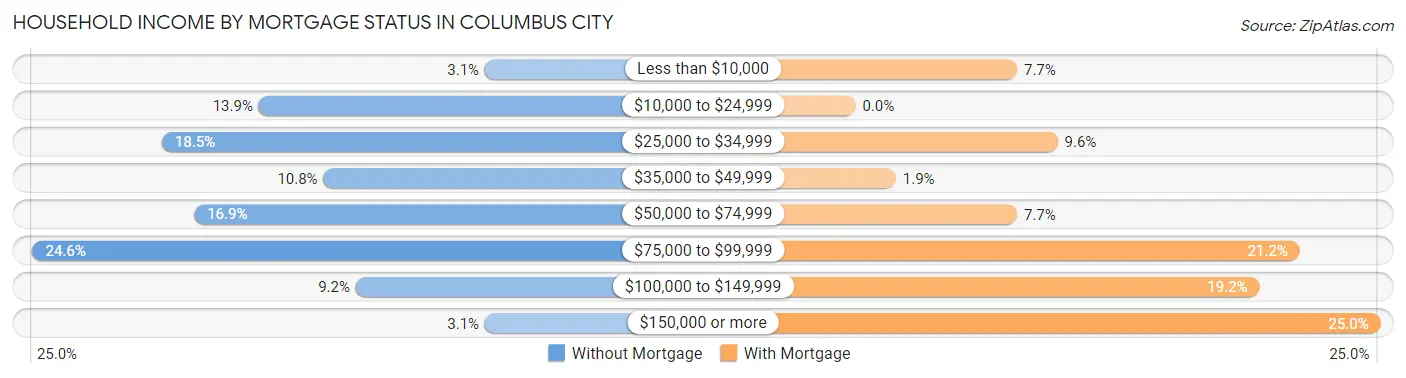
| Household Income | Without Mortgage | With Mortgage |
| Less than $10,000 | 2 (3.1%) | 4 (7.7%) |
| $10,000 to $24,999 | 9 (13.9%) | 0 (0.0%) |
| $25,000 to $34,999 | 12 (18.5%) | 5 (9.6%) |
| $35,000 to $49,999 | 7 (10.8%) | 1 (1.9%) |
| $50,000 to $74,999 | 11 (16.9%) | 4 (7.7%) |
| $75,000 to $99,999 | 16 (24.6%) | 11 (21.1%) |
| $100,000 to $149,999 | 6 (9.2%) | 10 (19.2%) |
| $150,000 or more | 2 (3.1%) | 13 (25.0%) |
| Total | 65 (100.0%) | 52 (100.0%) |
Property Value to Household Income Ratio in Columbus City
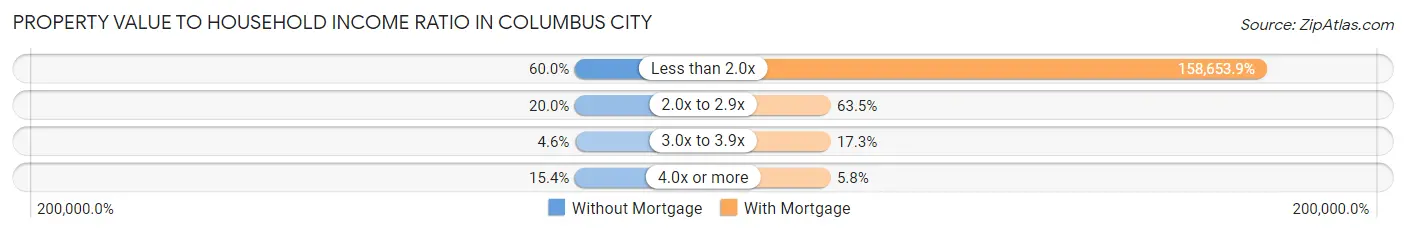
| Value-to-Income Ratio | Without Mortgage | With Mortgage |
| Less than 2.0x | 39 (60.0%) | 82,500 (158,653.9%) |
| 2.0x to 2.9x | 13 (20.0%) | 33 (63.5%) |
| 3.0x to 3.9x | 3 (4.6%) | 9 (17.3%) |
| 4.0x or more | 10 (15.4%) | 3 (5.8%) |
| Total | 65 (100.0%) | 52 (100.0%) |
Real Estate Taxes by Mortgage Status in Columbus City
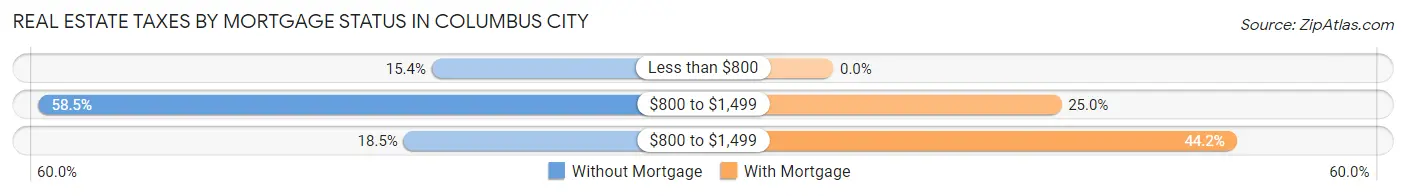
| Property Taxes | Without Mortgage | With Mortgage |
| Less than $800 | 10 (15.4%) | 0 (0.0%) |
| $800 to $1,499 | 38 (58.5%) | 13 (25.0%) |
| $800 to $1,499 | 12 (18.5%) | 23 (44.2%) |
| Total | 65 (100.0%) | 52 (100.0%) |
Health & Disability in Columbus City
Health Insurance Coverage by Age in Columbus City
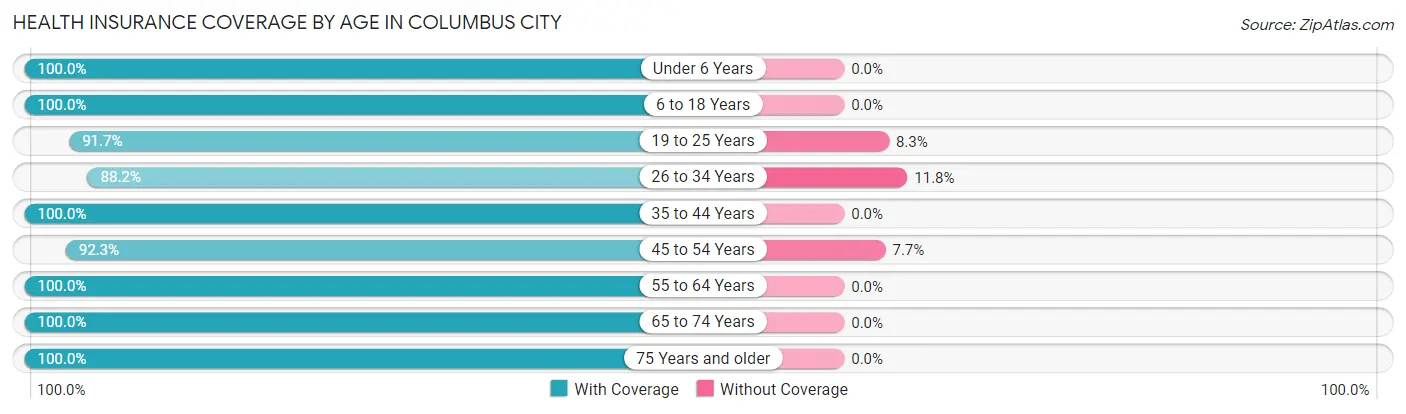
| Age Bracket | With Coverage | Without Coverage |
| Under 6 Years | 6 (100.0%) | 0 (0.0%) |
| 6 to 18 Years | 35 (100.0%) | 0 (0.0%) |
| 19 to 25 Years | 22 (91.7%) | 2 (8.3%) |
| 26 to 34 Years | 15 (88.2%) | 2 (11.8%) |
| 35 to 44 Years | 30 (100.0%) | 0 (0.0%) |
| 45 to 54 Years | 24 (92.3%) | 2 (7.7%) |
| 55 to 64 Years | 73 (100.0%) | 0 (0.0%) |
| 65 to 74 Years | 32 (100.0%) | 0 (0.0%) |
| 75 Years and older | 31 (100.0%) | 0 (0.0%) |
| Total | 268 (97.8%) | 6 (2.2%) |
Health Insurance Coverage by Citizenship Status in Columbus City
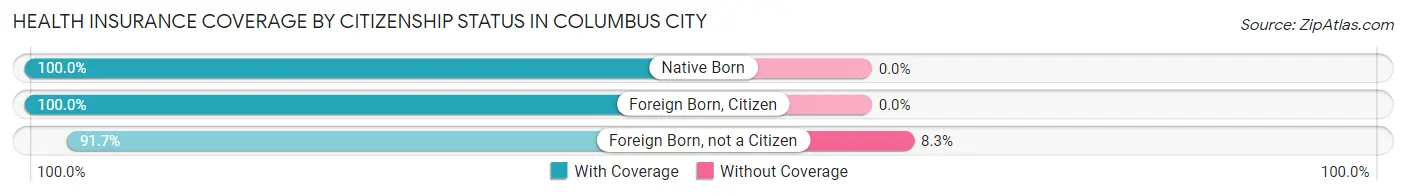
| Citizenship Status | With Coverage | Without Coverage |
| Native Born | 6 (100.0%) | 0 (0.0%) |
| Foreign Born, Citizen | 35 (100.0%) | 0 (0.0%) |
| Foreign Born, not a Citizen | 22 (91.7%) | 2 (8.3%) |
Health Insurance Coverage by Household Income in Columbus City
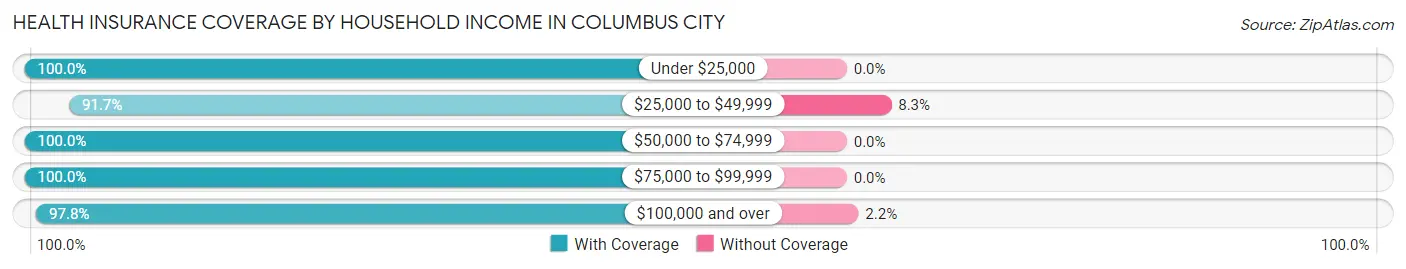
| Household Income | With Coverage | Without Coverage |
| Under $25,000 | 22 (100.0%) | 0 (0.0%) |
| $25,000 to $49,999 | 44 (91.7%) | 4 (8.3%) |
| $50,000 to $74,999 | 47 (100.0%) | 0 (0.0%) |
| $75,000 to $99,999 | 65 (100.0%) | 0 (0.0%) |
| $100,000 and over | 90 (97.8%) | 2 (2.2%) |
Public vs Private Health Insurance Coverage by Age in Columbus City
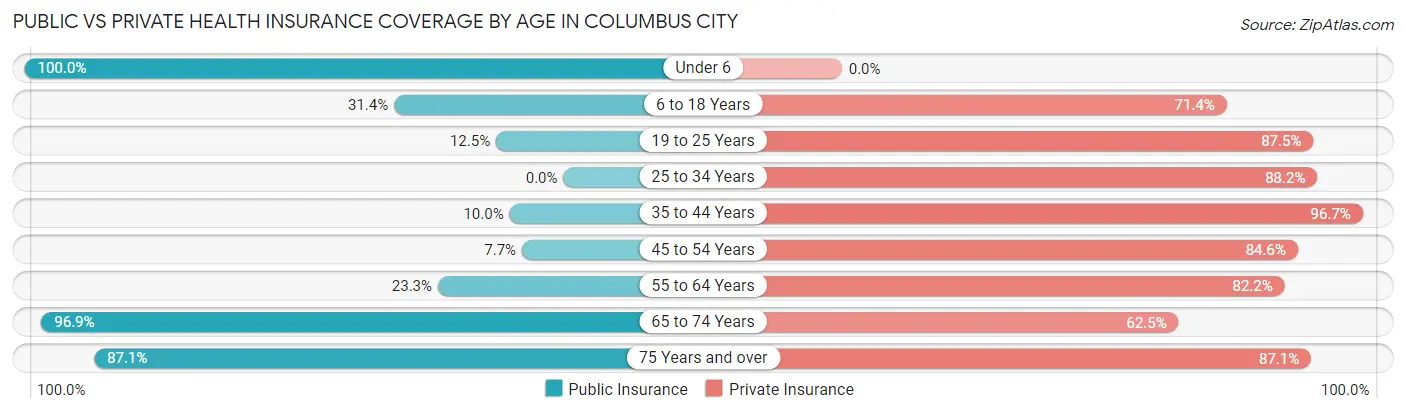
| Age Bracket | Public Insurance | Private Insurance |
| Under 6 | 6 (100.0%) | 0 (0.0%) |
| 6 to 18 Years | 11 (31.4%) | 25 (71.4%) |
| 19 to 25 Years | 3 (12.5%) | 21 (87.5%) |
| 25 to 34 Years | 0 (0.0%) | 15 (88.2%) |
| 35 to 44 Years | 3 (10.0%) | 29 (96.7%) |
| 45 to 54 Years | 2 (7.7%) | 22 (84.6%) |
| 55 to 64 Years | 17 (23.3%) | 60 (82.2%) |
| 65 to 74 Years | 31 (96.9%) | 20 (62.5%) |
| 75 Years and over | 27 (87.1%) | 27 (87.1%) |
| Total | 100 (36.5%) | 219 (79.9%) |
Disability Status by Sex by Age in Columbus City
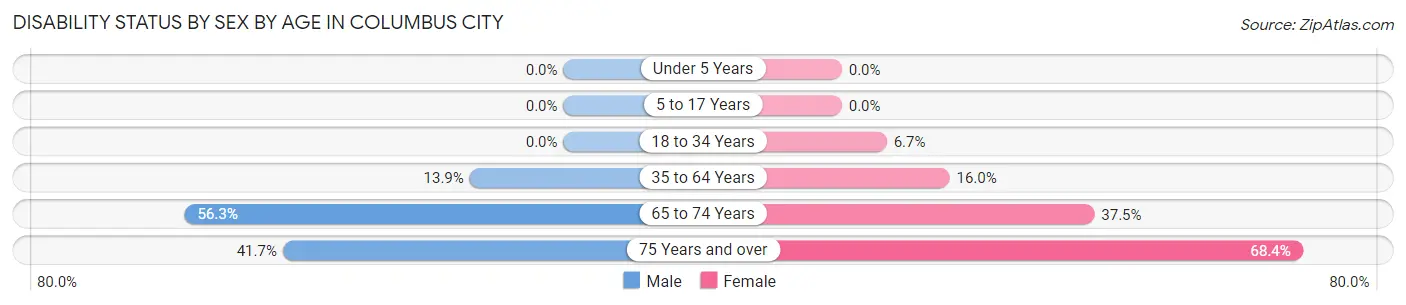
| Age Bracket | Male | Female |
| Under 5 Years | 0 (0.0%) | 0 (0.0%) |
| 5 to 17 Years | 0 (0.0%) | 0 (0.0%) |
| 18 to 34 Years | 0 (0.0%) | 1 (6.7%) |
| 35 to 64 Years | 11 (13.9%) | 8 (16.0%) |
| 65 to 74 Years | 9 (56.2%) | 6 (37.5%) |
| 75 Years and over | 5 (41.7%) | 13 (68.4%) |
Disability Class by Sex by Age in Columbus City
Disability Class: Hearing Difficulty
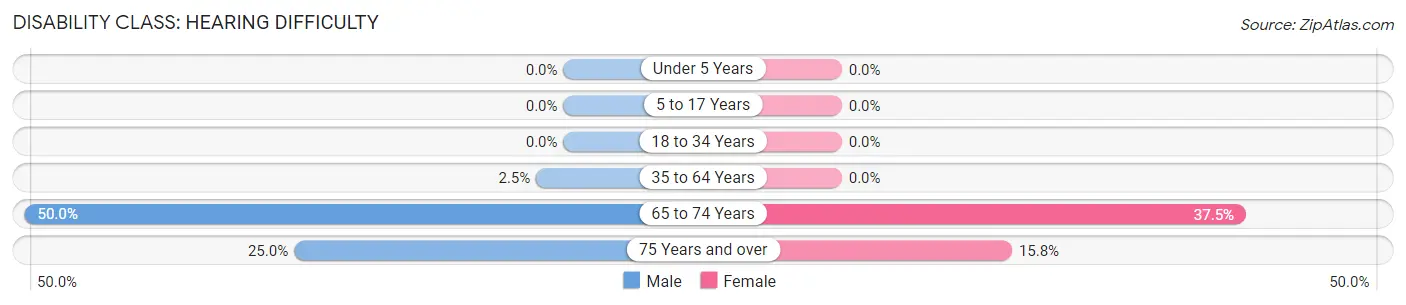
| Age Bracket | Male | Female |
| Under 5 Years | 0 (0.0%) | 0 (0.0%) |
| 5 to 17 Years | 0 (0.0%) | 0 (0.0%) |
| 18 to 34 Years | 0 (0.0%) | 0 (0.0%) |
| 35 to 64 Years | 2 (2.5%) | 0 (0.0%) |
| 65 to 74 Years | 8 (50.0%) | 6 (37.5%) |
| 75 Years and over | 3 (25.0%) | 3 (15.8%) |
Disability Class: Vision Difficulty
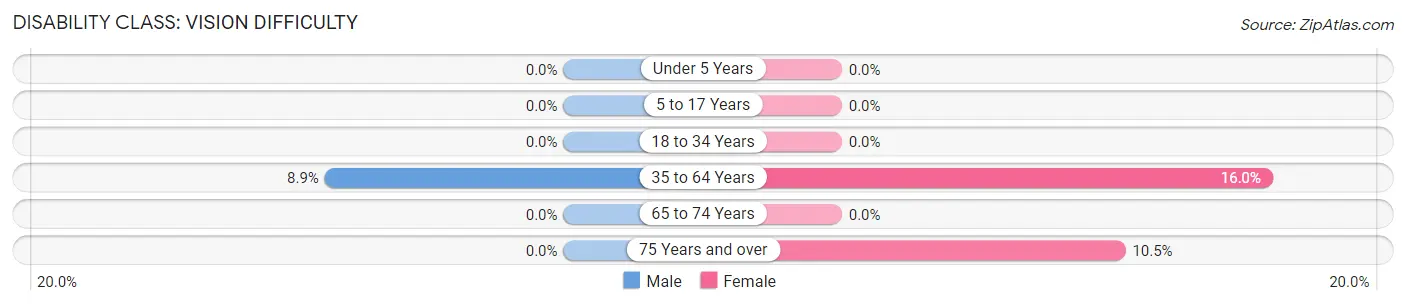
| Age Bracket | Male | Female |
| Under 5 Years | 0 (0.0%) | 0 (0.0%) |
| 5 to 17 Years | 0 (0.0%) | 0 (0.0%) |
| 18 to 34 Years | 0 (0.0%) | 0 (0.0%) |
| 35 to 64 Years | 7 (8.9%) | 8 (16.0%) |
| 65 to 74 Years | 0 (0.0%) | 0 (0.0%) |
| 75 Years and over | 0 (0.0%) | 2 (10.5%) |
Disability Class: Cognitive Difficulty
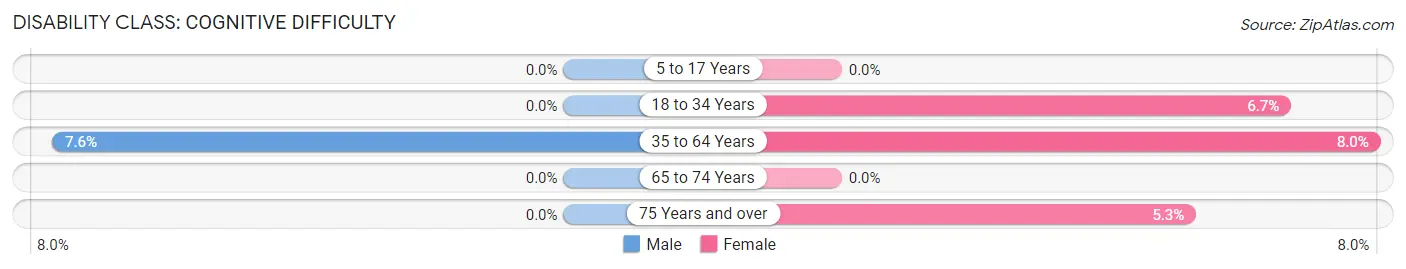
| Age Bracket | Male | Female |
| 5 to 17 Years | 0 (0.0%) | 0 (0.0%) |
| 18 to 34 Years | 0 (0.0%) | 1 (6.7%) |
| 35 to 64 Years | 6 (7.6%) | 4 (8.0%) |
| 65 to 74 Years | 0 (0.0%) | 0 (0.0%) |
| 75 Years and over | 0 (0.0%) | 1 (5.3%) |
Disability Class: Ambulatory Difficulty
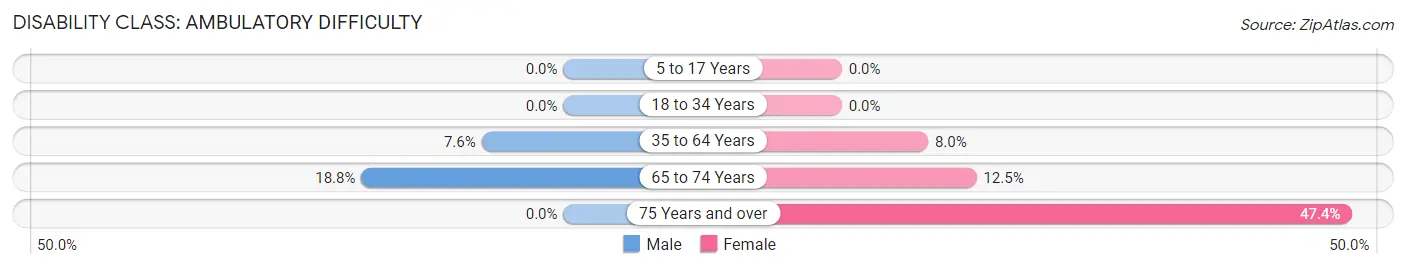
| Age Bracket | Male | Female |
| 5 to 17 Years | 0 (0.0%) | 0 (0.0%) |
| 18 to 34 Years | 0 (0.0%) | 0 (0.0%) |
| 35 to 64 Years | 6 (7.6%) | 4 (8.0%) |
| 65 to 74 Years | 3 (18.8%) | 2 (12.5%) |
| 75 Years and over | 0 (0.0%) | 9 (47.4%) |
Disability Class: Self-Care Difficulty
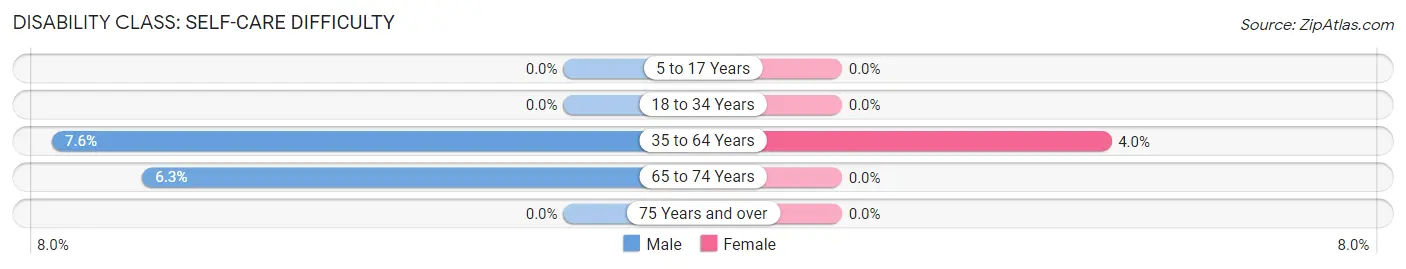
| Age Bracket | Male | Female |
| 5 to 17 Years | 0 (0.0%) | 0 (0.0%) |
| 18 to 34 Years | 0 (0.0%) | 0 (0.0%) |
| 35 to 64 Years | 6 (7.6%) | 2 (4.0%) |
| 65 to 74 Years | 1 (6.2%) | 0 (0.0%) |
| 75 Years and over | 0 (0.0%) | 0 (0.0%) |
Technology Access in Columbus City
Computing Device Access in Columbus City
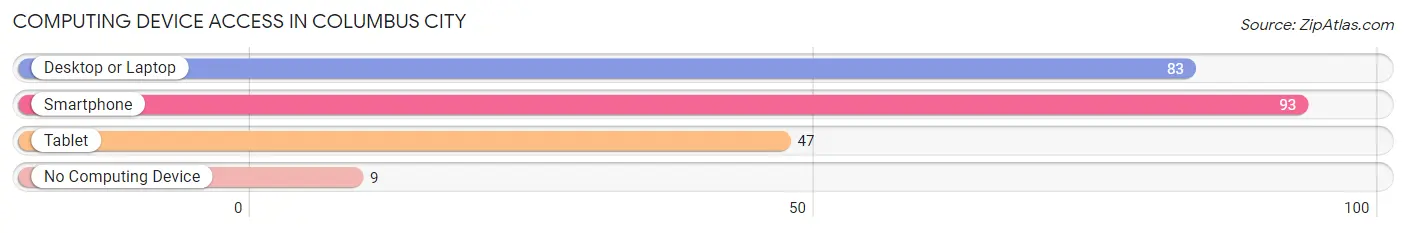
| Device Type | # Households | % Households |
| Desktop or Laptop | 83 | 69.2% |
| Smartphone | 93 | 77.5% |
| Tablet | 47 | 39.2% |
| No Computing Device | 9 | 7.5% |
| Total | 120 | 100.0% |
Internet Access in Columbus City
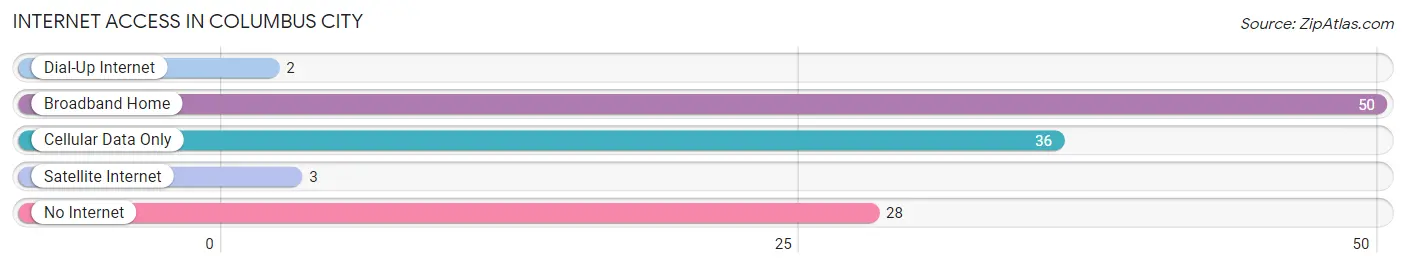
| Internet Type | # Households | % Households |
| Dial-Up Internet | 2 | 1.7% |
| Broadband Home | 50 | 41.7% |
| Cellular Data Only | 36 | 30.0% |
| Satellite Internet | 3 | 2.5% |
| No Internet | 28 | 23.3% |
| Total | 120 | 100.0% |
Columbus City Summary
Columbus City is a small city located in Lee County, Iowa, United States. It is situated on the banks of the Mississippi River, approximately 20 miles south of the state capital of Des Moines. The city has a population of 1,845 as of the 2010 census.
History
The area that is now Columbus City was first settled in 1837 by a group of settlers from Ohio. The city was originally known as “Columbus”, but was later changed to “Columbus City” in 1853. The city was officially incorporated in 1856.
During the Civil War, Columbus City was a major supply center for the Union Army. The city was also the site of a major battle in 1863, when Confederate forces attempted to capture the city. The Union forces were able to repel the attack and the city remained in Union hands.
In the late 19th century, Columbus City became a major center for the lumber industry. The city was home to several sawmills and lumber yards, and the city’s economy was largely dependent on the lumber industry.
In the early 20th century, the city’s economy shifted to agriculture. The city is still home to several large farms, and the city’s economy is still largely dependent on agriculture.
Geography
Columbus City is located in Lee County, Iowa, on the banks of the Mississippi River. The city is situated approximately 20 miles south of the state capital of Des Moines. The city has a total area of 1.3 square miles, all of which is land.
The city is located in a flat, low-lying area, and is surrounded by farmland. The city is located in the Central Lowland region of the United States, and is part of the Driftless Area.
Economy
The economy of Columbus City is largely dependent on agriculture. The city is home to several large farms, and the city’s economy is still largely dependent on agriculture.
The city is also home to several small businesses, including restaurants, retail stores, and service providers. The city is also home to a small manufacturing sector, which produces a variety of products, including furniture, clothing, and electronics.
Demographics
As of the 2010 census, the population of Columbus City was 1,845. The city has a population density of 1,400 people per square mile. The median age of the city’s population is 38.7 years, and the median household income is $45,000.
The city is predominantly white, with a population that is 94.3% white. The city also has a small Hispanic population, which makes up 2.2% of the population. The city also has a small African American population, which makes up 1.2% of the population.
Conclusion
Columbus City is a small city located in Lee County, Iowa, United States. It is situated on the banks of the Mississippi River, approximately 20 miles south of the state capital of Des Moines. The city has a population of 1,845 as of the 2010 census. The city’s economy is largely dependent on agriculture, and the city is also home to several small businesses. The city is predominantly white, with a population that is 94.3% white. The city also has a small Hispanic population, which makes up 2.2% of the population, and a small African American population, which makes up 1.2% of the population.
Common Questions
What is Per Capita Income in Columbus City?
Per Capita income in Columbus City is $33,694.
What is the Median Family Income in Columbus City?
Median Family Income in Columbus City is $82,083.
What is the Median Household income in Columbus City?
Median Household Income in Columbus City is $63,750.
What is Income or Wage Gap in Columbus City?
Income or Wage Gap in Columbus City is 45.7%.
Women in Columbus City earn 54.3 cents for every dollar earned by a man.
What is Inequality or Gini Index in Columbus City?
Inequality or Gini Index in Columbus City is 0.35.
What is the Total Population of Columbus City?
Total Population of Columbus City is 274.
What is the Total Male Population of Columbus City?
Total Male Population of Columbus City is 151.
What is the Total Female Population of Columbus City?
Total Female Population of Columbus City is 123.
What is the Ratio of Males per 100 Females in Columbus City?
There are 122.76 Males per 100 Females in Columbus City.
What is the Ratio of Females per 100 Males in Columbus City?
There are 81.46 Females per 100 Males in Columbus City.
What is the Median Population Age in Columbus City?
Median Population Age in Columbus City is 54.9 Years.
What is the Average Family Size in Columbus City
Average Family Size in Columbus City is 2.8 People.
What is the Average Household Size in Columbus City
Average Household Size in Columbus City is 2.3 People.
How Large is the Labor Force in Columbus City?
There are 150 People in the Labor Forcein in Columbus City.
What is the Percentage of People in the Labor Force in Columbus City?
61.7% of People are in the Labor Force in Columbus City.
What is the Unemployment Rate in Columbus City?
Unemployment Rate in Columbus City is 4.7%.