Hardy, IA Map & Demographics
Hardy Map
Hardy Overview
$39,400
PER CAPITA INCOME
$87,500
AVG FAMILY INCOME
0.39
INEQUALITY / GINI INDEX
17
TOTAL POPULATION
9
MALE POPULATION
8
FEMALE POPULATION
112.50
MALES / 100 FEMALES
88.89
FEMALES / 100 MALES
61.5
MEDIAN AGE
2.0
AVG FAMILY SIZE
1.6
AVG HOUSEHOLD SIZE
7
LABOR FORCE [ PEOPLE ]
46.7%
PERCENT IN LABOR FORCE
Hardy Zip Codes
Hardy Area Codes
Income in Hardy
Income Overview in Hardy
| Characteristic | Number | Measure |
| Per Capita Income | 17 | $39,400 |
| Median Family Income | 6 | $87,500 |
| Mean Family Income | 6 | $82,117 |
| Median Household Income | 11 | $0 |
| Mean Household Income | 11 | $61,500 |
| Income Deficit | 6 | $0 |
| Wage / Income Gap (%) | 17 | 0.00% |
| Wage / Income Gap ($) | 17 | 100.00¢ per $1 |
| Gini / Inequality Index | 17 | 0.39 |
Earnings by Sex in Hardy
| Sex | Number | Average Earnings |
| Male | 3 (37.5%) | $0 |
| Female | 5 (62.5%) | $0 |
| Total | 8 (100.0%) | $0 |
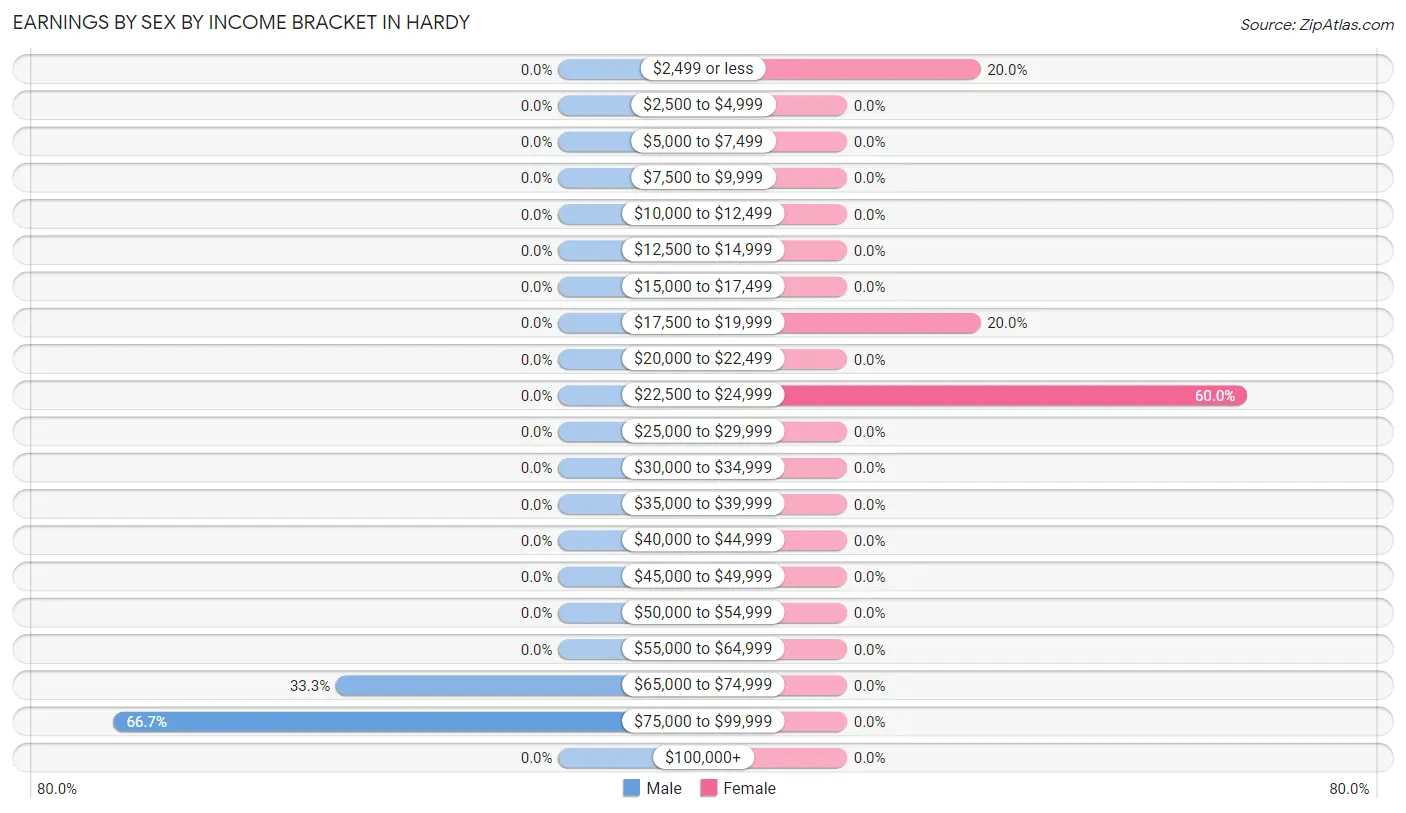
Earnings by Sex by Income Bracket in Hardy
The most common earnings brackets in Hardy are $75,000 to $99,999 for men (2 | 66.7%) and $22,500 to $24,999 for women (3 | 60.0%).
| Income | Male | Female |
| $2,499 or less | 0 (0.0%) | 1 (20.0%) |
| $2,500 to $4,999 | 0 (0.0%) | 0 (0.0%) |
| $5,000 to $7,499 | 0 (0.0%) | 0 (0.0%) |
| $7,500 to $9,999 | 0 (0.0%) | 0 (0.0%) |
| $10,000 to $12,499 | 0 (0.0%) | 0 (0.0%) |
| $12,500 to $14,999 | 0 (0.0%) | 0 (0.0%) |
| $15,000 to $17,499 | 0 (0.0%) | 0 (0.0%) |
| $17,500 to $19,999 | 0 (0.0%) | 1 (20.0%) |
| $20,000 to $22,499 | 0 (0.0%) | 0 (0.0%) |
| $22,500 to $24,999 | 0 (0.0%) | 3 (60.0%) |
| $25,000 to $29,999 | 0 (0.0%) | 0 (0.0%) |
| $30,000 to $34,999 | 0 (0.0%) | 0 (0.0%) |
| $35,000 to $39,999 | 0 (0.0%) | 0 (0.0%) |
| $40,000 to $44,999 | 0 (0.0%) | 0 (0.0%) |
| $45,000 to $49,999 | 0 (0.0%) | 0 (0.0%) |
| $50,000 to $54,999 | 0 (0.0%) | 0 (0.0%) |
| $55,000 to $64,999 | 0 (0.0%) | 0 (0.0%) |
| $65,000 to $74,999 | 1 (33.3%) | 0 (0.0%) |
| $75,000 to $99,999 | 2 (66.7%) | 0 (0.0%) |
| $100,000+ | 0 (0.0%) | 0 (0.0%) |
| Total | 3 (100.0%) | 5 (100.0%) |
Earnings by Sex by Educational Attainment in Hardy
| Educational Attainment | Male Income | Female Income |
| Less than High School | - | - |
| High School Diploma | - | - |
| College or Associate's Degree | - | - |
| Bachelor's Degree | - | - |
| Graduate Degree | - | - |
| Total | - | - |
Family Income in Hardy
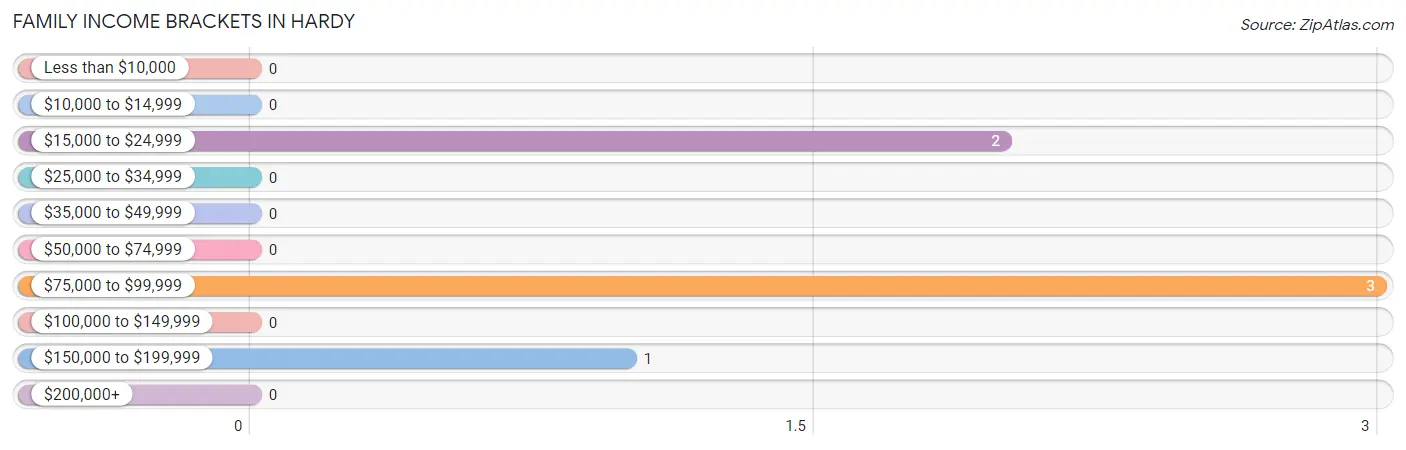
Family Income Brackets in Hardy
According to the Hardy family income data, there are 3 families falling into the $75,000 to $99,999 income range, which is the most common income bracket and makes up 50.0% of all families.
| Income Bracket | # Families | % Families |
| Less than $10,000 | 0 | 0.0% |
| $10,000 to $14,999 | 0 | 0.0% |
| $15,000 to $24,999 | 2 | 33.3% |
| $25,000 to $34,999 | 0 | 0.0% |
| $35,000 to $49,999 | 0 | 0.0% |
| $50,000 to $74,999 | 0 | 0.0% |
| $75,000 to $99,999 | 3 | 50.0% |
| $100,000 to $149,999 | 0 | 0.0% |
| $150,000 to $199,999 | 1 | 16.7% |
| $200,000+ | 0 | 0.0% |
Family Income by Famaliy Size in Hardy
| Income Bracket | # Families | Median Income |
| 2-Person Families | 3 (50.0%) | $0 |
| 3-Person Families | 3 (50.0%) | $0 |
| 4-Person Families | 0 (0.0%) | $0 |
| 5-Person Families | 0 (0.0%) | $0 |
| 6-Person Families | 0 (0.0%) | $0 |
| 7+ Person Families | 0 (0.0%) | $0 |
| Total | 6 (100.0%) | $87,500 |
Family Income by Number of Earners in Hardy
| Number of Earners | # Families | Median Income |
| No Earners | 3 (50.0%) | $0 |
| 1 Earner | 2 (33.3%) | $0 |
| 2 Earners | 0 (0.0%) | $0 |
| 3+ Earners | 1 (16.7%) | $0 |
| Total | 6 (100.0%) | $87,500 |
Household Income in Hardy
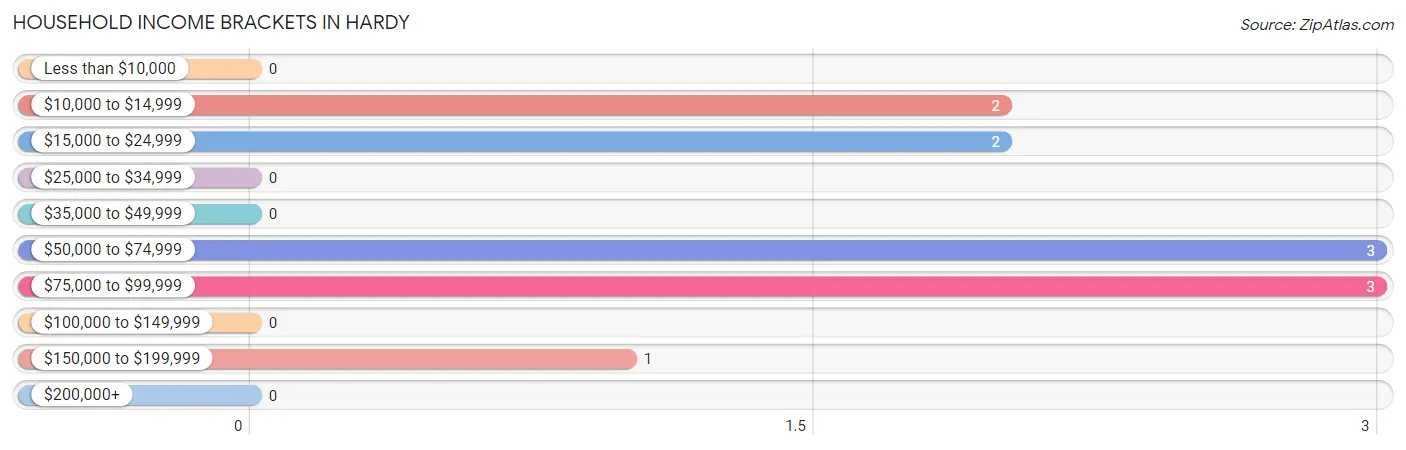
Household Income Brackets in Hardy
With 3 households falling in the category, the $50,000 to $74,999 income range is the most frequent in Hardy, accounting for 27.3% of all households.
| Income Bracket | # Households | % Households |
| Less than $10,000 | 0 | 0.0% |
| $10,000 to $14,999 | 2 | 18.2% |
| $15,000 to $24,999 | 2 | 18.2% |
| $25,000 to $34,999 | 0 | 0.0% |
| $35,000 to $49,999 | 0 | 0.0% |
| $50,000 to $74,999 | 3 | 27.3% |
| $75,000 to $99,999 | 3 | 27.3% |
| $100,000 to $149,999 | 0 | 0.0% |
| $150,000 to $199,999 | 1 | 9.1% |
| $200,000+ | 0 | 0.0% |
Household Income by Householder Age in Hardy
The median household income in Hardy is $0, with the highest median household income of $86,250 found in the 45 to 64 years age bracket for the primary householder. A total of 5 households (45.5%) fall into this category.
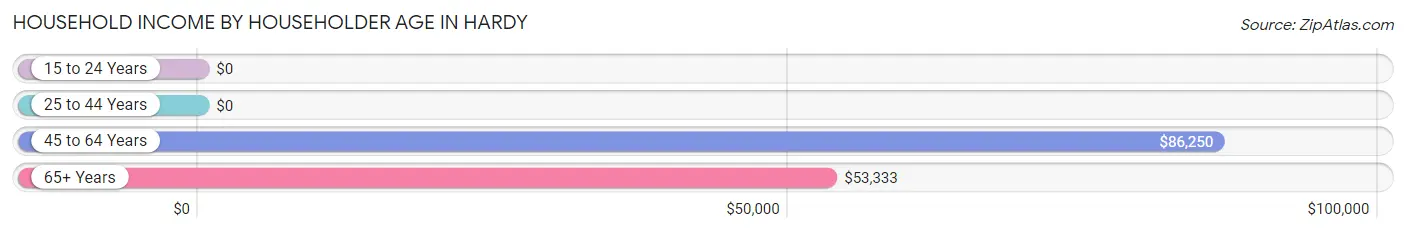
| Income Bracket | # Households | Median Income |
| 15 to 24 Years | 0 (0.0%) | $0 |
| 25 to 44 Years | 0 (0.0%) | $0 |
| 45 to 64 Years | 5 (45.5%) | $86,250 |
| 65+ Years | 6 (54.5%) | $53,333 |
| Total | 11 (100.0%) | $0 |
Poverty in Hardy
Income Below Poverty by Sex and Age in Hardy
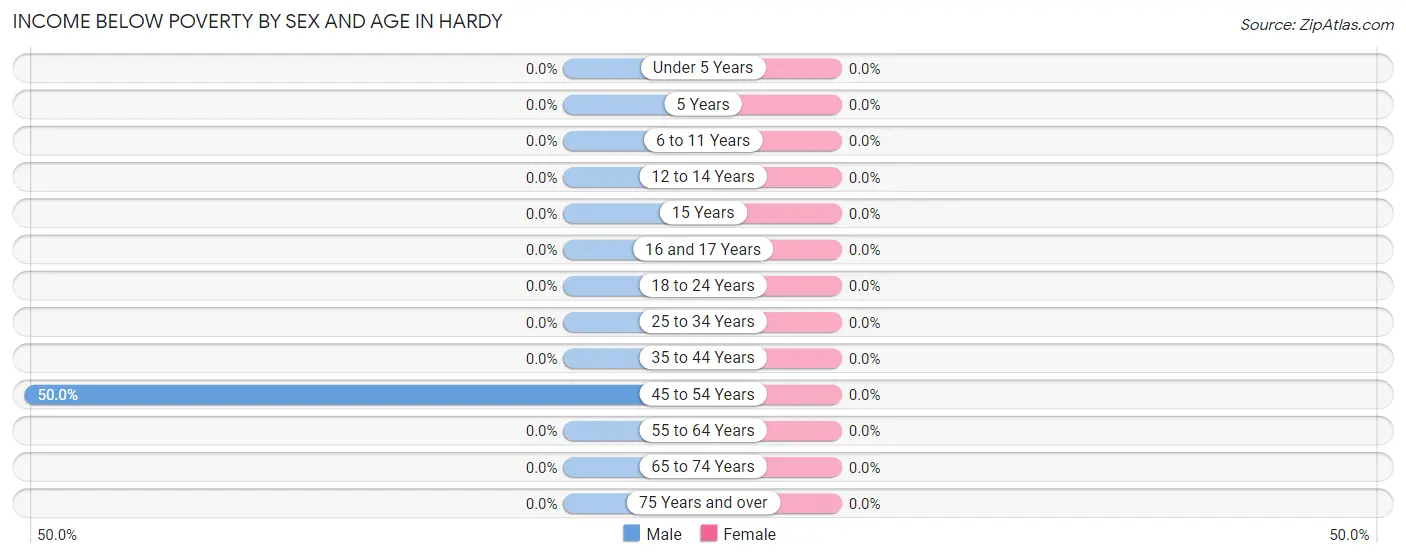
| Age Bracket | Male | Female |
| Under 5 Years | 0 (0.0%) | 0 (0.0%) |
| 5 Years | 0 (0.0%) | 0 (0.0%) |
| 6 to 11 Years | 0 (0.0%) | 0 (0.0%) |
| 12 to 14 Years | 0 (0.0%) | 0 (0.0%) |
| 15 Years | 0 (0.0%) | 0 (0.0%) |
| 16 and 17 Years | 0 (0.0%) | 0 (0.0%) |
| 18 to 24 Years | 0 (0.0%) | 0 (0.0%) |
| 25 to 34 Years | 0 (0.0%) | 0 (0.0%) |
| 35 to 44 Years | 0 (0.0%) | 0 (0.0%) |
| 45 to 54 Years | 2 (50.0%) | 0 (0.0%) |
| 55 to 64 Years | 0 (0.0%) | 0 (0.0%) |
| 65 to 74 Years | 0 (0.0%) | 0 (0.0%) |
| 75 Years and over | 0 (0.0%) | 0 (0.0%) |
| Total | 2 (22.2%) | 0 (0.0%) |
Income Above Poverty by Sex and Age in Hardy
According to the poverty statistics in Hardy, males aged 12 to 14 years and females aged 12 to 14 years are the age groups that are most secure financially, with 100.0% of males and 100.0% of females in these age groups living above the poverty line.
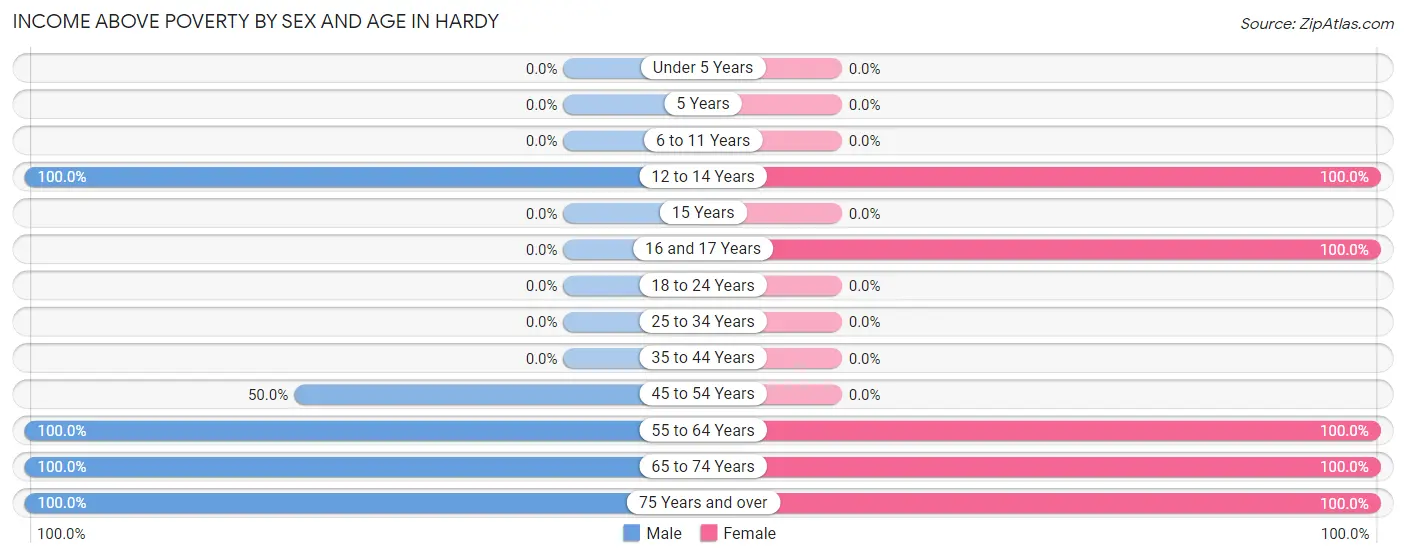
| Age Bracket | Male | Female |
| Under 5 Years | 0 (0.0%) | 0 (0.0%) |
| 5 Years | 0 (0.0%) | 0 (0.0%) |
| 6 to 11 Years | 0 (0.0%) | 0 (0.0%) |
| 12 to 14 Years | 1 (100.0%) | 1 (100.0%) |
| 15 Years | 0 (0.0%) | 0 (0.0%) |
| 16 and 17 Years | 0 (0.0%) | 1 (100.0%) |
| 18 to 24 Years | 0 (0.0%) | 0 (0.0%) |
| 25 to 34 Years | 0 (0.0%) | 0 (0.0%) |
| 35 to 44 Years | 0 (0.0%) | 0 (0.0%) |
| 45 to 54 Years | 2 (50.0%) | 0 (0.0%) |
| 55 to 64 Years | 1 (100.0%) | 2 (100.0%) |
| 65 to 74 Years | 1 (100.0%) | 3 (100.0%) |
| 75 Years and over | 2 (100.0%) | 1 (100.0%) |
| Total | 7 (77.8%) | 8 (100.0%) |
Income Below Poverty Among Married-Couple Families in Hardy
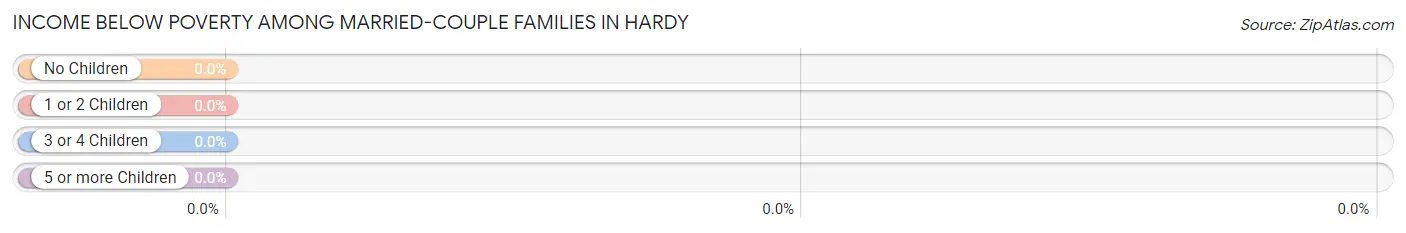
| Children | Above Poverty | Below Poverty |
| No Children | 3 (100.0%) | 0 (0.0%) |
| 1 or 2 Children | 1 (100.0%) | 0 (0.0%) |
| 3 or 4 Children | 0 (0.0%) | 0 (0.0%) |
| 5 or more Children | 0 (0.0%) | 0 (0.0%) |
| Total | 4 (100.0%) | 0 (0.0%) |
Income Below Poverty Among Single-Parent Households in Hardy
| Children | Single Father | Single Mother |
| No Children | 0 (0.0%) | 0 (0.0%) |
| 1 or 2 Children | 0 (0.0%) | 0 (0.0%) |
| 3 or 4 Children | 0 (0.0%) | 0 (0.0%) |
| 5 or more Children | 0 (0.0%) | 0 (0.0%) |
| Total | 0 (0.0%) | 0 (0.0%) |
Income Below Poverty Among Married-Couple vs Single-Parent Households in Hardy
| Children | Married-Couple Families | Single-Parent Households |
| No Children | 0 (0.0%) | 0 (0.0%) |
| 1 or 2 Children | 0 (0.0%) | 0 (0.0%) |
| 3 or 4 Children | 0 (0.0%) | 0 (0.0%) |
| 5 or more Children | 0 (0.0%) | 0 (0.0%) |
| Total | 0 (0.0%) | 0 (0.0%) |
Race in Hardy
The most populous races in Hardy are White / Caucasian (16 | 94.1%), and Two or more Races (1 | 5.9%).
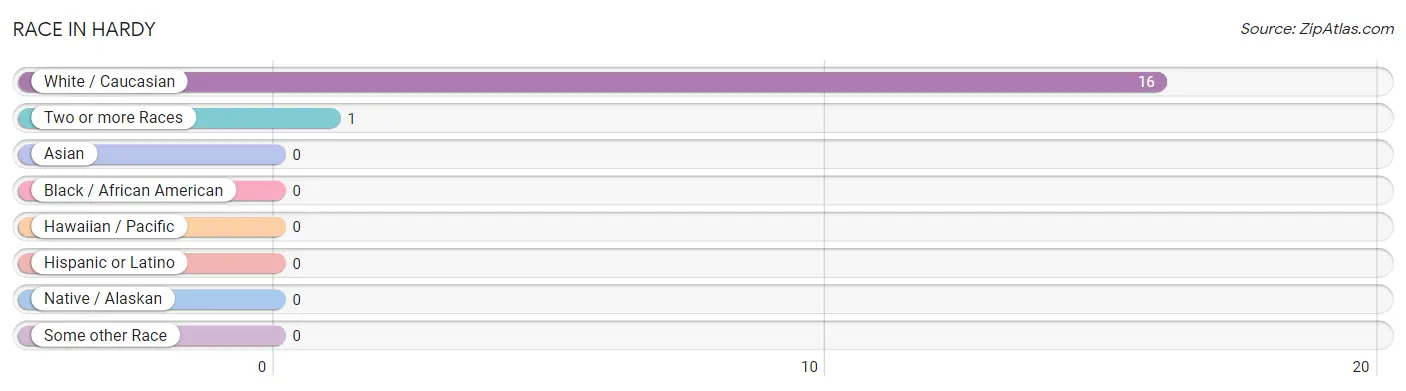
| Race | # Population | % Population |
| Asian | 0 | 0.0% |
| Black / African American | 0 | 0.0% |
| Hawaiian / Pacific | 0 | 0.0% |
| Hispanic or Latino | 0 | 0.0% |
| Native / Alaskan | 0 | 0.0% |
| White / Caucasian | 16 | 94.1% |
| Two or more Races | 1 | 5.9% |
| Some other Race | 0 | 0.0% |
| Total | 17 | 100.0% |
Ancestry in Hardy
The most populous ancestries reported in Hardy are German (6 | 35.3%), Irish (4 | 23.5%), Scottish (2 | 11.8%), African (1 | 5.9%), and English (1 | 5.9%), together accounting for 82.3% of all Hardy residents.
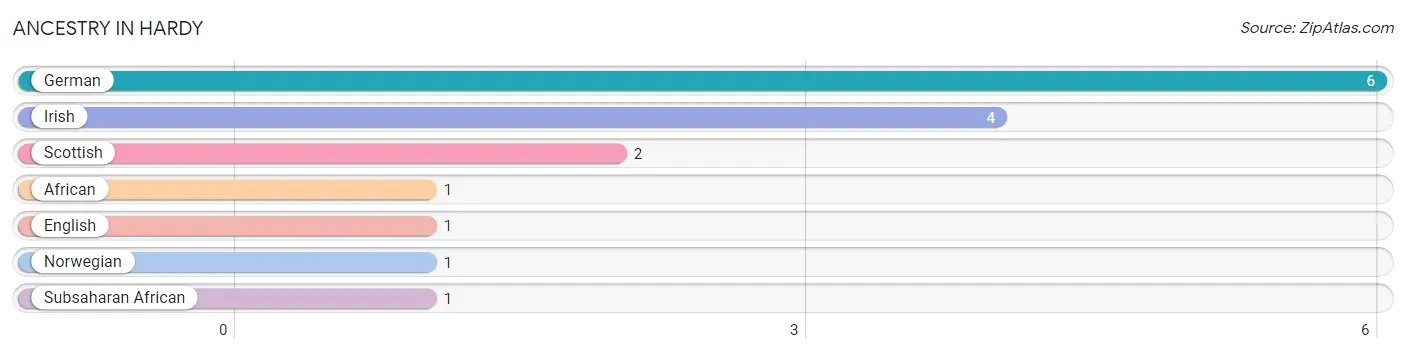
| Ancestry | # Population | % Population |
| African | 1 | 5.9% |
| English | 1 | 5.9% |
| German | 6 | 35.3% |
| Irish | 4 | 23.5% |
| Norwegian | 1 | 5.9% |
| Scottish | 2 | 11.8% |
| Subsaharan African | 1 | 5.9% | View All 7 Rows |
Immigrants in Hardy

| Immigration Origin | # Population | % Population | View All 0 Rows |
Sex and Age in Hardy
Sex and Age in Hardy
The most populous age groups in Hardy are 45 to 49 Years (2 | 22.2%) for men and 70 to 74 Years (3 | 37.5%) for women.
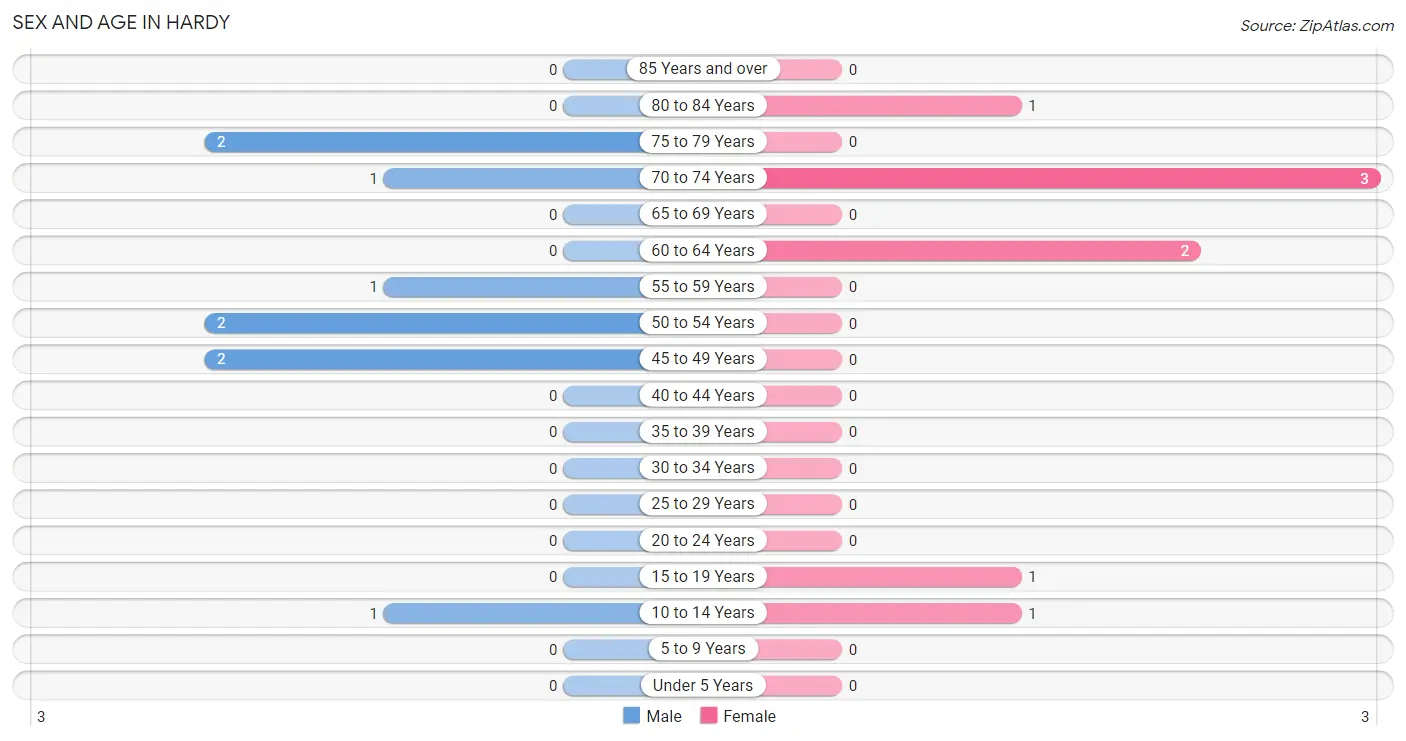
| Age Bracket | Male | Female |
| Under 5 Years | 0 (0.0%) | 0 (0.0%) |
| 5 to 9 Years | 0 (0.0%) | 0 (0.0%) |
| 10 to 14 Years | 1 (11.1%) | 1 (12.5%) |
| 15 to 19 Years | 0 (0.0%) | 1 (12.5%) |
| 20 to 24 Years | 0 (0.0%) | 0 (0.0%) |
| 25 to 29 Years | 0 (0.0%) | 0 (0.0%) |
| 30 to 34 Years | 0 (0.0%) | 0 (0.0%) |
| 35 to 39 Years | 0 (0.0%) | 0 (0.0%) |
| 40 to 44 Years | 0 (0.0%) | 0 (0.0%) |
| 45 to 49 Years | 2 (22.2%) | 0 (0.0%) |
| 50 to 54 Years | 2 (22.2%) | 0 (0.0%) |
| 55 to 59 Years | 1 (11.1%) | 0 (0.0%) |
| 60 to 64 Years | 0 (0.0%) | 2 (25.0%) |
| 65 to 69 Years | 0 (0.0%) | 0 (0.0%) |
| 70 to 74 Years | 1 (11.1%) | 3 (37.5%) |
| 75 to 79 Years | 2 (22.2%) | 0 (0.0%) |
| 80 to 84 Years | 0 (0.0%) | 1 (12.5%) |
| 85 Years and over | 0 (0.0%) | 0 (0.0%) |
| Total | 9 (100.0%) | 8 (100.0%) |
Families and Households in Hardy
Median Family Size in Hardy
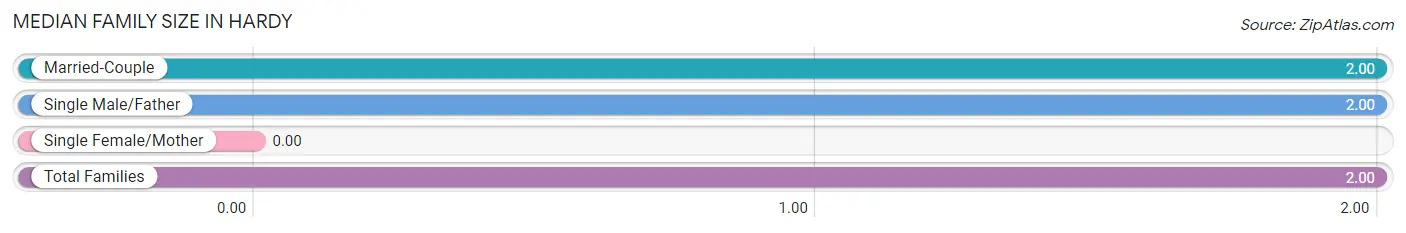
| Family Type | # Families | Family Size |
| Married-Couple | 4 (66.7%) | 2.00 |
| Single Male/Father | 2 (33.3%) | 2.00 |
| Single Female/Mother | 0 (0.0%) | - |
| Total Families | 6 (100.0%) | 2.00 |
Median Household Size in Hardy
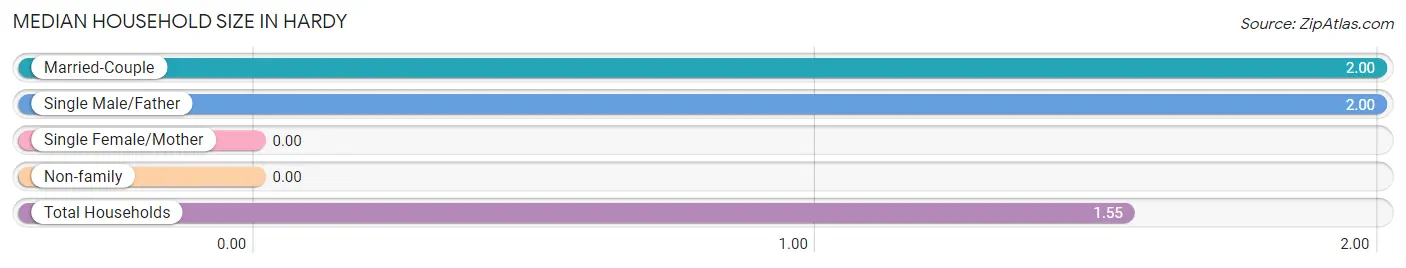
| Household Type | # Households | Household Size |
| Married-Couple | 4 (36.4%) | 2.00 |
| Single Male/Father | 2 (18.2%) | 2.00 |
| Single Female/Mother | 0 (0.0%) | - |
| Non-family | 5 (45.5%) | - |
| Total Households | 11 (100.0%) | 1.55 |
Household Size by Marriage Status in Hardy
Out of a total of 11 households in Hardy, 6 (54.5%) are family households, while 5 (45.5%) are nonfamily households. The most numerous type of family households are 2-person households, comprising 3, and the most common type of nonfamily households are 1-person households, comprising 5.
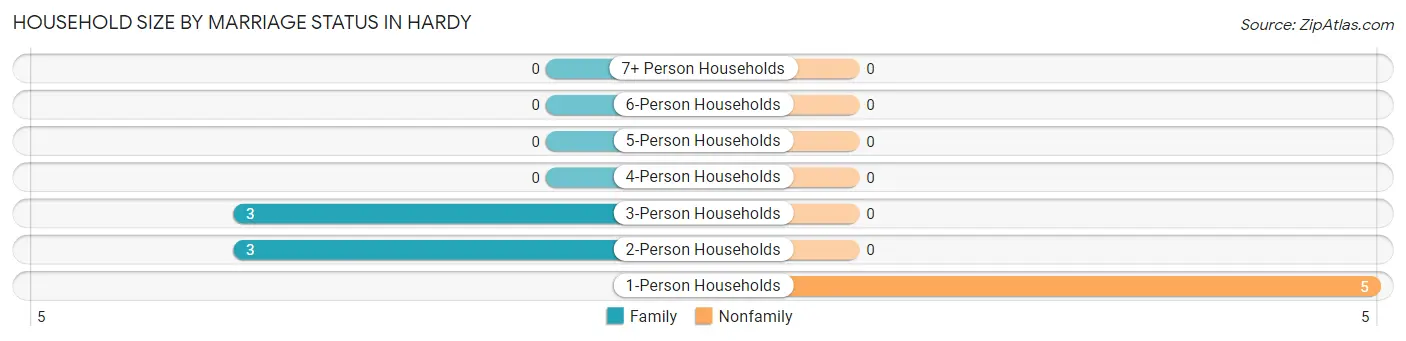
| Household Size | Family Households | Nonfamily Households |
| 1-Person Households | - | 5 (45.5%) |
| 2-Person Households | 3 (27.3%) | 0 (0.0%) |
| 3-Person Households | 3 (27.3%) | 0 (0.0%) |
| 4-Person Households | 0 (0.0%) | 0 (0.0%) |
| 5-Person Households | 0 (0.0%) | 0 (0.0%) |
| 6-Person Households | 0 (0.0%) | 0 (0.0%) |
| 7+ Person Households | 0 (0.0%) | 0 (0.0%) |
| Total | 6 (54.5%) | 5 (45.5%) |
Female Fertility in Hardy
Fertility by Age in Hardy
| Age Bracket | Women with Births | Births / 1,000 Women |
| 15 to 19 years | 0 (0.0%) | 0.0 |
| 20 to 34 years | 0 (0.0%) | 0.0 |
| 35 to 50 years | 0 (0.0%) | 0.0 |
| Total | 0 (0.0%) | 0.0 |
Fertility by Age by Marriage Status in Hardy
| Age Bracket | Married | Unmarried |
| 15 to 19 years | 0 (0.0%) | 0 (0.0%) |
| 20 to 34 years | 0 (0.0%) | 0 (0.0%) |
| 35 to 50 years | 0 (0.0%) | 0 (0.0%) |
| Total | 0 (0.0%) | 0 (0.0%) |
Fertility by Education in Hardy
| Educational Attainment | Women with Births | Births / 1,000 Women |
| Less than High School | 0 (0.0%) | 0.0 |
| High School Diploma | 0 (0.0%) | 0.0 |
| College or Associate's Degree | 0 (0.0%) | 0.0 |
| Bachelor's Degree | 0 (0.0%) | 0.0 |
| Graduate Degree | 0 (0.0%) | 0.0 |
| Total | 0 (0.0%) | 0.0 |
Fertility by Education by Marriage Status in Hardy
| Educational Attainment | Married | Unmarried |
| Less than High School | 0 (0.0%) | 0 (0.0%) |
| High School Diploma | 0 (0.0%) | 0 (0.0%) |
| College or Associate's Degree | 0 (0.0%) | 0 (0.0%) |
| Bachelor's Degree | 0 (0.0%) | 0 (0.0%) |
| Graduate Degree | 0 (0.0%) | 0 (0.0%) |
| Total | 0 (0.0%) | 0 (0.0%) |
Employment Characteristics in Hardy
Employment by Class of Employer in Hardy
Among the 7 employed individuals in Hardy, private company employees (6 | 85.7%), and local government employees (1 | 14.3%) make up the most common classes of employment.
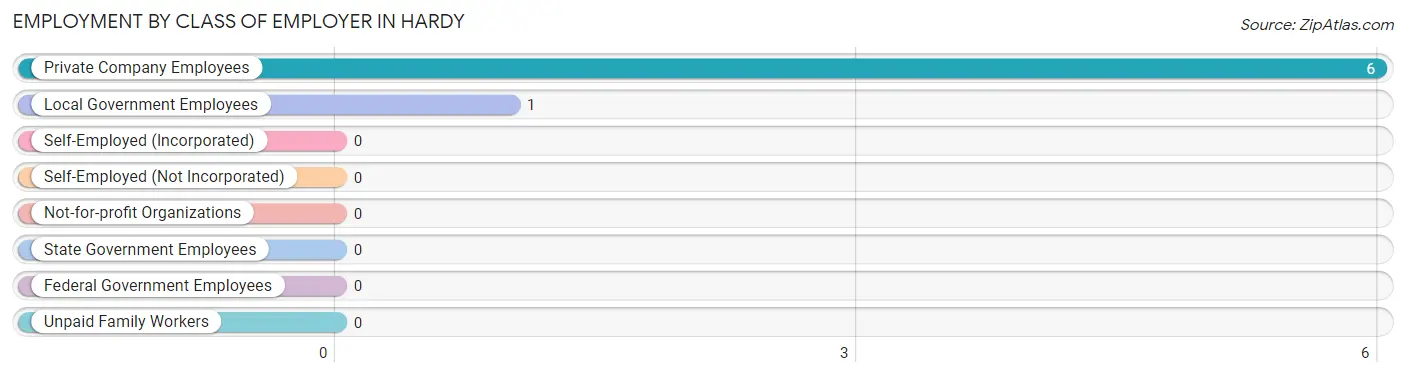
| Employer Class | # Employees | % Employees |
| Private Company Employees | 6 | 85.7% |
| Self-Employed (Incorporated) | 0 | 0.0% |
| Self-Employed (Not Incorporated) | 0 | 0.0% |
| Not-for-profit Organizations | 0 | 0.0% |
| Local Government Employees | 1 | 14.3% |
| State Government Employees | 0 | 0.0% |
| Federal Government Employees | 0 | 0.0% |
| Unpaid Family Workers | 0 | 0.0% |
| Total | 7 | 100.0% |
Employment Status by Age in Hardy
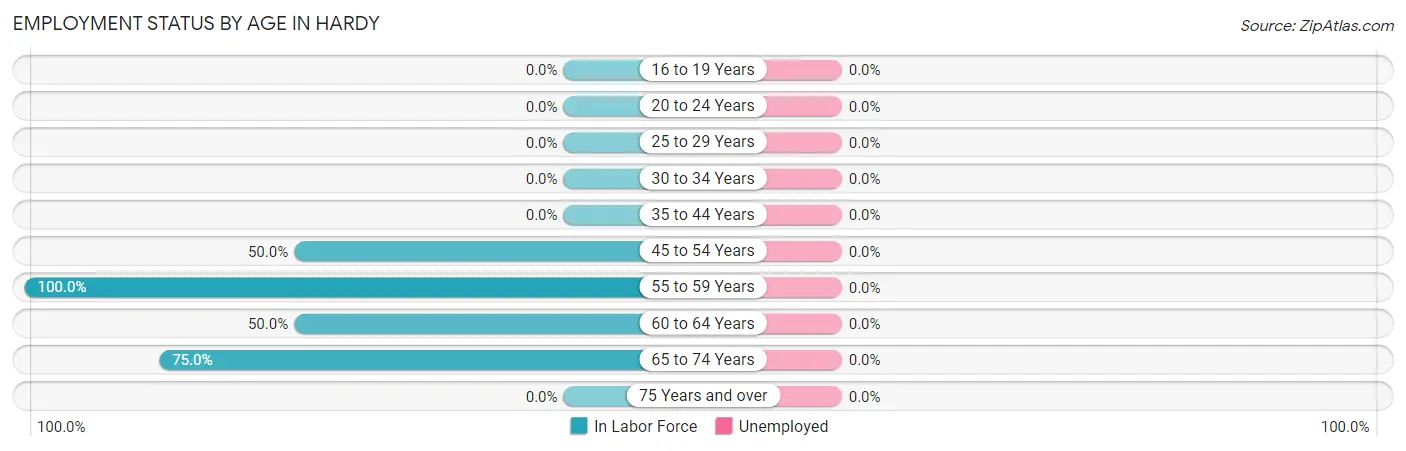
| Age Bracket | In Labor Force | Unemployed |
| 16 to 19 Years | 0 (0.0%) | 0 (0.0%) |
| 20 to 24 Years | 0 (0.0%) | 0 (0.0%) |
| 25 to 29 Years | 0 (0.0%) | 0 (0.0%) |
| 30 to 34 Years | 0 (0.0%) | 0 (0.0%) |
| 35 to 44 Years | 0 (0.0%) | 0 (0.0%) |
| 45 to 54 Years | 2 (50.0%) | 0 (0.0%) |
| 55 to 59 Years | 1 (100.0%) | 0 (0.0%) |
| 60 to 64 Years | 1 (50.0%) | 0 (0.0%) |
| 65 to 74 Years | 3 (75.0%) | 0 (0.0%) |
| 75 Years and over | 0 (0.0%) | 0 (0.0%) |
| Total | 7 (46.7%) | 0 (0.0%) |
Employment Status by Educational Attainment in Hardy
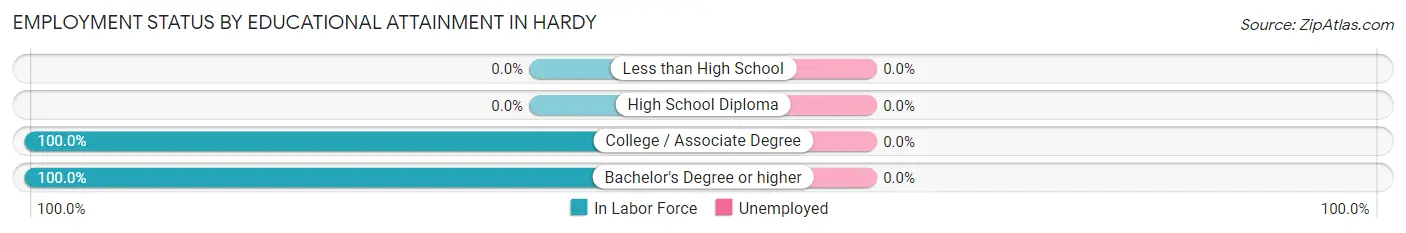
| Educational Attainment | In Labor Force | Unemployed |
| Less than High School | 0 (0.0%) | 0 (0.0%) |
| High School Diploma | 0 (0.0%) | 0 (0.0%) |
| College / Associate Degree | 1 (100.0%) | 0 (0.0%) |
| Bachelor's Degree or higher | 3 (100.0%) | 0 (0.0%) |
| Total | 4 (57.1%) | 0 (0.0%) |
Employment Occupations by Sex in Hardy
Management, Business, Science and Arts Occupations
The most common Management, Business, Science and Arts occupations in Hardy are Community & Social Service (1 | 14.3%), and Education Instruction & Library (1 | 14.3%).
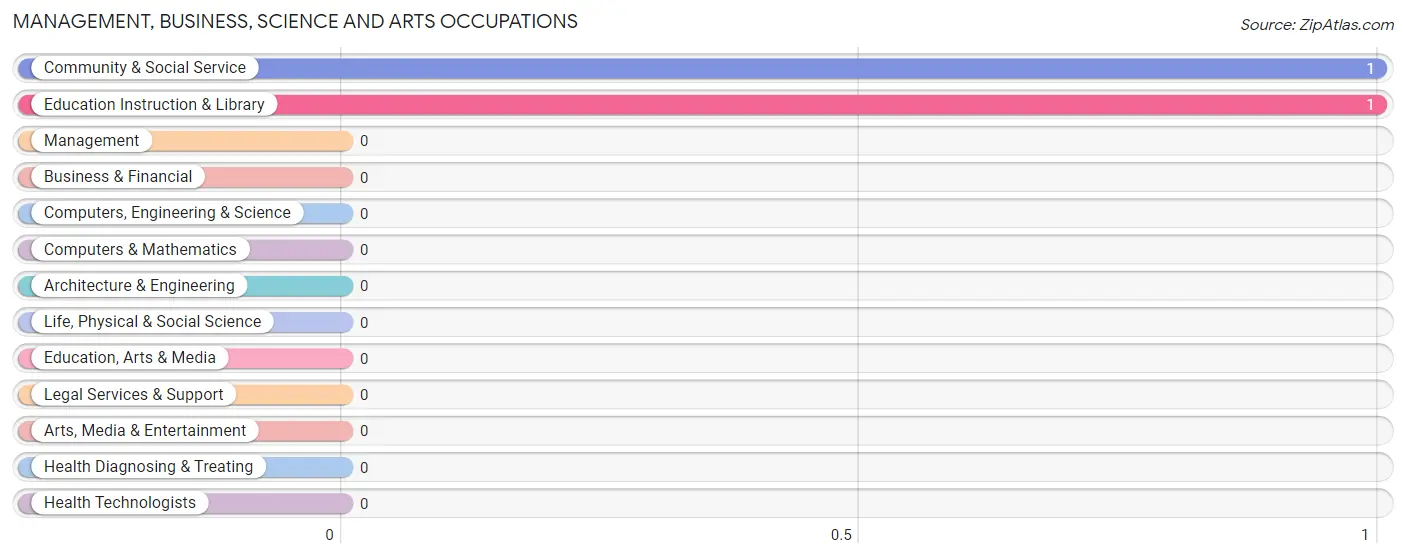
Management, Business, Science and Arts Occupations by Sex
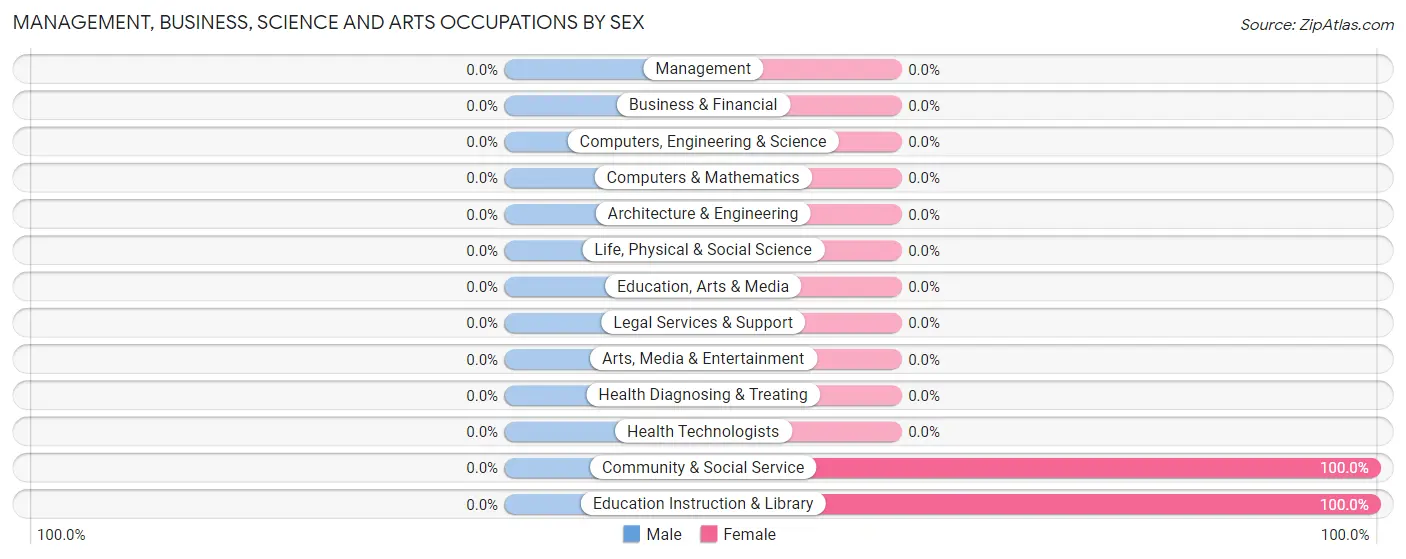
| Occupation | Male | Female |
| Management | 0 (0.0%) | 0 (0.0%) |
| Business & Financial | 0 (0.0%) | 0 (0.0%) |
| Computers, Engineering & Science | 0 (0.0%) | 0 (0.0%) |
| Computers & Mathematics | 0 (0.0%) | 0 (0.0%) |
| Architecture & Engineering | 0 (0.0%) | 0 (0.0%) |
| Life, Physical & Social Science | 0 (0.0%) | 0 (0.0%) |
| Community & Social Service | 0 (0.0%) | 1 (100.0%) |
| Education, Arts & Media | 0 (0.0%) | 0 (0.0%) |
| Legal Services & Support | 0 (0.0%) | 0 (0.0%) |
| Education Instruction & Library | 0 (0.0%) | 1 (100.0%) |
| Arts, Media & Entertainment | 0 (0.0%) | 0 (0.0%) |
| Health Diagnosing & Treating | 0 (0.0%) | 0 (0.0%) |
| Health Technologists | 0 (0.0%) | 0 (0.0%) |
| Total (Category) | 0 (0.0%) | 1 (100.0%) |
| Total (Overall) | 3 (42.9%) | 4 (57.1%) |
Services Occupations
The most common Services occupations in Hardy are , and Cleaning & Maintenance (1 | 14.3%).
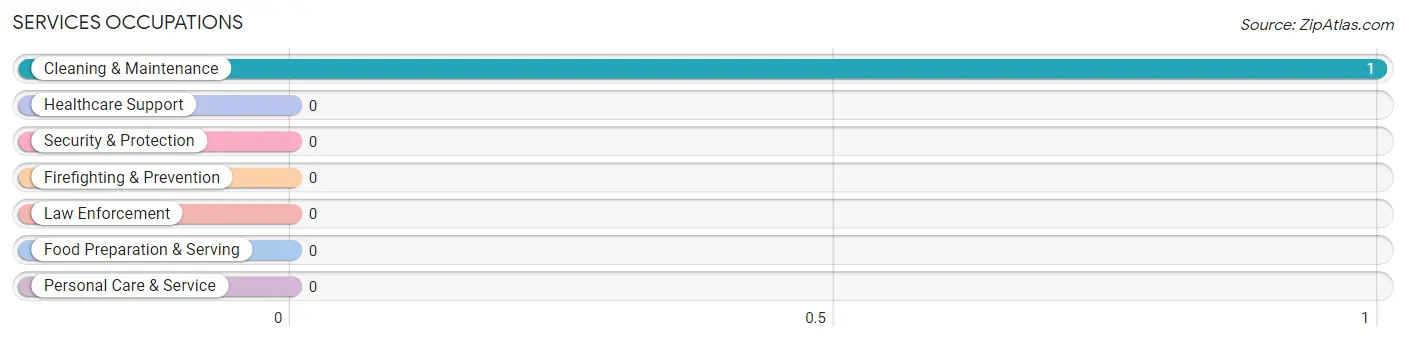
Services Occupations by Sex
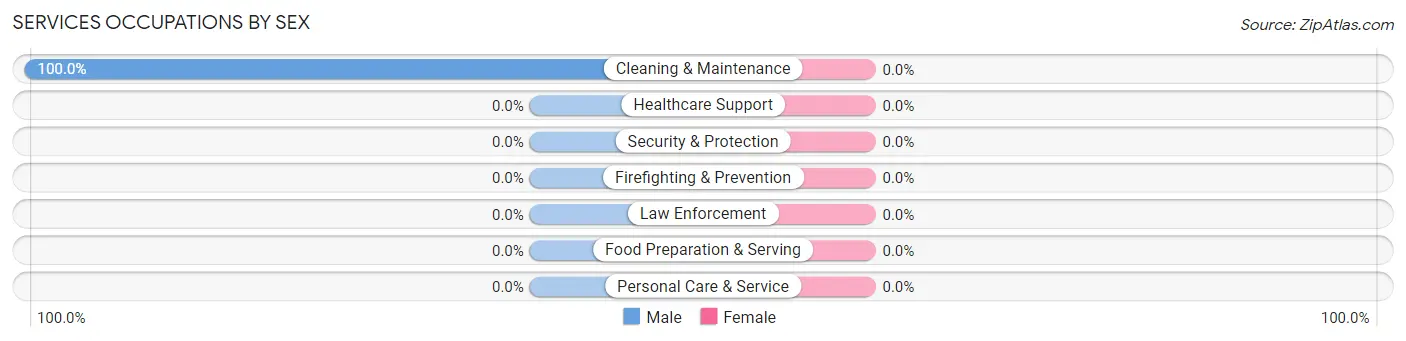
| Occupation | Male | Female |
| Healthcare Support | 0 (0.0%) | 0 (0.0%) |
| Security & Protection | 0 (0.0%) | 0 (0.0%) |
| Firefighting & Prevention | 0 (0.0%) | 0 (0.0%) |
| Law Enforcement | 0 (0.0%) | 0 (0.0%) |
| Food Preparation & Serving | 0 (0.0%) | 0 (0.0%) |
| Cleaning & Maintenance | 1 (100.0%) | 0 (0.0%) |
| Personal Care & Service | 0 (0.0%) | 0 (0.0%) |
| Total (Category) | 1 (100.0%) | 0 (0.0%) |
| Total (Overall) | 3 (42.9%) | 4 (57.1%) |
Sales and Office Occupations
Sales and Office Occupations by Sex
| Occupation | Male | Female |
| Sales & Related | 0 (0.0%) | 0 (0.0%) |
| Office & Administration | 0 (0.0%) | 0 (0.0%) |
| Total (Category) | 0 (0.0%) | 0 (0.0%) |
| Total (Overall) | 3 (42.9%) | 4 (57.1%) |
Natural Resources, Construction and Maintenance Occupations
Natural Resources, Construction and Maintenance Occupations by Sex
| Occupation | Male | Female |
| Farming, Fishing & Forestry | 0 (0.0%) | 0 (0.0%) |
| Construction & Extraction | 0 (0.0%) | 0 (0.0%) |
| Installation, Maintenance & Repair | 0 (0.0%) | 0 (0.0%) |
| Total (Category) | 0 (0.0%) | 0 (0.0%) |
| Total (Overall) | 3 (42.9%) | 4 (57.1%) |
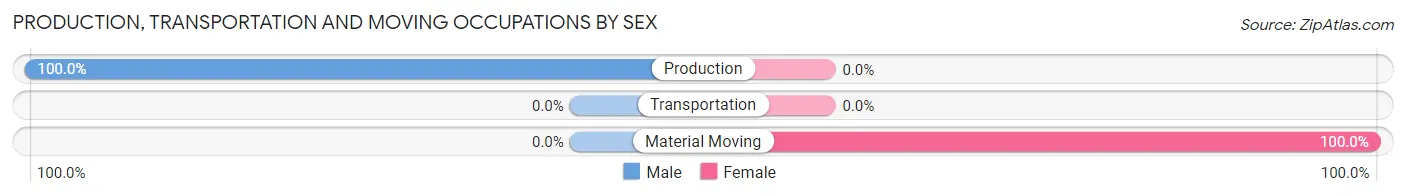
Production, Transportation and Moving Occupations
The most common Production, Transportation and Moving occupations in Hardy are Material Moving (3 | 42.9%), and Production (2 | 28.6%).
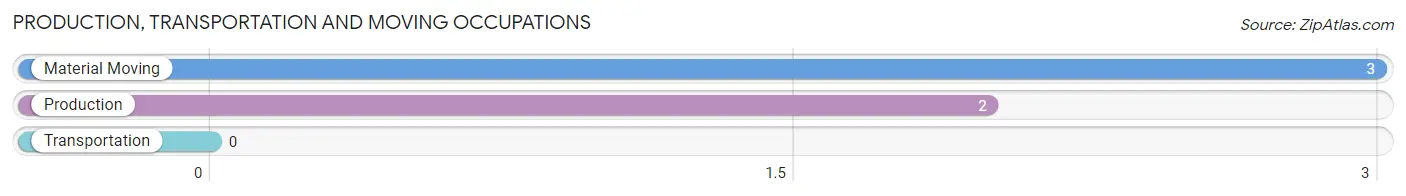
Production, Transportation and Moving Occupations by Sex
| Occupation | Male | Female |
| Production | 2 (100.0%) | 0 (0.0%) |
| Transportation | 0 (0.0%) | 0 (0.0%) |
| Material Moving | 0 (0.0%) | 3 (100.0%) |
| Total (Category) | 2 (40.0%) | 3 (60.0%) |
| Total (Overall) | 3 (42.9%) | 4 (57.1%) |
Employment Industries by Sex in Hardy
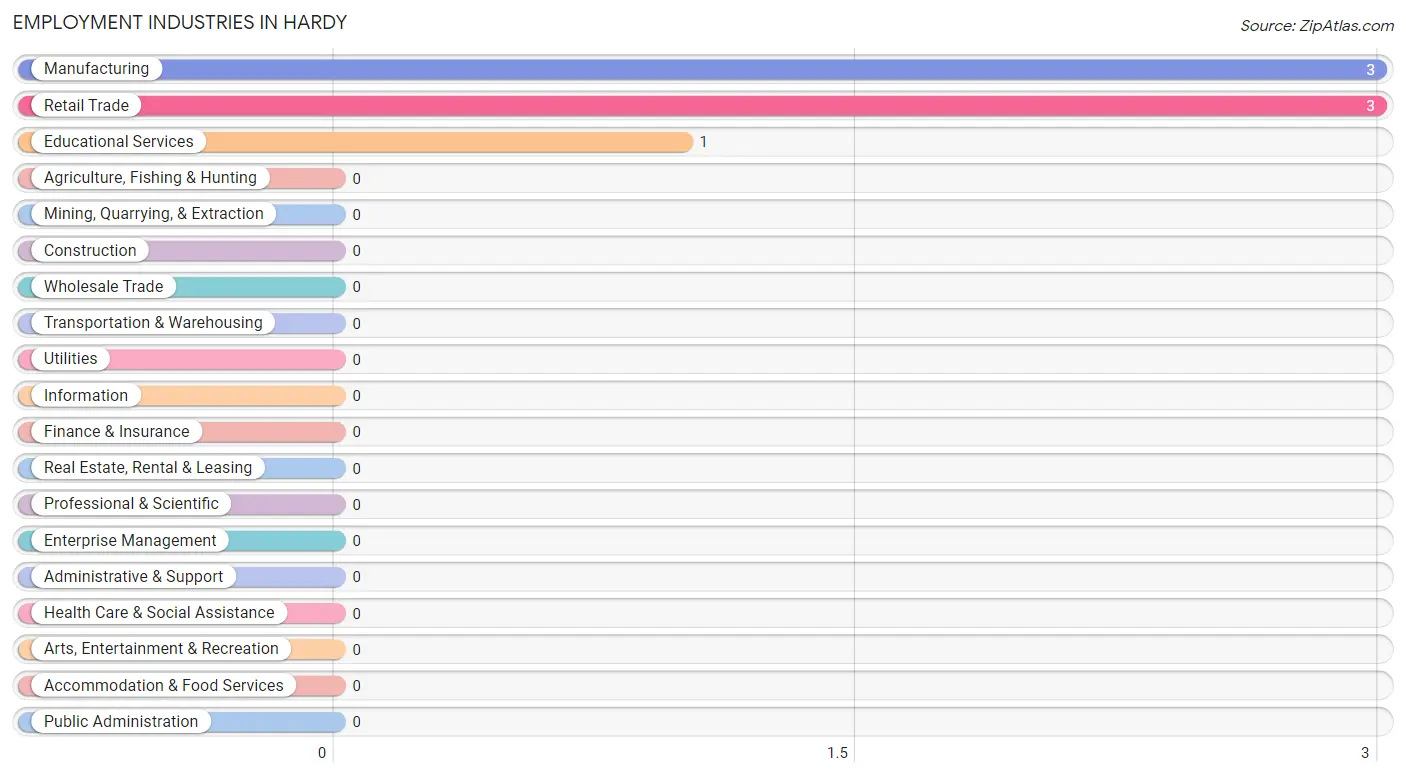
Employment Industries in Hardy
The major employment industries in Hardy include Manufacturing (3 | 42.9%), Retail Trade (3 | 42.9%), and Educational Services (1 | 14.3%).
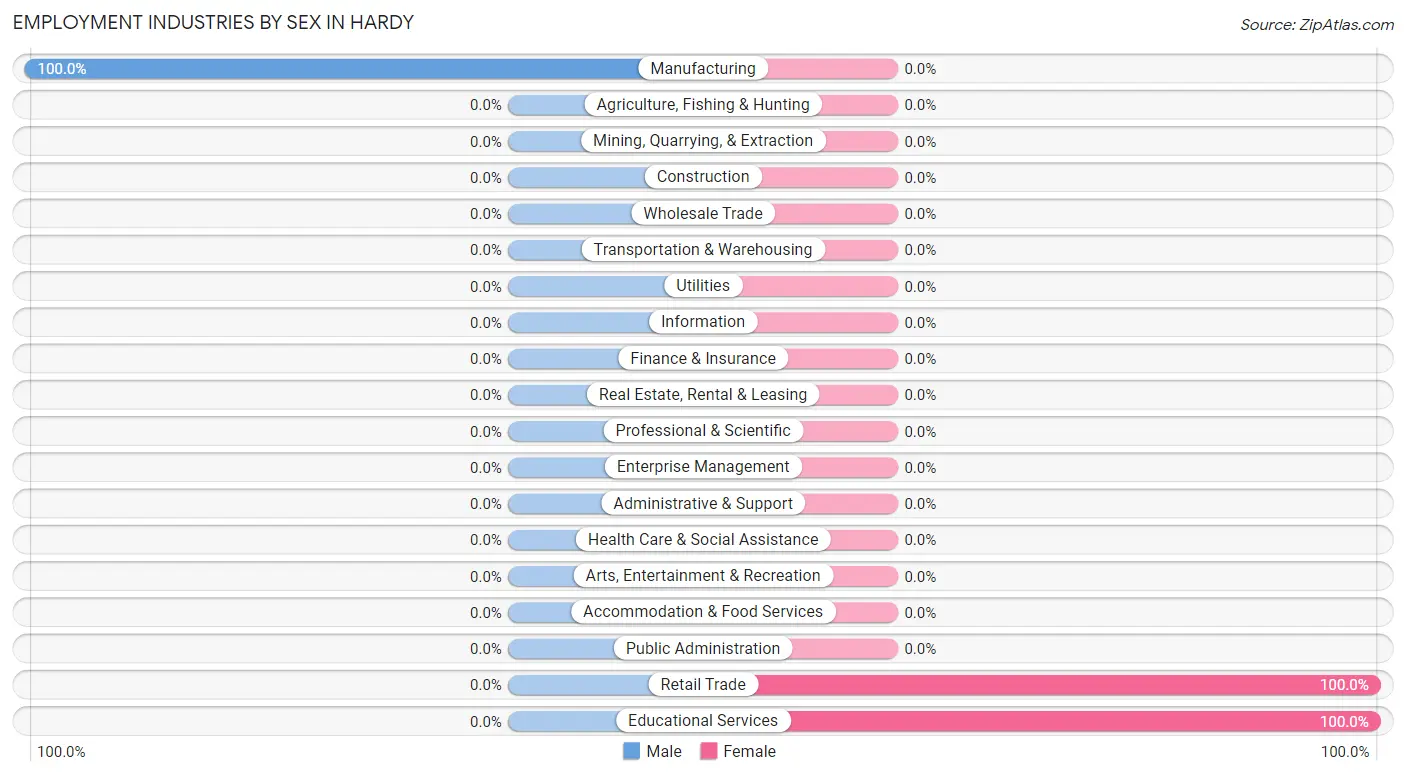
Employment Industries by Sex in Hardy
| Industry | Male | Female |
| Agriculture, Fishing & Hunting | 0 (0.0%) | 0 (0.0%) |
| Mining, Quarrying, & Extraction | 0 (0.0%) | 0 (0.0%) |
| Construction | 0 (0.0%) | 0 (0.0%) |
| Manufacturing | 3 (100.0%) | 0 (0.0%) |
| Wholesale Trade | 0 (0.0%) | 0 (0.0%) |
| Retail Trade | 0 (0.0%) | 3 (100.0%) |
| Transportation & Warehousing | 0 (0.0%) | 0 (0.0%) |
| Utilities | 0 (0.0%) | 0 (0.0%) |
| Information | 0 (0.0%) | 0 (0.0%) |
| Finance & Insurance | 0 (0.0%) | 0 (0.0%) |
| Real Estate, Rental & Leasing | 0 (0.0%) | 0 (0.0%) |
| Professional & Scientific | 0 (0.0%) | 0 (0.0%) |
| Enterprise Management | 0 (0.0%) | 0 (0.0%) |
| Administrative & Support | 0 (0.0%) | 0 (0.0%) |
| Educational Services | 0 (0.0%) | 1 (100.0%) |
| Health Care & Social Assistance | 0 (0.0%) | 0 (0.0%) |
| Arts, Entertainment & Recreation | 0 (0.0%) | 0 (0.0%) |
| Accommodation & Food Services | 0 (0.0%) | 0 (0.0%) |
| Public Administration | 0 (0.0%) | 0 (0.0%) |
| Total | 3 (42.9%) | 4 (57.1%) |
Education in Hardy
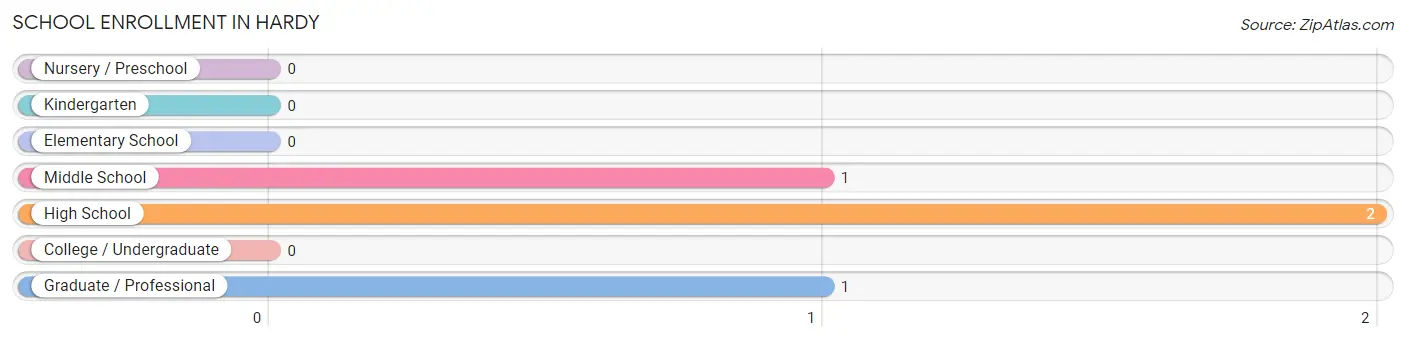
School Enrollment in Hardy
The most common levels of schooling among the 4 students in Hardy are high school (2 | 50.0%), middle school (1 | 25.0%), and graduate / professional (1 | 25.0%).
| School Level | # Students | % Students |
| Nursery / Preschool | 0 | 0.0% |
| Kindergarten | 0 | 0.0% |
| Elementary School | 0 | 0.0% |
| Middle School | 1 | 25.0% |
| High School | 2 | 50.0% |
| College / Undergraduate | 0 | 0.0% |
| Graduate / Professional | 1 | 25.0% |
| Total | 4 | 100.0% |
School Enrollment by Age by Funding Source in Hardy
Out of a total of 4 students who are enrolled in schools in Hardy, 1 (25.0%) attend a private institution, while the remaining 3 (75.0%) are enrolled in public schools. The age group of 35 years and over has the highest likelihood of being enrolled in private schools, with 1 (100.0% in the age bracket) enrolled. Conversely, the age group of 10 to 14 year olds has the lowest likelihood of being enrolled in a private school, with 2 (100.0% in the age bracket) attending a public institution.
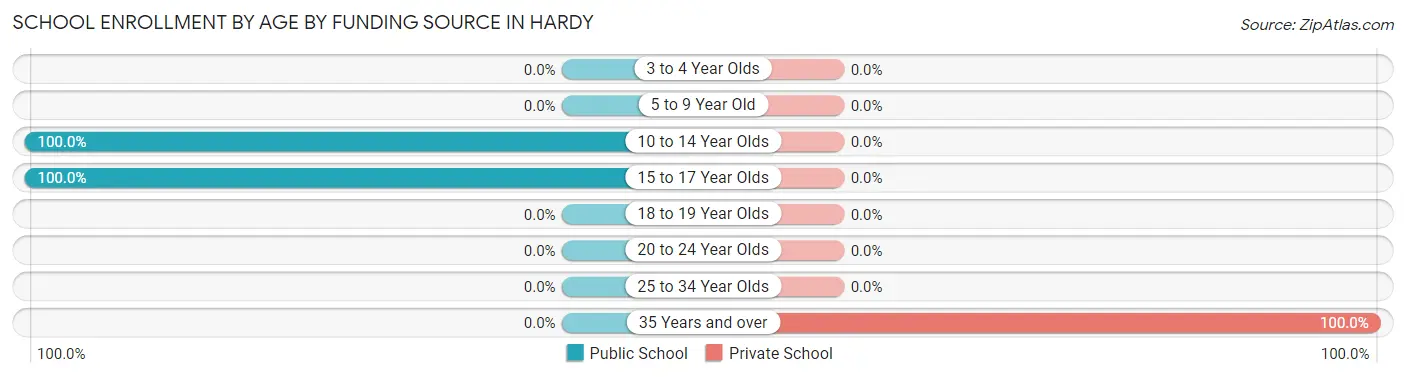
| Age Bracket | Public School | Private School |
| 3 to 4 Year Olds | 0 (0.0%) | 0 (0.0%) |
| 5 to 9 Year Old | 0 (0.0%) | 0 (0.0%) |
| 10 to 14 Year Olds | 2 (100.0%) | 0 (0.0%) |
| 15 to 17 Year Olds | 1 (100.0%) | 0 (0.0%) |
| 18 to 19 Year Olds | 0 (0.0%) | 0 (0.0%) |
| 20 to 24 Year Olds | 0 (0.0%) | 0 (0.0%) |
| 25 to 34 Year Olds | 0 (0.0%) | 0 (0.0%) |
| 35 Years and over | 0 (0.0%) | 1 (100.0%) |
| Total | 3 (75.0%) | 1 (25.0%) |
Educational Attainment by Field of Study in Hardy
Bio, nature & agricultural (2 | 50.0%), and education (2 | 50.0%) are the most common fields of study among 4 individuals in Hardy who have obtained a bachelor's degree or higher.
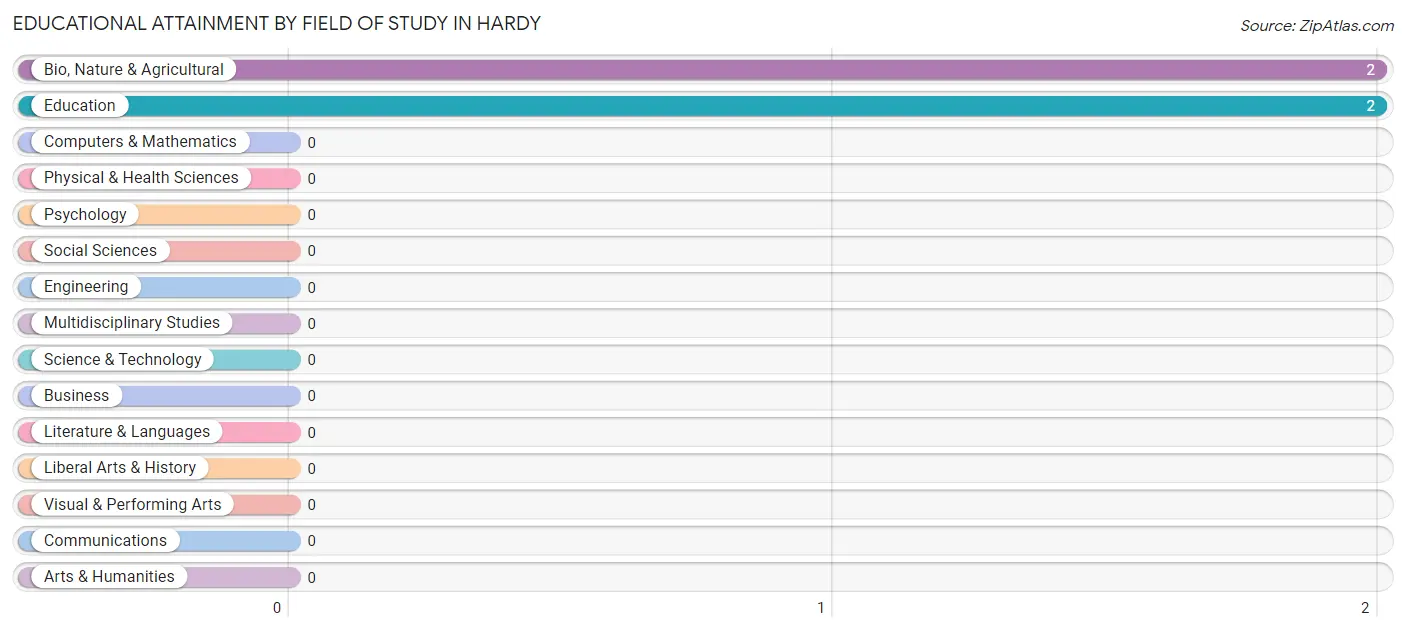
| Field of Study | # Graduates | % Graduates |
| Computers & Mathematics | 0 | 0.0% |
| Bio, Nature & Agricultural | 2 | 50.0% |
| Physical & Health Sciences | 0 | 0.0% |
| Psychology | 0 | 0.0% |
| Social Sciences | 0 | 0.0% |
| Engineering | 0 | 0.0% |
| Multidisciplinary Studies | 0 | 0.0% |
| Science & Technology | 0 | 0.0% |
| Business | 0 | 0.0% |
| Education | 2 | 50.0% |
| Literature & Languages | 0 | 0.0% |
| Liberal Arts & History | 0 | 0.0% |
| Visual & Performing Arts | 0 | 0.0% |
| Communications | 0 | 0.0% |
| Arts & Humanities | 0 | 0.0% |
| Total | 4 | 100.0% |
Transportation & Commute in Hardy
Vehicle Availability by Sex in Hardy
The most prevalent vehicle ownership categories in Hardy are males with 2 vehicles (2, accounting for 66.7%) and females with 2 vehicles (0, making up 50.0%).
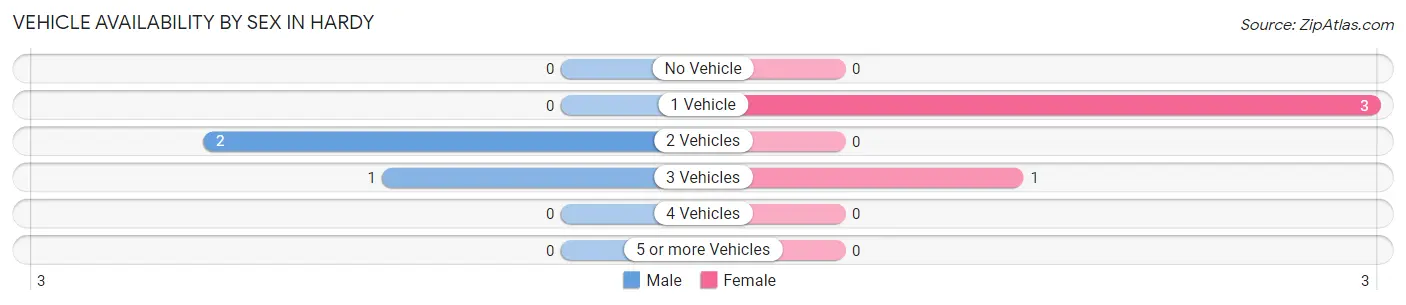
| Vehicles Available | Male | Female |
| No Vehicle | 0 (0.0%) | 0 (0.0%) |
| 1 Vehicle | 0 (0.0%) | 3 (75.0%) |
| 2 Vehicles | 2 (66.7%) | 0 (0.0%) |
| 3 Vehicles | 1 (33.3%) | 1 (25.0%) |
| 4 Vehicles | 0 (0.0%) | 0 (0.0%) |
| 5 or more Vehicles | 0 (0.0%) | 0 (0.0%) |
| Total | 3 (100.0%) | 4 (100.0%) |
Commute Time in Hardy
The most frequently occuring commute durations in Hardy are 45 to 59 minutes (5 commuters, 71.4%), 5 to 9 minutes (1 commuters, 14.3%), and 15 to 19 minutes (1 commuters, 14.3%).
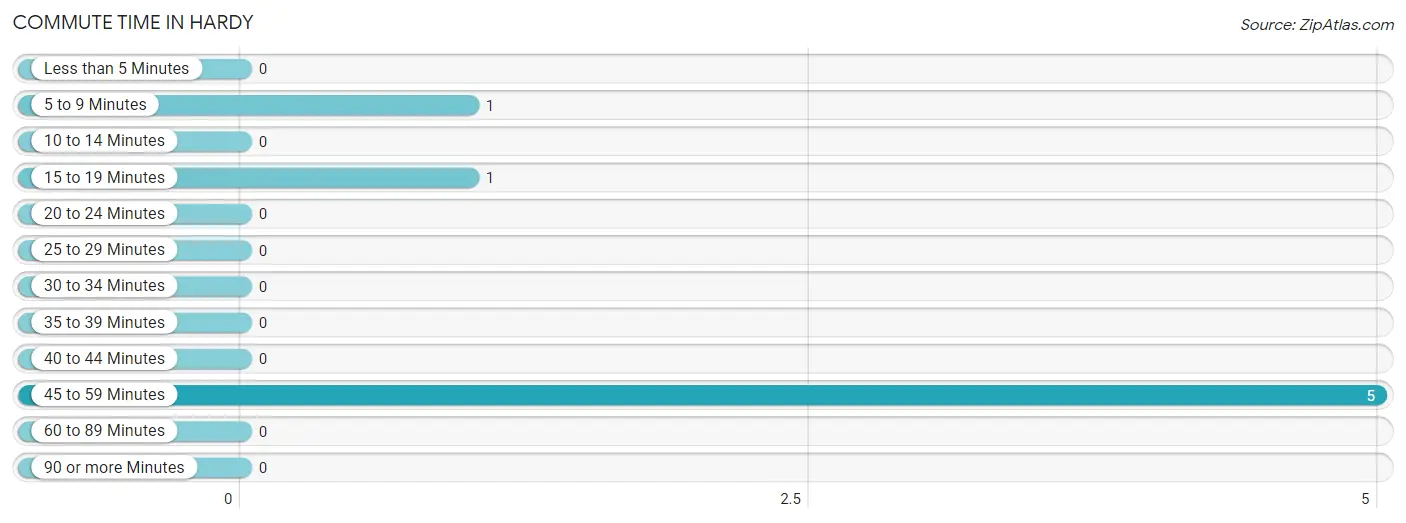
| Commute Time | # Commuters | % Commuters |
| Less than 5 Minutes | 0 | 0.0% |
| 5 to 9 Minutes | 1 | 14.3% |
| 10 to 14 Minutes | 0 | 0.0% |
| 15 to 19 Minutes | 1 | 14.3% |
| 20 to 24 Minutes | 0 | 0.0% |
| 25 to 29 Minutes | 0 | 0.0% |
| 30 to 34 Minutes | 0 | 0.0% |
| 35 to 39 Minutes | 0 | 0.0% |
| 40 to 44 Minutes | 0 | 0.0% |
| 45 to 59 Minutes | 5 | 71.4% |
| 60 to 89 Minutes | 0 | 0.0% |
| 90 or more Minutes | 0 | 0.0% |
Commute Time by Sex in Hardy
The most common commute times in Hardy are 45 to 59 minutes (2 commuters, 66.7%) for males and 45 to 59 minutes (3 commuters, 75.0%) for females.
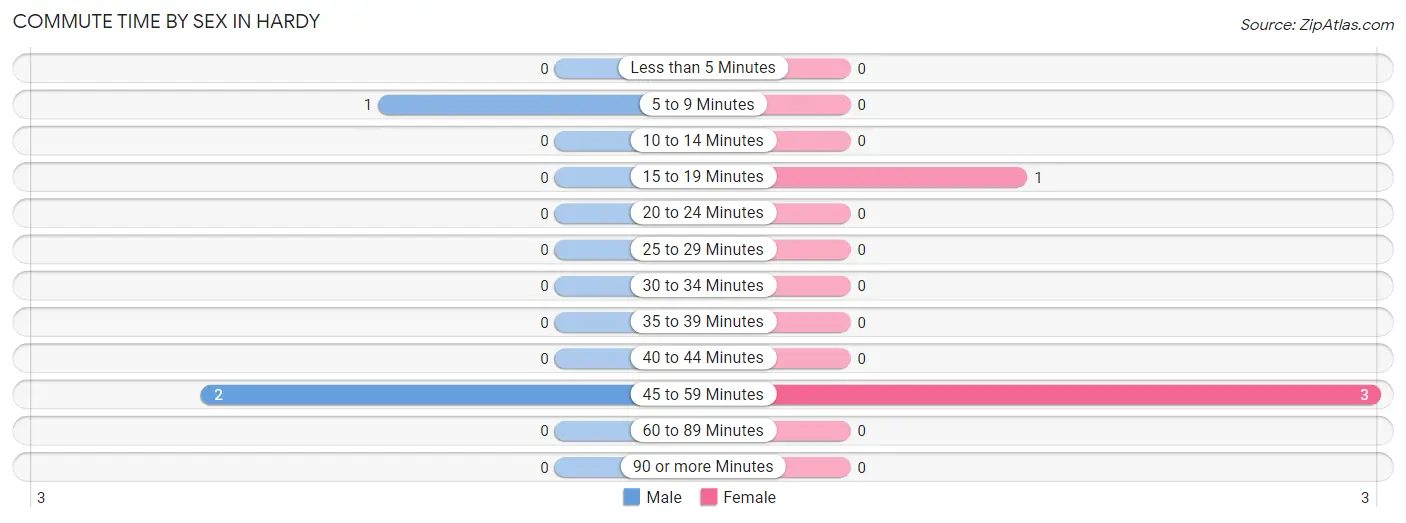
| Commute Time | Male | Female |
| Less than 5 Minutes | 0 (0.0%) | 0 (0.0%) |
| 5 to 9 Minutes | 1 (33.3%) | 0 (0.0%) |
| 10 to 14 Minutes | 0 (0.0%) | 0 (0.0%) |
| 15 to 19 Minutes | 0 (0.0%) | 1 (25.0%) |
| 20 to 24 Minutes | 0 (0.0%) | 0 (0.0%) |
| 25 to 29 Minutes | 0 (0.0%) | 0 (0.0%) |
| 30 to 34 Minutes | 0 (0.0%) | 0 (0.0%) |
| 35 to 39 Minutes | 0 (0.0%) | 0 (0.0%) |
| 40 to 44 Minutes | 0 (0.0%) | 0 (0.0%) |
| 45 to 59 Minutes | 2 (66.7%) | 3 (75.0%) |
| 60 to 89 Minutes | 0 (0.0%) | 0 (0.0%) |
| 90 or more Minutes | 0 (0.0%) | 0 (0.0%) |
Time of Departure to Work by Sex in Hardy
The most frequent times of departure to work in Hardy are 6:00 AM to 6:29 AM (2, 66.7%) for males and 5:00 AM to 5:29 AM (3, 75.0%) for females.
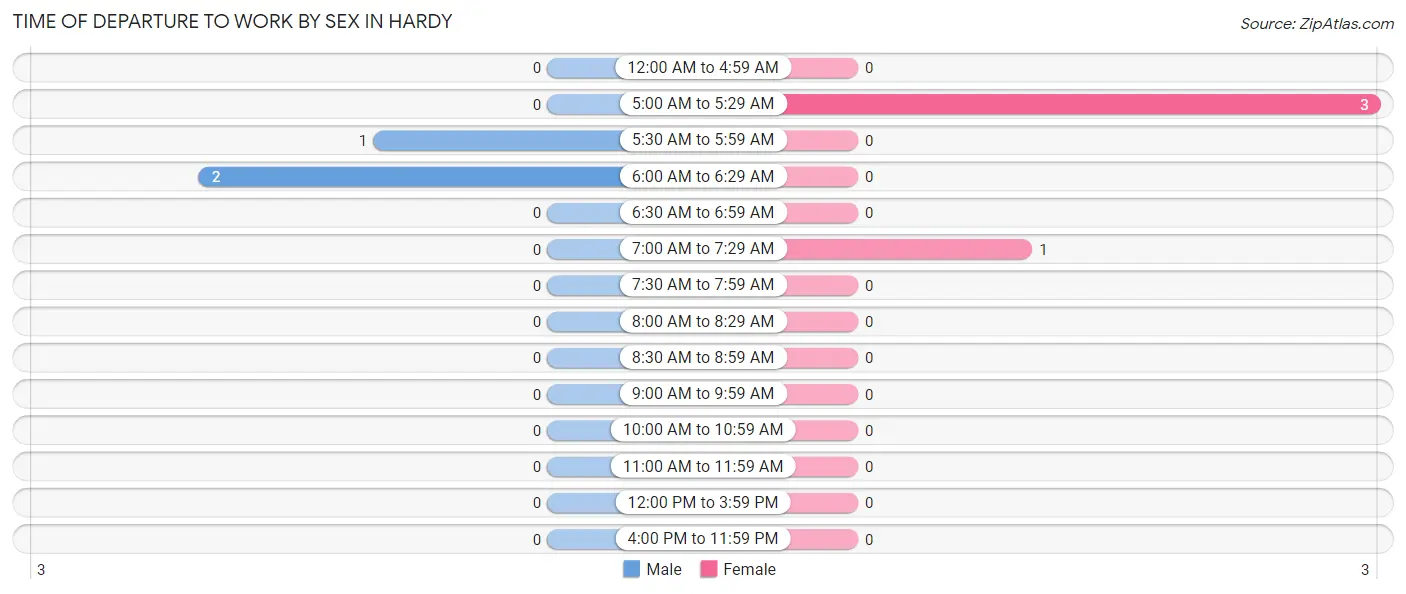
| Time of Departure | Male | Female |
| 12:00 AM to 4:59 AM | 0 (0.0%) | 0 (0.0%) |
| 5:00 AM to 5:29 AM | 0 (0.0%) | 3 (75.0%) |
| 5:30 AM to 5:59 AM | 1 (33.3%) | 0 (0.0%) |
| 6:00 AM to 6:29 AM | 2 (66.7%) | 0 (0.0%) |
| 6:30 AM to 6:59 AM | 0 (0.0%) | 0 (0.0%) |
| 7:00 AM to 7:29 AM | 0 (0.0%) | 1 (25.0%) |
| 7:30 AM to 7:59 AM | 0 (0.0%) | 0 (0.0%) |
| 8:00 AM to 8:29 AM | 0 (0.0%) | 0 (0.0%) |
| 8:30 AM to 8:59 AM | 0 (0.0%) | 0 (0.0%) |
| 9:00 AM to 9:59 AM | 0 (0.0%) | 0 (0.0%) |
| 10:00 AM to 10:59 AM | 0 (0.0%) | 0 (0.0%) |
| 11:00 AM to 11:59 AM | 0 (0.0%) | 0 (0.0%) |
| 12:00 PM to 3:59 PM | 0 (0.0%) | 0 (0.0%) |
| 4:00 PM to 11:59 PM | 0 (0.0%) | 0 (0.0%) |
| Total | 3 (100.0%) | 4 (100.0%) |
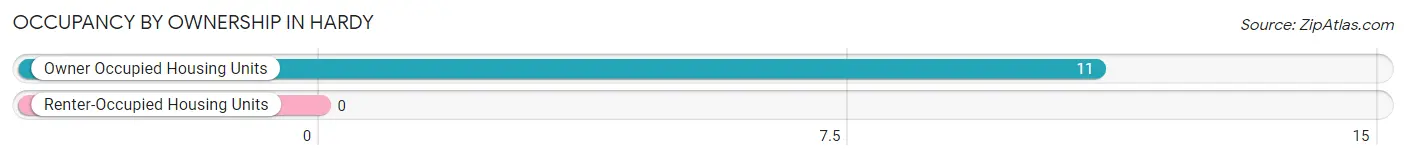
Housing Occupancy in Hardy
Occupancy by Ownership in Hardy
Of the total 11 dwellings in Hardy, owner-occupied units account for 11 (100.0%), while renter-occupied units make up 0 (0.0%).
| Occupancy | # Housing Units | % Housing Units |
| Owner Occupied Housing Units | 11 | 100.0% |
| Renter-Occupied Housing Units | 0 | 0.0% |
| Total Occupied Housing Units | 11 | 100.0% |
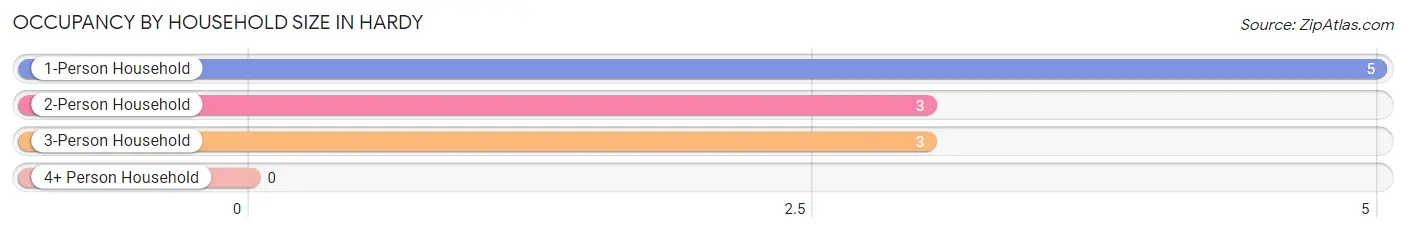
Occupancy by Household Size in Hardy
| Household Size | # Housing Units | % Housing Units |
| 1-Person Household | 5 | 45.5% |
| 2-Person Household | 3 | 27.3% |
| 3-Person Household | 3 | 27.3% |
| 4+ Person Household | 0 | 0.0% |
| Total Housing Units | 11 | 100.0% |
Occupancy by Ownership by Household Size in Hardy
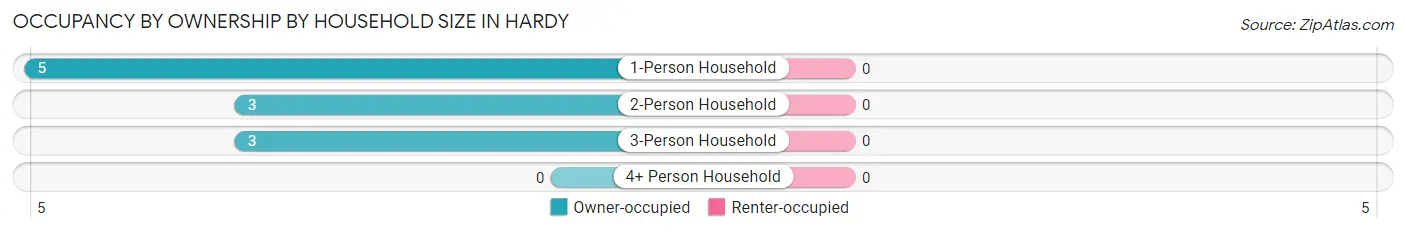
| Household Size | Owner-occupied | Renter-occupied |
| 1-Person Household | 5 (100.0%) | 0 (0.0%) |
| 2-Person Household | 3 (100.0%) | 0 (0.0%) |
| 3-Person Household | 3 (100.0%) | 0 (0.0%) |
| 4+ Person Household | 0 (0.0%) | 0 (0.0%) |
| Total Housing Units | 11 (100.0%) | 0 (0.0%) |
Occupancy by Educational Attainment in Hardy
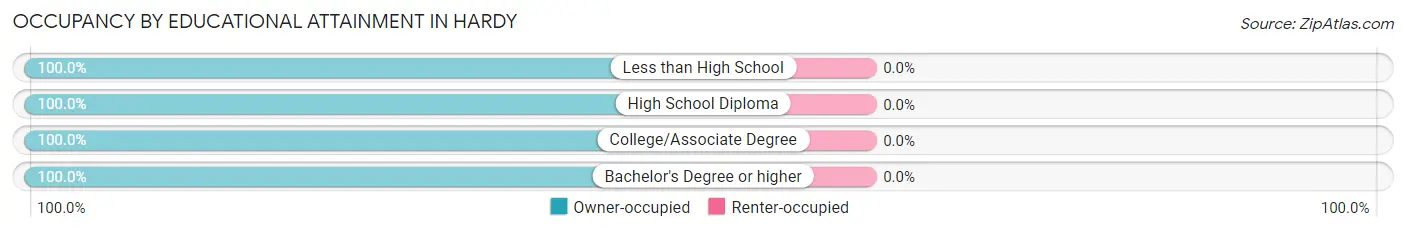
| Household Size | Owner-occupied | Renter-occupied |
| Less than High School | 2 (100.0%) | 0 (0.0%) |
| High School Diploma | 2 (100.0%) | 0 (0.0%) |
| College/Associate Degree | 4 (100.0%) | 0 (0.0%) |
| Bachelor's Degree or higher | 3 (100.0%) | 0 (0.0%) |
Occupancy by Age of Householder in Hardy
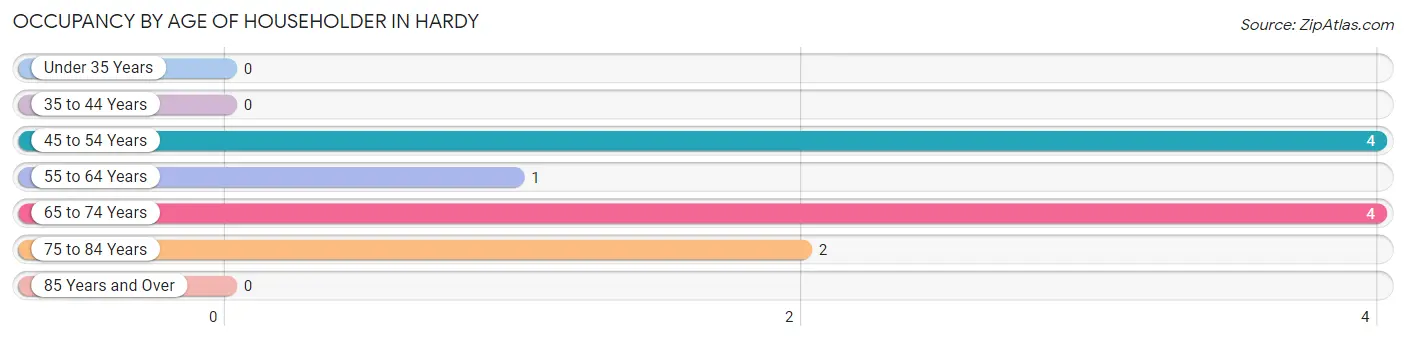
| Age Bracket | # Households | % Households |
| Under 35 Years | 0 | 0.0% |
| 35 to 44 Years | 0 | 0.0% |
| 45 to 54 Years | 4 | 36.4% |
| 55 to 64 Years | 1 | 9.1% |
| 65 to 74 Years | 4 | 36.4% |
| 75 to 84 Years | 2 | 18.2% |
| 85 Years and Over | 0 | 0.0% |
| Total | 11 | 100.0% |
Housing Finances in Hardy
Median Income by Occupancy in Hardy
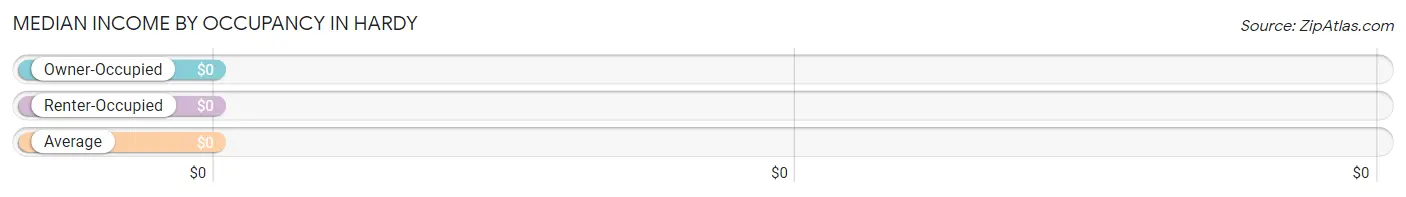
| Occupancy Type | # Households | Median Income |
| Owner-Occupied | 11 (100.0%) | $0 |
| Renter-Occupied | 0 (0.0%) | $0 |
| Average | 11 (100.0%) | $0 |
Occupancy by Householder Income Bracket in Hardy
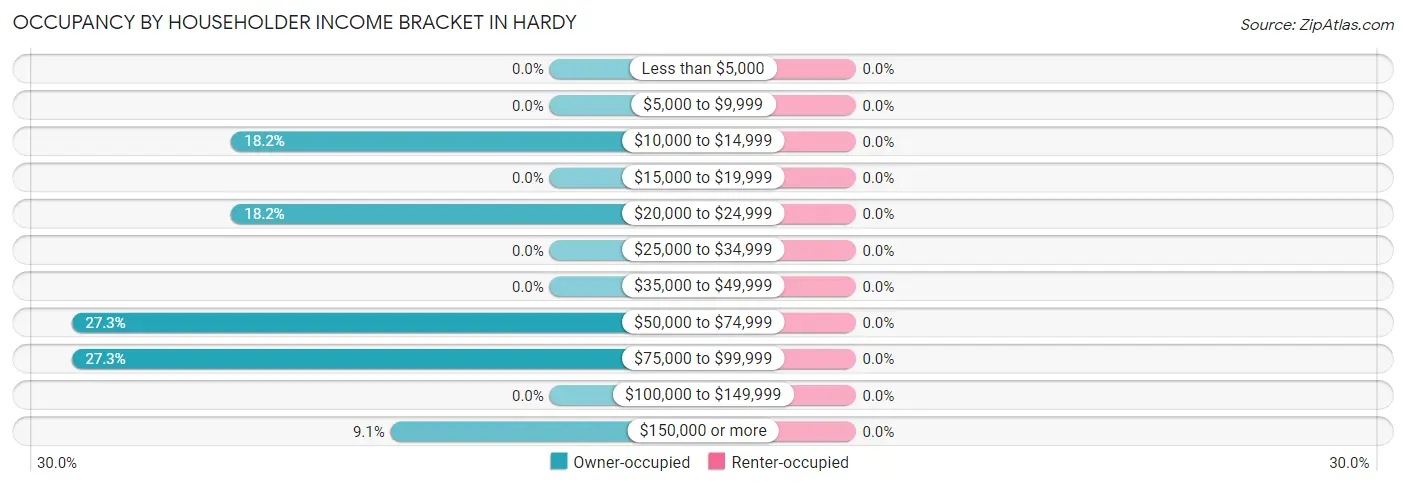
| Income Bracket | Owner-occupied | Renter-occupied |
| Less than $5,000 | 0 (0.0%) | 0 (0.0%) |
| $5,000 to $9,999 | 0 (0.0%) | 0 (0.0%) |
| $10,000 to $14,999 | 2 (18.2%) | 0 (0.0%) |
| $15,000 to $19,999 | 0 (0.0%) | 0 (0.0%) |
| $20,000 to $24,999 | 2 (18.2%) | 0 (0.0%) |
| $25,000 to $34,999 | 0 (0.0%) | 0 (0.0%) |
| $35,000 to $49,999 | 0 (0.0%) | 0 (0.0%) |
| $50,000 to $74,999 | 3 (27.3%) | 0 (0.0%) |
| $75,000 to $99,999 | 3 (27.3%) | 0 (0.0%) |
| $100,000 to $149,999 | 0 (0.0%) | 0 (0.0%) |
| $150,000 or more | 1 (9.1%) | 0 (0.0%) |
| Total | 11 (100.0%) | 0 (0.0%) |
Monthly Housing Cost Tiers in Hardy
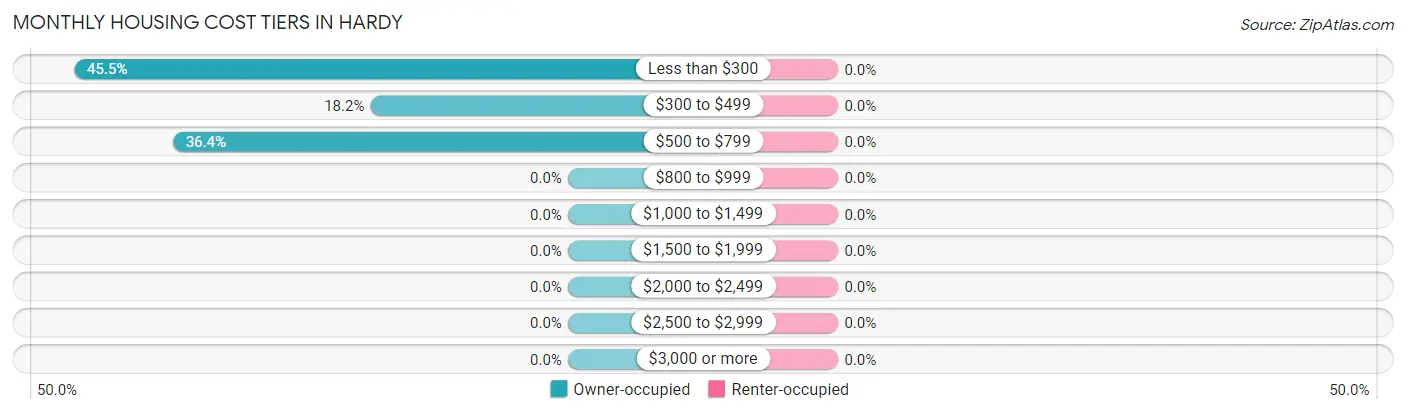
| Monthly Cost | Owner-occupied | Renter-occupied |
| Less than $300 | 5 (45.5%) | 0 (0.0%) |
| $300 to $499 | 2 (18.2%) | 0 (0.0%) |
| $500 to $799 | 4 (36.4%) | 0 (0.0%) |
| $800 to $999 | 0 (0.0%) | 0 (0.0%) |
| $1,000 to $1,499 | 0 (0.0%) | 0 (0.0%) |
| $1,500 to $1,999 | 0 (0.0%) | 0 (0.0%) |
| $2,000 to $2,499 | 0 (0.0%) | 0 (0.0%) |
| $2,500 to $2,999 | 0 (0.0%) | 0 (0.0%) |
| $3,000 or more | 0 (0.0%) | 0 (0.0%) |
| Total | 11 (100.0%) | 0 (0.0%) |
Physical Housing Characteristics in Hardy
Housing Structures in Hardy
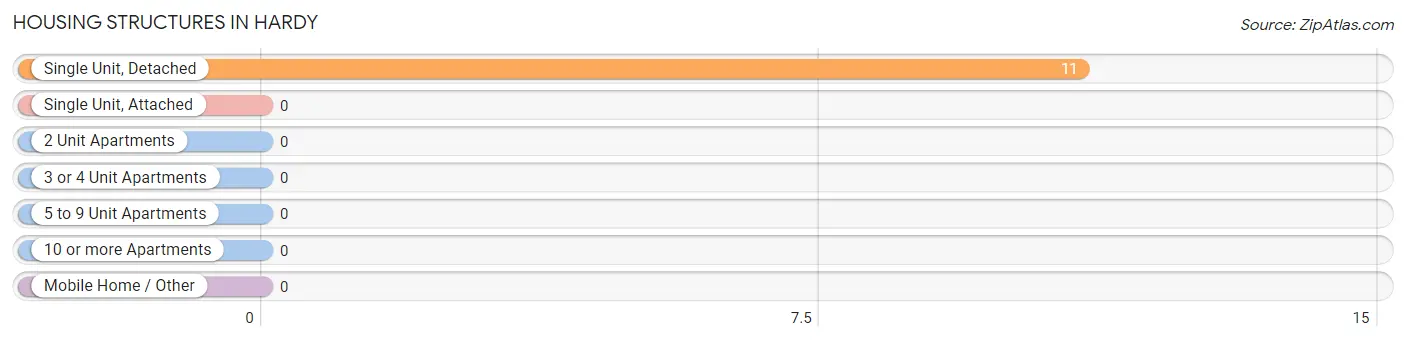
| Structure Type | # Housing Units | % Housing Units |
| Single Unit, Detached | 11 | 100.0% |
| Single Unit, Attached | 0 | 0.0% |
| 2 Unit Apartments | 0 | 0.0% |
| 3 or 4 Unit Apartments | 0 | 0.0% |
| 5 to 9 Unit Apartments | 0 | 0.0% |
| 10 or more Apartments | 0 | 0.0% |
| Mobile Home / Other | 0 | 0.0% |
| Total | 11 | 100.0% |
Housing Structures by Occupancy in Hardy
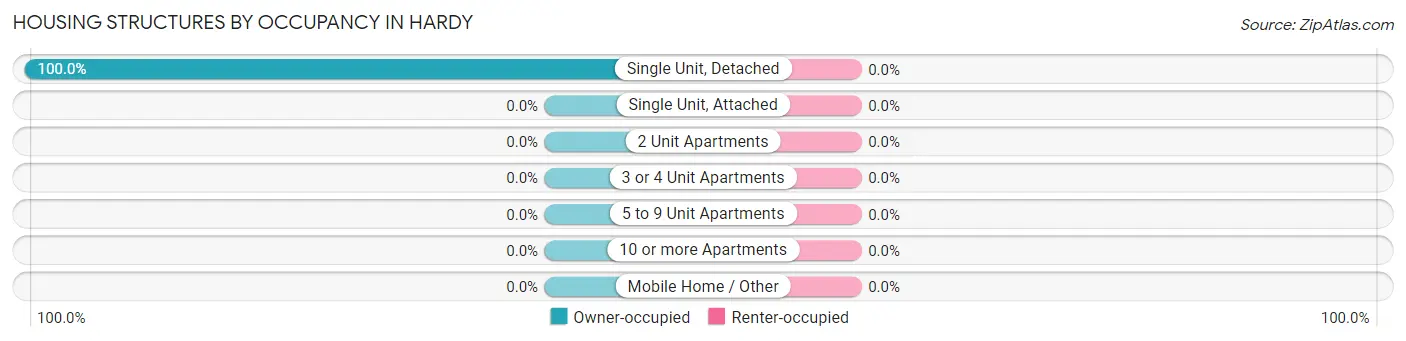
| Structure Type | Owner-occupied | Renter-occupied |
| Single Unit, Detached | 11 (100.0%) | 0 (0.0%) |
| Single Unit, Attached | 0 (0.0%) | 0 (0.0%) |
| 2 Unit Apartments | 0 (0.0%) | 0 (0.0%) |
| 3 or 4 Unit Apartments | 0 (0.0%) | 0 (0.0%) |
| 5 to 9 Unit Apartments | 0 (0.0%) | 0 (0.0%) |
| 10 or more Apartments | 0 (0.0%) | 0 (0.0%) |
| Mobile Home / Other | 0 (0.0%) | 0 (0.0%) |
| Total | 11 (100.0%) | 0 (0.0%) |
Housing Structures by Number of Rooms in Hardy
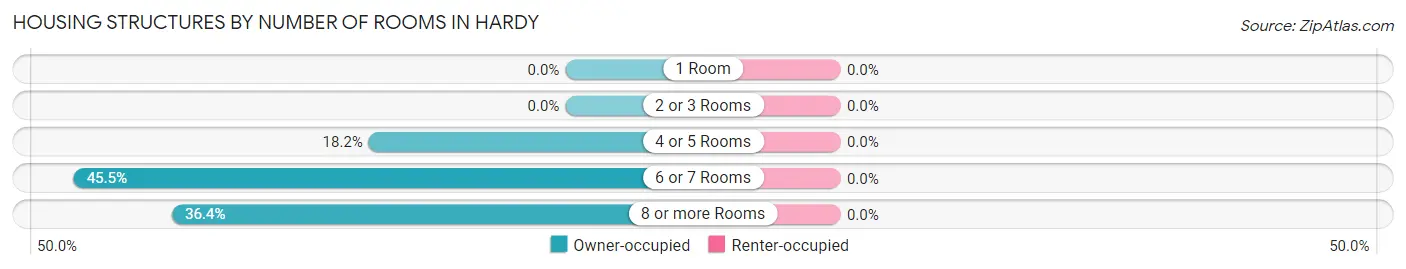
| Number of Rooms | Owner-occupied | Renter-occupied |
| 1 Room | 0 (0.0%) | 0 (0.0%) |
| 2 or 3 Rooms | 0 (0.0%) | 0 (0.0%) |
| 4 or 5 Rooms | 2 (18.2%) | 0 (0.0%) |
| 6 or 7 Rooms | 5 (45.5%) | 0 (0.0%) |
| 8 or more Rooms | 4 (36.4%) | 0 (0.0%) |
| Total | 11 (100.0%) | 0 (0.0%) |
Housing Structure by Heating Type in Hardy
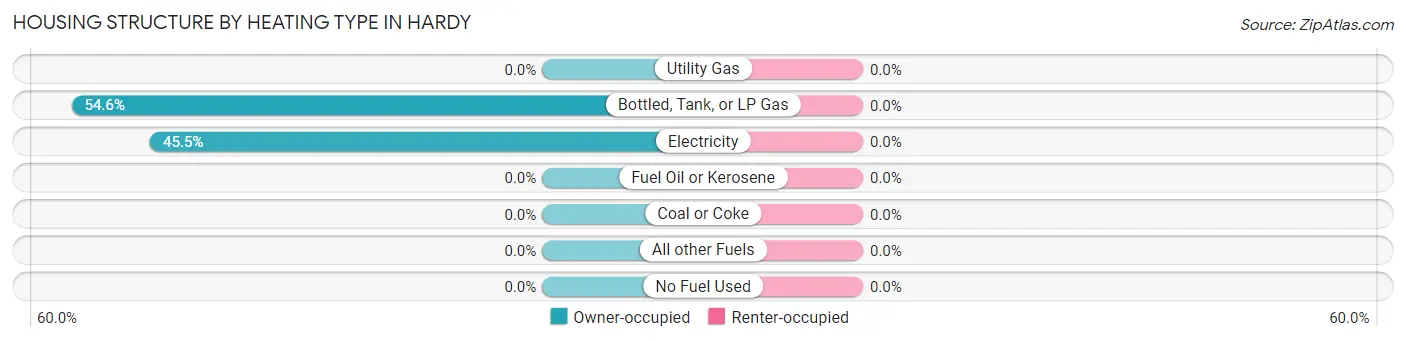
| Heating Type | Owner-occupied | Renter-occupied |
| Utility Gas | 0 (0.0%) | 0 (0.0%) |
| Bottled, Tank, or LP Gas | 6 (54.5%) | 0 (0.0%) |
| Electricity | 5 (45.5%) | 0 (0.0%) |
| Fuel Oil or Kerosene | 0 (0.0%) | 0 (0.0%) |
| Coal or Coke | 0 (0.0%) | 0 (0.0%) |
| All other Fuels | 0 (0.0%) | 0 (0.0%) |
| No Fuel Used | 0 (0.0%) | 0 (0.0%) |
| Total | 11 (100.0%) | 0 (0.0%) |
Household Vehicle Usage in Hardy
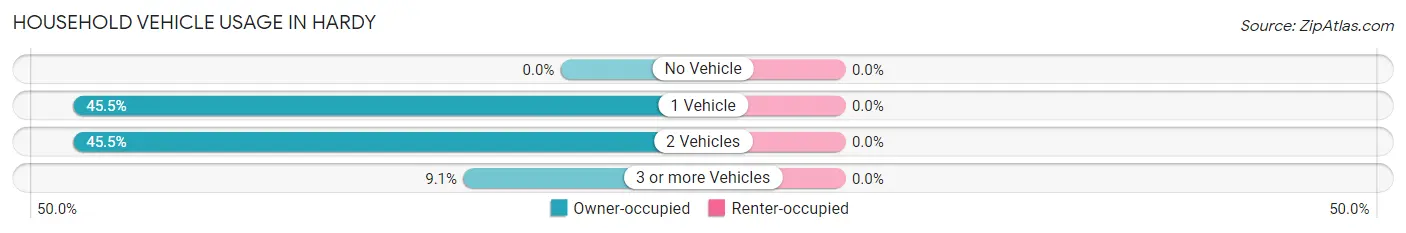
| Vehicles per Household | Owner-occupied | Renter-occupied |
| No Vehicle | 0 (0.0%) | 0 (0.0%) |
| 1 Vehicle | 5 (45.5%) | 0 (0.0%) |
| 2 Vehicles | 5 (45.5%) | 0 (0.0%) |
| 3 or more Vehicles | 1 (9.1%) | 0 (0.0%) |
| Total | 11 (100.0%) | 0 (0.0%) |
Real Estate & Mortgages in Hardy
Real Estate and Mortgage Overview in Hardy
| Characteristic | Without Mortgage | With Mortgage |
| Housing Units | 9 | 2 |
| Median Property Value | - | - |
| Median Household Income | $52,917 | $0 |
| Monthly Housing Costs | $288 | $0 |
| Real Estate Taxes | - | - |
Property Value by Mortgage Status in Hardy
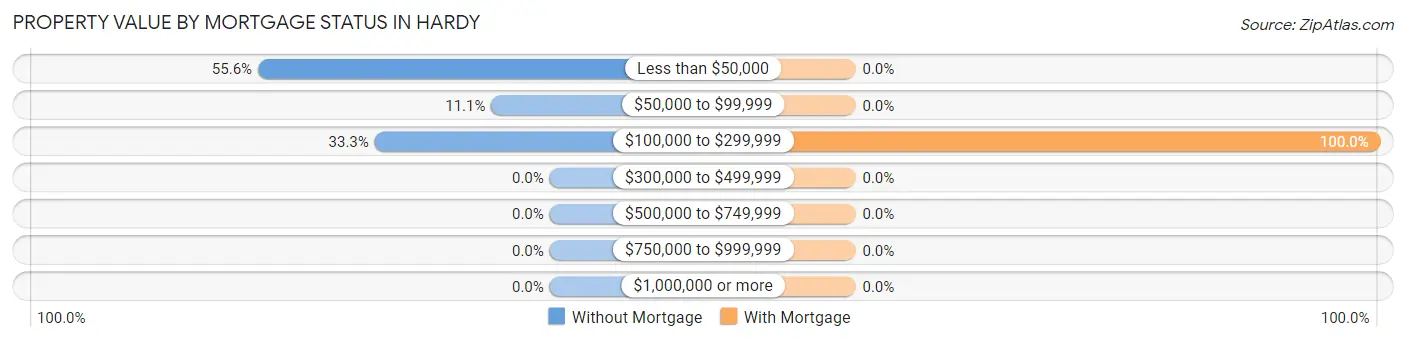
| Property Value | Without Mortgage | With Mortgage |
| Less than $50,000 | 5 (55.6%) | 0 (0.0%) |
| $50,000 to $99,999 | 1 (11.1%) | 0 (0.0%) |
| $100,000 to $299,999 | 3 (33.3%) | 2 (100.0%) |
| $300,000 to $499,999 | 0 (0.0%) | 0 (0.0%) |
| $500,000 to $749,999 | 0 (0.0%) | 0 (0.0%) |
| $750,000 to $999,999 | 0 (0.0%) | 0 (0.0%) |
| $1,000,000 or more | 0 (0.0%) | 0 (0.0%) |
| Total | 9 (100.0%) | 2 (100.0%) |
Household Income by Mortgage Status in Hardy
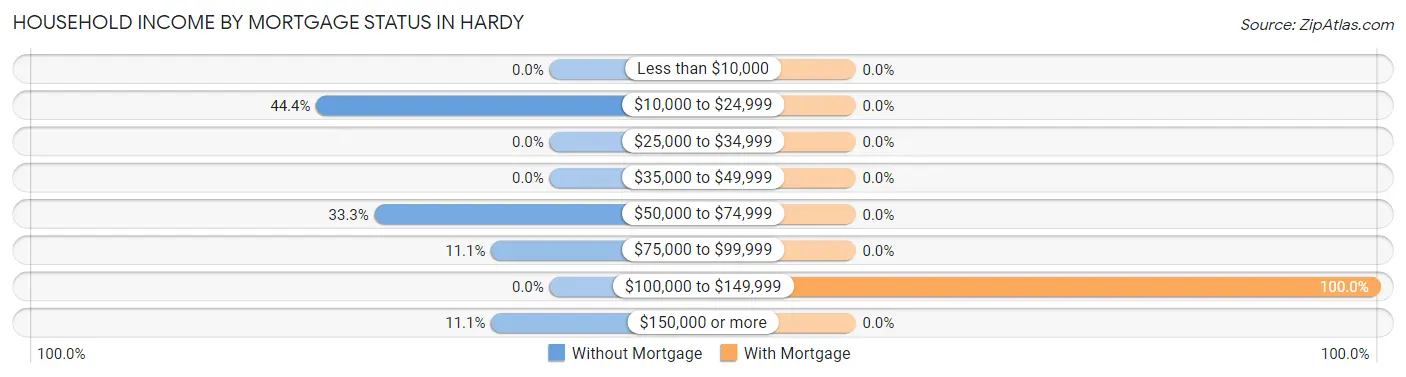
| Household Income | Without Mortgage | With Mortgage |
| Less than $10,000 | 0 (0.0%) | 0 (0.0%) |
| $10,000 to $24,999 | 4 (44.4%) | 0 (0.0%) |
| $25,000 to $34,999 | 0 (0.0%) | 0 (0.0%) |
| $35,000 to $49,999 | 0 (0.0%) | 0 (0.0%) |
| $50,000 to $74,999 | 3 (33.3%) | 0 (0.0%) |
| $75,000 to $99,999 | 1 (11.1%) | 0 (0.0%) |
| $100,000 to $149,999 | 0 (0.0%) | 2 (100.0%) |
| $150,000 or more | 1 (11.1%) | 0 (0.0%) |
| Total | 9 (100.0%) | 2 (100.0%) |
Property Value to Household Income Ratio in Hardy
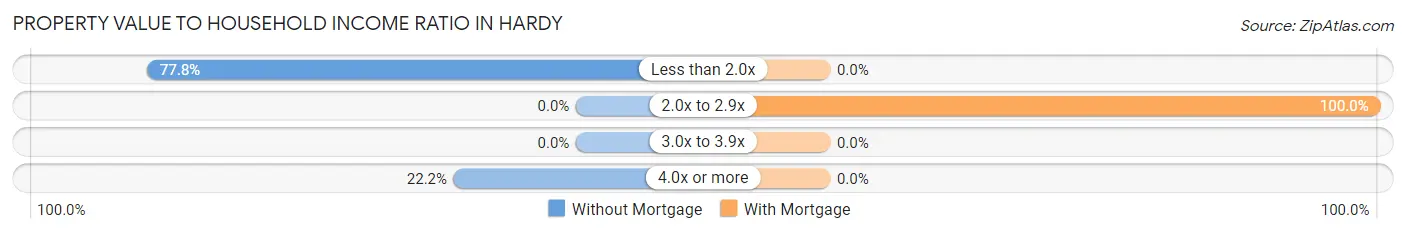
| Value-to-Income Ratio | Without Mortgage | With Mortgage |
| Less than 2.0x | 7 (77.8%) | 0 (0.0%) |
| 2.0x to 2.9x | 0 (0.0%) | 2 (100.0%) |
| 3.0x to 3.9x | 0 (0.0%) | 0 (0.0%) |
| 4.0x or more | 2 (22.2%) | 0 (0.0%) |
| Total | 9 (100.0%) | 2 (100.0%) |
Real Estate Taxes by Mortgage Status in Hardy
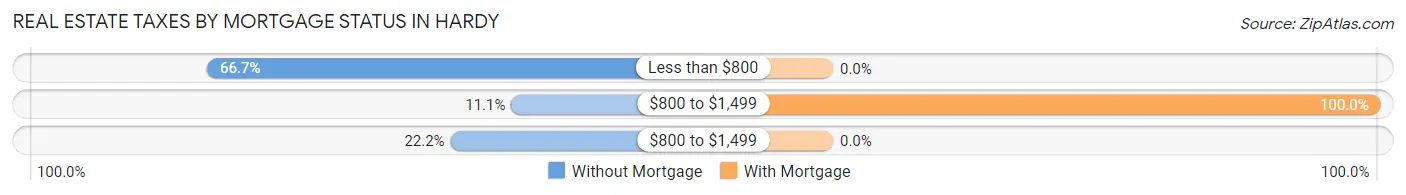
| Property Taxes | Without Mortgage | With Mortgage |
| Less than $800 | 6 (66.7%) | 0 (0.0%) |
| $800 to $1,499 | 1 (11.1%) | 2 (100.0%) |
| $800 to $1,499 | 2 (22.2%) | 0 (0.0%) |
| Total | 9 (100.0%) | 2 (100.0%) |
Health & Disability in Hardy
Health Insurance Coverage by Age in Hardy
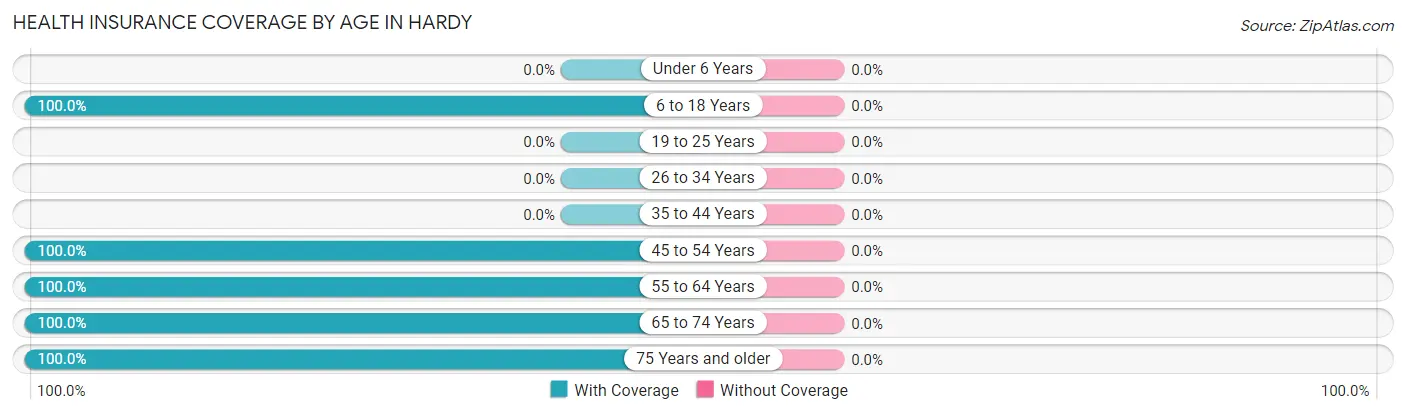
| Age Bracket | With Coverage | Without Coverage |
| Under 6 Years | 0 (0.0%) | 0 (0.0%) |
| 6 to 18 Years | 3 (100.0%) | 0 (0.0%) |
| 19 to 25 Years | 0 (0.0%) | 0 (0.0%) |
| 26 to 34 Years | 0 (0.0%) | 0 (0.0%) |
| 35 to 44 Years | 0 (0.0%) | 0 (0.0%) |
| 45 to 54 Years | 4 (100.0%) | 0 (0.0%) |
| 55 to 64 Years | 3 (100.0%) | 0 (0.0%) |
| 65 to 74 Years | 4 (100.0%) | 0 (0.0%) |
| 75 Years and older | 3 (100.0%) | 0 (0.0%) |
| Total | 17 (100.0%) | 0 (0.0%) |
Health Insurance Coverage by Citizenship Status in Hardy
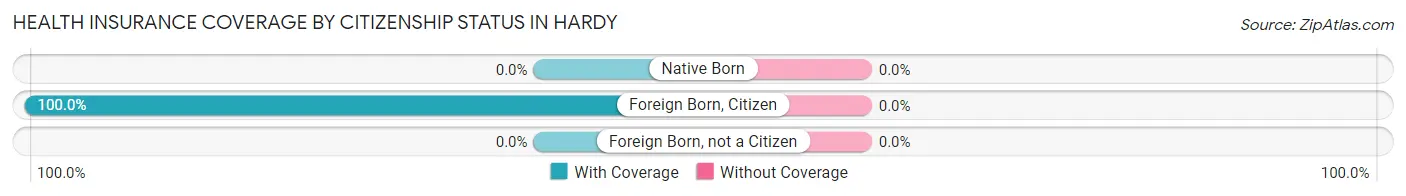
| Citizenship Status | With Coverage | Without Coverage |
| Native Born | 0 (0.0%) | 0 (0.0%) |
| Foreign Born, Citizen | 3 (100.0%) | 0 (0.0%) |
| Foreign Born, not a Citizen | 0 (0.0%) | 0 (0.0%) |
Health Insurance Coverage by Household Income in Hardy
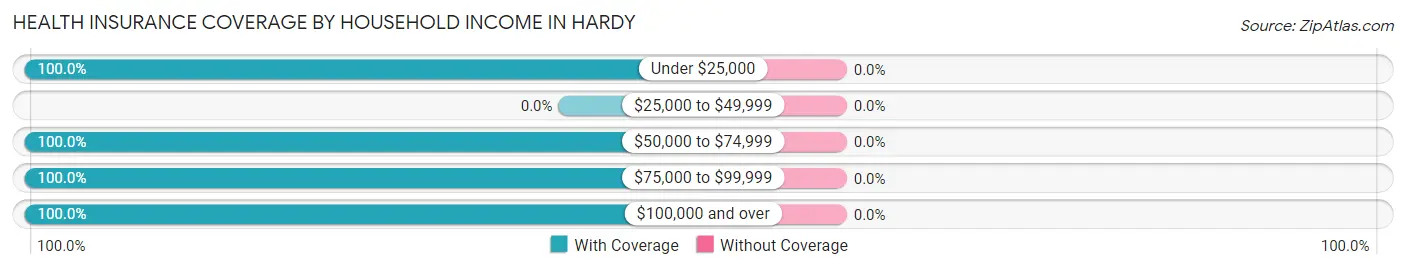
| Household Income | With Coverage | Without Coverage |
| Under $25,000 | 5 (100.0%) | 0 (0.0%) |
| $25,000 to $49,999 | 0 (0.0%) | 0 (0.0%) |
| $50,000 to $74,999 | 3 (100.0%) | 0 (0.0%) |
| $75,000 to $99,999 | 7 (100.0%) | 0 (0.0%) |
| $100,000 and over | 2 (100.0%) | 0 (0.0%) |
Public vs Private Health Insurance Coverage by Age in Hardy
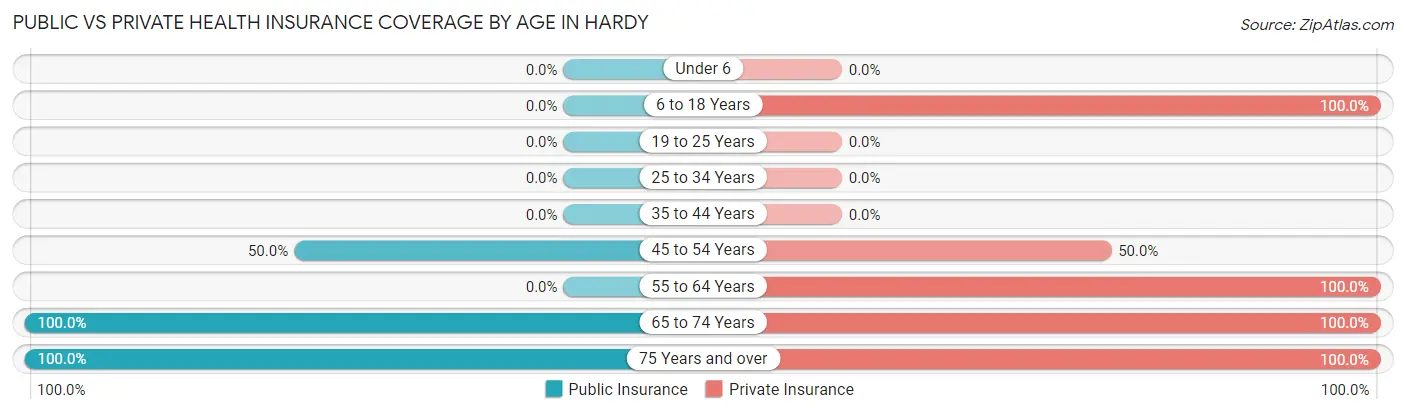
| Age Bracket | Public Insurance | Private Insurance |
| Under 6 | 0 (0.0%) | 0 (0.0%) |
| 6 to 18 Years | 0 (0.0%) | 3 (100.0%) |
| 19 to 25 Years | 0 (0.0%) | 0 (0.0%) |
| 25 to 34 Years | 0 (0.0%) | 0 (0.0%) |
| 35 to 44 Years | 0 (0.0%) | 0 (0.0%) |
| 45 to 54 Years | 2 (50.0%) | 2 (50.0%) |
| 55 to 64 Years | 0 (0.0%) | 3 (100.0%) |
| 65 to 74 Years | 4 (100.0%) | 4 (100.0%) |
| 75 Years and over | 3 (100.0%) | 3 (100.0%) |
| Total | 9 (52.9%) | 15 (88.2%) |
Disability Status by Sex by Age in Hardy
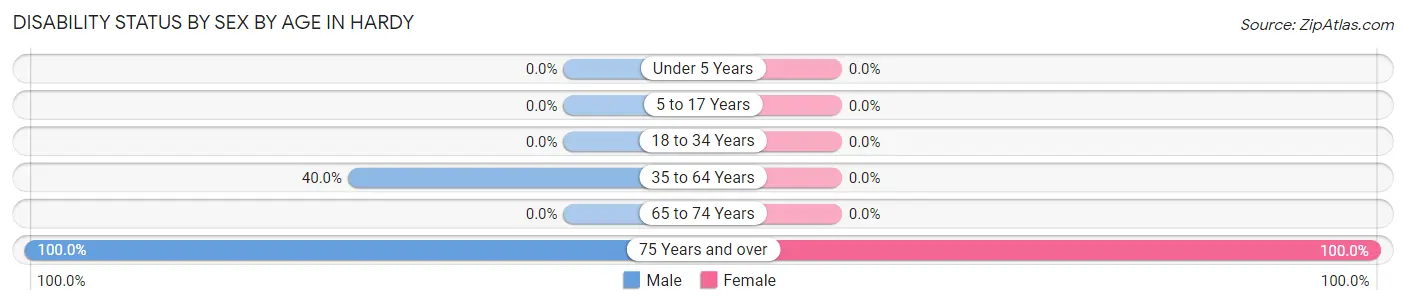
| Age Bracket | Male | Female |
| Under 5 Years | 0 (0.0%) | 0 (0.0%) |
| 5 to 17 Years | 0 (0.0%) | 0 (0.0%) |
| 18 to 34 Years | 0 (0.0%) | 0 (0.0%) |
| 35 to 64 Years | 2 (40.0%) | 0 (0.0%) |
| 65 to 74 Years | 0 (0.0%) | 0 (0.0%) |
| 75 Years and over | 2 (100.0%) | 1 (100.0%) |
Disability Class by Sex by Age in Hardy
Disability Class: Hearing Difficulty
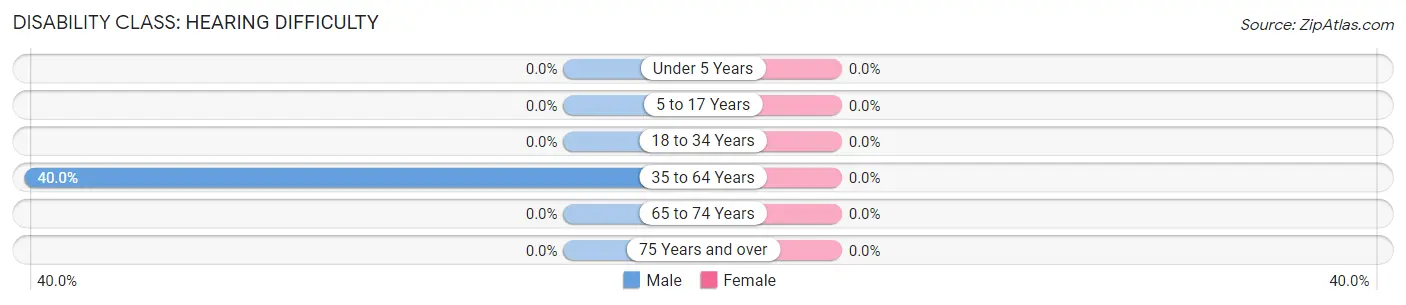
| Age Bracket | Male | Female |
| Under 5 Years | 0 (0.0%) | 0 (0.0%) |
| 5 to 17 Years | 0 (0.0%) | 0 (0.0%) |
| 18 to 34 Years | 0 (0.0%) | 0 (0.0%) |
| 35 to 64 Years | 2 (40.0%) | 0 (0.0%) |
| 65 to 74 Years | 0 (0.0%) | 0 (0.0%) |
| 75 Years and over | 0 (0.0%) | 0 (0.0%) |
Disability Class: Vision Difficulty
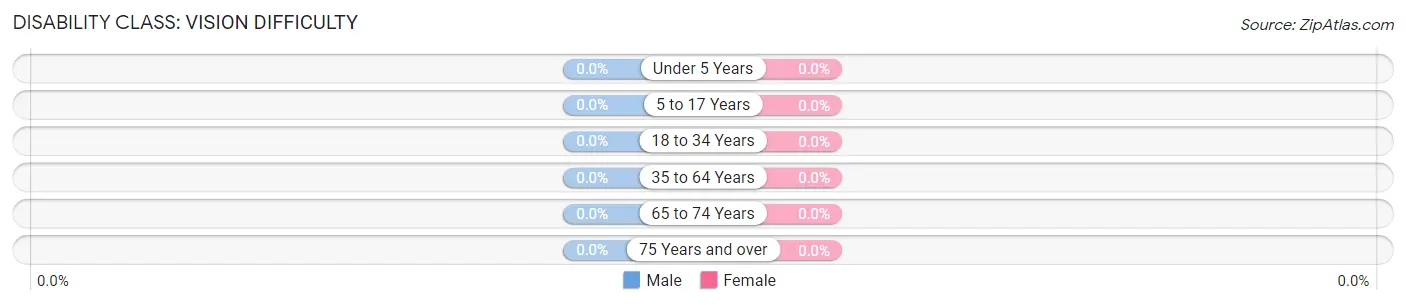
| Age Bracket | Male | Female |
| Under 5 Years | 0 (0.0%) | 0 (0.0%) |
| 5 to 17 Years | 0 (0.0%) | 0 (0.0%) |
| 18 to 34 Years | 0 (0.0%) | 0 (0.0%) |
| 35 to 64 Years | 0 (0.0%) | 0 (0.0%) |
| 65 to 74 Years | 0 (0.0%) | 0 (0.0%) |
| 75 Years and over | 0 (0.0%) | 0 (0.0%) |
Disability Class: Cognitive Difficulty
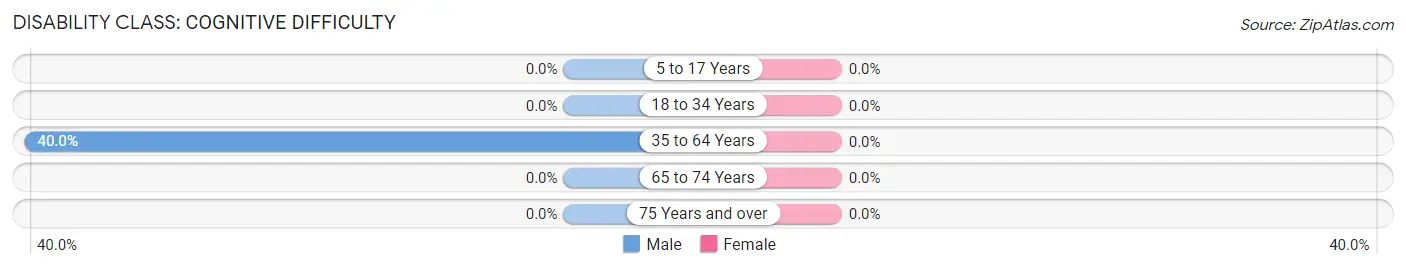
| Age Bracket | Male | Female |
| 5 to 17 Years | 0 (0.0%) | 0 (0.0%) |
| 18 to 34 Years | 0 (0.0%) | 0 (0.0%) |
| 35 to 64 Years | 2 (40.0%) | 0 (0.0%) |
| 65 to 74 Years | 0 (0.0%) | 0 (0.0%) |
| 75 Years and over | 0 (0.0%) | 0 (0.0%) |
Disability Class: Ambulatory Difficulty
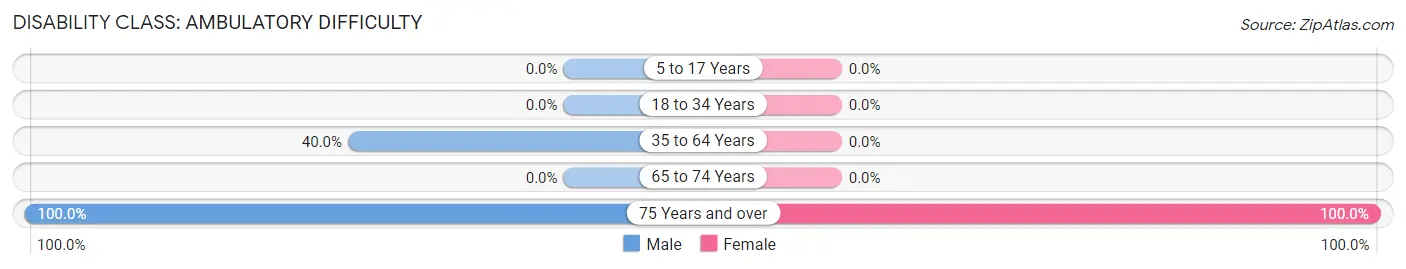
| Age Bracket | Male | Female |
| 5 to 17 Years | 0 (0.0%) | 0 (0.0%) |
| 18 to 34 Years | 0 (0.0%) | 0 (0.0%) |
| 35 to 64 Years | 2 (40.0%) | 0 (0.0%) |
| 65 to 74 Years | 0 (0.0%) | 0 (0.0%) |
| 75 Years and over | 2 (100.0%) | 1 (100.0%) |
Disability Class: Self-Care Difficulty
| Age Bracket | Male | Female |
| 5 to 17 Years | 0 (0.0%) | 0 (0.0%) |
| 18 to 34 Years | 0 (0.0%) | 0 (0.0%) |
| 35 to 64 Years | 0 (0.0%) | 0 (0.0%) |
| 65 to 74 Years | 0 (0.0%) | 0 (0.0%) |
| 75 Years and over | 0 (0.0%) | 0 (0.0%) |
Technology Access in Hardy
Computing Device Access in Hardy
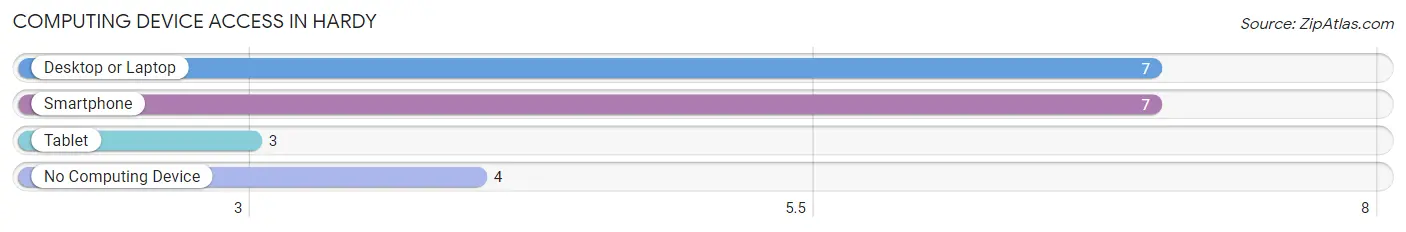
| Device Type | # Households | % Households |
| Desktop or Laptop | 7 | 63.6% |
| Smartphone | 7 | 63.6% |
| Tablet | 3 | 27.3% |
| No Computing Device | 4 | 36.4% |
| Total | 11 | 100.0% |
Internet Access in Hardy
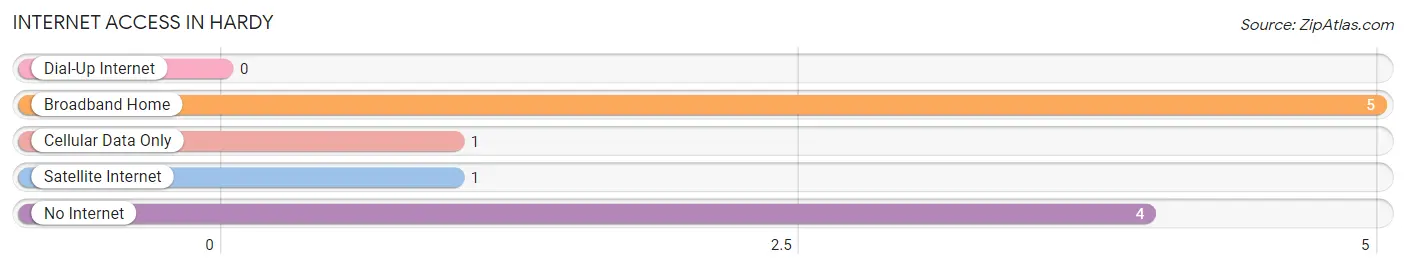
| Internet Type | # Households | % Households |
| Dial-Up Internet | 0 | 0.0% |
| Broadband Home | 5 | 45.5% |
| Cellular Data Only | 1 | 9.1% |
| Satellite Internet | 1 | 9.1% |
| No Internet | 4 | 36.4% |
| Total | 11 | 100.0% |
Hardy Summary
Hardy, Iowa is a small town located in the northwest corner of the state, in the county of Webster. It is situated on the banks of the Des Moines River, and is home to a population of just over 500 people. The town was founded in 1854, and has a rich history of farming, industry, and small-town life.
Geography
Hardy is located in the northwest corner of Iowa, in Webster County. It is situated on the banks of the Des Moines River, and is surrounded by rolling hills and farmland. The town is located about 25 miles from Fort Dodge, and is about an hour and a half drive from Des Moines. The town is also close to the Minnesota border, and is about an hour and a half drive from Minneapolis.
Economy
The economy of Hardy is largely based on agriculture and small businesses. The town is home to several small businesses, including a grocery store, a hardware store, a restaurant, and a few other small shops. The town also has a few small manufacturing businesses, such as a furniture factory and a metal fabrication shop. The town is also home to a few farms, which produce corn, soybeans, and other crops.
Demographics
As of the 2010 census, the population of Hardy was 514 people. The town is predominantly white, with a small minority population of African Americans, Hispanics, and Native Americans. The median household income in Hardy is $41,250, and the median age is 43. The town has a high rate of homeownership, with over 80% of the population owning their own homes.
Conclusion
Hardy, Iowa is a small town with a rich history and a strong sense of community. The town is largely based on agriculture and small businesses, and is home to a diverse population. The town is situated on the banks of the Des Moines River, and is close to both Fort Dodge and Minneapolis. The town has a high rate of homeownership, and the median household income is above the national average. Hardy is a great place to live and work, and is a great example of small-town life in Iowa.
Common Questions
What is Per Capita Income in Hardy?
Per Capita income in Hardy is $39,400.
What is the Median Family Income in Hardy?
Median Family Income in Hardy is $87,500.
What is Inequality or Gini Index in Hardy?
Inequality or Gini Index in Hardy is 0.39.
What is the Total Population of Hardy?
Total Population of Hardy is 17.
What is the Total Male Population of Hardy?
Total Male Population of Hardy is 9.
What is the Total Female Population of Hardy?
Total Female Population of Hardy is 8.
What is the Ratio of Males per 100 Females in Hardy?
There are 112.50 Males per 100 Females in Hardy.
What is the Ratio of Females per 100 Males in Hardy?
There are 88.89 Females per 100 Males in Hardy.
What is the Median Population Age in Hardy?
Median Population Age in Hardy is 61.5 Years.
What is the Average Family Size in Hardy
Average Family Size in Hardy is 2.0 People.
What is the Average Household Size in Hardy
Average Household Size in Hardy is 1.6 People.
How Large is the Labor Force in Hardy?
There are 7 People in the Labor Forcein in Hardy.
What is the Percentage of People in the Labor Force in Hardy?
46.7% of People are in the Labor Force in Hardy.