Zip Codes with the Highest Percentage of Population Employed in Architecture & Engineering in Marianna, FL
RELATED REPORTS & OPTIONS
Architecture & Engineering
Marianna
Compare Zip Codes
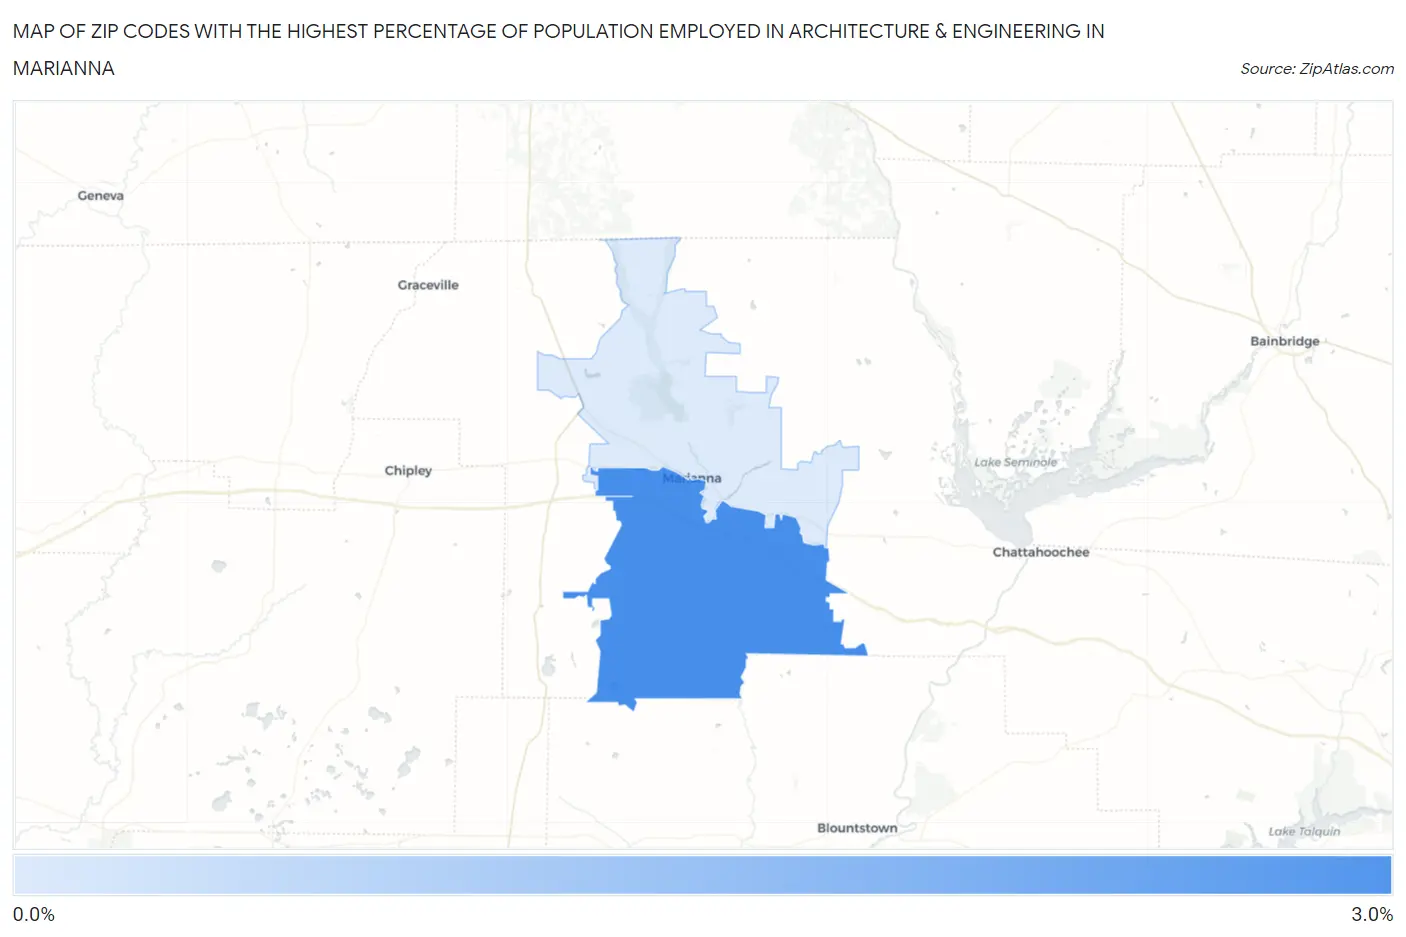
Map of Zip Codes with the Highest Percentage of Population Employed in Architecture & Engineering in Marianna
0.60%
2.7%
Zip Codes with the Highest Percentage of Population Employed in Architecture & Engineering in Marianna, FL
| Zip Code | % Employed | vs State | vs National | |
| 1. | 32448 | 2.7% | 1.6%(+1.06)#134 | 2.1%(+0.512)#6,323 |
| 2. | 32446 | 0.60% | 1.6%(-1.00)#720 | 2.1%(-1.55)#19,633 |
1
Common Questions
What are the Top Zip Codes with the Highest Percentage of Population Employed in Architecture & Engineering in Marianna, FL?
Top Zip Codes with the Highest Percentage of Population Employed in Architecture & Engineering in Marianna, FL are:
What zip code has the Highest Percentage of Population Employed in Architecture & Engineering in Marianna, FL?
32448 has the Highest Percentage of Population Employed in Architecture & Engineering in Marianna, FL with 2.7%.
What is the Percentage of Population Employed in Architecture & Engineering in Marianna, FL?
Percentage of Population Employed in Architecture & Engineering in Marianna is 1.4%.
What is the Percentage of Population Employed in Architecture & Engineering in Florida?
Percentage of Population Employed in Architecture & Engineering in Florida is 1.6%.
What is the Percentage of Population Employed in Architecture & Engineering in the United States?
Percentage of Population Employed in Architecture & Engineering in the United States is 2.1%.