Marianna, FL Map & Demographics
Marianna Map
Marianna Overview
$18,568
PER CAPITA INCOME
$48,125
AVG FAMILY INCOME
$27,296
AVG HOUSEHOLD INCOME
16.5%
WAGE / INCOME GAP [ % ]
83.5¢/ $1
WAGE / INCOME GAP [ $ ]
0.48
INEQUALITY / GINI INDEX
6,681
TOTAL POPULATION
3,340
MALE POPULATION
3,341
FEMALE POPULATION
99.97
MALES / 100 FEMALES
100.03
FEMALES / 100 MALES
38.2
MEDIAN AGE
2.9
AVG FAMILY SIZE
2.1
AVG HOUSEHOLD SIZE
2,212
LABOR FORCE [ PEOPLE ]
43.3%
PERCENT IN LABOR FORCE
5.2%
UNEMPLOYMENT RATE
Marianna Area Codes
Income in Marianna
Income Overview in Marianna
Per Capita Income in Marianna is $18,568, while median incomes of families and households are $48,125 and $27,296 respectively.
| Characteristic | Number | Measure |
| Per Capita Income | 6,681 | $18,568 |
| Median Family Income | 1,345 | $48,125 |
| Mean Family Income | 1,345 | $57,263 |
| Median Household Income | 2,656 | $27,296 |
| Mean Household Income | 2,656 | $42,654 |
| Income Deficit | 1,345 | $0 |
| Wage / Income Gap (%) | 6,681 | 16.52% |
| Wage / Income Gap ($) | 6,681 | 83.48¢ per $1 |
| Gini / Inequality Index | 6,681 | 0.48 |
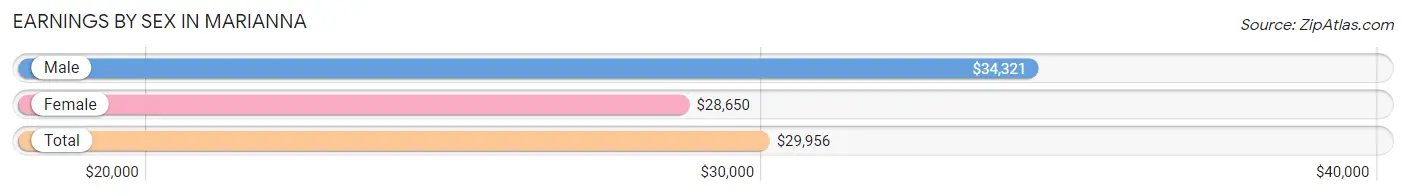
Earnings by Sex in Marianna
Average Earnings in Marianna are $29,956, $34,321 for men and $28,650 for women, a difference of 16.5%.
| Sex | Number | Average Earnings |
| Male | 1,038 (41.0%) | $34,321 |
| Female | 1,495 (59.0%) | $28,650 |
| Total | 2,533 (100.0%) | $29,956 |
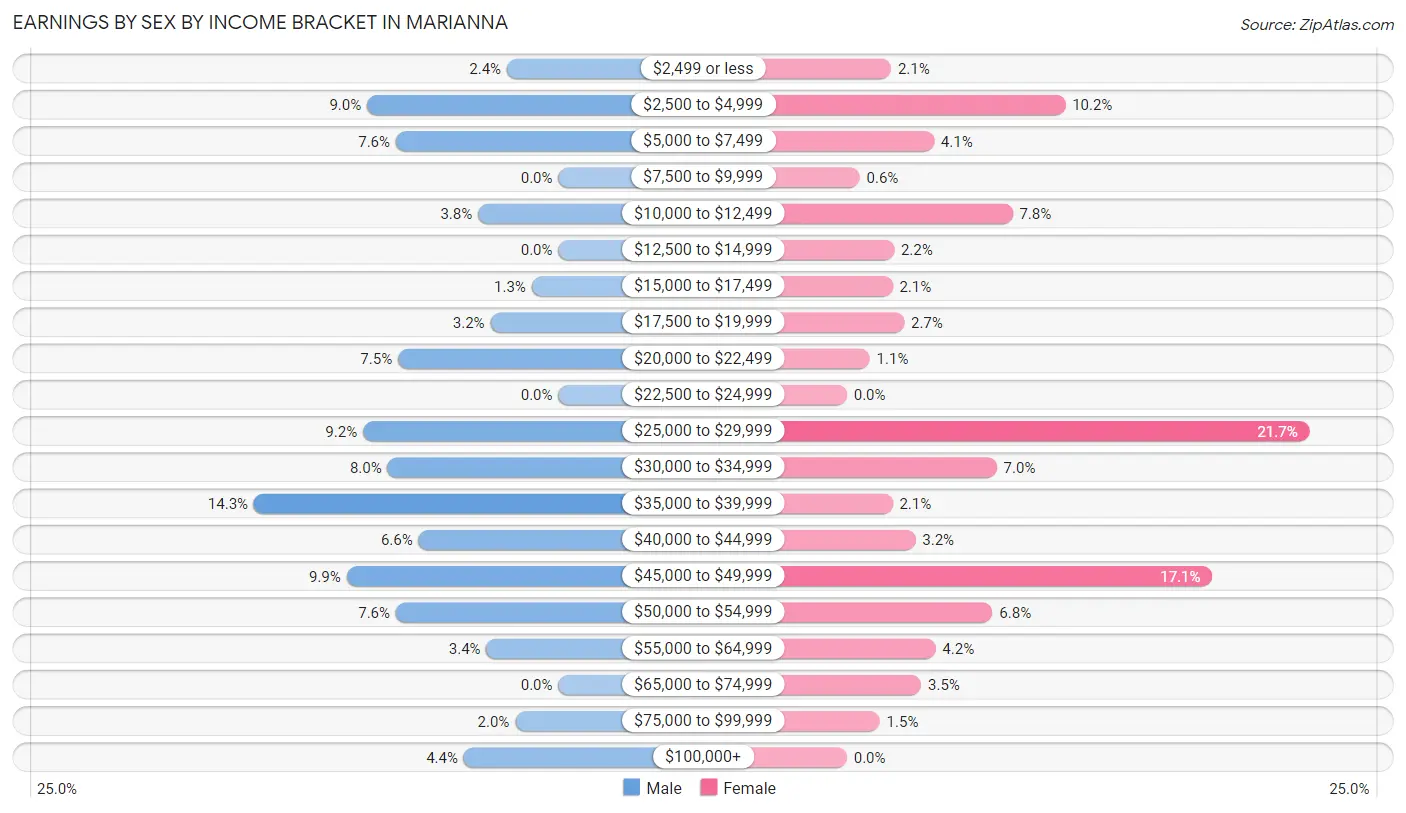
Earnings by Sex by Income Bracket in Marianna
The most common earnings brackets in Marianna are $35,000 to $39,999 for men (148 | 14.3%) and $25,000 to $29,999 for women (324 | 21.7%).
| Income | Male | Female |
| $2,499 or less | 25 (2.4%) | 31 (2.1%) |
| $2,500 to $4,999 | 93 (9.0%) | 153 (10.2%) |
| $5,000 to $7,499 | 79 (7.6%) | 61 (4.1%) |
| $7,500 to $9,999 | 0 (0.0%) | 9 (0.6%) |
| $10,000 to $12,499 | 39 (3.8%) | 116 (7.8%) |
| $12,500 to $14,999 | 0 (0.0%) | 33 (2.2%) |
| $15,000 to $17,499 | 13 (1.3%) | 32 (2.1%) |
| $17,500 to $19,999 | 33 (3.2%) | 40 (2.7%) |
| $20,000 to $22,499 | 78 (7.5%) | 16 (1.1%) |
| $22,500 to $24,999 | 0 (0.0%) | 0 (0.0%) |
| $25,000 to $29,999 | 95 (9.1%) | 324 (21.7%) |
| $30,000 to $34,999 | 83 (8.0%) | 105 (7.0%) |
| $35,000 to $39,999 | 148 (14.3%) | 32 (2.1%) |
| $40,000 to $44,999 | 68 (6.6%) | 48 (3.2%) |
| $45,000 to $49,999 | 103 (9.9%) | 256 (17.1%) |
| $50,000 to $54,999 | 79 (7.6%) | 102 (6.8%) |
| $55,000 to $64,999 | 35 (3.4%) | 62 (4.2%) |
| $65,000 to $74,999 | 0 (0.0%) | 52 (3.5%) |
| $75,000 to $99,999 | 21 (2.0%) | 23 (1.5%) |
| $100,000+ | 46 (4.4%) | 0 (0.0%) |
| Total | 1,038 (100.0%) | 1,495 (100.0%) |
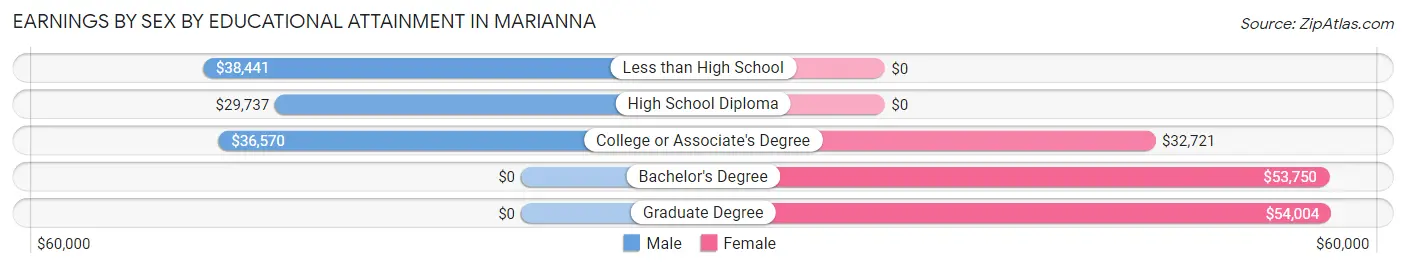
Earnings by Sex by Educational Attainment in Marianna
Average earnings in Marianna are $37,963 for men and $33,712 for women, a difference of 11.2%. Men with an educational attainment of less than high school enjoy the highest average annual earnings of $38,441, while those with high school diploma education earn the least with $29,737. Women with an educational attainment of graduate degree earn the most with the average annual earnings of $54,004, while those with college or associate's degree education have the smallest earnings of $32,721.
| Educational Attainment | Male Income | Female Income |
| Less than High School | $38,441 | $0 |
| High School Diploma | $29,737 | $0 |
| College or Associate's Degree | $36,570 | $32,721 |
| Bachelor's Degree | - | - |
| Graduate Degree | - | - |
| Total | $37,963 | $33,712 |
Family Income in Marianna
Family Income Brackets in Marianna
According to the Marianna family income data, there are 317 families falling into the $35,000 to $49,999 income range, which is the most common income bracket and makes up 23.6% of all families.
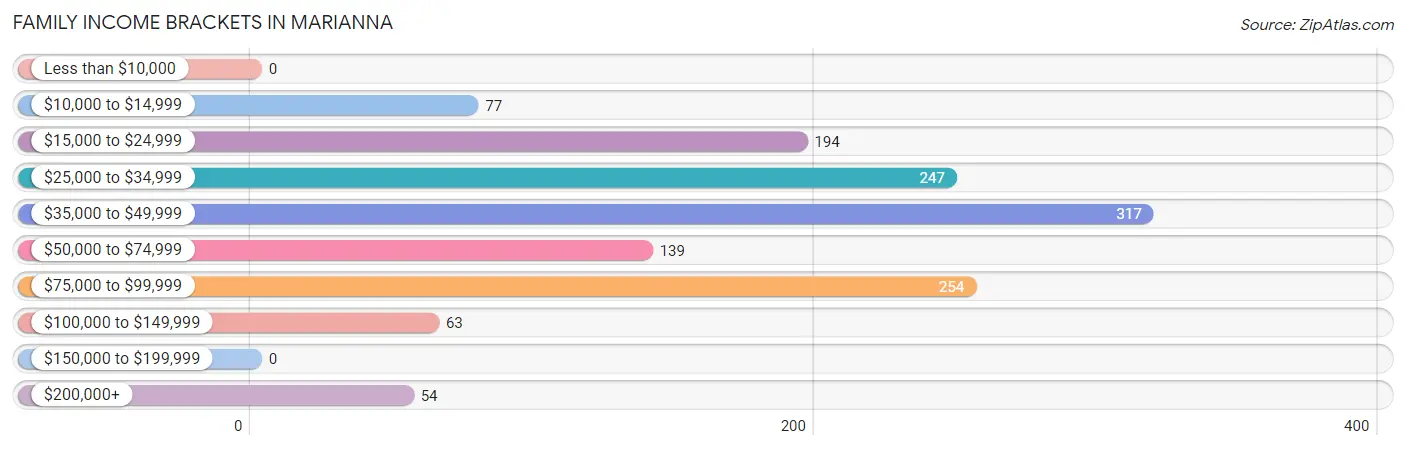
| Income Bracket | # Families | % Families |
| Less than $10,000 | 0 | 0.0% |
| $10,000 to $14,999 | 77 | 5.7% |
| $15,000 to $24,999 | 194 | 14.4% |
| $25,000 to $34,999 | 247 | 18.4% |
| $35,000 to $49,999 | 317 | 23.6% |
| $50,000 to $74,999 | 139 | 10.3% |
| $75,000 to $99,999 | 254 | 18.9% |
| $100,000 to $149,999 | 63 | 4.7% |
| $150,000 to $199,999 | 0 | 0.0% |
| $200,000+ | 54 | 4.0% |
Family Income by Famaliy Size in Marianna
3-person families (324 | 24.1%) account for the highest median family income in Marianna with $50,872 per family, while 2-person families (761 | 56.6%) have the highest median income of $24,418 per family member.
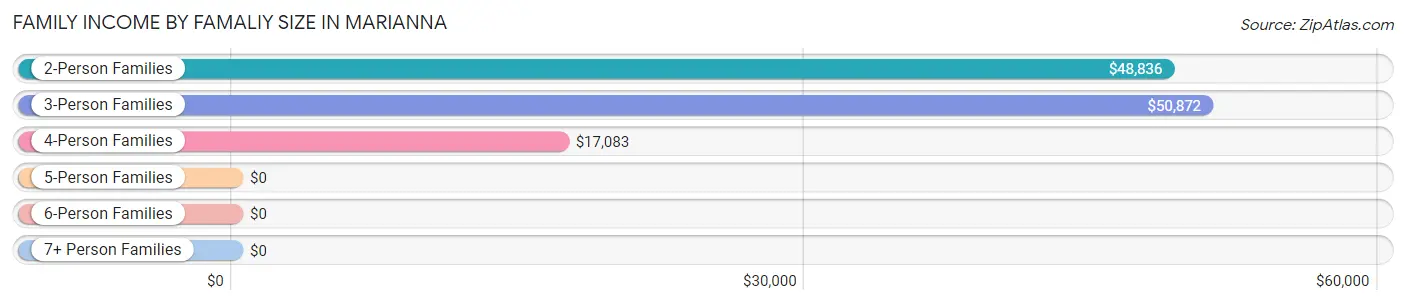
| Income Bracket | # Families | Median Income |
| 2-Person Families | 761 (56.6%) | $48,836 |
| 3-Person Families | 324 (24.1%) | $50,872 |
| 4-Person Families | 190 (14.1%) | $17,083 |
| 5-Person Families | 31 (2.3%) | $0 |
| 6-Person Families | 23 (1.7%) | $0 |
| 7+ Person Families | 16 (1.2%) | $0 |
| Total | 1,345 (100.0%) | $48,125 |
Family Income by Number of Earners in Marianna
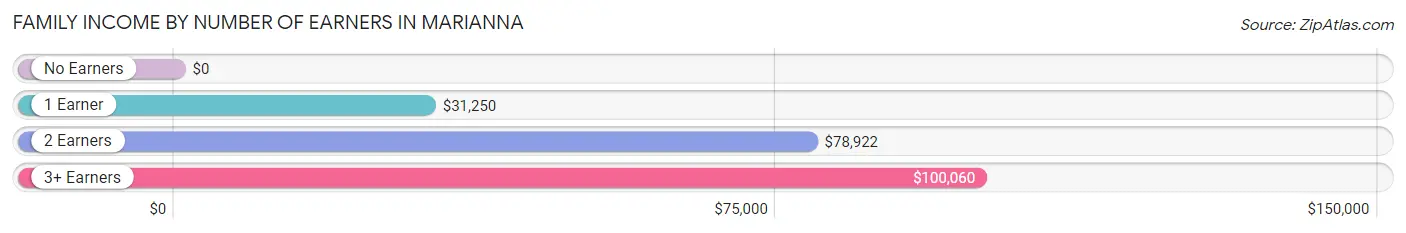
| Number of Earners | # Families | Median Income |
| No Earners | 185 (13.8%) | $0 |
| 1 Earner | 798 (59.3%) | $31,250 |
| 2 Earners | 305 (22.7%) | $78,922 |
| 3+ Earners | 57 (4.2%) | $100,060 |
| Total | 1,345 (100.0%) | $48,125 |
Household Income in Marianna
Household Income Brackets in Marianna
With 499 households falling in the category, the $25,000 to $34,999 income range is the most frequent in Marianna, accounting for 18.8% of all households.
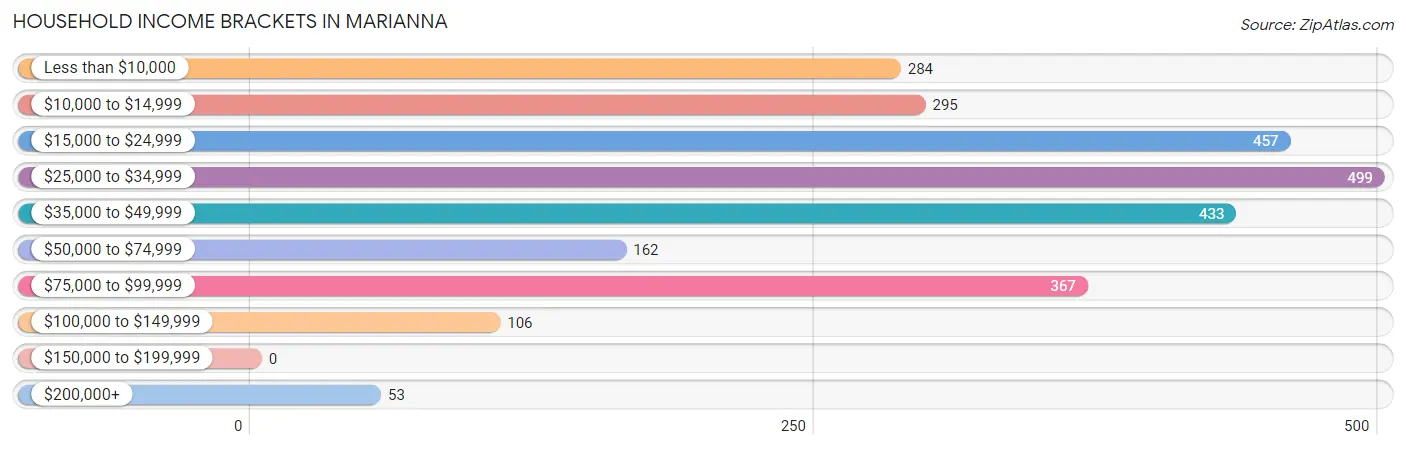
| Income Bracket | # Households | % Households |
| Less than $10,000 | 284 | 10.7% |
| $10,000 to $14,999 | 295 | 11.1% |
| $15,000 to $24,999 | 457 | 17.2% |
| $25,000 to $34,999 | 499 | 18.8% |
| $35,000 to $49,999 | 433 | 16.3% |
| $50,000 to $74,999 | 162 | 6.1% |
| $75,000 to $99,999 | 367 | 13.8% |
| $100,000 to $149,999 | 106 | 4.0% |
| $150,000 to $199,999 | 0 | 0.0% |
| $200,000+ | 53 | 2.0% |
Household Income by Householder Age in Marianna
The median household income in Marianna is $27,296, with the highest median household income of $47,940 found in the 25 to 44 years age bracket for the primary householder. A total of 940 households (35.4%) fall into this category. Meanwhile, the 65+ years age bracket for the primary householder has the lowest median household income of $18,606, with 833 households (31.4%) in this group.
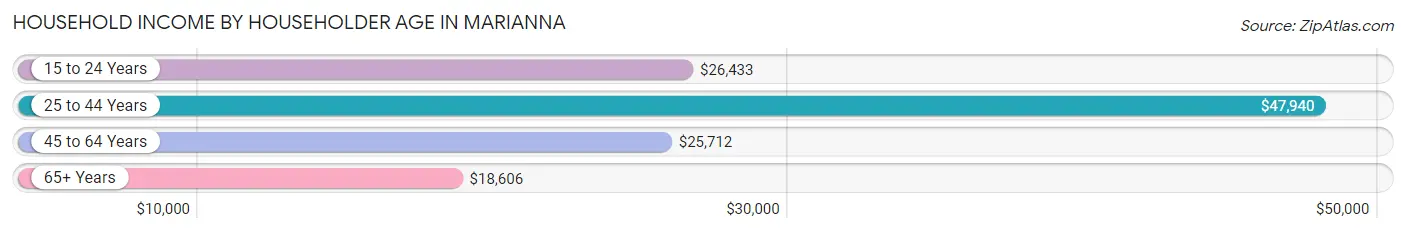
| Income Bracket | # Households | Median Income |
| 15 to 24 Years | 189 (7.1%) | $26,433 |
| 25 to 44 Years | 940 (35.4%) | $47,940 |
| 45 to 64 Years | 694 (26.1%) | $25,712 |
| 65+ Years | 833 (31.4%) | $18,606 |
| Total | 2,656 (100.0%) | $27,296 |
Poverty in Marianna
Income Below Poverty by Sex and Age in Marianna
With 41.0% poverty level for males and 27.8% for females among the residents of Marianna, 12 to 14 year old males and 45 to 54 year old females are the most vulnerable to poverty, with 230 males (86.1%) and 164 females (50.5%) in their respective age groups living below the poverty level.
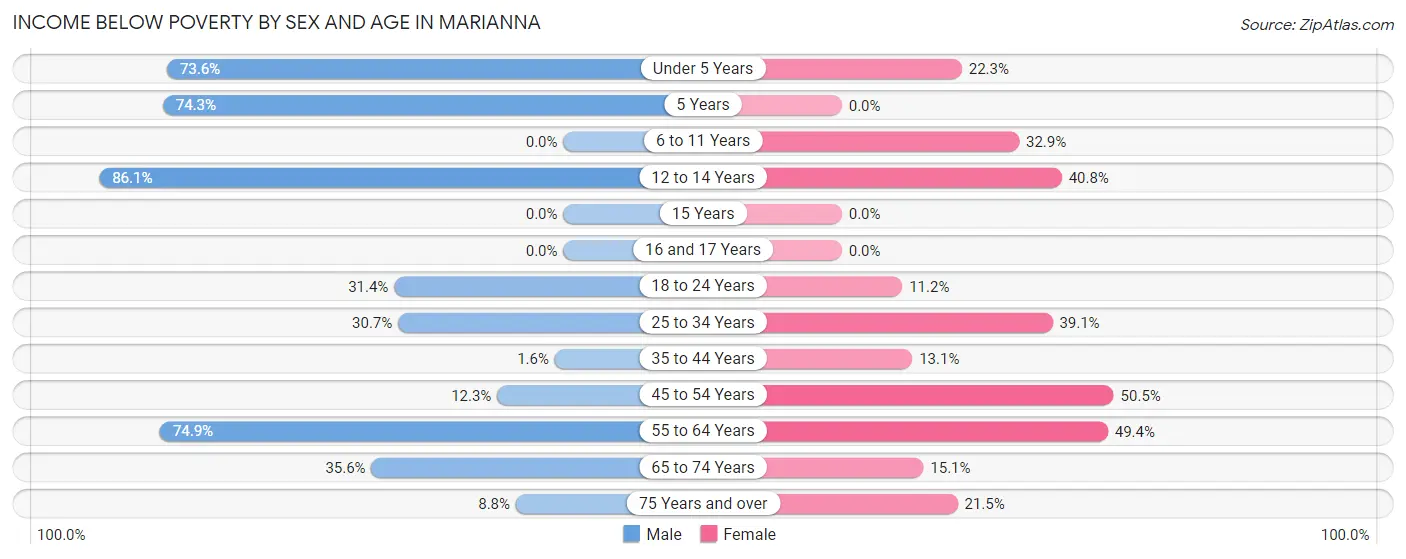
| Age Bracket | Male | Female |
| Under 5 Years | 295 (73.6%) | 55 (22.3%) |
| 5 Years | 84 (74.3%) | 0 (0.0%) |
| 6 to 11 Years | 0 (0.0%) | 102 (32.9%) |
| 12 to 14 Years | 230 (86.1%) | 20 (40.8%) |
| 15 Years | 0 (0.0%) | 0 (0.0%) |
| 16 and 17 Years | 0 (0.0%) | 0 (0.0%) |
| 18 to 24 Years | 54 (31.4%) | 33 (11.2%) |
| 25 to 34 Years | 50 (30.7%) | 156 (39.1%) |
| 35 to 44 Years | 5 (1.6%) | 56 (13.1%) |
| 45 to 54 Years | 21 (12.3%) | 164 (50.5%) |
| 55 to 64 Years | 149 (74.9%) | 160 (49.4%) |
| 65 to 74 Years | 83 (35.6%) | 33 (15.1%) |
| 75 Years and over | 17 (8.8%) | 75 (21.5%) |
| Total | 988 (41.0%) | 854 (27.8%) |
Income Above Poverty by Sex and Age in Marianna
According to the poverty statistics in Marianna, males aged 6 to 11 years and females aged 5 years are the age groups that are most secure financially, with 100.0% of males and 100.0% of females in these age groups living above the poverty line.
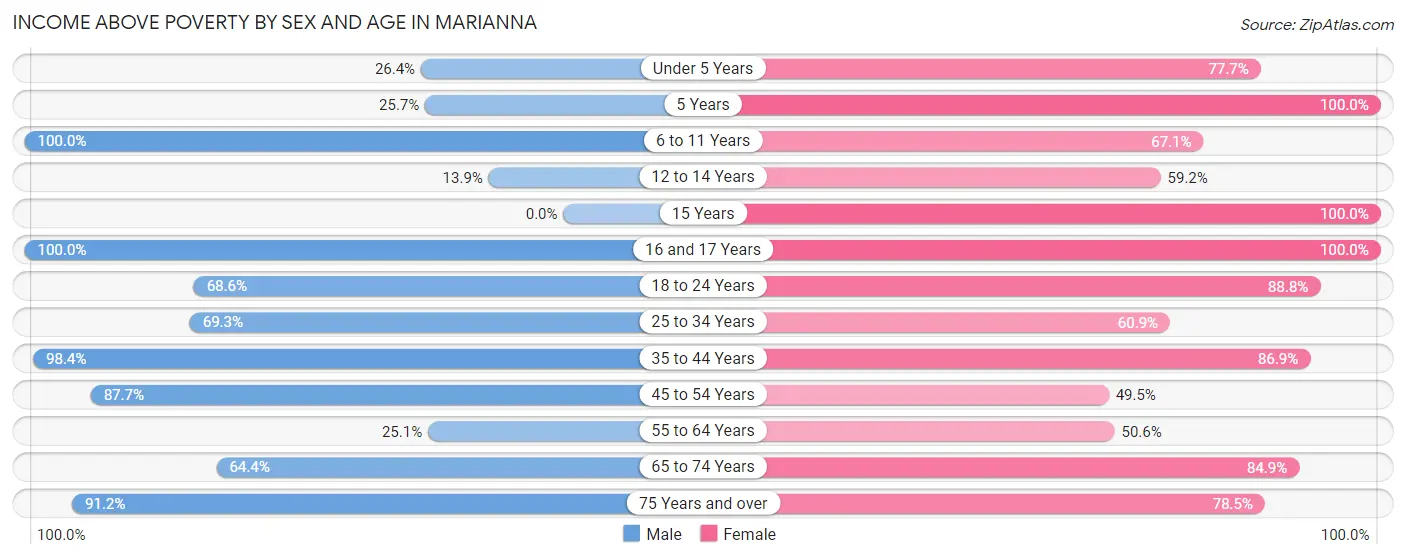
| Age Bracket | Male | Female |
| Under 5 Years | 106 (26.4%) | 192 (77.7%) |
| 5 Years | 29 (25.7%) | 5 (100.0%) |
| 6 to 11 Years | 117 (100.0%) | 208 (67.1%) |
| 12 to 14 Years | 37 (13.9%) | 29 (59.2%) |
| 15 Years | 0 (0.0%) | 11 (100.0%) |
| 16 and 17 Years | 65 (100.0%) | 109 (100.0%) |
| 18 to 24 Years | 118 (68.6%) | 261 (88.8%) |
| 25 to 34 Years | 113 (69.3%) | 243 (60.9%) |
| 35 to 44 Years | 310 (98.4%) | 372 (86.9%) |
| 45 to 54 Years | 150 (87.7%) | 161 (49.5%) |
| 55 to 64 Years | 50 (25.1%) | 164 (50.6%) |
| 65 to 74 Years | 150 (64.4%) | 185 (84.9%) |
| 75 Years and over | 176 (91.2%) | 274 (78.5%) |
| Total | 1,421 (59.0%) | 2,214 (72.2%) |
Income Below Poverty Among Married-Couple Families in Marianna
The poverty statistics for married-couple families in Marianna show that 12.4% or 67 of the total 539 families live below the poverty line. Families with 1 or 2 children have the highest poverty rate of 37.2%, comprising of 67 families. On the other hand, families with no children have the lowest poverty rate of 0.0%, which includes 0 families.
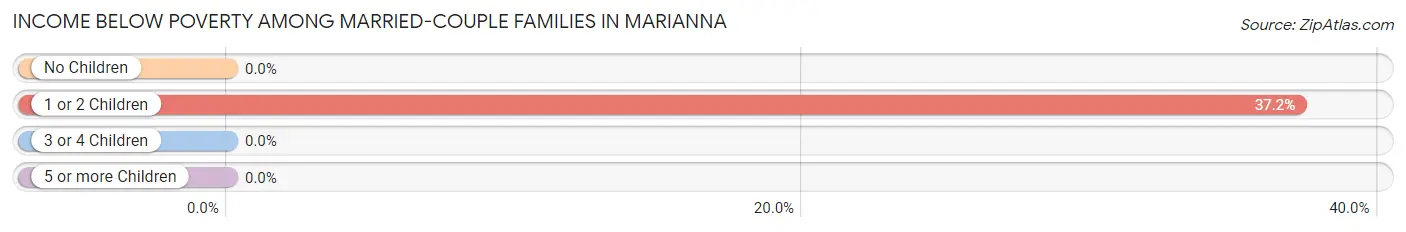
| Children | Above Poverty | Below Poverty |
| No Children | 336 (100.0%) | 0 (0.0%) |
| 1 or 2 Children | 113 (62.8%) | 67 (37.2%) |
| 3 or 4 Children | 23 (100.0%) | 0 (0.0%) |
| 5 or more Children | 0 (0.0%) | 0 (0.0%) |
| Total | 472 (87.6%) | 67 (12.4%) |
Income Below Poverty Among Single-Parent Households in Marianna
According to the poverty data in Marianna, 34.0% or 36 single-father households and 33.6% or 235 single-mother households are living below the poverty line. Among single-father households, those with no children have the highest poverty rate, with 36 households (69.2%) experiencing poverty. Likewise, among single-mother households, those with 3 or 4 children have the highest poverty rate, with 140 households (87.5%) falling below the poverty line.
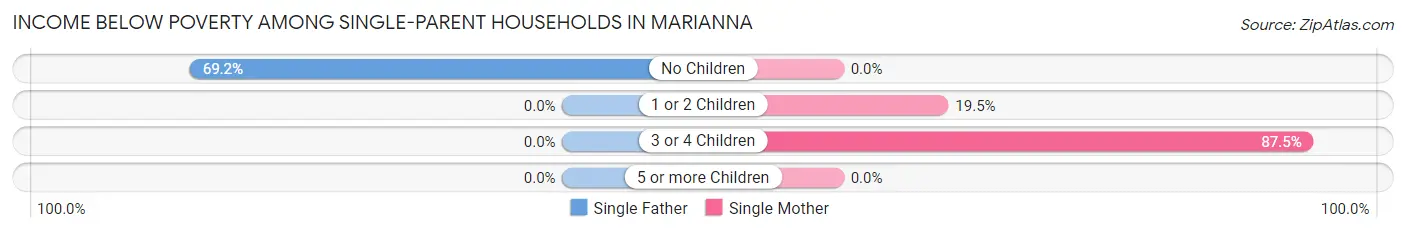
| Children | Single Father | Single Mother |
| No Children | 36 (69.2%) | 0 (0.0%) |
| 1 or 2 Children | 0 (0.0%) | 95 (19.5%) |
| 3 or 4 Children | 0 (0.0%) | 140 (87.5%) |
| 5 or more Children | 0 (0.0%) | 0 (0.0%) |
| Total | 36 (34.0%) | 235 (33.6%) |
Income Below Poverty Among Married-Couple vs Single-Parent Households in Marianna
The poverty data for Marianna shows that 67 of the married-couple family households (12.4%) and 271 of the single-parent households (33.6%) are living below the poverty level. Within the married-couple family households, those with 1 or 2 children have the highest poverty rate, with 67 households (37.2%) falling below the poverty line. Among the single-parent households, those with 3 or 4 children have the highest poverty rate, with 140 household (87.5%) living below poverty.
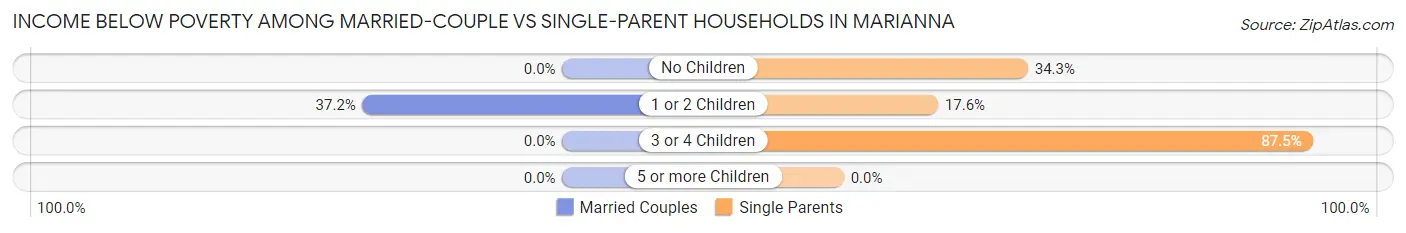
| Children | Married-Couple Families | Single-Parent Households |
| No Children | 0 (0.0%) | 36 (34.3%) |
| 1 or 2 Children | 67 (37.2%) | 95 (17.6%) |
| 3 or 4 Children | 0 (0.0%) | 140 (87.5%) |
| 5 or more Children | 0 (0.0%) | 0 (0.0%) |
| Total | 67 (12.4%) | 271 (33.6%) |
Race in Marianna
The most populous races in Marianna are Black / African American (3,327 | 49.8%), White / Caucasian (3,149 | 47.1%), and Hispanic or Latino (216 | 3.2%).
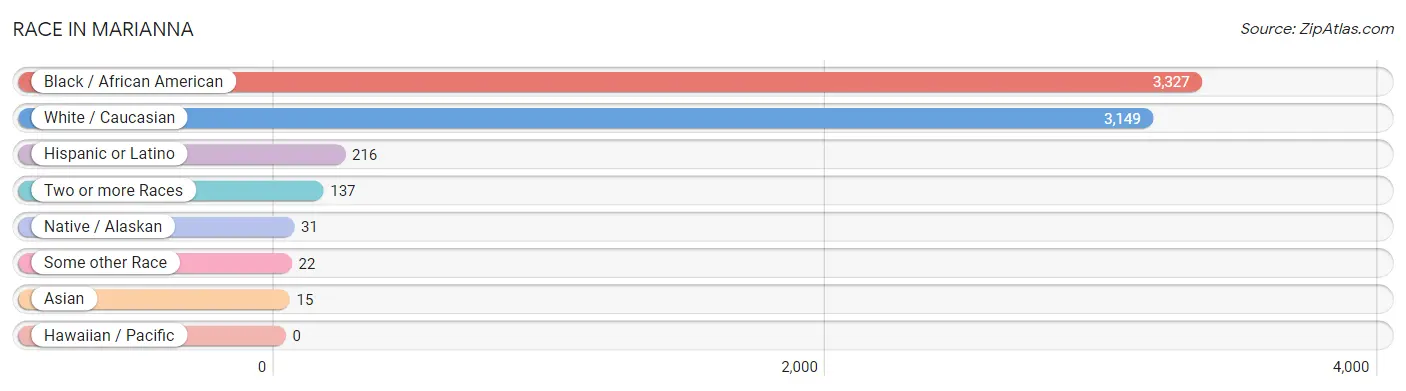
| Race | # Population | % Population |
| Asian | 15 | 0.2% |
| Black / African American | 3,327 | 49.8% |
| Hawaiian / Pacific | 0 | 0.0% |
| Hispanic or Latino | 216 | 3.2% |
| Native / Alaskan | 31 | 0.5% |
| White / Caucasian | 3,149 | 47.1% |
| Two or more Races | 137 | 2.1% |
| Some other Race | 22 | 0.3% |
| Total | 6,681 | 100.0% |
Ancestry in Marianna
The most populous ancestries reported in Marianna are American (1,140 | 17.1%), German (264 | 4.0%), Irish (217 | 3.3%), English (209 | 3.1%), and Polish (177 | 2.6%), together accounting for 30.0% of all Marianna residents.
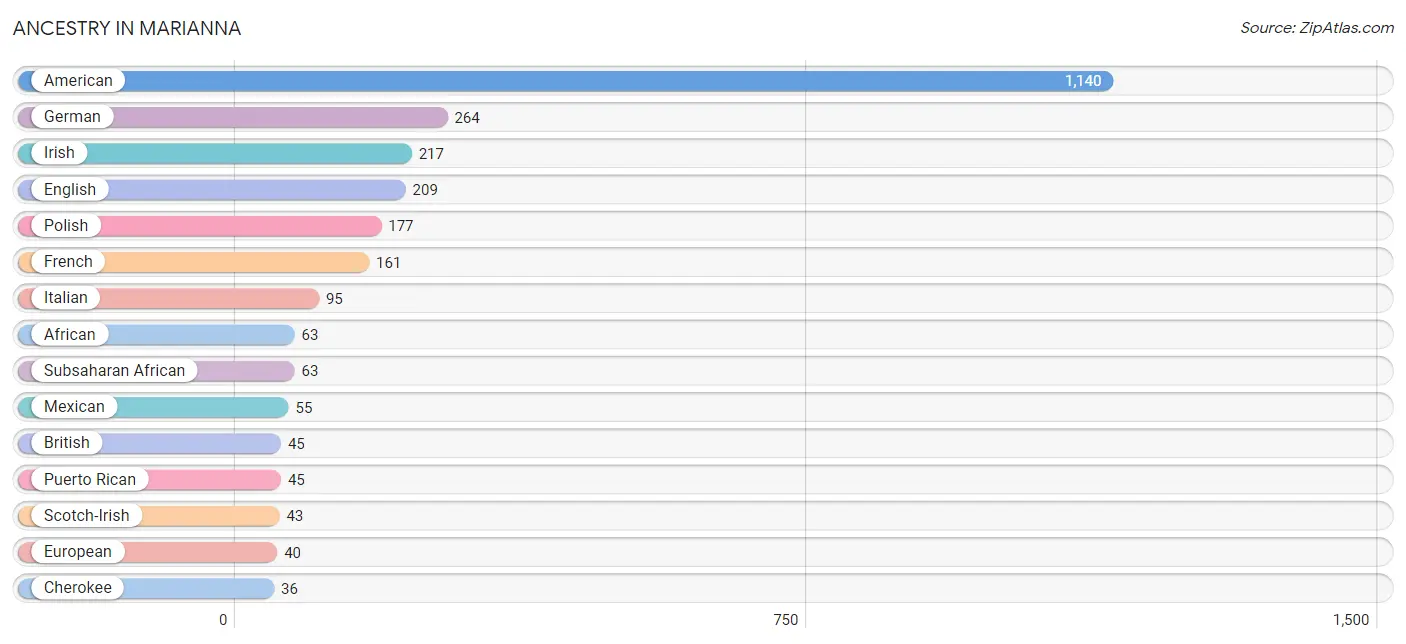
| Ancestry | # Population | % Population |
| African | 63 | 0.9% |
| Albanian | 11 | 0.2% |
| American | 1,140 | 17.1% |
| Arab | 11 | 0.2% |
| British | 45 | 0.7% |
| Burmese | 5 | 0.1% |
| Cajun | 11 | 0.2% |
| Cherokee | 36 | 0.5% |
| Cuban | 10 | 0.2% |
| Ecuadorian | 4 | 0.1% |
| English | 209 | 3.1% |
| European | 40 | 0.6% |
| French | 161 | 2.4% |
| German | 264 | 4.0% |
| Irish | 217 | 3.3% |
| Italian | 95 | 1.4% |
| Japanese | 14 | 0.2% |
| Mexican | 55 | 0.8% |
| Mexican American Indian | 5 | 0.1% |
| Moroccan | 11 | 0.2% |
| Pakistani | 11 | 0.2% |
| Polish | 177 | 2.6% |
| Portuguese | 6 | 0.1% |
| Puerto Rican | 45 | 0.7% |
| Russian | 21 | 0.3% |
| Scotch-Irish | 43 | 0.6% |
| Scottish | 31 | 0.5% |
| South American | 10 | 0.2% |
| South American Indian | 4 | 0.1% |
| Subsaharan African | 63 | 0.9% |
| Ukrainian | 5 | 0.1% |
| Venezuelan | 6 | 0.1% |
| Welsh | 7 | 0.1% | View All 33 Rows |
Immigrants in Marianna
The most numerous immigrant groups reported in Marianna came from Latin America (34 | 0.5%), Canada (33 | 0.5%), Eastern Europe (21 | 0.3%), Europe (21 | 0.3%), and Central America (20 | 0.3%), together accounting for 1.9% of all Marianna residents.
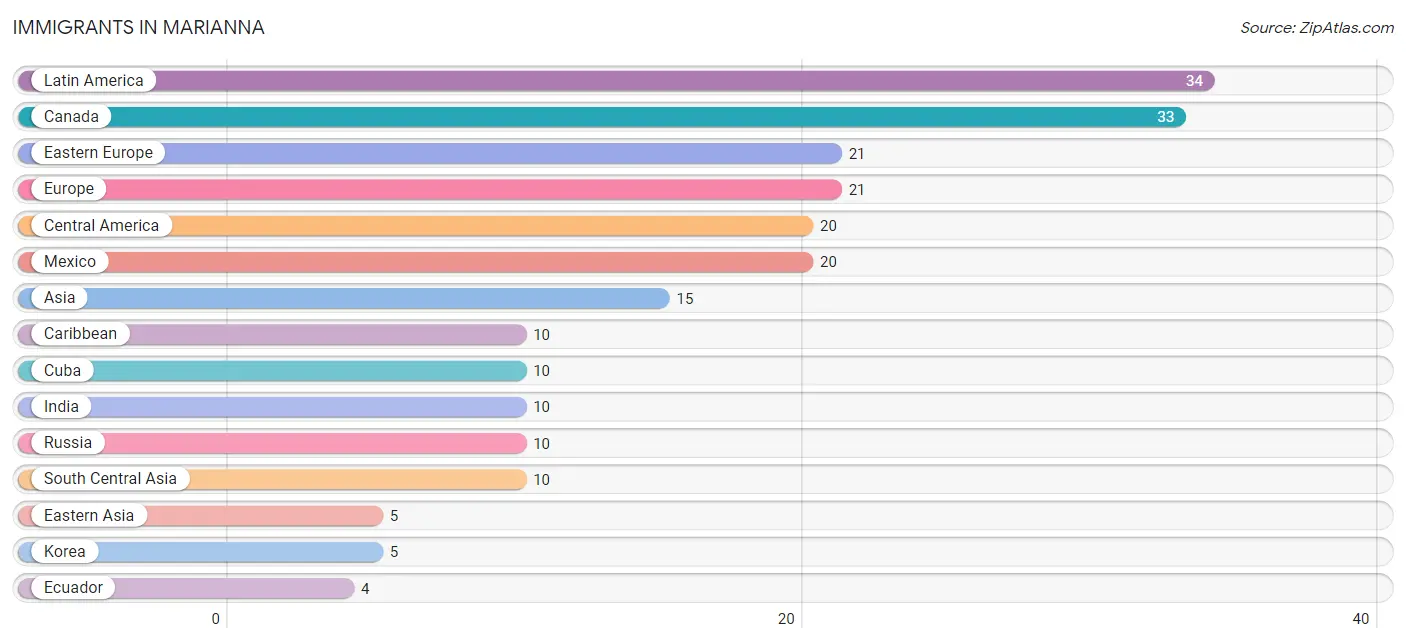
| Immigration Origin | # Population | % Population |
| Asia | 15 | 0.2% |
| Canada | 33 | 0.5% |
| Caribbean | 10 | 0.2% |
| Central America | 20 | 0.3% |
| Cuba | 10 | 0.2% |
| Eastern Asia | 5 | 0.1% |
| Eastern Europe | 21 | 0.3% |
| Ecuador | 4 | 0.1% |
| Europe | 21 | 0.3% |
| India | 10 | 0.2% |
| Korea | 5 | 0.1% |
| Latin America | 34 | 0.5% |
| Mexico | 20 | 0.3% |
| Russia | 10 | 0.2% |
| South America | 4 | 0.1% |
| South Central Asia | 10 | 0.2% | View All 16 Rows |
Sex and Age in Marianna
Sex and Age in Marianna
The most populous age groups in Marianna are Under 5 Years (401 | 12.0%) for men and 40 to 44 Years (337 | 10.1%) for women.
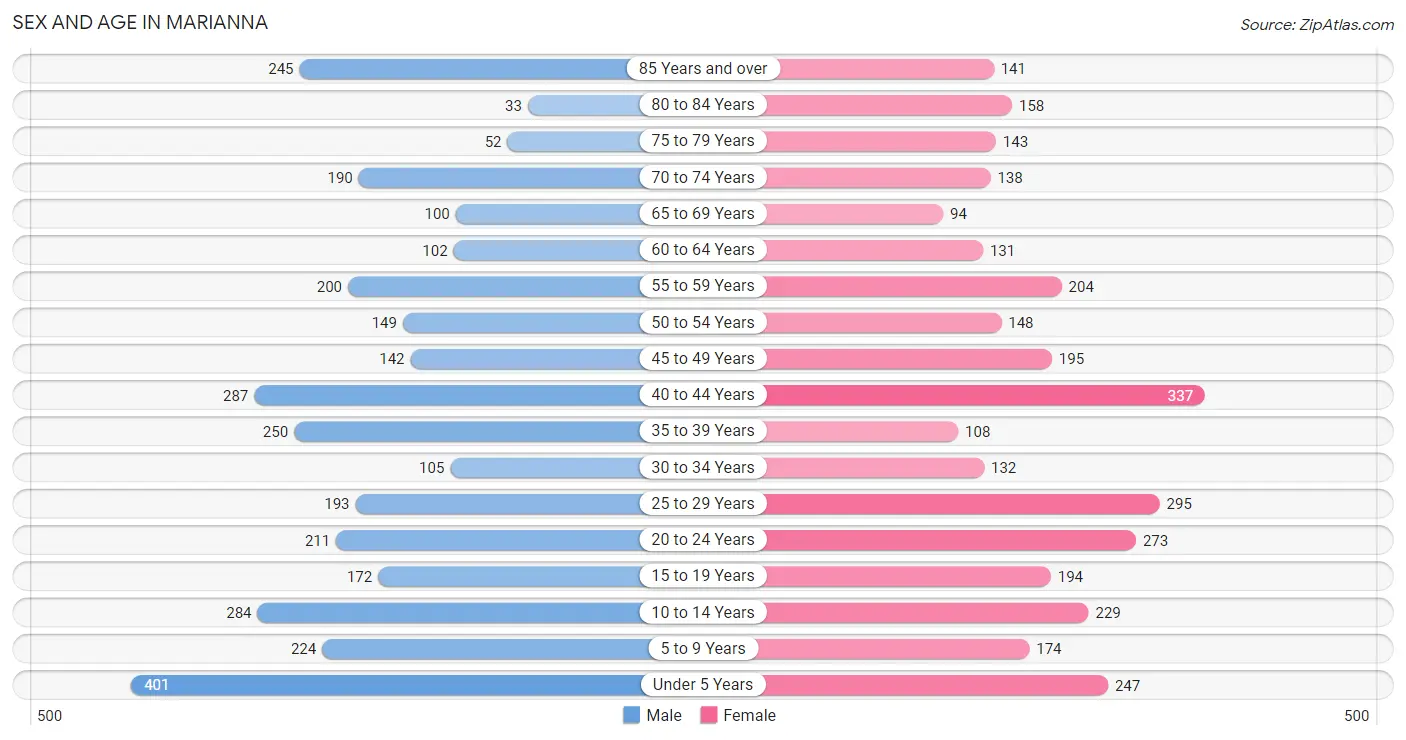
| Age Bracket | Male | Female |
| Under 5 Years | 401 (12.0%) | 247 (7.4%) |
| 5 to 9 Years | 224 (6.7%) | 174 (5.2%) |
| 10 to 14 Years | 284 (8.5%) | 229 (6.9%) |
| 15 to 19 Years | 172 (5.1%) | 194 (5.8%) |
| 20 to 24 Years | 211 (6.3%) | 273 (8.2%) |
| 25 to 29 Years | 193 (5.8%) | 295 (8.8%) |
| 30 to 34 Years | 105 (3.1%) | 132 (4.0%) |
| 35 to 39 Years | 250 (7.5%) | 108 (3.2%) |
| 40 to 44 Years | 287 (8.6%) | 337 (10.1%) |
| 45 to 49 Years | 142 (4.3%) | 195 (5.8%) |
| 50 to 54 Years | 149 (4.5%) | 148 (4.4%) |
| 55 to 59 Years | 200 (6.0%) | 204 (6.1%) |
| 60 to 64 Years | 102 (3.0%) | 131 (3.9%) |
| 65 to 69 Years | 100 (3.0%) | 94 (2.8%) |
| 70 to 74 Years | 190 (5.7%) | 138 (4.1%) |
| 75 to 79 Years | 52 (1.6%) | 143 (4.3%) |
| 80 to 84 Years | 33 (1.0%) | 158 (4.7%) |
| 85 Years and over | 245 (7.3%) | 141 (4.2%) |
| Total | 3,340 (100.0%) | 3,341 (100.0%) |
Families and Households in Marianna
Median Family Size in Marianna
The median family size in Marianna is 2.90 persons per family, with single female/mother families (700 | 52.0%) accounting for the largest median family size of 3 persons per family. On the other hand, married-couple families (539 | 40.1%) represent the smallest median family size with 2.78 persons per family.
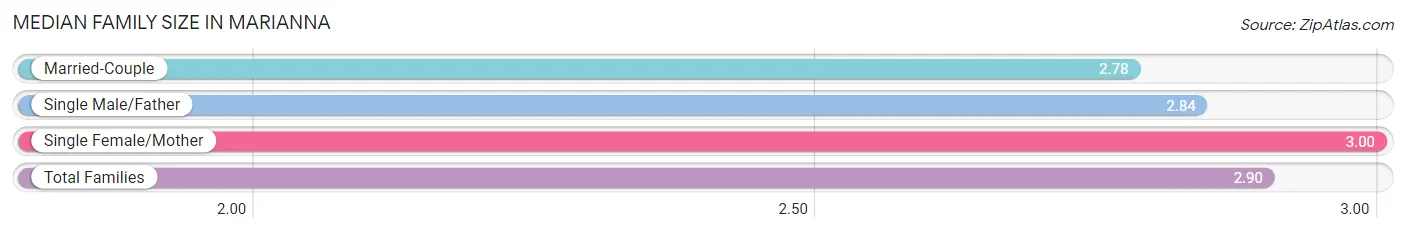
| Family Type | # Families | Family Size |
| Married-Couple | 539 (40.1%) | 2.78 |
| Single Male/Father | 106 (7.9%) | 2.84 |
| Single Female/Mother | 700 (52.0%) | 3.00 |
| Total Families | 1,345 (100.0%) | 2.90 |
Median Household Size in Marianna
The median household size in Marianna is 2.06 persons per household, with single male/father households (106 | 4.0%) accounting for the largest median household size of 3.47 persons per household. non-family households (1,311 | 49.4%) represent the smallest median household size with 1.08 persons per household.

| Household Type | # Households | Household Size |
| Married-Couple | 539 (20.3%) | 2.78 |
| Single Male/Father | 106 (4.0%) | 3.47 |
| Single Female/Mother | 700 (26.4%) | 3.11 |
| Non-family | 1,311 (49.4%) | 1.08 |
| Total Households | 2,656 (100.0%) | 2.06 |
Household Size by Marriage Status in Marianna
Out of a total of 2,656 households in Marianna, 1,345 (50.6%) are family households, while 1,311 (49.4%) are nonfamily households. The most numerous type of family households are 2-person households, comprising 750, and the most common type of nonfamily households are 1-person households, comprising 1,196.
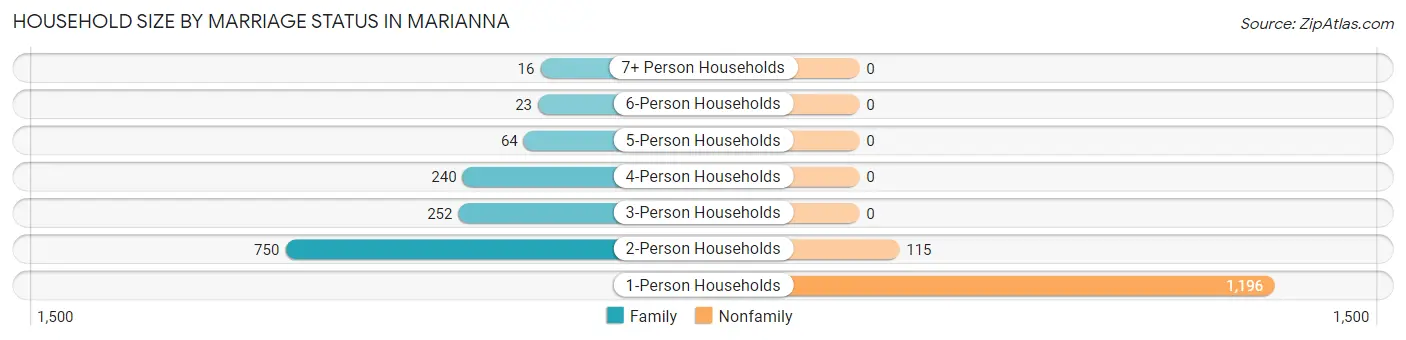
| Household Size | Family Households | Nonfamily Households |
| 1-Person Households | - | 1,196 (45.0%) |
| 2-Person Households | 750 (28.2%) | 115 (4.3%) |
| 3-Person Households | 252 (9.5%) | 0 (0.0%) |
| 4-Person Households | 240 (9.0%) | 0 (0.0%) |
| 5-Person Households | 64 (2.4%) | 0 (0.0%) |
| 6-Person Households | 23 (0.9%) | 0 (0.0%) |
| 7+ Person Households | 16 (0.6%) | 0 (0.0%) |
| Total | 1,345 (50.6%) | 1,311 (49.4%) |
Female Fertility in Marianna
Fertility by Age in Marianna
Average fertility rate in Marianna is 89.0 births per 1,000 women. Women in the age bracket of 20 to 34 years have the highest fertility rate with 196.0 births per 1,000 women. Women in the age bracket of 20 to 34 years acount for 100.0% of all women with births.
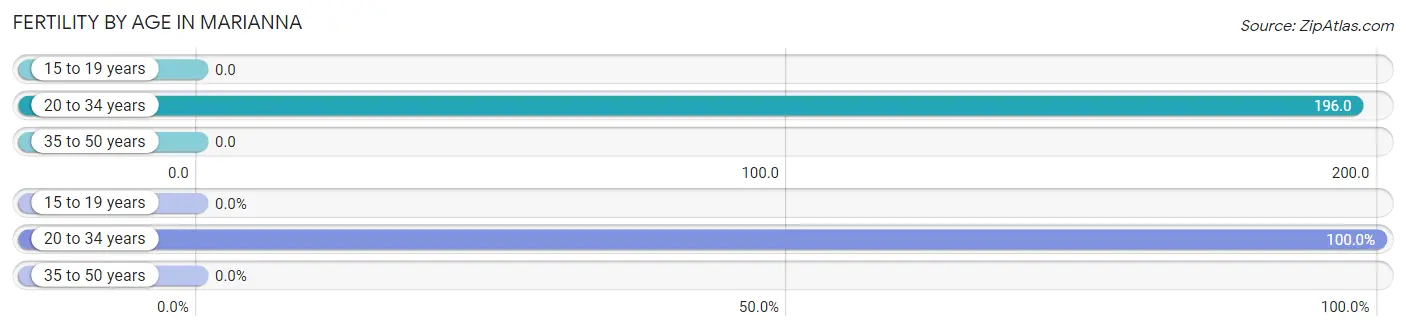
| Age Bracket | Women with Births | Births / 1,000 Women |
| 15 to 19 years | 0 (0.0%) | 0.0 |
| 20 to 34 years | 137 (100.0%) | 196.0 |
| 35 to 50 years | 0 (0.0%) | 0.0 |
| Total | 137 (100.0%) | 89.0 |
Fertility by Age by Marriage Status in Marianna
9.5% of women with births (137) in Marianna are married. The highest percentage of unmarried women with births falls into 20 to 34 years age bracket with 90.5% of them unmarried at the time of birth, while the lowest percentage of unmarried women with births belong to 20 to 34 years age bracket with 90.5% of them unmarried.
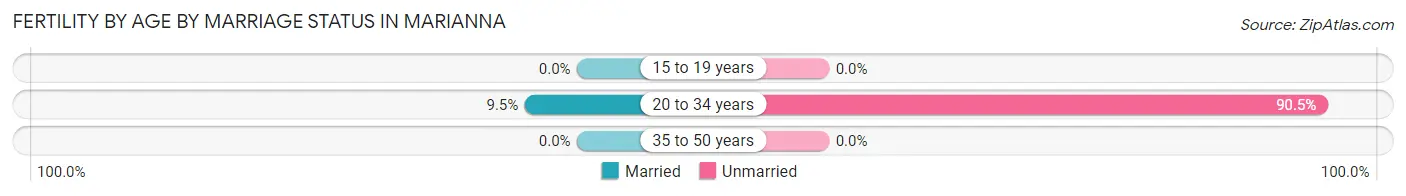
| Age Bracket | Married | Unmarried |
| 15 to 19 years | 0 (0.0%) | 0 (0.0%) |
| 20 to 34 years | 13 (9.5%) | 124 (90.5%) |
| 35 to 50 years | 0 (0.0%) | 0 (0.0%) |
| Total | 13 (9.5%) | 124 (90.5%) |
Fertility by Education in Marianna
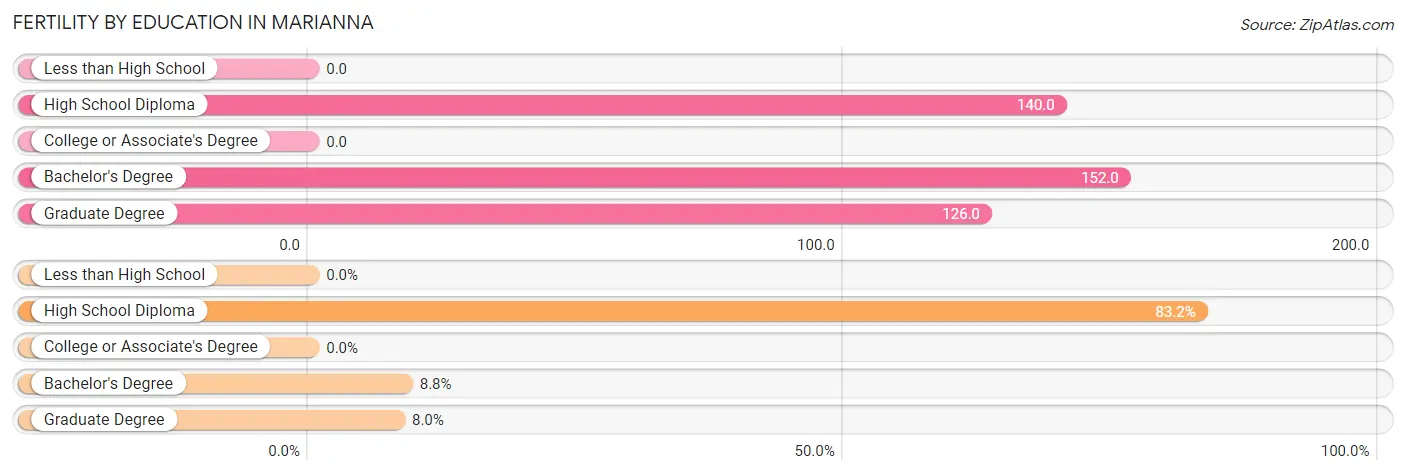
| Educational Attainment | Women with Births | Births / 1,000 Women |
| Less than High School | 0 (0.0%) | 0.0 |
| High School Diploma | 114 (83.2%) | 140.0 |
| College or Associate's Degree | 0 (0.0%) | 0.0 |
| Bachelor's Degree | 12 (8.8%) | 152.0 |
| Graduate Degree | 11 (8.0%) | 126.0 |
| Total | 137 (100.0%) | 89.0 |
Fertility by Education by Marriage Status in Marianna
90.5% of women with births in Marianna are unmarried. Women with the educational attainment of graduate degree are most likely to be married with 100.0% of them married at childbirth, while women with the educational attainment of high school diploma are least likely to be married with 100.0% of them unmarried at childbirth.
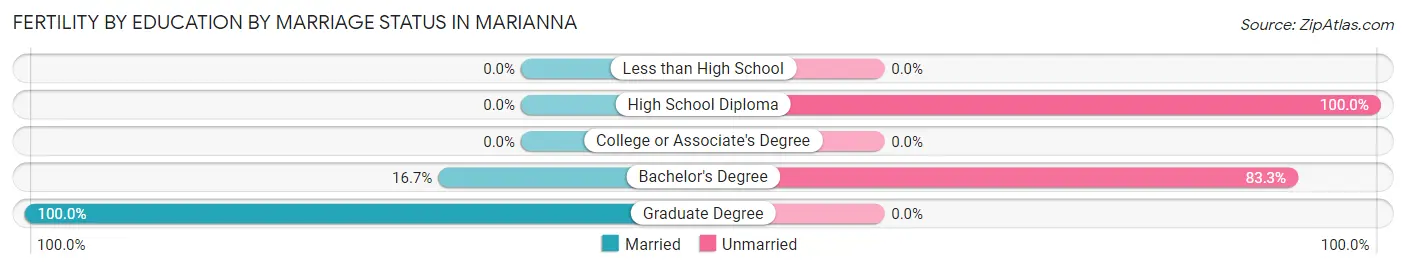
| Educational Attainment | Married | Unmarried |
| Less than High School | 0 (0.0%) | 0 (0.0%) |
| High School Diploma | 0 (0.0%) | 114 (100.0%) |
| College or Associate's Degree | 0 (0.0%) | 0 (0.0%) |
| Bachelor's Degree | 2 (16.7%) | 10 (83.3%) |
| Graduate Degree | 11 (100.0%) | 0 (0.0%) |
| Total | 13 (9.5%) | 124 (90.5%) |
Employment Characteristics in Marianna
Employment by Class of Employer in Marianna
Among the 2,080 employed individuals in Marianna, private company employees (1,438 | 69.1%), state government employees (281 | 13.5%), and local government employees (130 | 6.2%) make up the most common classes of employment.
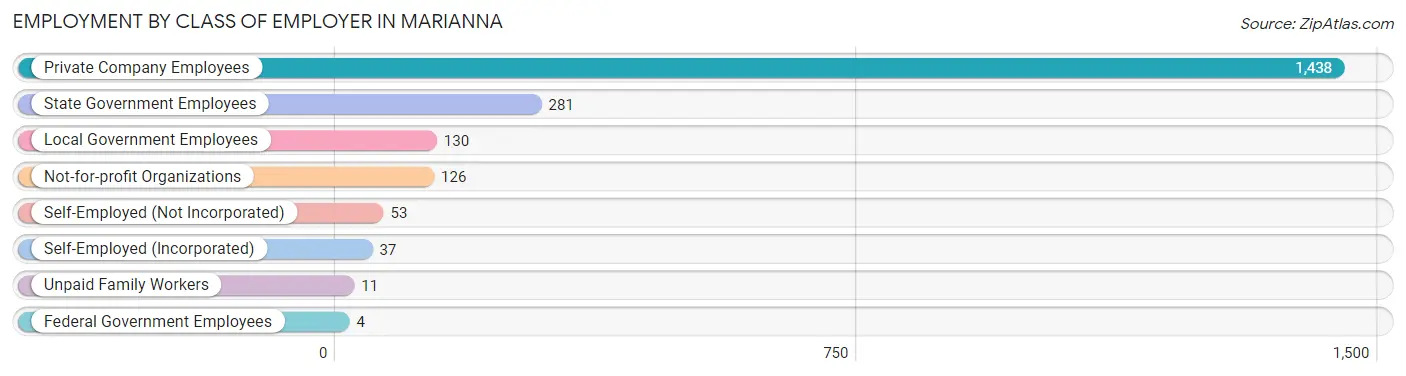
| Employer Class | # Employees | % Employees |
| Private Company Employees | 1,438 | 69.1% |
| Self-Employed (Incorporated) | 37 | 1.8% |
| Self-Employed (Not Incorporated) | 53 | 2.5% |
| Not-for-profit Organizations | 126 | 6.1% |
| Local Government Employees | 130 | 6.2% |
| State Government Employees | 281 | 13.5% |
| Federal Government Employees | 4 | 0.2% |
| Unpaid Family Workers | 11 | 0.5% |
| Total | 2,080 | 100.0% |
Employment Status by Age in Marianna
According to the labor force statistics for Marianna, out of the total population over 16 years of age (5,109), 43.3% or 2,212 individuals are in the labor force, with 5.2% or 115 of them unemployed. The age group with the highest labor force participation rate is 20 to 24 years, with 77.1% or 373 individuals in the labor force. Within the labor force, the 55 to 59 years age range has the highest percentage of unemployed individuals, with 42.4% or 53 of them being unemployed.
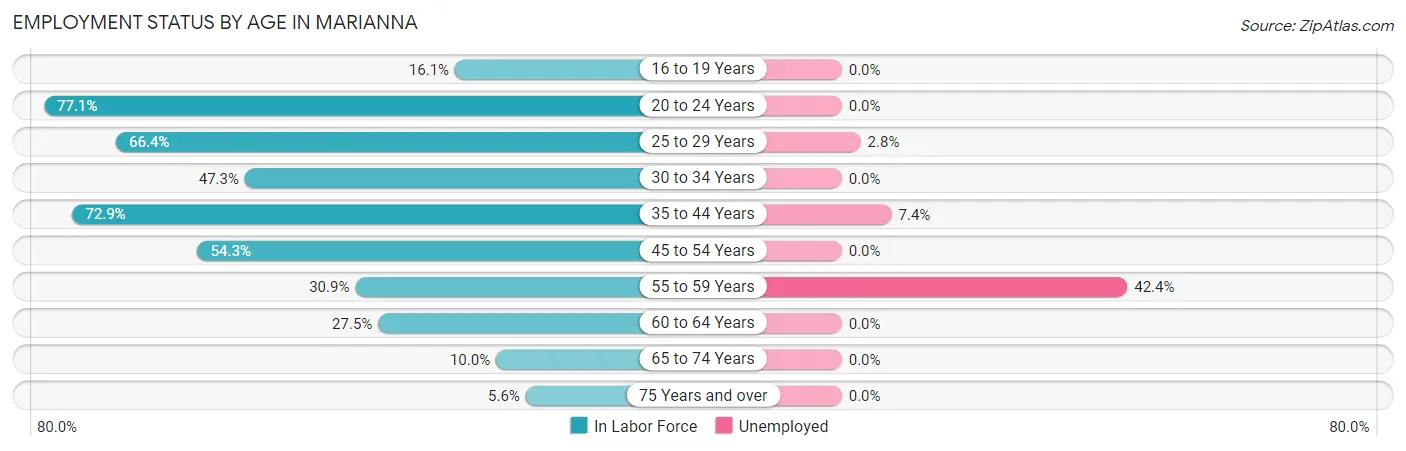
| Age Bracket | In Labor Force | Unemployed |
| 16 to 19 Years | 57 (16.1%) | 0 (0.0%) |
| 20 to 24 Years | 373 (77.1%) | 0 (0.0%) |
| 25 to 29 Years | 324 (66.4%) | 9 (2.8%) |
| 30 to 34 Years | 112 (47.3%) | 0 (0.0%) |
| 35 to 44 Years | 716 (72.9%) | 53 (7.4%) |
| 45 to 54 Years | 344 (54.3%) | 0 (0.0%) |
| 55 to 59 Years | 125 (30.9%) | 53 (42.4%) |
| 60 to 64 Years | 64 (27.5%) | 0 (0.0%) |
| 65 to 74 Years | 52 (10.0%) | 0 (0.0%) |
| 75 Years and over | 43 (5.6%) | 0 (0.0%) |
| Total | 2,212 (43.3%) | 115 (5.2%) |
Employment Status by Educational Attainment in Marianna
According to labor force statistics for Marianna, 56.6% of individuals (1,686) out of the total population between 25 and 64 years of age (2,978) are in the labor force, with 6.8% or 115 of them being unemployed. The group with the highest labor force participation rate are those with the educational attainment of bachelor's degree or higher, with 73.3% or 187 individuals in the labor force. Within the labor force, individuals with high school diploma education have the highest percentage of unemployment, with 13.9% or 110 of them being unemployed.
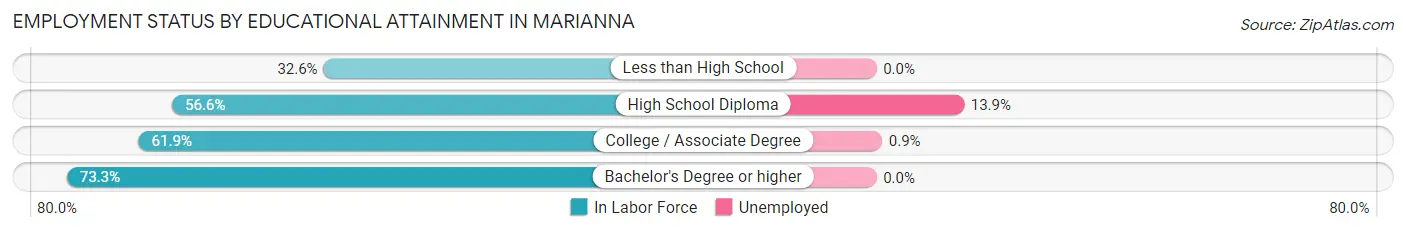
| Educational Attainment | In Labor Force | Unemployed |
| Less than High School | 126 (32.6%) | 0 (0.0%) |
| High School Diploma | 794 (56.6%) | 195 (13.9%) |
| College / Associate Degree | 579 (61.9%) | 8 (0.9%) |
| Bachelor's Degree or higher | 187 (73.3%) | 0 (0.0%) |
| Total | 1,686 (56.6%) | 203 (6.8%) |
Employment Occupations by Sex in Marianna
Management, Business, Science and Arts Occupations
The most common Management, Business, Science and Arts occupations in Marianna are Community & Social Service (432 | 20.6%), Legal Services & Support (207 | 9.9%), Education Instruction & Library (162 | 7.7%), Health Diagnosing & Treating (144 | 6.9%), and Management (83 | 4.0%).
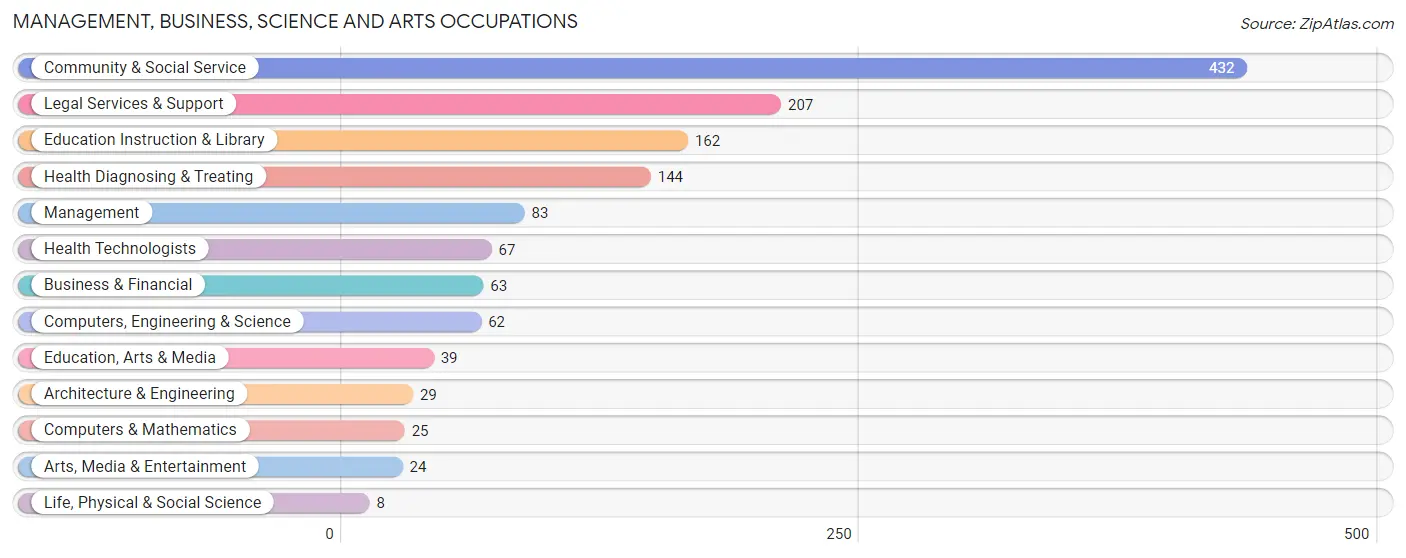
Management, Business, Science and Arts Occupations by Sex
Within the Management, Business, Science and Arts occupations in Marianna, the most male-oriented occupations are Computers, Engineering & Science (100.0%), Computers & Mathematics (100.0%), and Architecture & Engineering (100.0%), while the most female-oriented occupations are Legal Services & Support (100.0%), Health Diagnosing & Treating (94.4%), and Community & Social Service (92.4%).
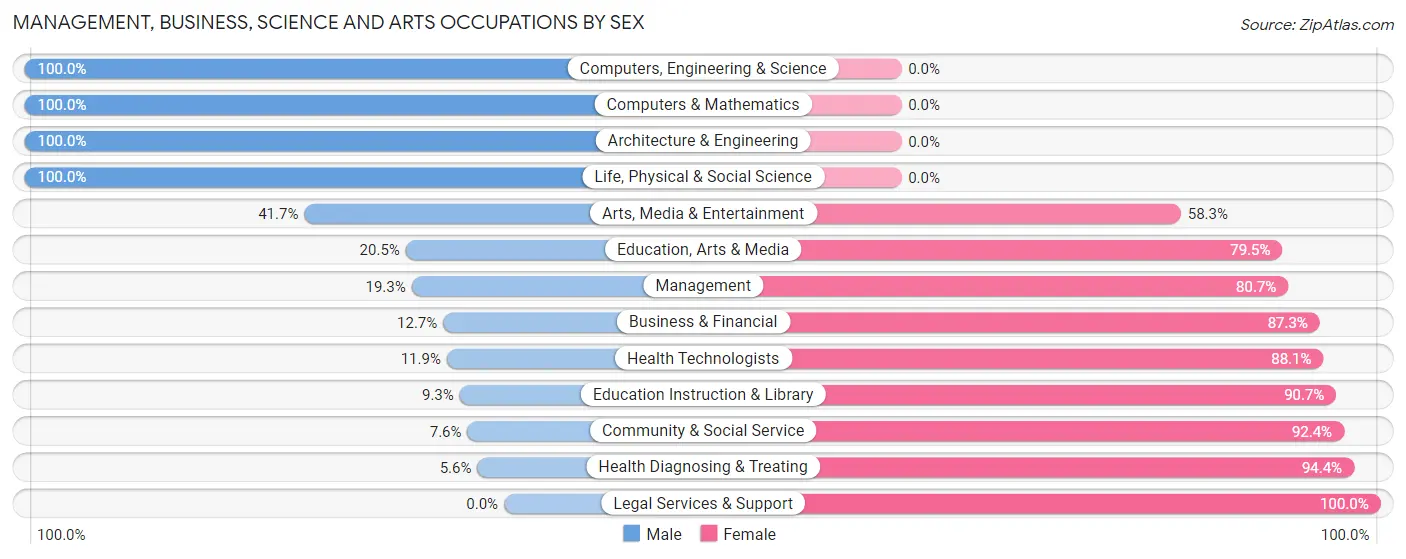
| Occupation | Male | Female |
| Management | 16 (19.3%) | 67 (80.7%) |
| Business & Financial | 8 (12.7%) | 55 (87.3%) |
| Computers, Engineering & Science | 62 (100.0%) | 0 (0.0%) |
| Computers & Mathematics | 25 (100.0%) | 0 (0.0%) |
| Architecture & Engineering | 29 (100.0%) | 0 (0.0%) |
| Life, Physical & Social Science | 8 (100.0%) | 0 (0.0%) |
| Community & Social Service | 33 (7.6%) | 399 (92.4%) |
| Education, Arts & Media | 8 (20.5%) | 31 (79.5%) |
| Legal Services & Support | 0 (0.0%) | 207 (100.0%) |
| Education Instruction & Library | 15 (9.3%) | 147 (90.7%) |
| Arts, Media & Entertainment | 10 (41.7%) | 14 (58.3%) |
| Health Diagnosing & Treating | 8 (5.6%) | 136 (94.4%) |
| Health Technologists | 8 (11.9%) | 59 (88.1%) |
| Total (Category) | 127 (16.2%) | 657 (83.8%) |
| Total (Overall) | 780 (37.2%) | 1,315 (62.8%) |
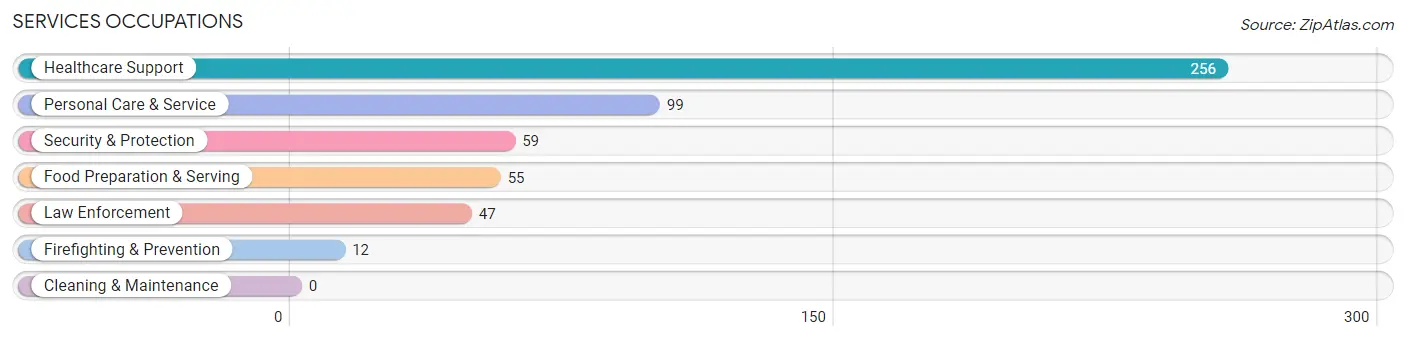
Services Occupations
The most common Services occupations in Marianna are Healthcare Support (256 | 12.2%), Personal Care & Service (99 | 4.7%), Security & Protection (59 | 2.8%), Food Preparation & Serving (55 | 2.6%), and Law Enforcement (47 | 2.2%).
Services Occupations by Sex
Within the Services occupations in Marianna, the most male-oriented occupations are Security & Protection (100.0%), Firefighting & Prevention (100.0%), and Law Enforcement (100.0%), while the most female-oriented occupations are Personal Care & Service (100.0%), Healthcare Support (74.6%), and Food Preparation & Serving (72.7%).
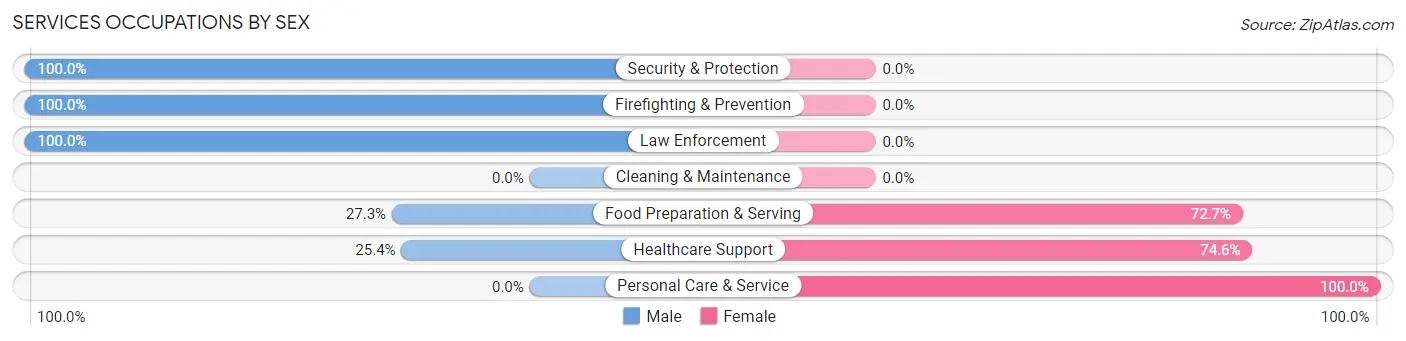
| Occupation | Male | Female |
| Healthcare Support | 65 (25.4%) | 191 (74.6%) |
| Security & Protection | 59 (100.0%) | 0 (0.0%) |
| Firefighting & Prevention | 12 (100.0%) | 0 (0.0%) |
| Law Enforcement | 47 (100.0%) | 0 (0.0%) |
| Food Preparation & Serving | 15 (27.3%) | 40 (72.7%) |
| Cleaning & Maintenance | 0 (0.0%) | 0 (0.0%) |
| Personal Care & Service | 0 (0.0%) | 99 (100.0%) |
| Total (Category) | 139 (29.6%) | 330 (70.4%) |
| Total (Overall) | 780 (37.2%) | 1,315 (62.8%) |
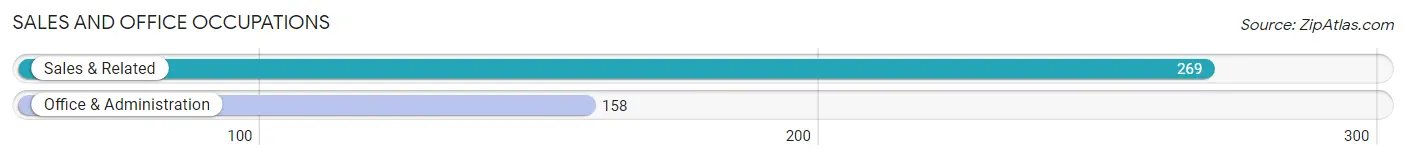
Sales and Office Occupations
The most common Sales and Office occupations in Marianna are Sales & Related (269 | 12.8%), and Office & Administration (158 | 7.5%).
Sales and Office Occupations by Sex
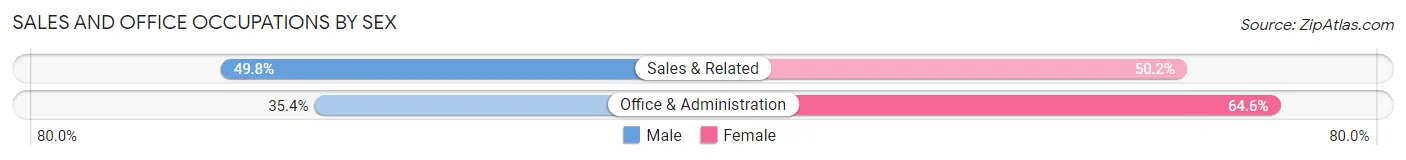
| Occupation | Male | Female |
| Sales & Related | 134 (49.8%) | 135 (50.2%) |
| Office & Administration | 56 (35.4%) | 102 (64.6%) |
| Total (Category) | 190 (44.5%) | 237 (55.5%) |
| Total (Overall) | 780 (37.2%) | 1,315 (62.8%) |
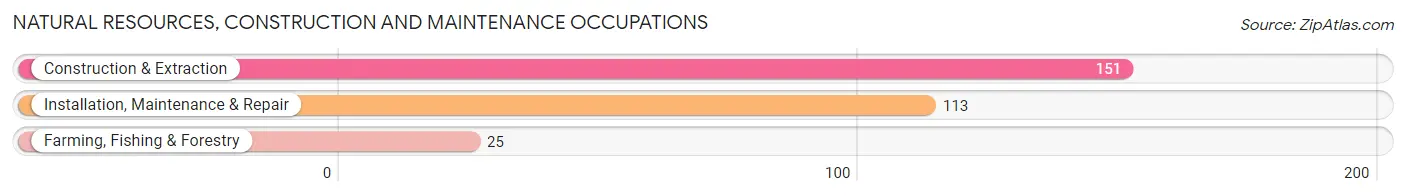
Natural Resources, Construction and Maintenance Occupations
The most common Natural Resources, Construction and Maintenance occupations in Marianna are Construction & Extraction (151 | 7.2%), Installation, Maintenance & Repair (113 | 5.4%), and Farming, Fishing & Forestry (25 | 1.2%).
Natural Resources, Construction and Maintenance Occupations by Sex
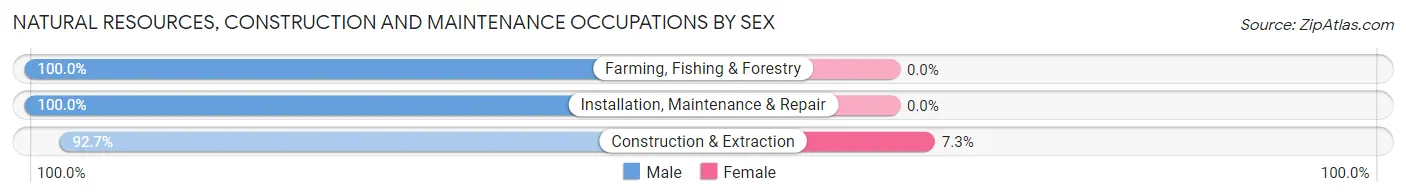
| Occupation | Male | Female |
| Farming, Fishing & Forestry | 25 (100.0%) | 0 (0.0%) |
| Construction & Extraction | 140 (92.7%) | 11 (7.3%) |
| Installation, Maintenance & Repair | 113 (100.0%) | 0 (0.0%) |
| Total (Category) | 278 (96.2%) | 11 (3.8%) |
| Total (Overall) | 780 (37.2%) | 1,315 (62.8%) |
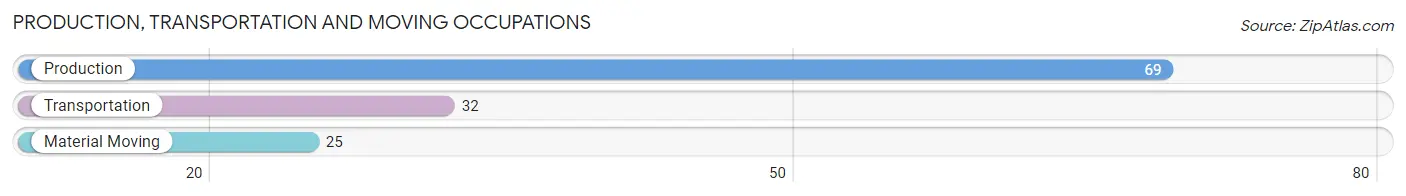
Production, Transportation and Moving Occupations
The most common Production, Transportation and Moving occupations in Marianna are Production (69 | 3.3%), Transportation (32 | 1.5%), and Material Moving (25 | 1.2%).
Production, Transportation and Moving Occupations by Sex
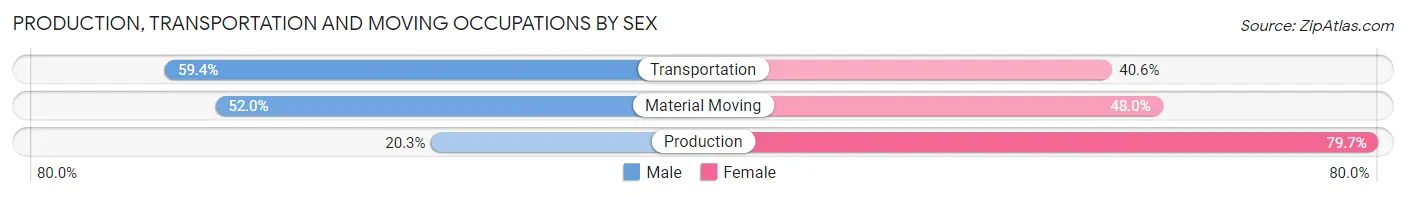
| Occupation | Male | Female |
| Production | 14 (20.3%) | 55 (79.7%) |
| Transportation | 19 (59.4%) | 13 (40.6%) |
| Material Moving | 13 (52.0%) | 12 (48.0%) |
| Total (Category) | 46 (36.5%) | 80 (63.5%) |
| Total (Overall) | 780 (37.2%) | 1,315 (62.8%) |
Employment Industries by Sex in Marianna
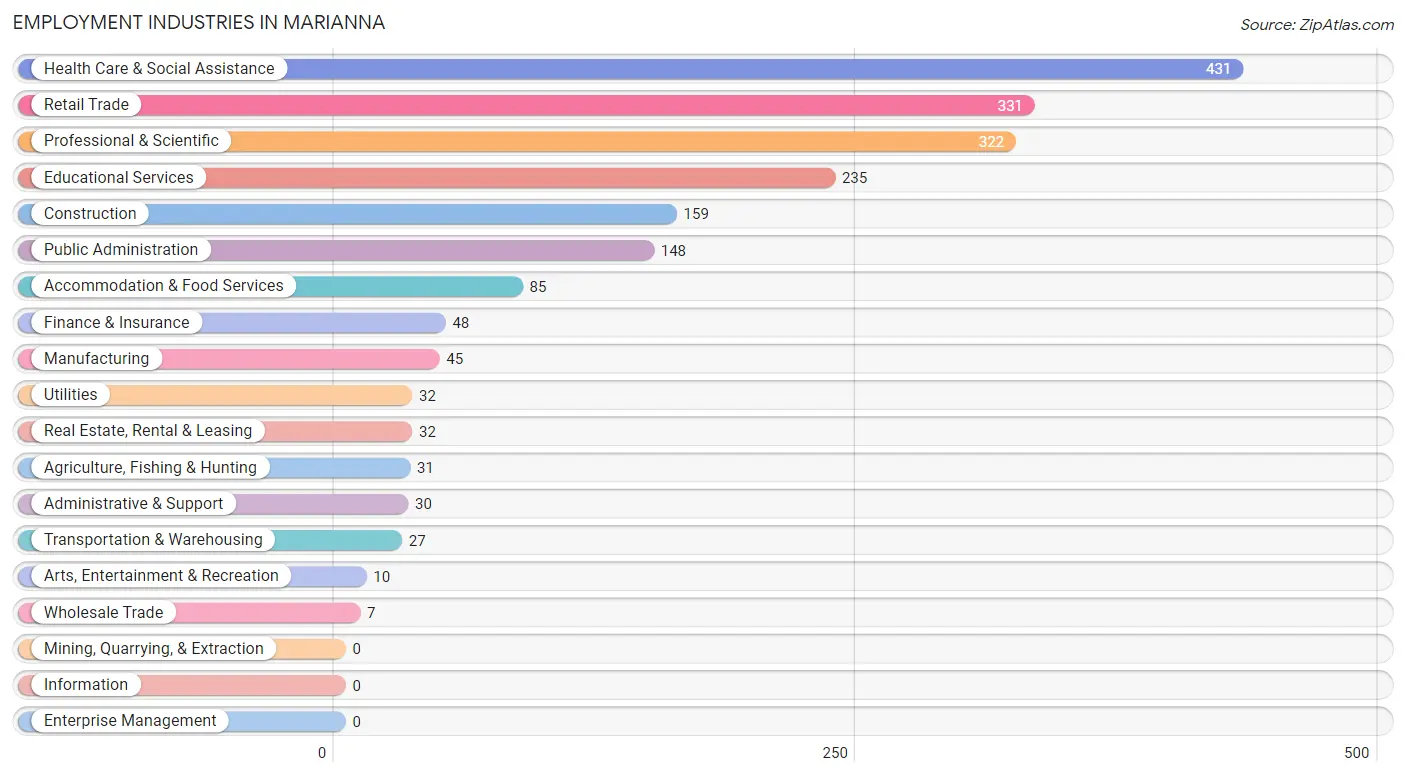
Employment Industries in Marianna
The major employment industries in Marianna include Health Care & Social Assistance (431 | 20.6%), Retail Trade (331 | 15.8%), Professional & Scientific (322 | 15.4%), Educational Services (235 | 11.2%), and Construction (159 | 7.6%).
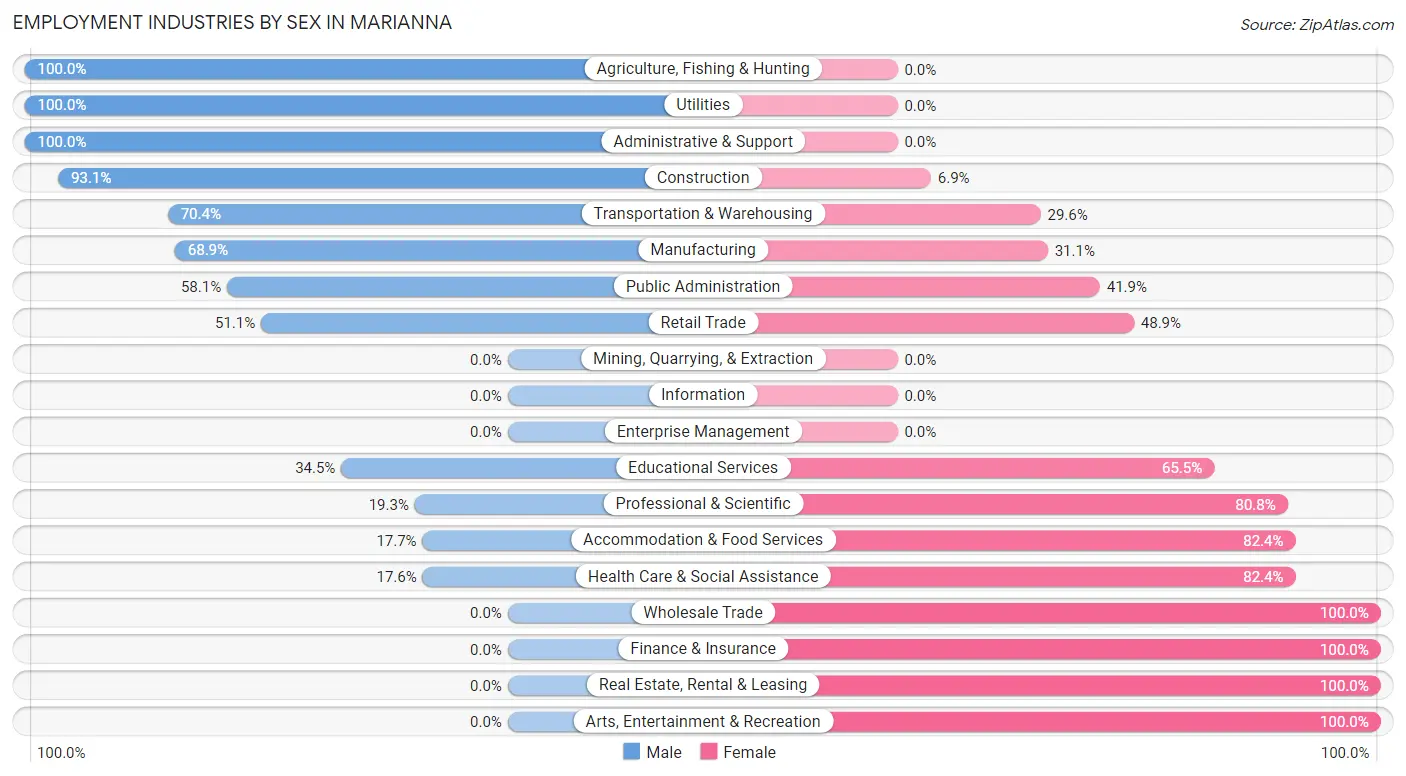
Employment Industries by Sex in Marianna
The Marianna industries that see more men than women are Agriculture, Fishing & Hunting (100.0%), Utilities (100.0%), and Administrative & Support (100.0%), whereas the industries that tend to have a higher number of women are Wholesale Trade (100.0%), Finance & Insurance (100.0%), and Real Estate, Rental & Leasing (100.0%).
| Industry | Male | Female |
| Agriculture, Fishing & Hunting | 31 (100.0%) | 0 (0.0%) |
| Mining, Quarrying, & Extraction | 0 (0.0%) | 0 (0.0%) |
| Construction | 148 (93.1%) | 11 (6.9%) |
| Manufacturing | 31 (68.9%) | 14 (31.1%) |
| Wholesale Trade | 0 (0.0%) | 7 (100.0%) |
| Retail Trade | 169 (51.1%) | 162 (48.9%) |
| Transportation & Warehousing | 19 (70.4%) | 8 (29.6%) |
| Utilities | 32 (100.0%) | 0 (0.0%) |
| Information | 0 (0.0%) | 0 (0.0%) |
| Finance & Insurance | 0 (0.0%) | 48 (100.0%) |
| Real Estate, Rental & Leasing | 0 (0.0%) | 32 (100.0%) |
| Professional & Scientific | 62 (19.3%) | 260 (80.7%) |
| Enterprise Management | 0 (0.0%) | 0 (0.0%) |
| Administrative & Support | 30 (100.0%) | 0 (0.0%) |
| Educational Services | 81 (34.5%) | 154 (65.5%) |
| Health Care & Social Assistance | 76 (17.6%) | 355 (82.4%) |
| Arts, Entertainment & Recreation | 0 (0.0%) | 10 (100.0%) |
| Accommodation & Food Services | 15 (17.6%) | 70 (82.4%) |
| Public Administration | 86 (58.1%) | 62 (41.9%) |
| Total | 780 (37.2%) | 1,315 (62.8%) |
Education in Marianna
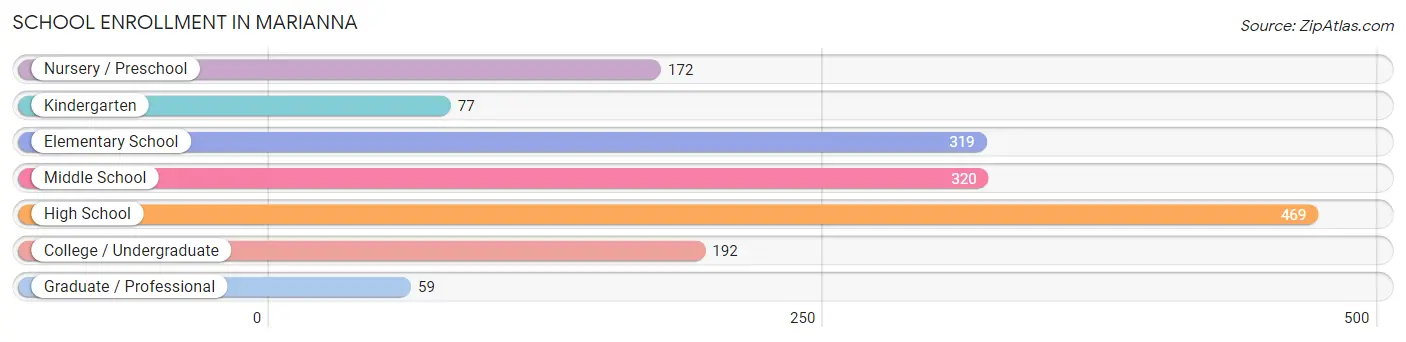
School Enrollment in Marianna
The most common levels of schooling among the 1,608 students in Marianna are high school (469 | 29.2%), middle school (320 | 19.9%), and elementary school (319 | 19.8%).
| School Level | # Students | % Students |
| Nursery / Preschool | 172 | 10.7% |
| Kindergarten | 77 | 4.8% |
| Elementary School | 319 | 19.8% |
| Middle School | 320 | 19.9% |
| High School | 469 | 29.2% |
| College / Undergraduate | 192 | 11.9% |
| Graduate / Professional | 59 | 3.7% |
| Total | 1,608 | 100.0% |
School Enrollment by Age by Funding Source in Marianna
Out of a total of 1,608 students who are enrolled in schools in Marianna, 241 (15.0%) attend a private institution, while the remaining 1,367 (85.0%) are enrolled in public schools. The age group of 35 years and over has the highest likelihood of being enrolled in private schools, with 33 (60.0% in the age bracket) enrolled. Conversely, the age group of 3 to 4 year olds has the lowest likelihood of being enrolled in a private school, with 215 (100.0% in the age bracket) attending a public institution.
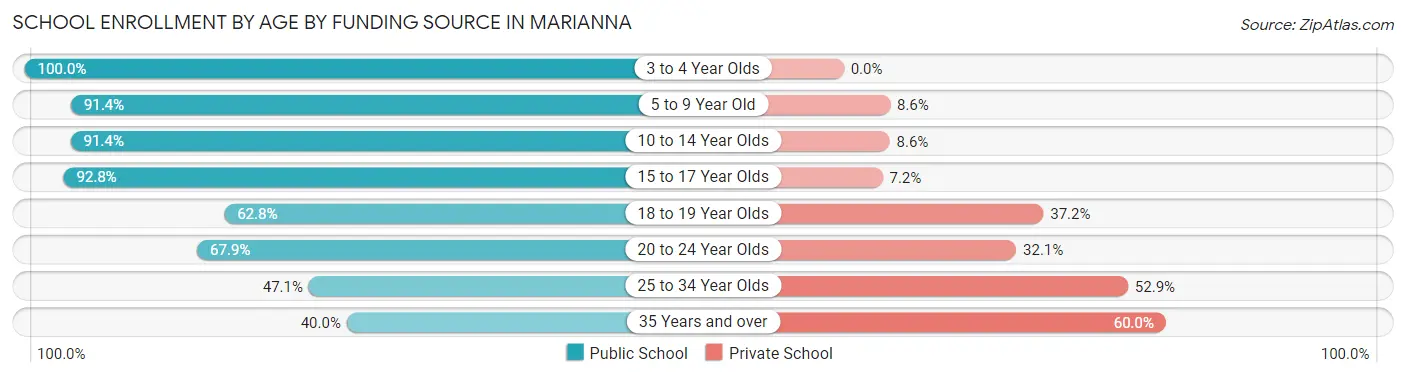
| Age Bracket | Public School | Private School |
| 3 to 4 Year Olds | 215 (100.0%) | 0 (0.0%) |
| 5 to 9 Year Old | 318 (91.4%) | 30 (8.6%) |
| 10 to 14 Year Olds | 395 (91.4%) | 37 (8.6%) |
| 15 to 17 Year Olds | 205 (92.8%) | 16 (7.2%) |
| 18 to 19 Year Olds | 76 (62.8%) | 45 (37.2%) |
| 20 to 24 Year Olds | 112 (67.9%) | 53 (32.1%) |
| 25 to 34 Year Olds | 24 (47.1%) | 27 (52.9%) |
| 35 Years and over | 22 (40.0%) | 33 (60.0%) |
| Total | 1,367 (85.0%) | 241 (15.0%) |
Educational Attainment by Field of Study in Marianna
Education (128 | 23.1%), business (114 | 20.6%), engineering (111 | 20.0%), science & technology (73 | 13.2%), and arts & humanities (30 | 5.4%) are the most common fields of study among 554 individuals in Marianna who have obtained a bachelor's degree or higher.
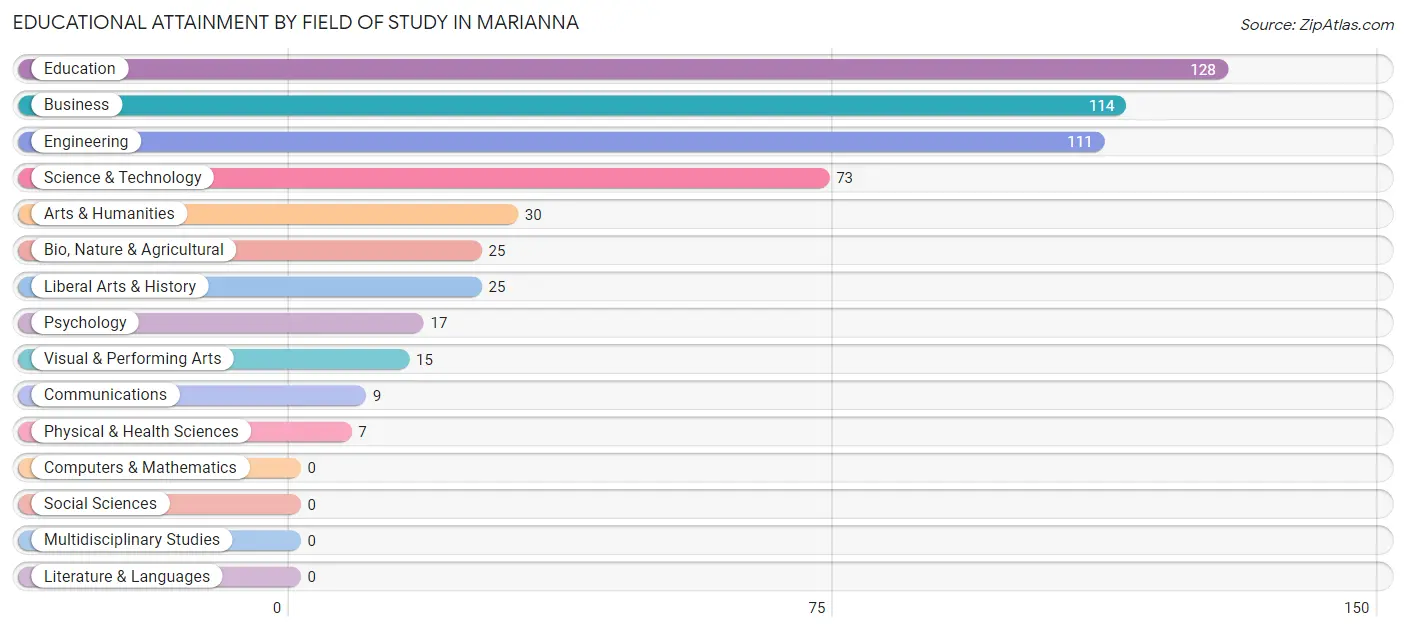
| Field of Study | # Graduates | % Graduates |
| Computers & Mathematics | 0 | 0.0% |
| Bio, Nature & Agricultural | 25 | 4.5% |
| Physical & Health Sciences | 7 | 1.3% |
| Psychology | 17 | 3.1% |
| Social Sciences | 0 | 0.0% |
| Engineering | 111 | 20.0% |
| Multidisciplinary Studies | 0 | 0.0% |
| Science & Technology | 73 | 13.2% |
| Business | 114 | 20.6% |
| Education | 128 | 23.1% |
| Literature & Languages | 0 | 0.0% |
| Liberal Arts & History | 25 | 4.5% |
| Visual & Performing Arts | 15 | 2.7% |
| Communications | 9 | 1.6% |
| Arts & Humanities | 30 | 5.4% |
| Total | 554 | 100.0% |
Transportation & Commute in Marianna
Vehicle Availability by Sex in Marianna
The most prevalent vehicle ownership categories in Marianna are males with 2 vehicles (279, accounting for 36.9%) and females with 2 vehicles (335, making up 21.9%).
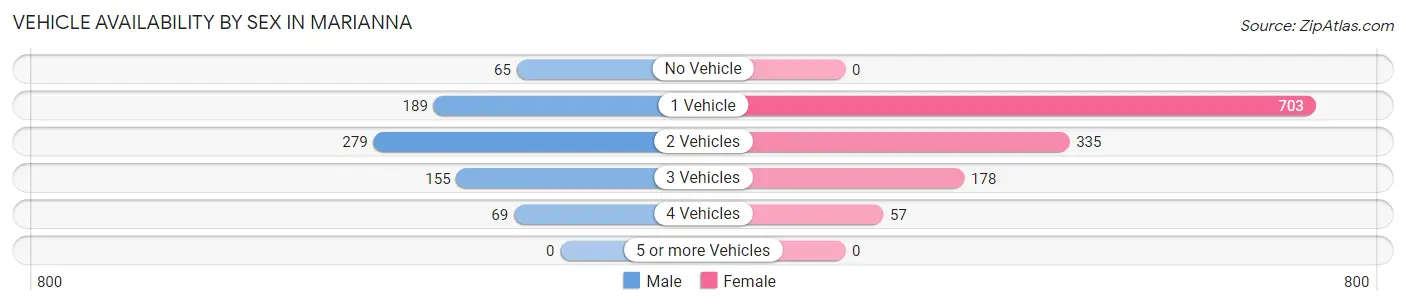
| Vehicles Available | Male | Female |
| No Vehicle | 65 (8.6%) | 0 (0.0%) |
| 1 Vehicle | 189 (25.0%) | 703 (55.2%) |
| 2 Vehicles | 279 (36.9%) | 335 (26.3%) |
| 3 Vehicles | 155 (20.5%) | 178 (14.0%) |
| 4 Vehicles | 69 (9.1%) | 57 (4.5%) |
| 5 or more Vehicles | 0 (0.0%) | 0 (0.0%) |
| Total | 757 (100.0%) | 1,273 (100.0%) |
Commute Time in Marianna
The most frequently occuring commute durations in Marianna are 30 to 34 minutes (614 commuters, 30.5%), 5 to 9 minutes (378 commuters, 18.8%), and 20 to 24 minutes (231 commuters, 11.5%).
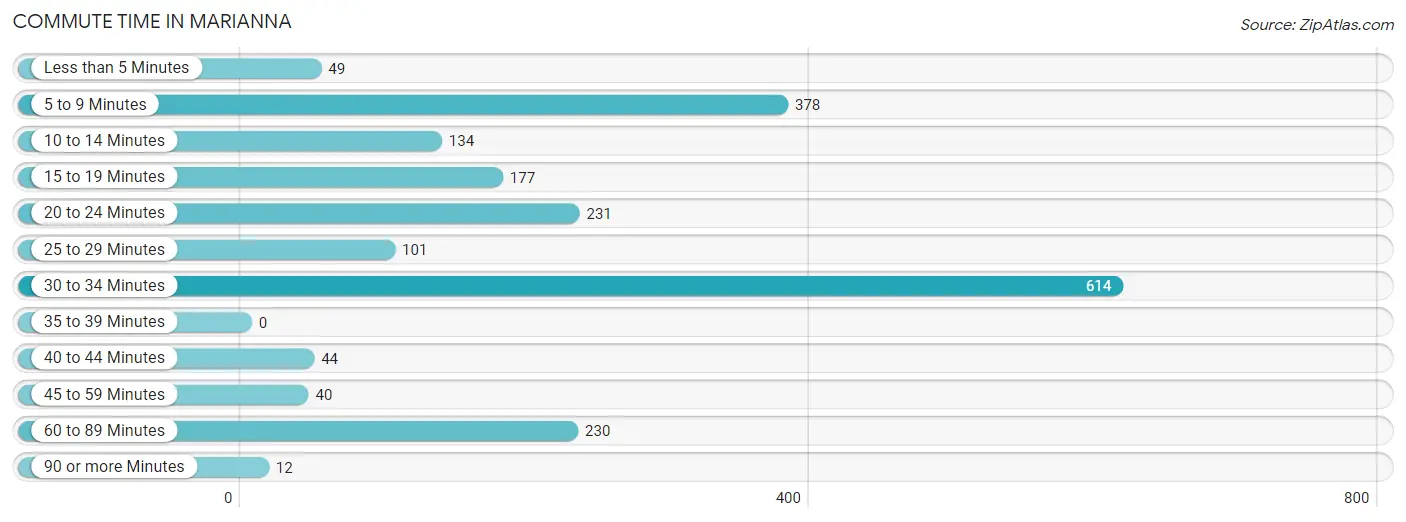
| Commute Time | # Commuters | % Commuters |
| Less than 5 Minutes | 49 | 2.4% |
| 5 to 9 Minutes | 378 | 18.8% |
| 10 to 14 Minutes | 134 | 6.7% |
| 15 to 19 Minutes | 177 | 8.8% |
| 20 to 24 Minutes | 231 | 11.5% |
| 25 to 29 Minutes | 101 | 5.0% |
| 30 to 34 Minutes | 614 | 30.5% |
| 35 to 39 Minutes | 0 | 0.0% |
| 40 to 44 Minutes | 44 | 2.2% |
| 45 to 59 Minutes | 40 | 2.0% |
| 60 to 89 Minutes | 230 | 11.4% |
| 90 or more Minutes | 12 | 0.6% |
Commute Time by Sex in Marianna
The most common commute times in Marianna are 30 to 34 minutes (221 commuters, 29.2%) for males and 30 to 34 minutes (393 commuters, 31.4%) for females.
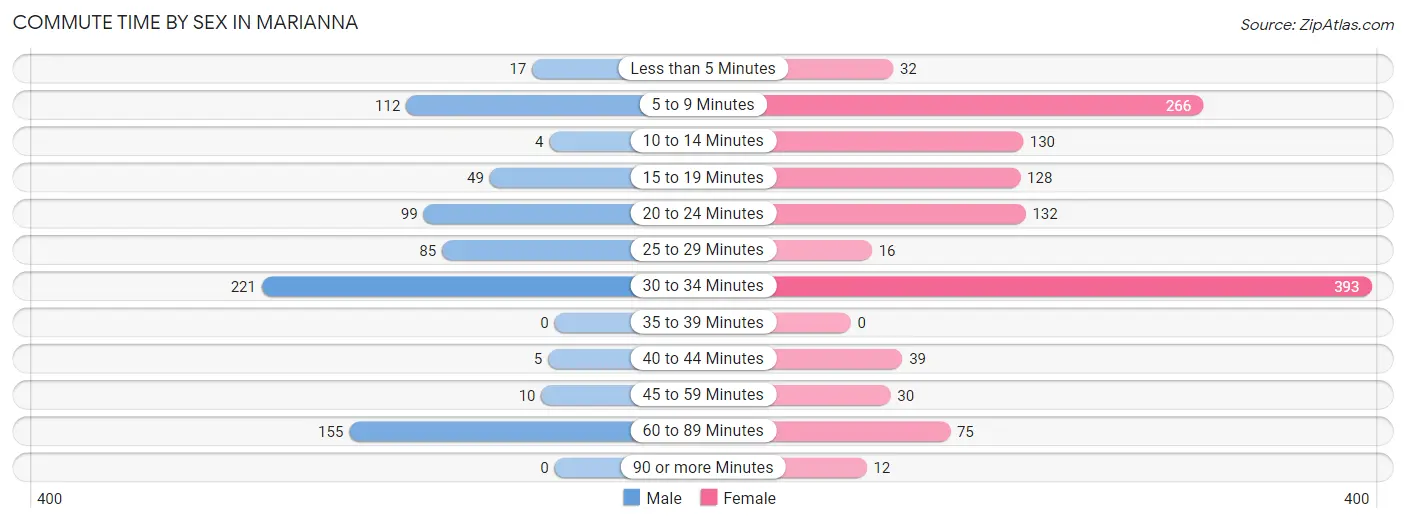
| Commute Time | Male | Female |
| Less than 5 Minutes | 17 (2.2%) | 32 (2.5%) |
| 5 to 9 Minutes | 112 (14.8%) | 266 (21.2%) |
| 10 to 14 Minutes | 4 (0.5%) | 130 (10.4%) |
| 15 to 19 Minutes | 49 (6.5%) | 128 (10.2%) |
| 20 to 24 Minutes | 99 (13.1%) | 132 (10.5%) |
| 25 to 29 Minutes | 85 (11.2%) | 16 (1.3%) |
| 30 to 34 Minutes | 221 (29.2%) | 393 (31.4%) |
| 35 to 39 Minutes | 0 (0.0%) | 0 (0.0%) |
| 40 to 44 Minutes | 5 (0.7%) | 39 (3.1%) |
| 45 to 59 Minutes | 10 (1.3%) | 30 (2.4%) |
| 60 to 89 Minutes | 155 (20.5%) | 75 (6.0%) |
| 90 or more Minutes | 0 (0.0%) | 12 (1.0%) |
Time of Departure to Work by Sex in Marianna
The most frequent times of departure to work in Marianna are 6:00 AM to 6:29 AM (229, 30.2%) for males and 7:00 AM to 7:29 AM (389, 31.0%) for females.
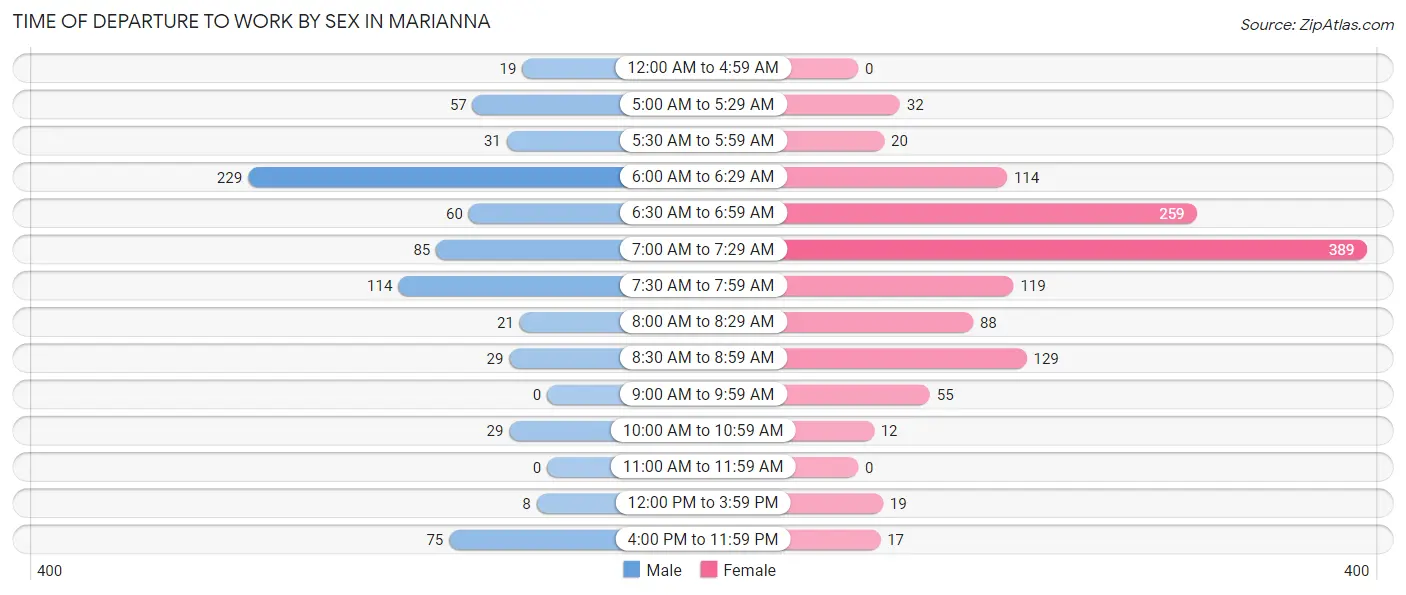
| Time of Departure | Male | Female |
| 12:00 AM to 4:59 AM | 19 (2.5%) | 0 (0.0%) |
| 5:00 AM to 5:29 AM | 57 (7.5%) | 32 (2.5%) |
| 5:30 AM to 5:59 AM | 31 (4.1%) | 20 (1.6%) |
| 6:00 AM to 6:29 AM | 229 (30.2%) | 114 (9.1%) |
| 6:30 AM to 6:59 AM | 60 (7.9%) | 259 (20.7%) |
| 7:00 AM to 7:29 AM | 85 (11.2%) | 389 (31.0%) |
| 7:30 AM to 7:59 AM | 114 (15.1%) | 119 (9.5%) |
| 8:00 AM to 8:29 AM | 21 (2.8%) | 88 (7.0%) |
| 8:30 AM to 8:59 AM | 29 (3.8%) | 129 (10.3%) |
| 9:00 AM to 9:59 AM | 0 (0.0%) | 55 (4.4%) |
| 10:00 AM to 10:59 AM | 29 (3.8%) | 12 (1.0%) |
| 11:00 AM to 11:59 AM | 0 (0.0%) | 0 (0.0%) |
| 12:00 PM to 3:59 PM | 8 (1.1%) | 19 (1.5%) |
| 4:00 PM to 11:59 PM | 75 (9.9%) | 17 (1.4%) |
| Total | 757 (100.0%) | 1,253 (100.0%) |
Housing Occupancy in Marianna
Occupancy by Ownership in Marianna
Of the total 2,656 dwellings in Marianna, owner-occupied units account for 1,503 (56.6%), while renter-occupied units make up 1,153 (43.4%).
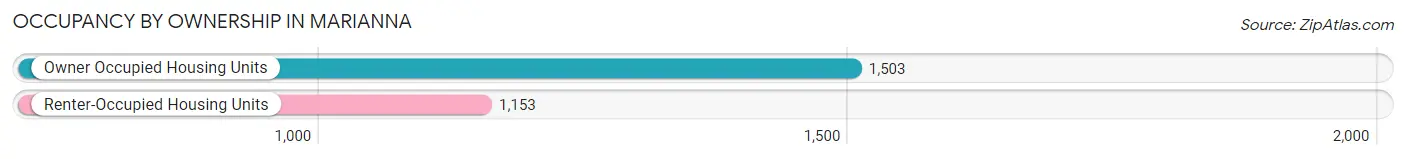
| Occupancy | # Housing Units | % Housing Units |
| Owner Occupied Housing Units | 1,503 | 56.6% |
| Renter-Occupied Housing Units | 1,153 | 43.4% |
| Total Occupied Housing Units | 2,656 | 100.0% |
Occupancy by Household Size in Marianna
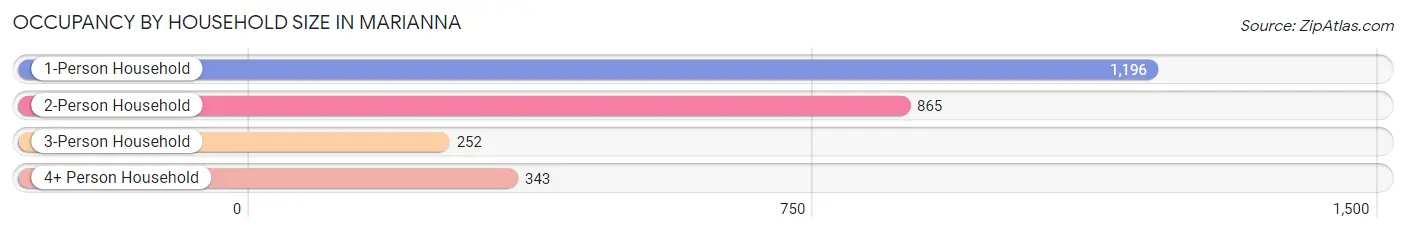
| Household Size | # Housing Units | % Housing Units |
| 1-Person Household | 1,196 | 45.0% |
| 2-Person Household | 865 | 32.6% |
| 3-Person Household | 252 | 9.5% |
| 4+ Person Household | 343 | 12.9% |
| Total Housing Units | 2,656 | 100.0% |
Occupancy by Ownership by Household Size in Marianna
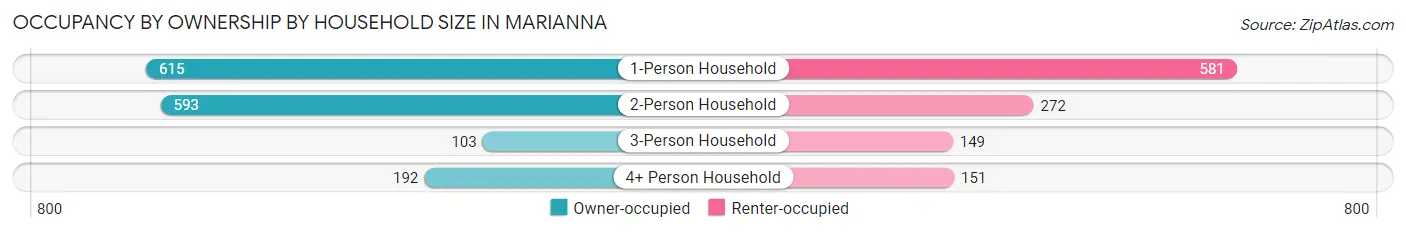
| Household Size | Owner-occupied | Renter-occupied |
| 1-Person Household | 615 (51.4%) | 581 (48.6%) |
| 2-Person Household | 593 (68.5%) | 272 (31.5%) |
| 3-Person Household | 103 (40.9%) | 149 (59.1%) |
| 4+ Person Household | 192 (56.0%) | 151 (44.0%) |
| Total Housing Units | 1,503 (56.6%) | 1,153 (43.4%) |
Occupancy by Educational Attainment in Marianna
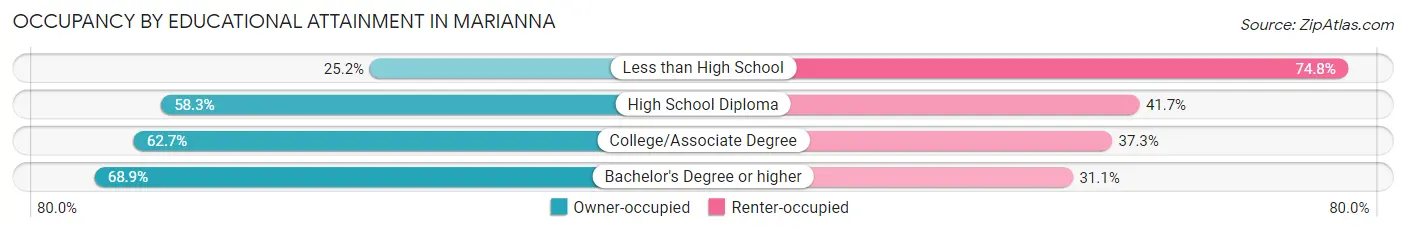
| Household Size | Owner-occupied | Renter-occupied |
| Less than High School | 82 (25.2%) | 243 (74.8%) |
| High School Diploma | 722 (58.3%) | 516 (41.7%) |
| College/Associate Degree | 542 (62.7%) | 323 (37.3%) |
| Bachelor's Degree or higher | 157 (68.9%) | 71 (31.1%) |
Occupancy by Age of Householder in Marianna
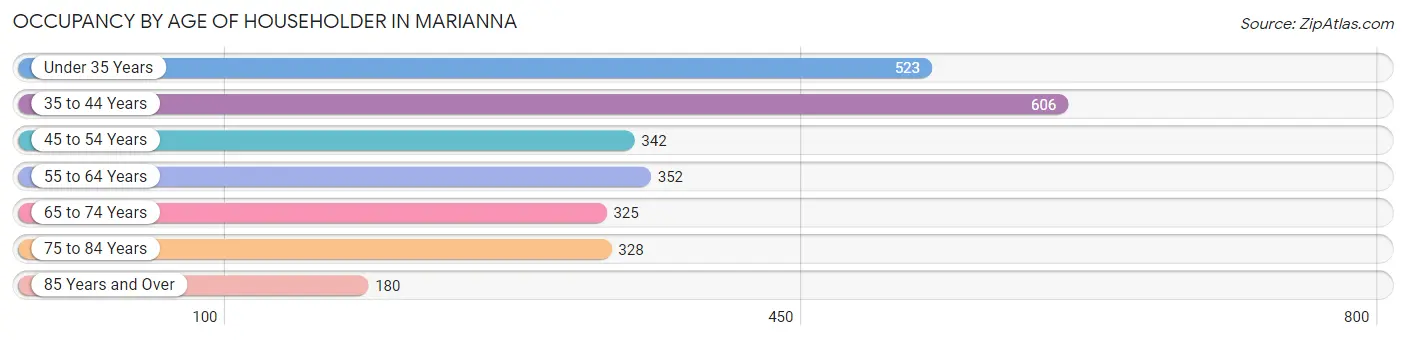
| Age Bracket | # Households | % Households |
| Under 35 Years | 523 | 19.7% |
| 35 to 44 Years | 606 | 22.8% |
| 45 to 54 Years | 342 | 12.9% |
| 55 to 64 Years | 352 | 13.3% |
| 65 to 74 Years | 325 | 12.2% |
| 75 to 84 Years | 328 | 12.3% |
| 85 Years and Over | 180 | 6.8% |
| Total | 2,656 | 100.0% |
Housing Finances in Marianna
Median Income by Occupancy in Marianna

| Occupancy Type | # Households | Median Income |
| Owner-Occupied | 1,503 (56.6%) | $48,046 |
| Renter-Occupied | 1,153 (43.4%) | $16,743 |
| Average | 2,656 (100.0%) | $27,296 |
Occupancy by Householder Income Bracket in Marianna
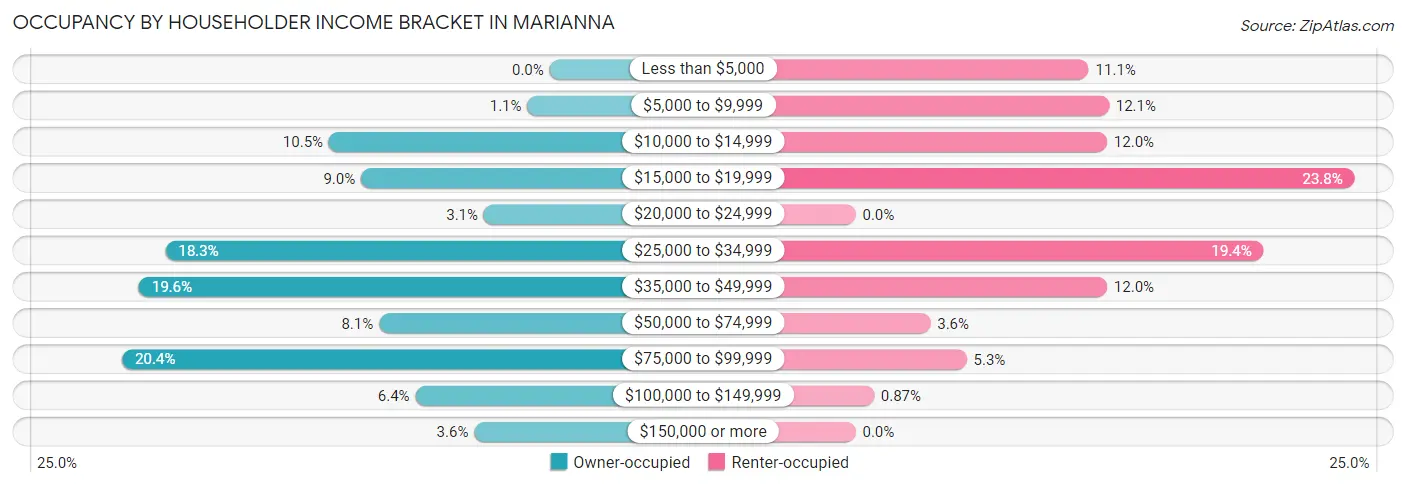
| Income Bracket | Owner-occupied | Renter-occupied |
| Less than $5,000 | 0 (0.0%) | 128 (11.1%) |
| $5,000 to $9,999 | 16 (1.1%) | 139 (12.1%) |
| $10,000 to $14,999 | 158 (10.5%) | 138 (12.0%) |
| $15,000 to $19,999 | 135 (9.0%) | 274 (23.8%) |
| $20,000 to $24,999 | 47 (3.1%) | 0 (0.0%) |
| $25,000 to $34,999 | 275 (18.3%) | 224 (19.4%) |
| $35,000 to $49,999 | 294 (19.6%) | 138 (12.0%) |
| $50,000 to $74,999 | 122 (8.1%) | 41 (3.6%) |
| $75,000 to $99,999 | 306 (20.4%) | 61 (5.3%) |
| $100,000 to $149,999 | 96 (6.4%) | 10 (0.9%) |
| $150,000 or more | 54 (3.6%) | 0 (0.0%) |
| Total | 1,503 (100.0%) | 1,153 (100.0%) |
Monthly Housing Cost Tiers in Marianna
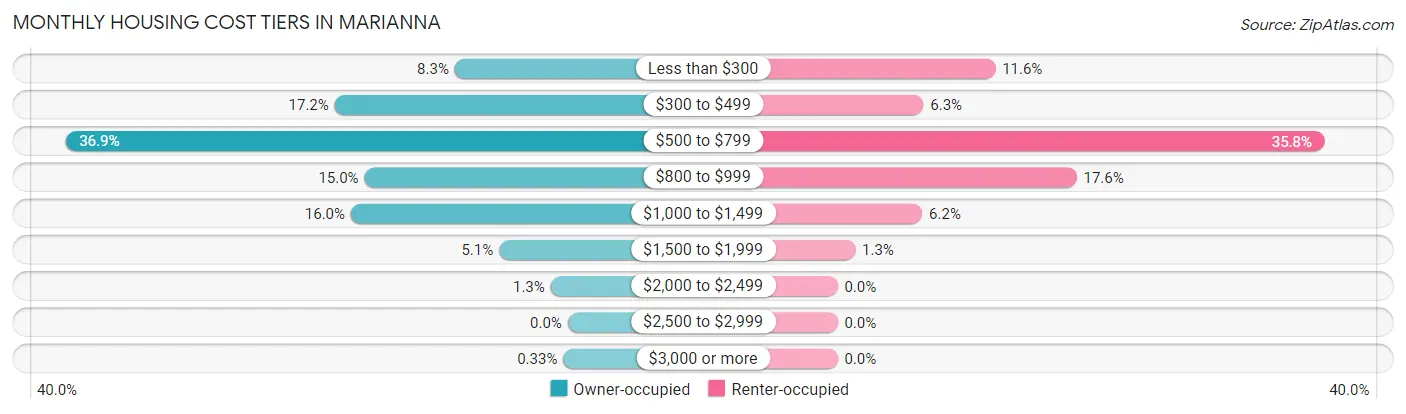
| Monthly Cost | Owner-occupied | Renter-occupied |
| Less than $300 | 125 (8.3%) | 134 (11.6%) |
| $300 to $499 | 258 (17.2%) | 73 (6.3%) |
| $500 to $799 | 555 (36.9%) | 413 (35.8%) |
| $800 to $999 | 225 (15.0%) | 203 (17.6%) |
| $1,000 to $1,499 | 240 (16.0%) | 72 (6.2%) |
| $1,500 to $1,999 | 76 (5.1%) | 15 (1.3%) |
| $2,000 to $2,499 | 19 (1.3%) | 0 (0.0%) |
| $2,500 to $2,999 | 0 (0.0%) | 0 (0.0%) |
| $3,000 or more | 5 (0.3%) | 0 (0.0%) |
| Total | 1,503 (100.0%) | 1,153 (100.0%) |
Physical Housing Characteristics in Marianna
Housing Structures in Marianna
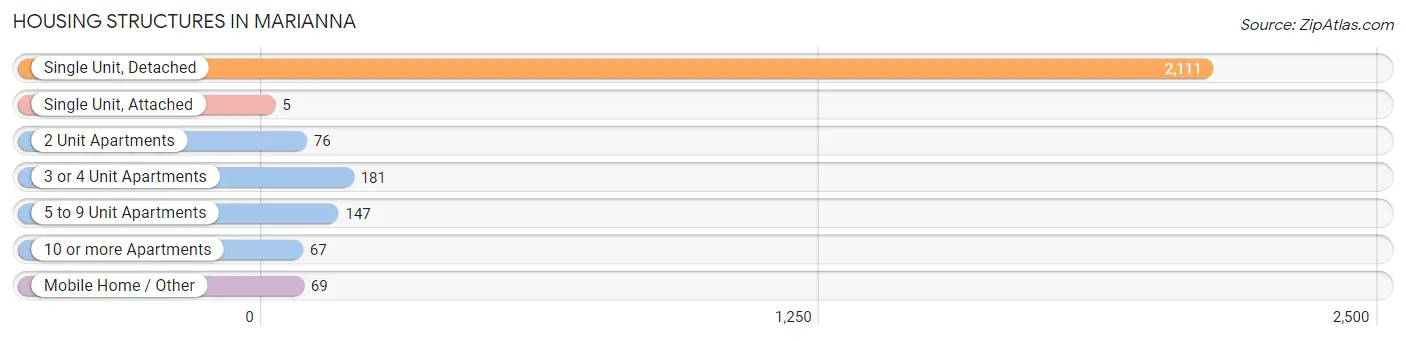
| Structure Type | # Housing Units | % Housing Units |
| Single Unit, Detached | 2,111 | 79.5% |
| Single Unit, Attached | 5 | 0.2% |
| 2 Unit Apartments | 76 | 2.9% |
| 3 or 4 Unit Apartments | 181 | 6.8% |
| 5 to 9 Unit Apartments | 147 | 5.5% |
| 10 or more Apartments | 67 | 2.5% |
| Mobile Home / Other | 69 | 2.6% |
| Total | 2,656 | 100.0% |
Housing Structures by Occupancy in Marianna
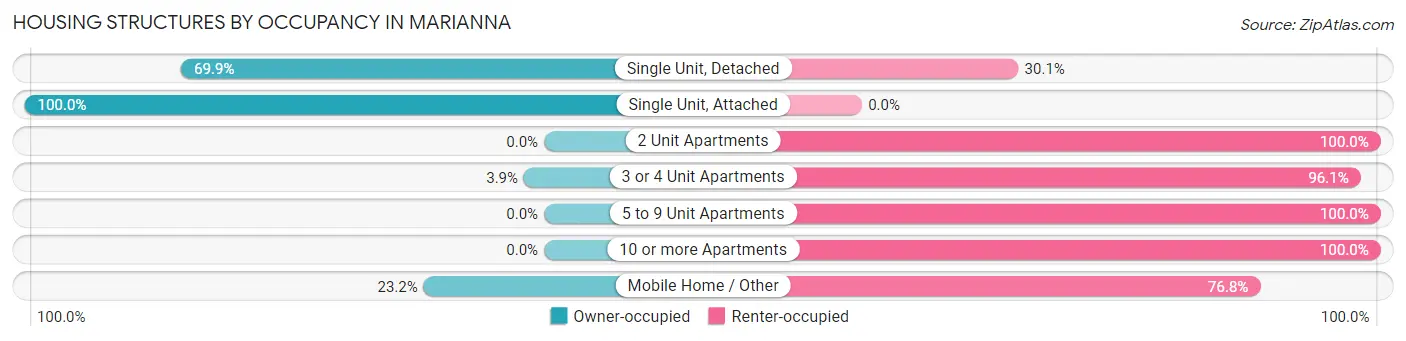
| Structure Type | Owner-occupied | Renter-occupied |
| Single Unit, Detached | 1,475 (69.9%) | 636 (30.1%) |
| Single Unit, Attached | 5 (100.0%) | 0 (0.0%) |
| 2 Unit Apartments | 0 (0.0%) | 76 (100.0%) |
| 3 or 4 Unit Apartments | 7 (3.9%) | 174 (96.1%) |
| 5 to 9 Unit Apartments | 0 (0.0%) | 147 (100.0%) |
| 10 or more Apartments | 0 (0.0%) | 67 (100.0%) |
| Mobile Home / Other | 16 (23.2%) | 53 (76.8%) |
| Total | 1,503 (56.6%) | 1,153 (43.4%) |
Housing Structures by Number of Rooms in Marianna
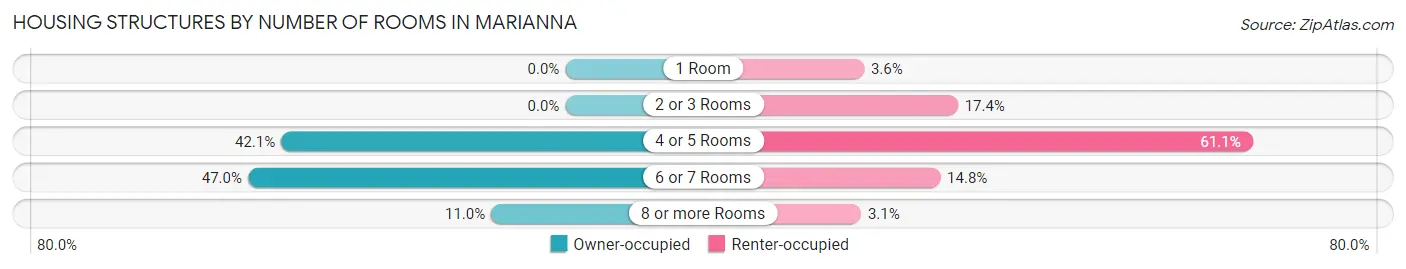
| Number of Rooms | Owner-occupied | Renter-occupied |
| 1 Room | 0 (0.0%) | 41 (3.6%) |
| 2 or 3 Rooms | 0 (0.0%) | 201 (17.4%) |
| 4 or 5 Rooms | 632 (42.0%) | 704 (61.1%) |
| 6 or 7 Rooms | 706 (47.0%) | 171 (14.8%) |
| 8 or more Rooms | 165 (11.0%) | 36 (3.1%) |
| Total | 1,503 (100.0%) | 1,153 (100.0%) |
Housing Structure by Heating Type in Marianna
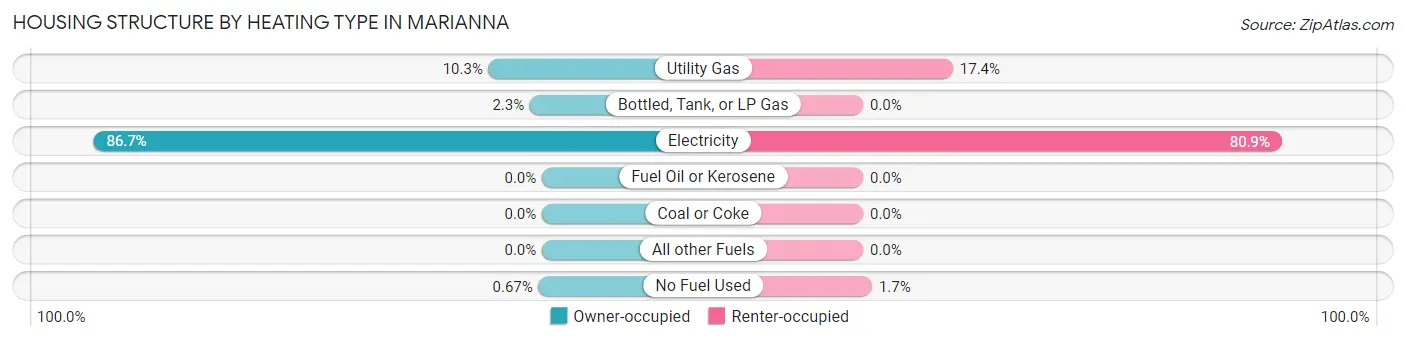
| Heating Type | Owner-occupied | Renter-occupied |
| Utility Gas | 155 (10.3%) | 200 (17.3%) |
| Bottled, Tank, or LP Gas | 35 (2.3%) | 0 (0.0%) |
| Electricity | 1,303 (86.7%) | 933 (80.9%) |
| Fuel Oil or Kerosene | 0 (0.0%) | 0 (0.0%) |
| Coal or Coke | 0 (0.0%) | 0 (0.0%) |
| All other Fuels | 0 (0.0%) | 0 (0.0%) |
| No Fuel Used | 10 (0.7%) | 20 (1.7%) |
| Total | 1,503 (100.0%) | 1,153 (100.0%) |
Household Vehicle Usage in Marianna
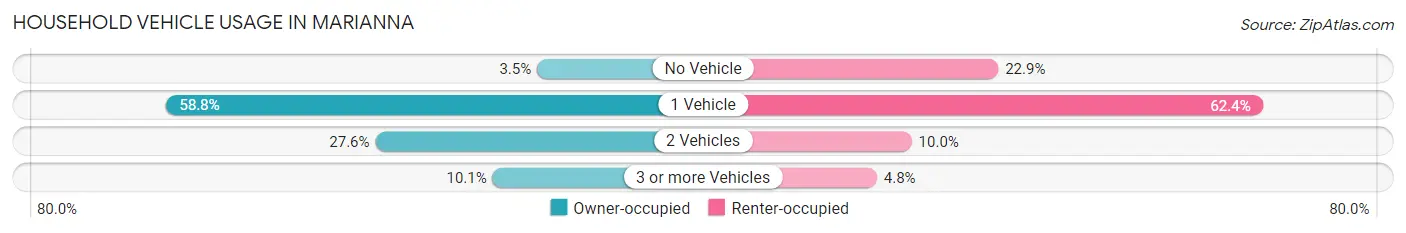
| Vehicles per Household | Owner-occupied | Renter-occupied |
| No Vehicle | 52 (3.5%) | 264 (22.9%) |
| 1 Vehicle | 884 (58.8%) | 719 (62.4%) |
| 2 Vehicles | 415 (27.6%) | 115 (10.0%) |
| 3 or more Vehicles | 152 (10.1%) | 55 (4.8%) |
| Total | 1,503 (100.0%) | 1,153 (100.0%) |
Real Estate & Mortgages in Marianna
Real Estate and Mortgage Overview in Marianna
| Characteristic | Without Mortgage | With Mortgage |
| Housing Units | 435 | 1,068 |
| Median Property Value | $94,400 | $98,100 |
| Median Household Income | $29,779 | $54 |
| Monthly Housing Costs | $433 | $5 |
| Real Estate Taxes | $616 | $57 |
Property Value by Mortgage Status in Marianna
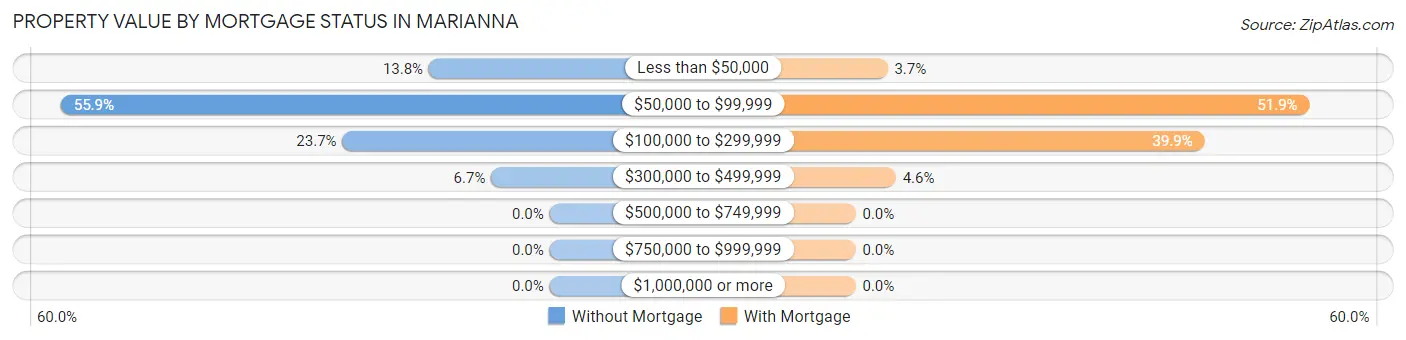
| Property Value | Without Mortgage | With Mortgage |
| Less than $50,000 | 60 (13.8%) | 39 (3.6%) |
| $50,000 to $99,999 | 243 (55.9%) | 554 (51.9%) |
| $100,000 to $299,999 | 103 (23.7%) | 426 (39.9%) |
| $300,000 to $499,999 | 29 (6.7%) | 49 (4.6%) |
| $500,000 to $749,999 | 0 (0.0%) | 0 (0.0%) |
| $750,000 to $999,999 | 0 (0.0%) | 0 (0.0%) |
| $1,000,000 or more | 0 (0.0%) | 0 (0.0%) |
| Total | 435 (100.0%) | 1,068 (100.0%) |
Household Income by Mortgage Status in Marianna
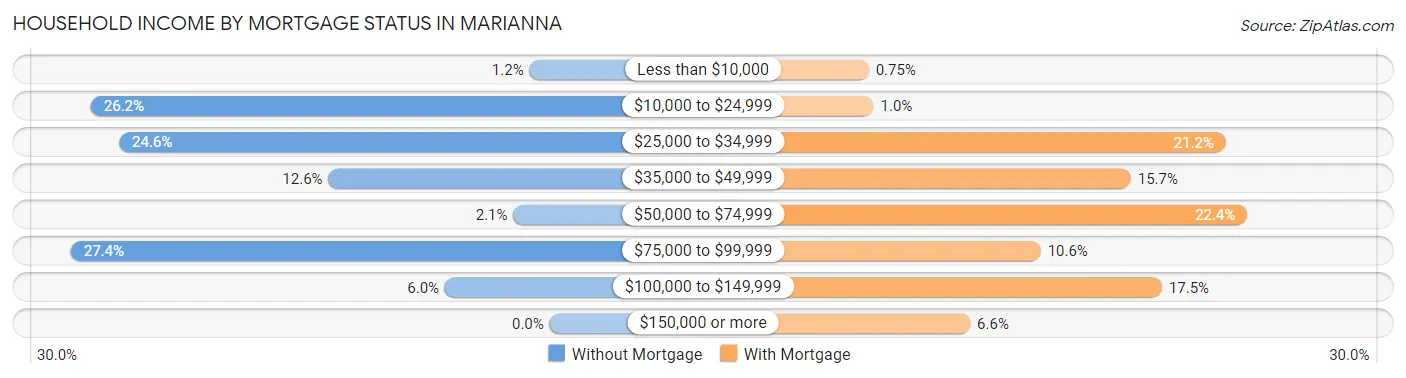
| Household Income | Without Mortgage | With Mortgage |
| Less than $10,000 | 5 (1.1%) | 8 (0.7%) |
| $10,000 to $24,999 | 114 (26.2%) | 11 (1.0%) |
| $25,000 to $34,999 | 107 (24.6%) | 226 (21.2%) |
| $35,000 to $49,999 | 55 (12.6%) | 168 (15.7%) |
| $50,000 to $74,999 | 9 (2.1%) | 239 (22.4%) |
| $75,000 to $99,999 | 119 (27.4%) | 113 (10.6%) |
| $100,000 to $149,999 | 26 (6.0%) | 187 (17.5%) |
| $150,000 or more | 0 (0.0%) | 70 (6.6%) |
| Total | 435 (100.0%) | 1,068 (100.0%) |
Property Value to Household Income Ratio in Marianna
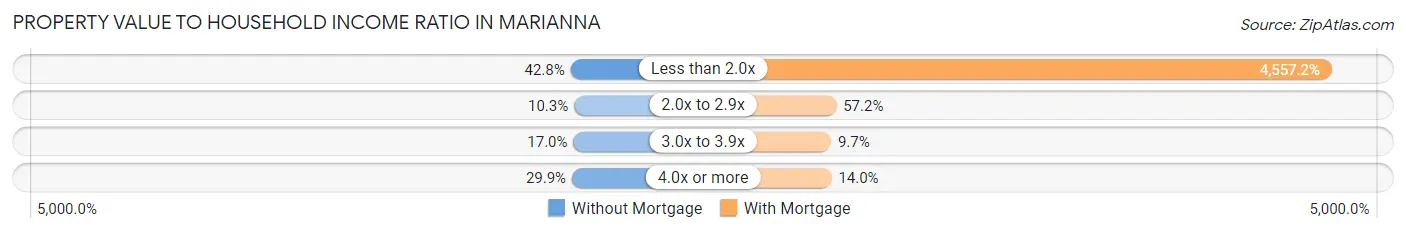
| Value-to-Income Ratio | Without Mortgage | With Mortgage |
| Less than 2.0x | 186 (42.8%) | 48,671 (4,557.2%) |
| 2.0x to 2.9x | 45 (10.3%) | 611 (57.2%) |
| 3.0x to 3.9x | 74 (17.0%) | 104 (9.7%) |
| 4.0x or more | 130 (29.9%) | 149 (14.0%) |
| Total | 435 (100.0%) | 1,068 (100.0%) |
Real Estate Taxes by Mortgage Status in Marianna
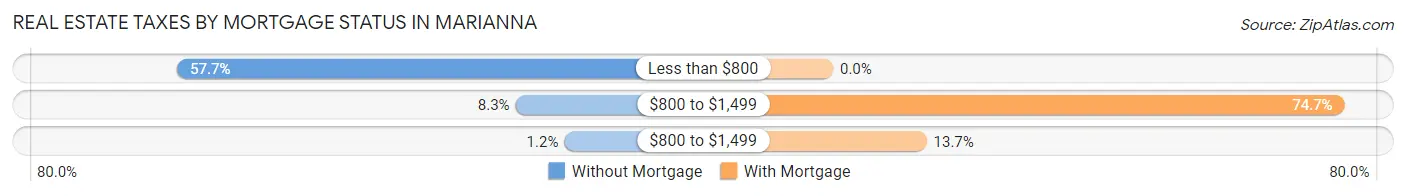
| Property Taxes | Without Mortgage | With Mortgage |
| Less than $800 | 251 (57.7%) | 0 (0.0%) |
| $800 to $1,499 | 36 (8.3%) | 798 (74.7%) |
| $800 to $1,499 | 5 (1.1%) | 146 (13.7%) |
| Total | 435 (100.0%) | 1,068 (100.0%) |
Health & Disability in Marianna
Health Insurance Coverage by Age in Marianna
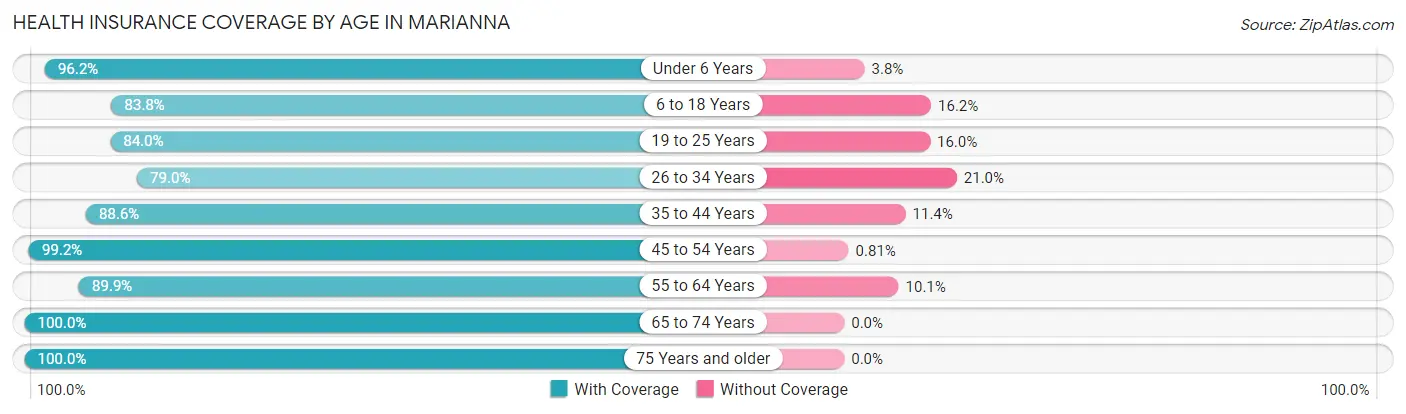
| Age Bracket | With Coverage | Without Coverage |
| Under 6 Years | 737 (96.2%) | 29 (3.8%) |
| 6 to 18 Years | 901 (83.8%) | 174 (16.2%) |
| 19 to 25 Years | 494 (84.0%) | 94 (16.0%) |
| 26 to 34 Years | 335 (79.0%) | 89 (21.0%) |
| 35 to 44 Years | 658 (88.6%) | 85 (11.4%) |
| 45 to 54 Years | 492 (99.2%) | 4 (0.8%) |
| 55 to 64 Years | 470 (89.9%) | 53 (10.1%) |
| 65 to 74 Years | 451 (100.0%) | 0 (0.0%) |
| 75 Years and older | 542 (100.0%) | 0 (0.0%) |
| Total | 5,080 (90.6%) | 528 (9.4%) |
Health Insurance Coverage by Citizenship Status in Marianna
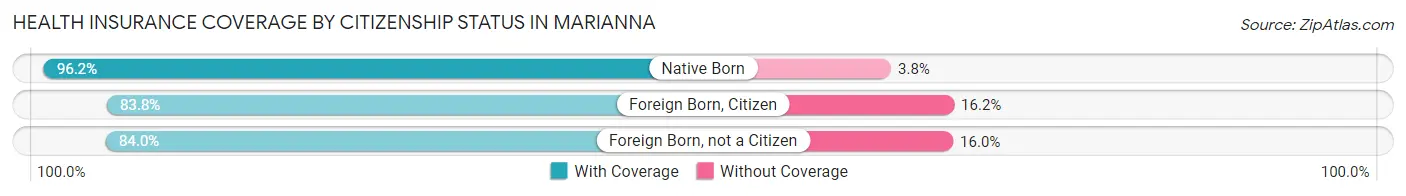
| Citizenship Status | With Coverage | Without Coverage |
| Native Born | 737 (96.2%) | 29 (3.8%) |
| Foreign Born, Citizen | 901 (83.8%) | 174 (16.2%) |
| Foreign Born, not a Citizen | 494 (84.0%) | 94 (16.0%) |
Health Insurance Coverage by Household Income in Marianna
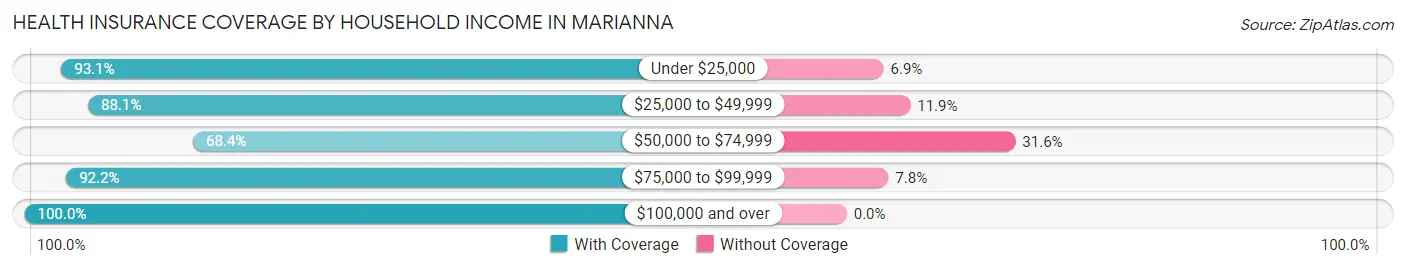
| Household Income | With Coverage | Without Coverage |
| Under $25,000 | 1,568 (93.1%) | 116 (6.9%) |
| $25,000 to $49,999 | 1,615 (88.1%) | 218 (11.9%) |
| $50,000 to $74,999 | 275 (68.4%) | 127 (31.6%) |
| $75,000 to $99,999 | 792 (92.2%) | 67 (7.8%) |
| $100,000 and over | 687 (100.0%) | 0 (0.0%) |
Public vs Private Health Insurance Coverage by Age in Marianna
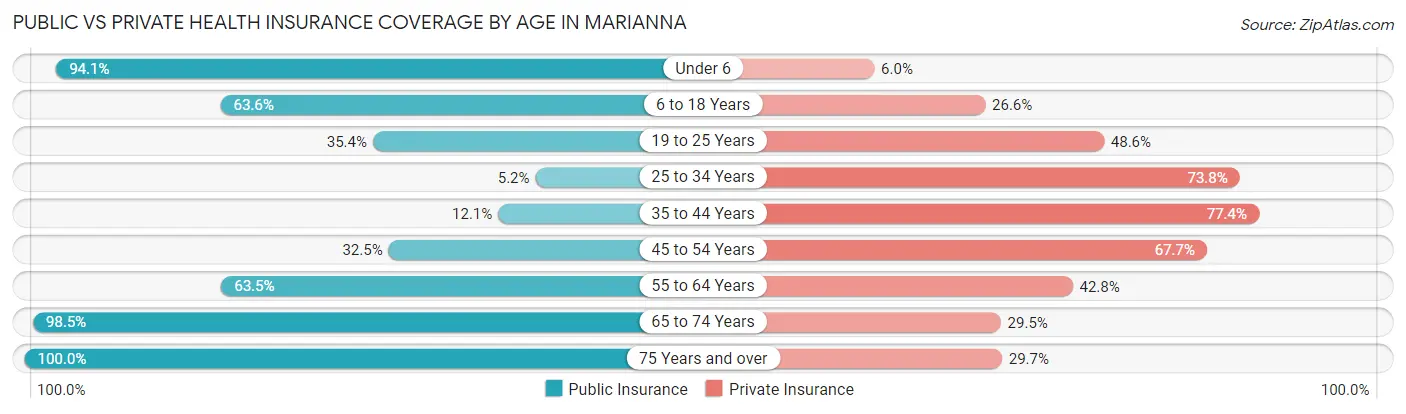
| Age Bracket | Public Insurance | Private Insurance |
| Under 6 | 721 (94.1%) | 46 (6.0%) |
| 6 to 18 Years | 684 (63.6%) | 286 (26.6%) |
| 19 to 25 Years | 208 (35.4%) | 286 (48.6%) |
| 25 to 34 Years | 22 (5.2%) | 313 (73.8%) |
| 35 to 44 Years | 90 (12.1%) | 575 (77.4%) |
| 45 to 54 Years | 161 (32.5%) | 336 (67.7%) |
| 55 to 64 Years | 332 (63.5%) | 224 (42.8%) |
| 65 to 74 Years | 444 (98.5%) | 133 (29.5%) |
| 75 Years and over | 542 (100.0%) | 161 (29.7%) |
| Total | 3,204 (57.1%) | 2,360 (42.1%) |
Disability Status by Sex by Age in Marianna
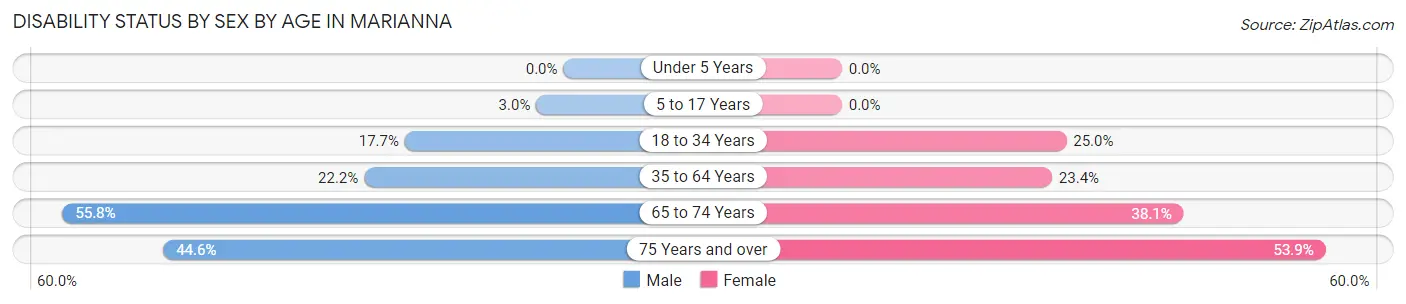
| Age Bracket | Male | Female |
| Under 5 Years | 0 (0.0%) | 0 (0.0%) |
| 5 to 17 Years | 17 (3.0%) | 0 (0.0%) |
| 18 to 34 Years | 65 (17.7%) | 188 (25.0%) |
| 35 to 64 Years | 152 (22.2%) | 252 (23.4%) |
| 65 to 74 Years | 130 (55.8%) | 83 (38.1%) |
| 75 Years and over | 86 (44.6%) | 188 (53.9%) |
Disability Class by Sex by Age in Marianna
Disability Class: Hearing Difficulty
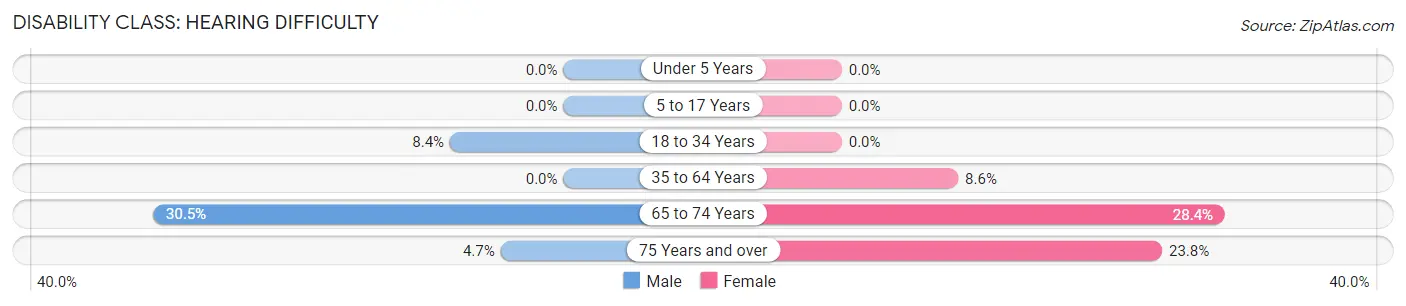
| Age Bracket | Male | Female |
| Under 5 Years | 0 (0.0%) | 0 (0.0%) |
| 5 to 17 Years | 0 (0.0%) | 0 (0.0%) |
| 18 to 34 Years | 31 (8.4%) | 0 (0.0%) |
| 35 to 64 Years | 0 (0.0%) | 93 (8.6%) |
| 65 to 74 Years | 71 (30.5%) | 62 (28.4%) |
| 75 Years and over | 9 (4.7%) | 83 (23.8%) |
Disability Class: Vision Difficulty
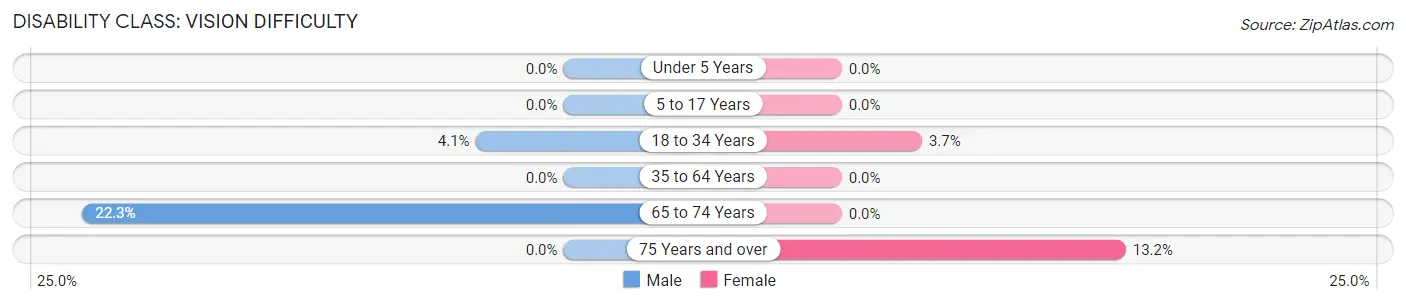
| Age Bracket | Male | Female |
| Under 5 Years | 0 (0.0%) | 0 (0.0%) |
| 5 to 17 Years | 0 (0.0%) | 0 (0.0%) |
| 18 to 34 Years | 15 (4.1%) | 28 (3.7%) |
| 35 to 64 Years | 0 (0.0%) | 0 (0.0%) |
| 65 to 74 Years | 52 (22.3%) | 0 (0.0%) |
| 75 Years and over | 0 (0.0%) | 46 (13.2%) |
Disability Class: Cognitive Difficulty
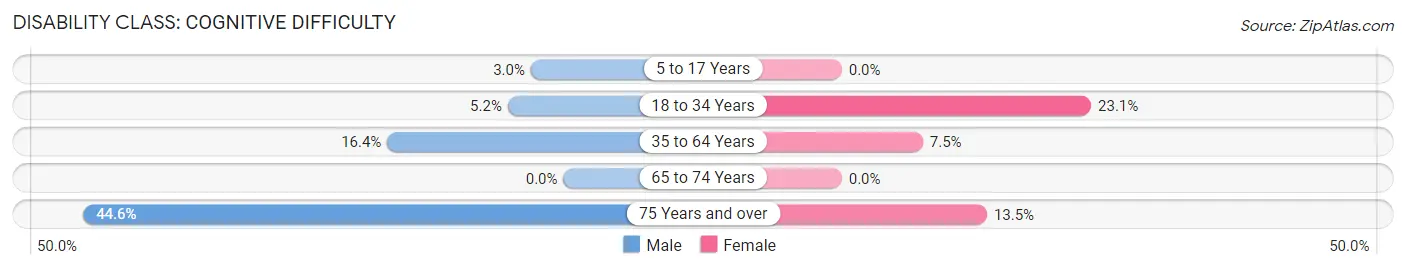
| Age Bracket | Male | Female |
| 5 to 17 Years | 17 (3.0%) | 0 (0.0%) |
| 18 to 34 Years | 19 (5.2%) | 174 (23.1%) |
| 35 to 64 Years | 112 (16.4%) | 81 (7.5%) |
| 65 to 74 Years | 0 (0.0%) | 0 (0.0%) |
| 75 Years and over | 86 (44.6%) | 47 (13.5%) |
Disability Class: Ambulatory Difficulty
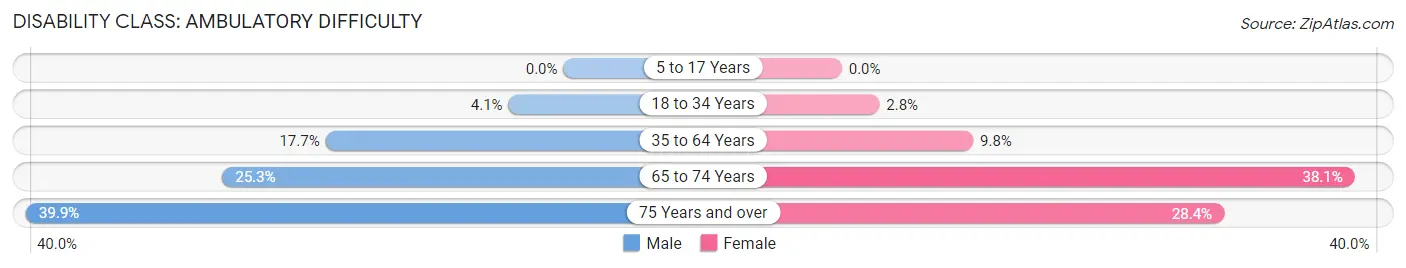
| Age Bracket | Male | Female |
| 5 to 17 Years | 0 (0.0%) | 0 (0.0%) |
| 18 to 34 Years | 15 (4.1%) | 21 (2.8%) |
| 35 to 64 Years | 121 (17.7%) | 105 (9.8%) |
| 65 to 74 Years | 59 (25.3%) | 83 (38.1%) |
| 75 Years and over | 77 (39.9%) | 99 (28.4%) |
Disability Class: Self-Care Difficulty
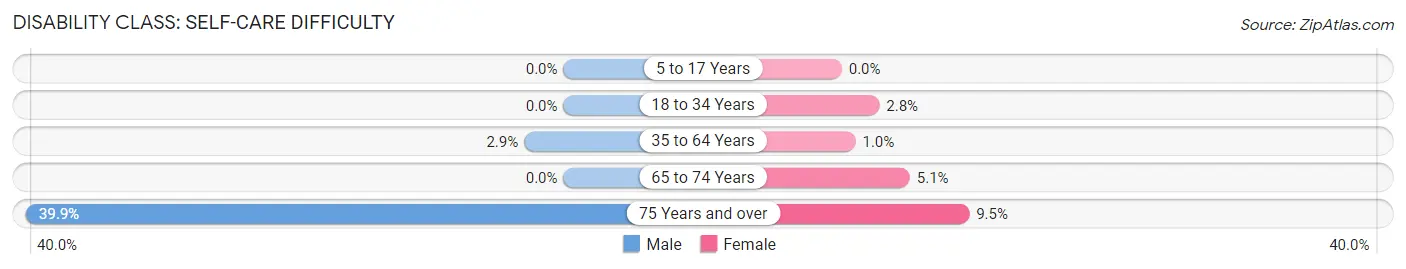
| Age Bracket | Male | Female |
| 5 to 17 Years | 0 (0.0%) | 0 (0.0%) |
| 18 to 34 Years | 0 (0.0%) | 21 (2.8%) |
| 35 to 64 Years | 20 (2.9%) | 11 (1.0%) |
| 65 to 74 Years | 0 (0.0%) | 11 (5.1%) |
| 75 Years and over | 77 (39.9%) | 33 (9.5%) |
Technology Access in Marianna
Computing Device Access in Marianna
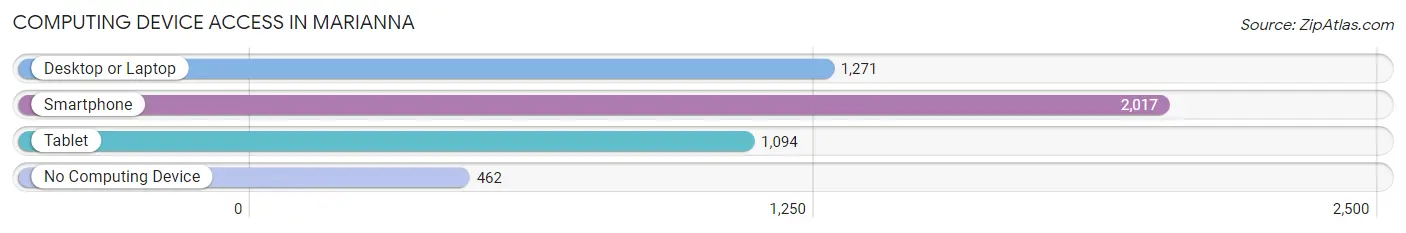
| Device Type | # Households | % Households |
| Desktop or Laptop | 1,271 | 47.8% |
| Smartphone | 2,017 | 75.9% |
| Tablet | 1,094 | 41.2% |
| No Computing Device | 462 | 17.4% |
| Total | 2,656 | 100.0% |
Internet Access in Marianna
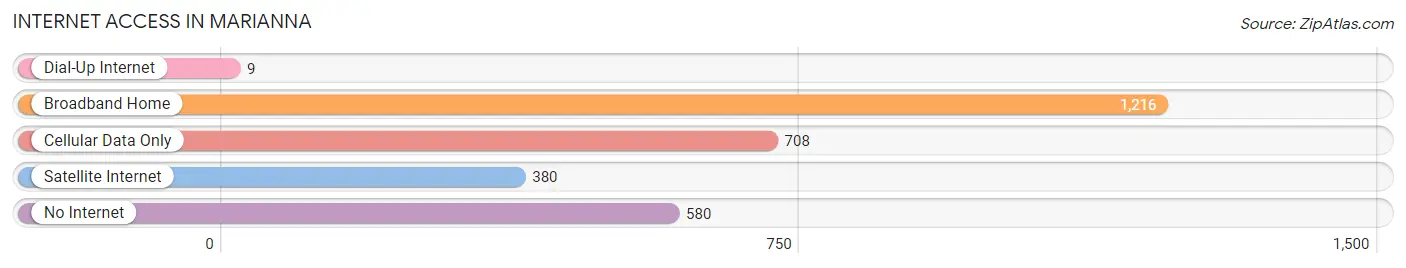
| Internet Type | # Households | % Households |
| Dial-Up Internet | 9 | 0.3% |
| Broadband Home | 1,216 | 45.8% |
| Cellular Data Only | 708 | 26.7% |
| Satellite Internet | 380 | 14.3% |
| No Internet | 580 | 21.8% |
| Total | 2,656 | 100.0% |
Marianna Summary
Marianna is a city located in Jackson County, Florida, United States. It is the county seat of Jackson County and is located in the Florida Panhandle. The population of Marianna was 6,230 at the 2010 census.
History
Marianna was founded in 1821 by settlers from Georgia and South Carolina. The city was named after the daughter of one of the original settlers, John Lee Williams. The city was incorporated in 1829 and was the county seat of Jackson County.
Marianna was an important trading center during the 19th century. It was the site of a major battle during the Second Seminole War in 1836. During the Civil War, Marianna was the site of a Confederate prison camp.
Geography
Marianna is located at 30°45'N 85°17'W (30.75, -85.28). It is situated in the Florida Panhandle, approximately 20 miles (32 km) west of Dothan, Alabama, and approximately 30 miles (48 km) east of Panama City, Florida.
The city is located in the Chipola River Valley, which is part of the larger Apalachicola River Valley. The city is surrounded by rolling hills and is located near the Florida-Alabama border.
Economy
Marianna is the economic center of Jackson County. The city is home to several major employers, including Jackson Hospital, Florida State Hospital, and the Jackson County School District.
The city is also home to several manufacturing companies, including a paper mill, a furniture factory, and a plastics plant. The city is also home to several retail stores, including Walmart, Lowe's, and Home Depot.
Demographics
As of the 2010 census, the population of Marianna was 6,230. The racial makeup of the city was 68.3% White, 28.2% African American, 0.4% Native American, 0.7% Asian, 0.1% Pacific Islander, 0.7% from other races, and 1.6% from two or more races. Hispanic or Latino of any race were 2.3% of the population.
The median income for a household in the city was $30,938, and the median income for a family was $37,813. The per capita income for the city was $17,845. About 17.2% of families and 21.2% of the population were below the poverty line, including 28.2% of those under age 18 and 16.2% of those age 65 or over.
Conclusion
Marianna is a city located in Jackson County, Florida, United States. It is the county seat of Jackson County and is located in the Florida Panhandle. The city was founded in 1821 and was an important trading center during the 19th century. It is the economic center of Jackson County and is home to several major employers, including Jackson Hospital, Florida State Hospital, and the Jackson County School District. As of the 2010 census, the population of Marianna was 6,230. The racial makeup of the city was 68.3% White, 28.2% African American, 0.4% Native American, 0.7% Asian, 0.1% Pacific Islander, 0.7% from other races, and 1.6% from two or more races. The median income for a household in the city was $30,938, and the median income for a family was $37,813.
Common Questions
What is Per Capita Income in Marianna?
Per Capita income in Marianna is $18,568.
What is the Median Family Income in Marianna?
Median Family Income in Marianna is $48,125.
What is the Median Household income in Marianna?
Median Household Income in Marianna is $27,296.
What is Income or Wage Gap in Marianna?
Income or Wage Gap in Marianna is 16.5%.
Women in Marianna earn 83.5 cents for every dollar earned by a man.
What is Inequality or Gini Index in Marianna?
Inequality or Gini Index in Marianna is 0.48.
What is the Total Population of Marianna?
Total Population of Marianna is 6,681.
What is the Total Male Population of Marianna?
Total Male Population of Marianna is 3,340.
What is the Total Female Population of Marianna?
Total Female Population of Marianna is 3,341.
What is the Ratio of Males per 100 Females in Marianna?
There are 99.97 Males per 100 Females in Marianna.
What is the Ratio of Females per 100 Males in Marianna?
There are 100.03 Females per 100 Males in Marianna.
What is the Median Population Age in Marianna?
Median Population Age in Marianna is 38.2 Years.
What is the Average Family Size in Marianna
Average Family Size in Marianna is 2.9 People.
What is the Average Household Size in Marianna
Average Household Size in Marianna is 2.1 People.
How Large is the Labor Force in Marianna?
There are 2,212 People in the Labor Forcein in Marianna.
What is the Percentage of People in the Labor Force in Marianna?
43.3% of People are in the Labor Force in Marianna.
What is the Unemployment Rate in Marianna?
Unemployment Rate in Marianna is 5.2%.