Zip Codes with the Highest Percentage of Population Employed in Health Diagnosing & Treating in Bonita Springs, FL
RELATED REPORTS & OPTIONS
Health Diagnosing & Treating
Bonita Springs
Compare Zip Codes
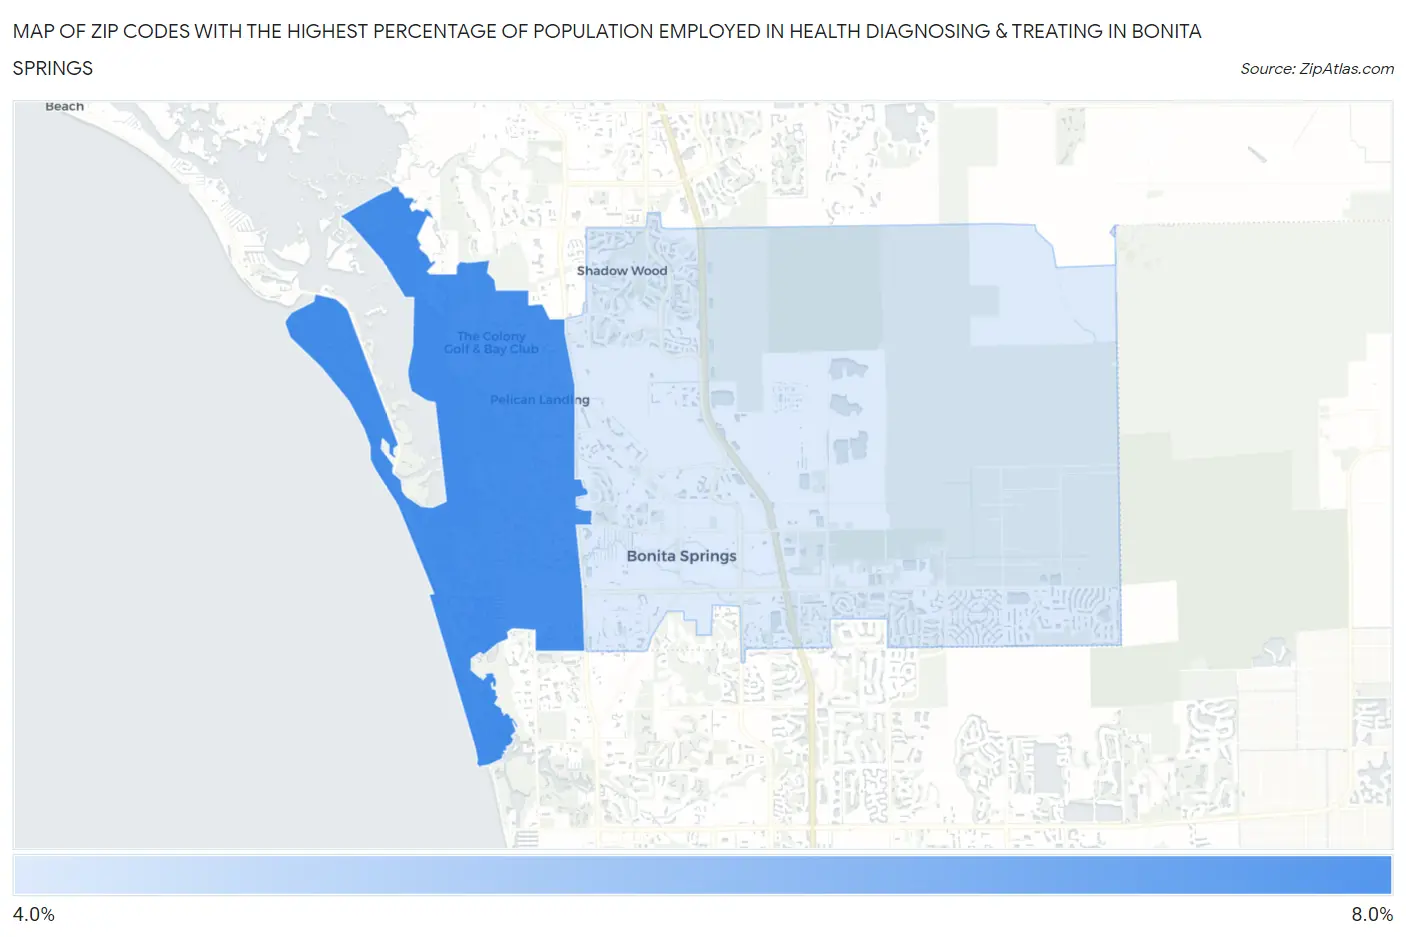
Map of Zip Codes with the Highest Percentage of Population Employed in Health Diagnosing & Treating in Bonita Springs
4.6%
6.9%
Zip Codes with the Highest Percentage of Population Employed in Health Diagnosing & Treating in Bonita Springs, FL
| Zip Code | % Employed | vs State | vs National | |
| 1. | 34134 | 6.9% | 6.4%(+0.500)#351 | 6.2%(+0.704)#10,520 |
| 2. | 34135 | 4.6% | 6.4%(-1.88)#708 | 6.2%(-1.68)#19,394 |
1
Common Questions
What are the Top Zip Codes with the Highest Percentage of Population Employed in Health Diagnosing & Treating in Bonita Springs, FL?
Top Zip Codes with the Highest Percentage of Population Employed in Health Diagnosing & Treating in Bonita Springs, FL are:
What zip code has the Highest Percentage of Population Employed in Health Diagnosing & Treating in Bonita Springs, FL?
34134 has the Highest Percentage of Population Employed in Health Diagnosing & Treating in Bonita Springs, FL with 6.9%.
What is the Percentage of Population Employed in Health Diagnosing & Treating in Bonita Springs, FL?
Percentage of Population Employed in Health Diagnosing & Treating in Bonita Springs is 5.1%.
What is the Percentage of Population Employed in Health Diagnosing & Treating in Florida?
Percentage of Population Employed in Health Diagnosing & Treating in Florida is 6.4%.
What is the Percentage of Population Employed in Health Diagnosing & Treating in the United States?
Percentage of Population Employed in Health Diagnosing & Treating in the United States is 6.2%.