Zip Codes with the Highest Percentage of Population Employed in Architecture & Engineering in Bonita Springs, FL
RELATED REPORTS & OPTIONS
Architecture & Engineering
Bonita Springs
Compare Zip Codes
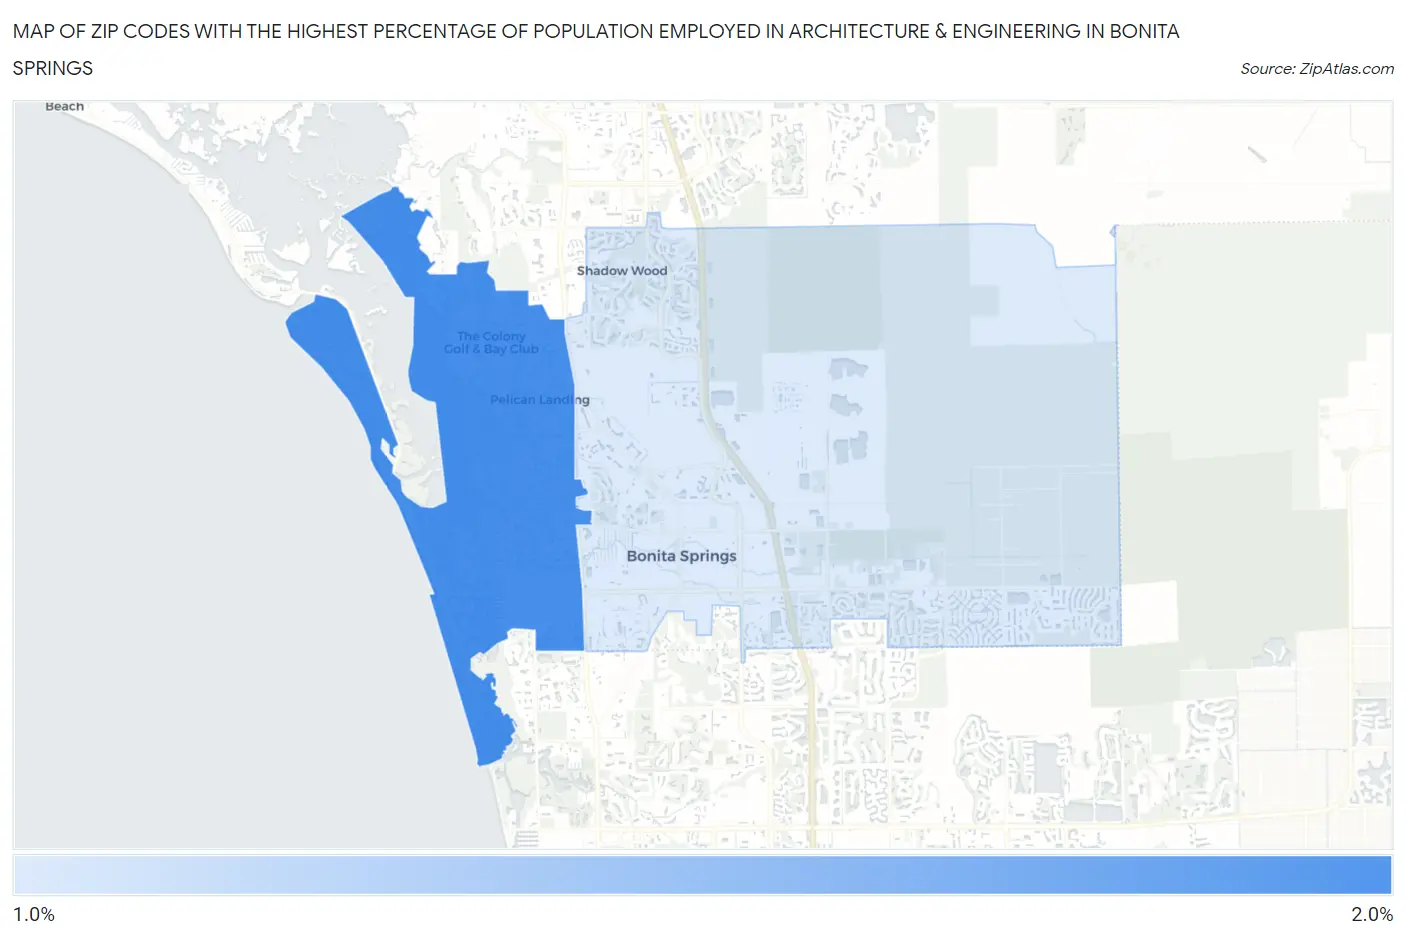
Map of Zip Codes with the Highest Percentage of Population Employed in Architecture & Engineering in Bonita Springs
1.7%
1.8%
Zip Codes with the Highest Percentage of Population Employed in Architecture & Engineering in Bonita Springs, FL
| Zip Code | % Employed | vs State | vs National | |
| 1. | 34134 | 1.8% | 1.6%(+0.180)#284 | 2.1%(-0.371)#10,957 |
| 2. | 34135 | 1.7% | 1.6%(+0.063)#317 | 2.1%(-0.487)#11,756 |
1
Common Questions
What are the Top Zip Codes with the Highest Percentage of Population Employed in Architecture & Engineering in Bonita Springs, FL?
Top Zip Codes with the Highest Percentage of Population Employed in Architecture & Engineering in Bonita Springs, FL are:
What zip code has the Highest Percentage of Population Employed in Architecture & Engineering in Bonita Springs, FL?
34134 has the Highest Percentage of Population Employed in Architecture & Engineering in Bonita Springs, FL with 1.8%.
What is the Percentage of Population Employed in Architecture & Engineering in Bonita Springs, FL?
Percentage of Population Employed in Architecture & Engineering in Bonita Springs is 1.6%.
What is the Percentage of Population Employed in Architecture & Engineering in Florida?
Percentage of Population Employed in Architecture & Engineering in Florida is 1.6%.
What is the Percentage of Population Employed in Architecture & Engineering in the United States?
Percentage of Population Employed in Architecture & Engineering in the United States is 2.1%.