Zip Codes with the Highest Percentage of Population Employed in Mining, Quarrying, & Extraction in Redding, CA

RELATED REPORTS & OPTIONS

Mining, Quarrying, & Extraction
Population
Families and Households
Female Fertility
Female Fertility (Unmarried)
Race (Community Size)
Race (Percentage)
Ancestry (Community Size)
AfricanAmericanApacheArabArmenianAustralianAustrianBangladeshiBasqueBelgianBelizeanBhutaneseBlackfeetBolivianBrazilianBritishBurmeseCanadianCelticCentral AmericanCentral American IndianCherokeeChickasawChileanChippewaChoctawColombianCosta RicanCroatianCubanCzechCzechoslovakianDanishDutchEastern EuropeanEnglishEuropeanFinnishFrenchFrench CanadianGermanGreekGuamanian / ChamorroHonduranHungarianIndian (Asian)IranianIrishIroquoisItalianJamaicanKoreanLaotianLatvianLebaneseLithuanianMalaysianMalteseMexicanMexican American IndianNative HawaiianNavajoNepaleseNorthern EuropeanNorwegianPakistaniPanamanianPennsylvania GermanPeruvianPolishPortuguesePuerto RicanRomanianRussianSalvadoranSamoanScandinavianScotch-IrishScottishShoshoneSiouxSlovakSouth AmericanSpaniardSpanishSri LankanSubsaharan AfricanSwedishSwissSyrianThaiUkrainianWelshWest IndianYugoslavian
Ancestry (Percentage)
AfricanAmericanApacheArabArmenianAustralianAustrianBangladeshiBasqueBelgianBelizeanBhutaneseBlackfeetBolivianBrazilianBritishBurmeseCanadianCelticCentral AmericanCentral American IndianCherokeeChickasawChileanChippewaChoctawColombianCosta RicanCroatianCubanCzechCzechoslovakianDanishDutchEastern EuropeanEnglishEuropeanFinnishFrenchFrench CanadianGermanGreekGuamanian / ChamorroHonduranHungarianIndian (Asian)IranianIrishIroquoisItalianJamaicanKoreanLaotianLatvianLebaneseLithuanianMalaysianMalteseMexicanMexican American IndianNative HawaiianNavajoNepaleseNorthern EuropeanNorwegianPakistaniPanamanianPennsylvania GermanPeruvianPolishPortuguesePuerto RicanRomanianRussianSalvadoranSamoanScandinavianScotch-IrishScottishShoshoneSiouxSlovakSouth AmericanSpaniardSpanishSri LankanSubsaharan AfricanSwedishSwissSyrianThaiUkrainianWelshWest IndianYugoslavian
Immigrant Origin (Total)
Immigrant Origin (Percentage)
Income
Income (Families)
Income (Households)
Poverty
Poverty (Families)
Unemployment
Employment Occupations
Employment Industries
Employer Class
Commute Time
Commute Means
School Enrollment
Education by Degree Field
Occupancy
Finances
Physical Characteristics
Redding
Compare Zip Codes
Comparison Subject

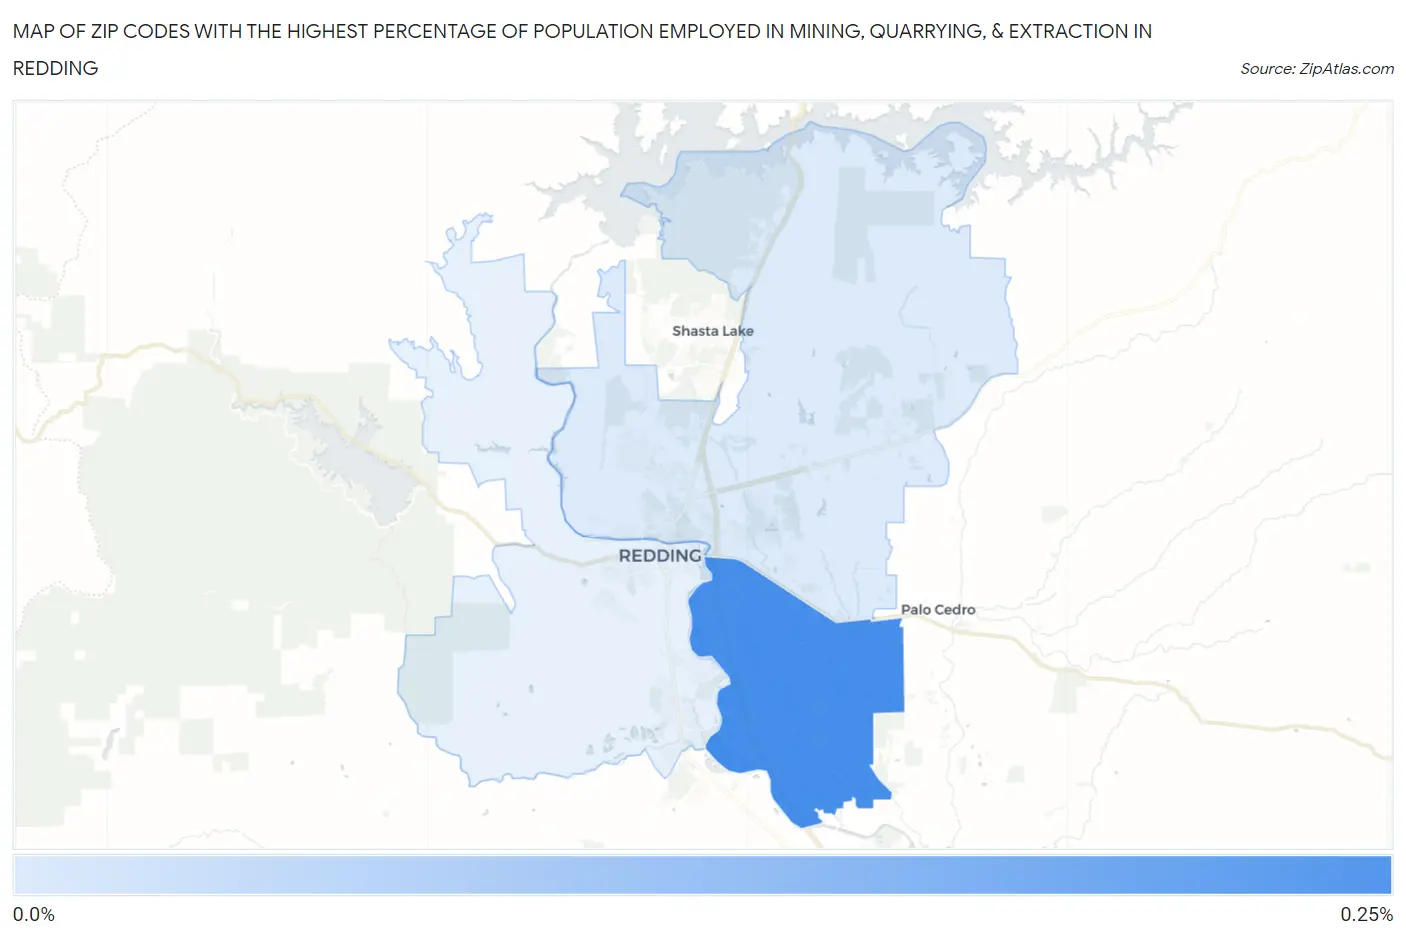
Map of Zip Codes with the Highest Percentage of Population Employed in Mining, Quarrying, & Extraction in Redding

0.0%
0.25%
Zip Codes with the Highest Percentage of Population Employed in Mining, Quarrying, & Extraction in Redding Map

Zip Codes with the Highest Percentage of Population Employed in Mining, Quarrying, & Extraction in Redding, CA

Zip Code % Employed vs State vs National
1.960020.24%0.12%(+0.121)#1700.44%(-0.196)#9,023
2.960030.042%0.12%(-0.081)#4510.44%(-0.399)#11,769

Common Questions

What are the Top Zip Codes with the Highest Percentage of Population Employed in Mining, Quarrying, & Extraction in Redding, CA?
Top Zip Codes with the Highest Percentage of Population Employed in Mining, Quarrying, & Extraction in Redding, CA are:
#1
0.24%
#2
0.042%
#3
0.0%
What zip code has the Highest Percentage of Population Employed in Mining, Quarrying, & Extraction in Redding, CA?
96002 has the Highest Percentage of Population Employed in Mining, Quarrying, & Extraction in Redding, CA with 0.24%.
What is the Percentage of Population Employed in Mining, Quarrying, & Extraction in Redding, CA?
Percentage of Population Employed in Mining, Quarrying, & Extraction in Redding is 0.090%.
What is the Percentage of Population Employed in Mining, Quarrying, & Extraction in California?
Percentage of Population Employed in Mining, Quarrying, & Extraction in California is 0.12%.
What is the Percentage of Population Employed in Mining, Quarrying, & Extraction in the United States?
Percentage of Population Employed in Mining, Quarrying, & Extraction in the United States is 0.44%.