Tatitlek, AK Map & Demographics
Tatitlek Map
Tatitlek Overview
$30,215
PER CAPITA INCOME
$61,250
AVG FAMILY INCOME
$70,417
AVG HOUSEHOLD INCOME
0.19
INEQUALITY / GINI INDEX
40
TOTAL POPULATION
16
MALE POPULATION
24
FEMALE POPULATION
66.67
MALES / 100 FEMALES
150.00
FEMALES / 100 MALES
48.3
MEDIAN AGE
2.5
AVG FAMILY SIZE
2.4
AVG HOUSEHOLD SIZE
15
LABOR FORCE [ PEOPLE ]
42.9%
PERCENT IN LABOR FORCE
Tatitlek Zip Codes
Tatitlek Area Codes
Income in Tatitlek
Income Overview in Tatitlek
Per Capita Income in Tatitlek is $30,215, while median incomes of families and households are $61,250 and $70,417 respectively.
| Characteristic | Number | Measure |
| Per Capita Income | 40 | $30,215 |
| Median Family Income | 15 | $61,250 |
| Mean Family Income | 15 | $62,813 |
| Median Household Income | 17 | $70,417 |
| Mean Household Income | 17 | $66,853 |
| Income Deficit | 15 | $0 |
| Wage / Income Gap (%) | 40 | 0.00% |
| Wage / Income Gap ($) | 40 | 100.00¢ per $1 |
| Gini / Inequality Index | 40 | 0.19 |
Earnings by Sex in Tatitlek
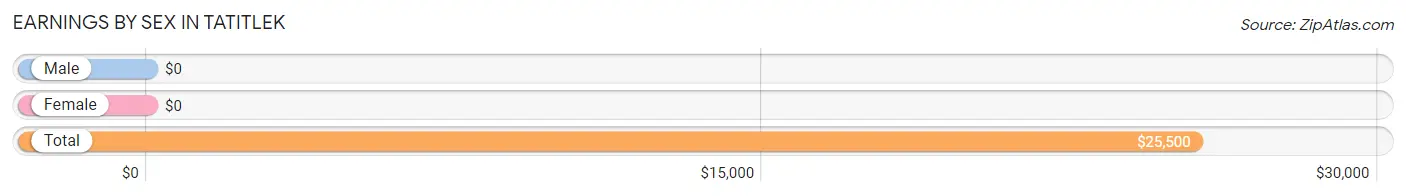
| Sex | Number | Average Earnings |
| Male | 6 (23.1%) | $0 |
| Female | 20 (76.9%) | $0 |
| Total | 26 (100.0%) | $25,500 |
Earnings by Sex by Income Bracket in Tatitlek
The most common earnings brackets in Tatitlek are $25,000 to $29,999 for men (3 | 50.0%) and $2,499 or less for women (8 | 40.0%).
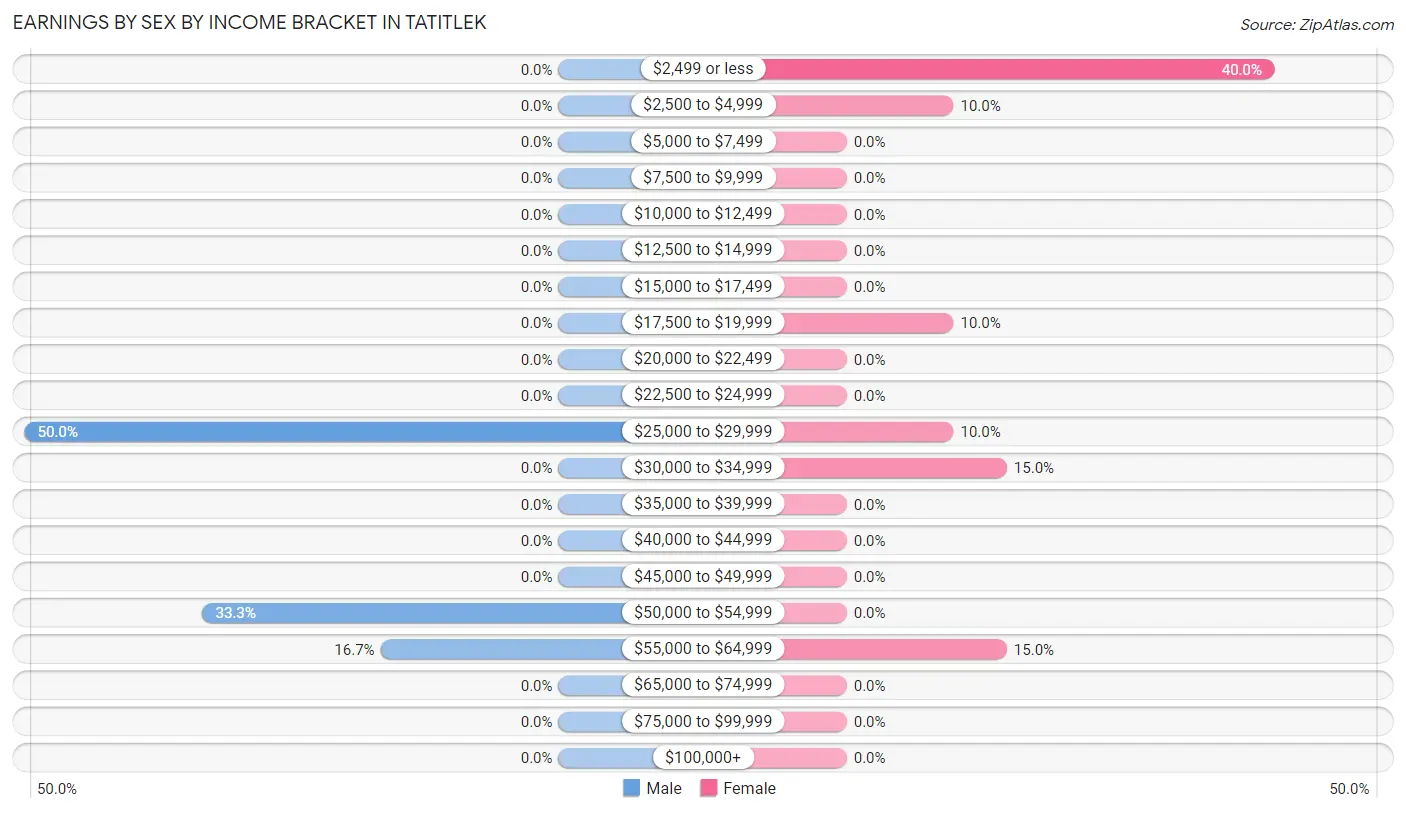
| Income | Male | Female |
| $2,499 or less | 0 (0.0%) | 8 (40.0%) |
| $2,500 to $4,999 | 0 (0.0%) | 2 (10.0%) |
| $5,000 to $7,499 | 0 (0.0%) | 0 (0.0%) |
| $7,500 to $9,999 | 0 (0.0%) | 0 (0.0%) |
| $10,000 to $12,499 | 0 (0.0%) | 0 (0.0%) |
| $12,500 to $14,999 | 0 (0.0%) | 0 (0.0%) |
| $15,000 to $17,499 | 0 (0.0%) | 0 (0.0%) |
| $17,500 to $19,999 | 0 (0.0%) | 2 (10.0%) |
| $20,000 to $22,499 | 0 (0.0%) | 0 (0.0%) |
| $22,500 to $24,999 | 0 (0.0%) | 0 (0.0%) |
| $25,000 to $29,999 | 3 (50.0%) | 2 (10.0%) |
| $30,000 to $34,999 | 0 (0.0%) | 3 (15.0%) |
| $35,000 to $39,999 | 0 (0.0%) | 0 (0.0%) |
| $40,000 to $44,999 | 0 (0.0%) | 0 (0.0%) |
| $45,000 to $49,999 | 0 (0.0%) | 0 (0.0%) |
| $50,000 to $54,999 | 2 (33.3%) | 0 (0.0%) |
| $55,000 to $64,999 | 1 (16.7%) | 3 (15.0%) |
| $65,000 to $74,999 | 0 (0.0%) | 0 (0.0%) |
| $75,000 to $99,999 | 0 (0.0%) | 0 (0.0%) |
| $100,000+ | 0 (0.0%) | 0 (0.0%) |
| Total | 6 (100.0%) | 20 (100.0%) |
Earnings by Sex by Educational Attainment in Tatitlek
| Educational Attainment | Male Income | Female Income |
| Less than High School | - | - |
| High School Diploma | - | - |
| College or Associate's Degree | - | - |
| Bachelor's Degree | - | - |
| Graduate Degree | - | - |
| Total | - | - |
Family Income in Tatitlek
Family Income Brackets in Tatitlek
According to the Tatitlek family income data, there are 9 families falling into the $50,000 to $74,999 income range, which is the most common income bracket and makes up 60.0% of all families.
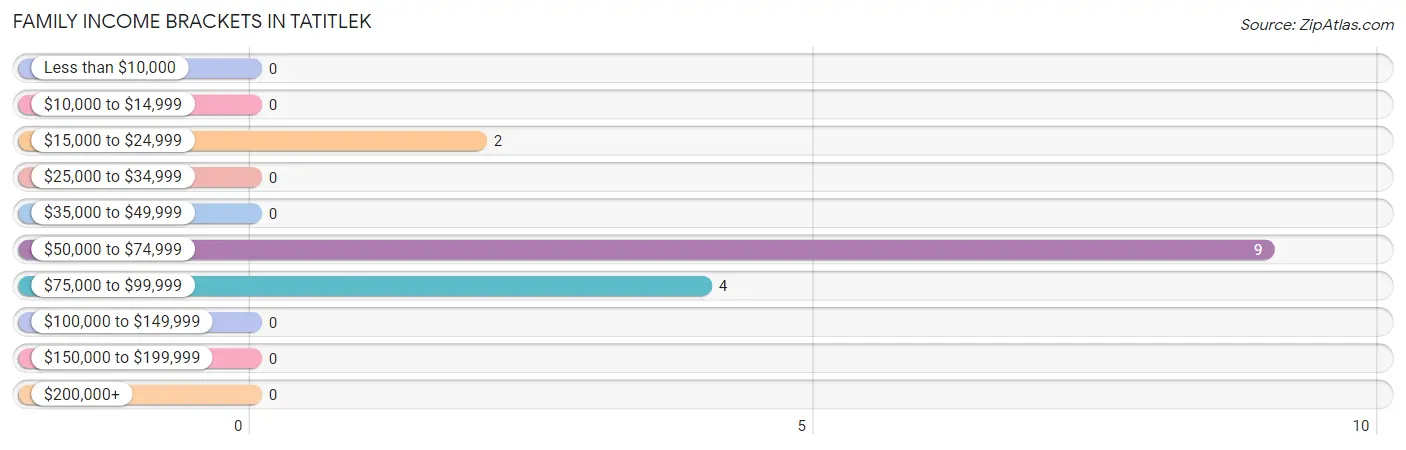
| Income Bracket | # Families | % Families |
| Less than $10,000 | 0 | 0.0% |
| $10,000 to $14,999 | 0 | 0.0% |
| $15,000 to $24,999 | 2 | 13.3% |
| $25,000 to $34,999 | 0 | 0.0% |
| $35,000 to $49,999 | 0 | 0.0% |
| $50,000 to $74,999 | 9 | 60.0% |
| $75,000 to $99,999 | 4 | 26.7% |
| $100,000 to $149,999 | 0 | 0.0% |
| $150,000 to $199,999 | 0 | 0.0% |
| $200,000+ | 0 | 0.0% |
Family Income by Famaliy Size in Tatitlek
2-person families (14 | 93.3%) account for the highest median family income in Tatitlek with $65,000 per family, while 2-person families (14 | 93.3%) have the highest median income of $32,500 per family member.
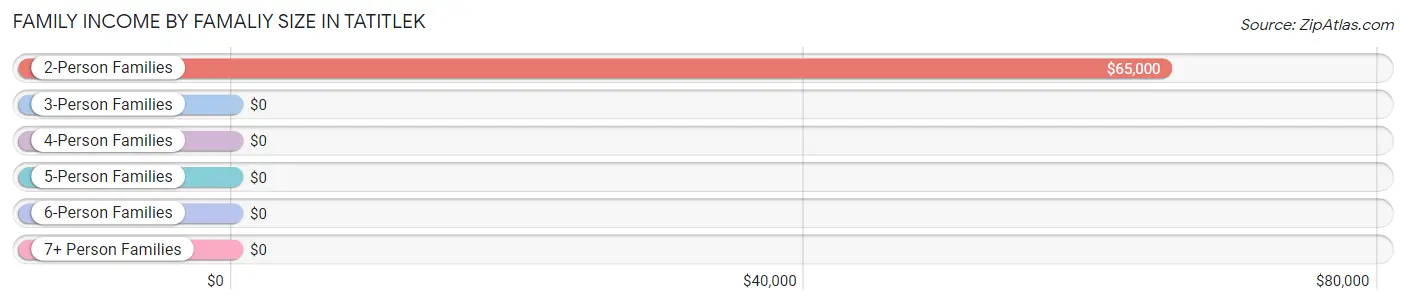
| Income Bracket | # Families | Median Income |
| 2-Person Families | 14 (93.3%) | $65,000 |
| 3-Person Families | 1 (6.7%) | $0 |
| 4-Person Families | 0 (0.0%) | $0 |
| 5-Person Families | 0 (0.0%) | $0 |
| 6-Person Families | 0 (0.0%) | $0 |
| 7+ Person Families | 0 (0.0%) | $0 |
| Total | 15 (100.0%) | $61,250 |
Family Income by Number of Earners in Tatitlek
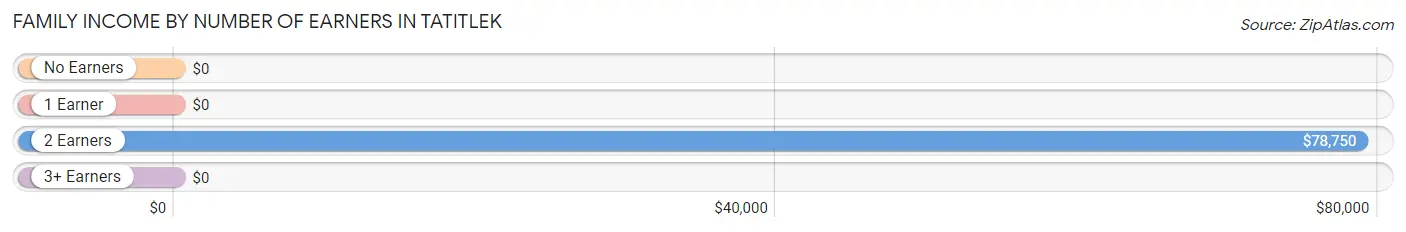
| Number of Earners | # Families | Median Income |
| No Earners | 3 (20.0%) | $0 |
| 1 Earner | 5 (33.3%) | $0 |
| 2 Earners | 7 (46.7%) | $78,750 |
| 3+ Earners | 0 (0.0%) | $0 |
| Total | 15 (100.0%) | $61,250 |
Household Income in Tatitlek
Household Income Brackets in Tatitlek
With 9 households falling in the category, the $50,000 to $74,999 income range is the most frequent in Tatitlek, accounting for 52.9% of all households.
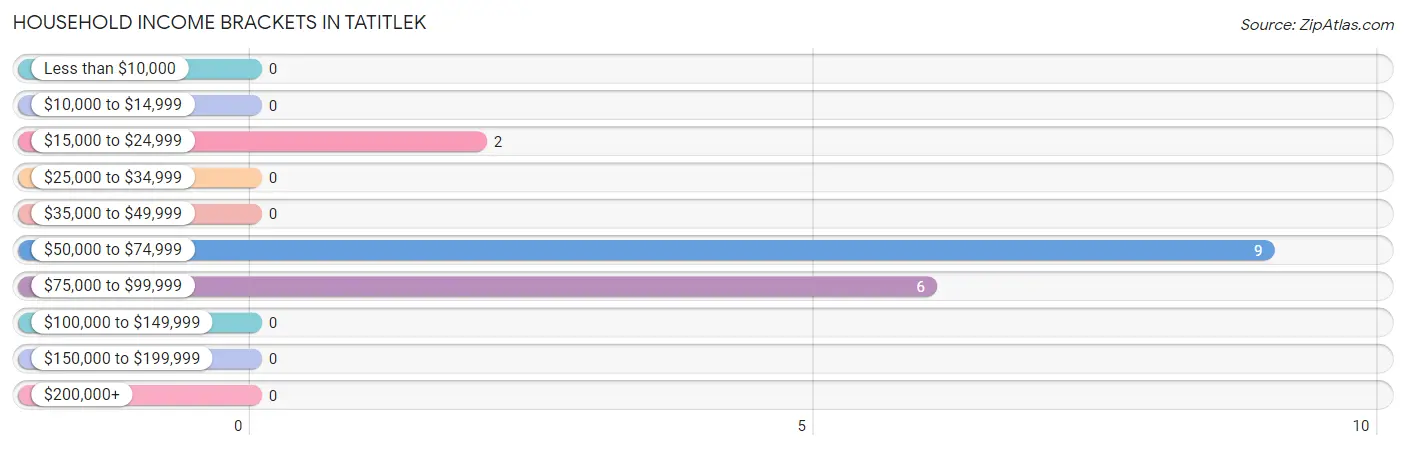
| Income Bracket | # Households | % Households |
| Less than $10,000 | 0 | 0.0% |
| $10,000 to $14,999 | 0 | 0.0% |
| $15,000 to $24,999 | 2 | 11.8% |
| $25,000 to $34,999 | 0 | 0.0% |
| $35,000 to $49,999 | 0 | 0.0% |
| $50,000 to $74,999 | 9 | 52.9% |
| $75,000 to $99,999 | 6 | 35.3% |
| $100,000 to $149,999 | 0 | 0.0% |
| $150,000 to $199,999 | 0 | 0.0% |
| $200,000+ | 0 | 0.0% |
Household Income by Householder Age in Tatitlek
The median household income in Tatitlek is $70,417, with the highest median household income of $72,083 found in the 65+ years age bracket for the primary householder. A total of 9 households (52.9%) fall into this category.
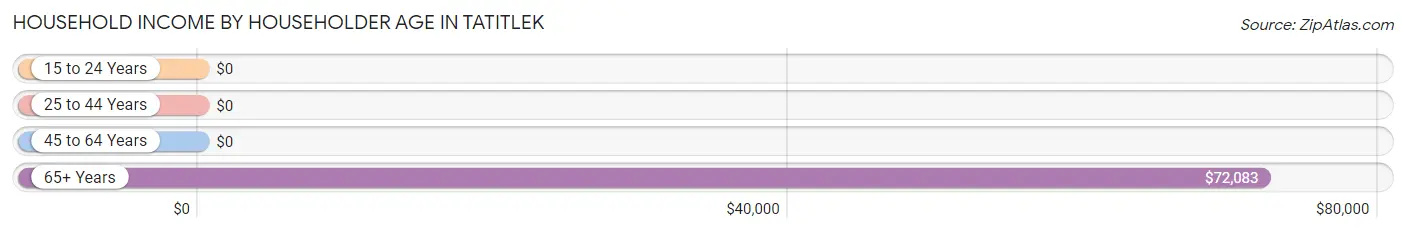
| Income Bracket | # Households | Median Income |
| 15 to 24 Years | 0 (0.0%) | $0 |
| 25 to 44 Years | 5 (29.4%) | $0 |
| 45 to 64 Years | 3 (17.6%) | $0 |
| 65+ Years | 9 (52.9%) | $72,083 |
| Total | 17 (100.0%) | $70,417 |
Poverty in Tatitlek
Income Below Poverty by Sex and Age in Tatitlek
With 31.2% poverty level for males and 8.3% for females among the residents of Tatitlek, 12 to 14 year old males and 25 to 34 year old females are the most vulnerable to poverty, with 5 males (100.0%) and 2 females (100.0%) in their respective age groups living below the poverty level.
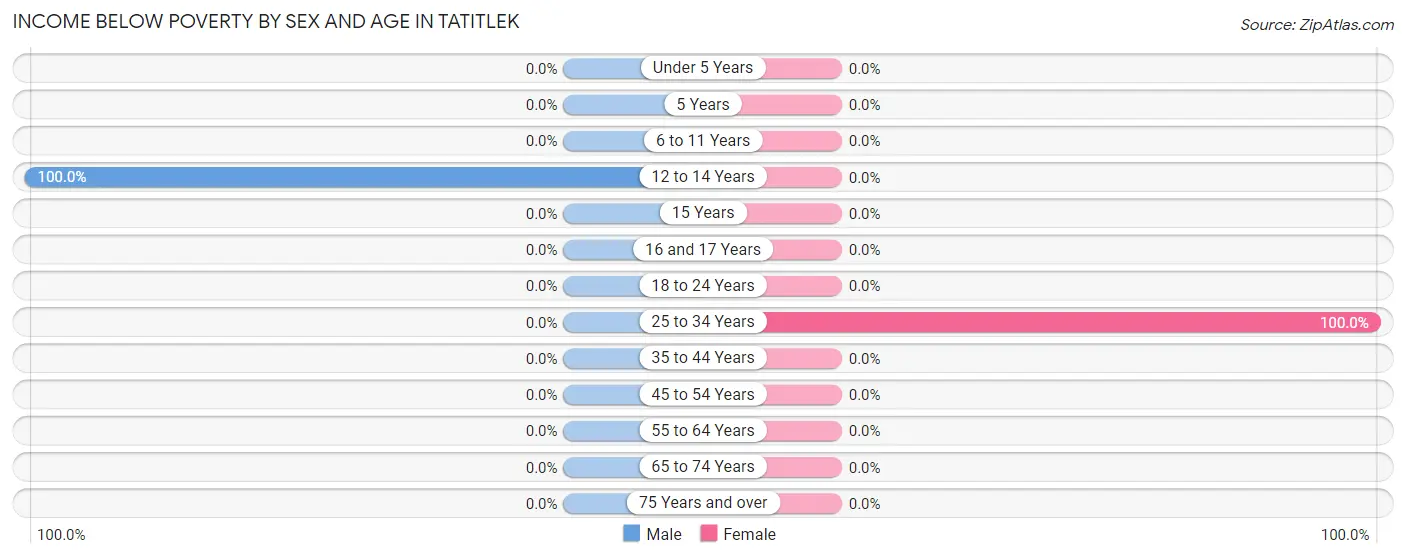
| Age Bracket | Male | Female |
| Under 5 Years | 0 (0.0%) | 0 (0.0%) |
| 5 Years | 0 (0.0%) | 0 (0.0%) |
| 6 to 11 Years | 0 (0.0%) | 0 (0.0%) |
| 12 to 14 Years | 5 (100.0%) | 0 (0.0%) |
| 15 Years | 0 (0.0%) | 0 (0.0%) |
| 16 and 17 Years | 0 (0.0%) | 0 (0.0%) |
| 18 to 24 Years | 0 (0.0%) | 0 (0.0%) |
| 25 to 34 Years | 0 (0.0%) | 2 (100.0%) |
| 35 to 44 Years | 0 (0.0%) | 0 (0.0%) |
| 45 to 54 Years | 0 (0.0%) | 0 (0.0%) |
| 55 to 64 Years | 0 (0.0%) | 0 (0.0%) |
| 65 to 74 Years | 0 (0.0%) | 0 (0.0%) |
| 75 Years and over | 0 (0.0%) | 0 (0.0%) |
| Total | 5 (31.2%) | 2 (8.3%) |
Income Above Poverty by Sex and Age in Tatitlek
According to the poverty statistics in Tatitlek, males aged 25 to 34 years and females aged 18 to 24 years are the age groups that are most secure financially, with 100.0% of males and 100.0% of females in these age groups living above the poverty line.
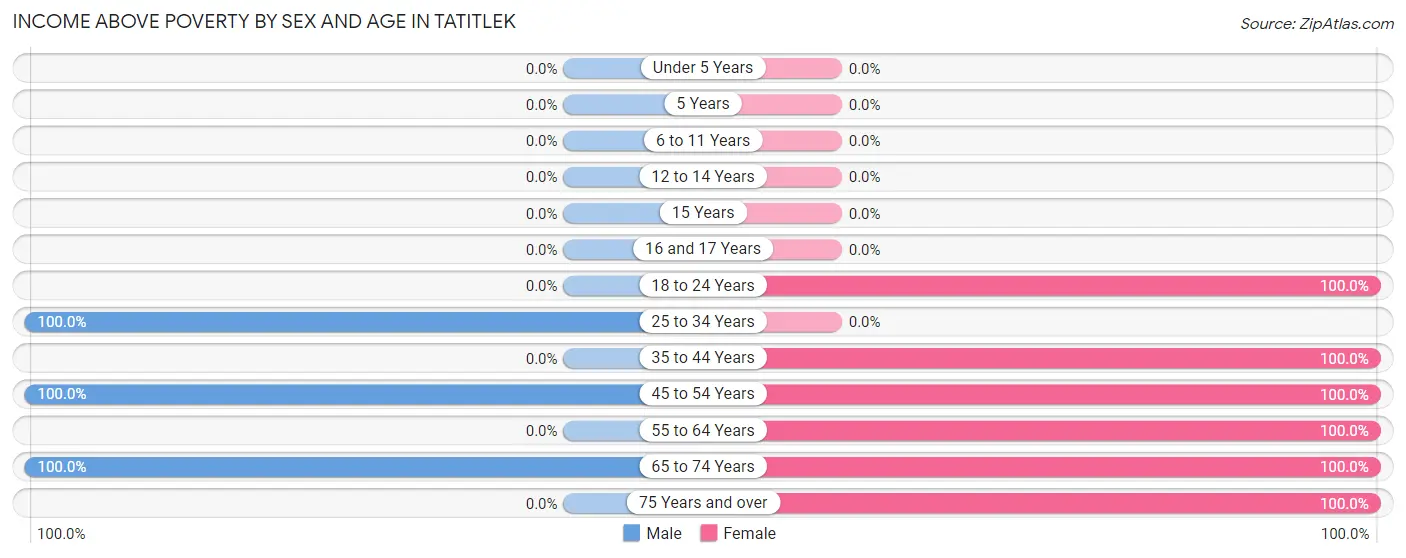
| Age Bracket | Male | Female |
| Under 5 Years | 0 (0.0%) | 0 (0.0%) |
| 5 Years | 0 (0.0%) | 0 (0.0%) |
| 6 to 11 Years | 0 (0.0%) | 0 (0.0%) |
| 12 to 14 Years | 0 (0.0%) | 0 (0.0%) |
| 15 Years | 0 (0.0%) | 0 (0.0%) |
| 16 and 17 Years | 0 (0.0%) | 0 (0.0%) |
| 18 to 24 Years | 0 (0.0%) | 6 (100.0%) |
| 25 to 34 Years | 3 (100.0%) | 0 (0.0%) |
| 35 to 44 Years | 0 (0.0%) | 3 (100.0%) |
| 45 to 54 Years | 4 (100.0%) | 2 (100.0%) |
| 55 to 64 Years | 0 (0.0%) | 4 (100.0%) |
| 65 to 74 Years | 4 (100.0%) | 5 (100.0%) |
| 75 Years and over | 0 (0.0%) | 2 (100.0%) |
| Total | 11 (68.8%) | 22 (91.7%) |
Income Below Poverty Among Married-Couple Families in Tatitlek
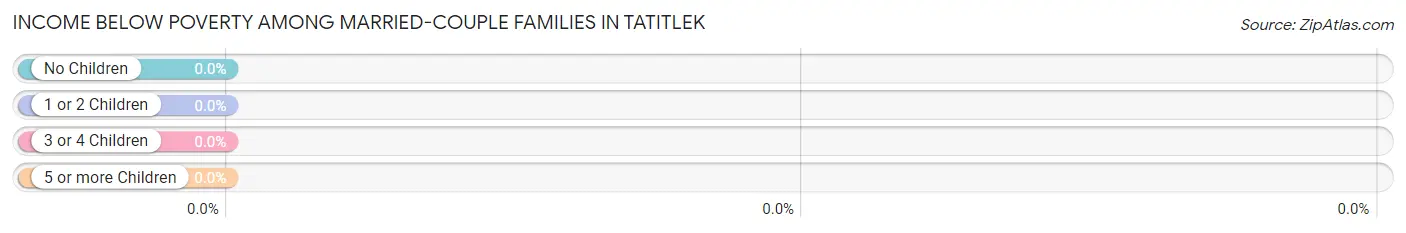
| Children | Above Poverty | Below Poverty |
| No Children | 6 (100.0%) | 0 (0.0%) |
| 1 or 2 Children | 0 (0.0%) | 0 (0.0%) |
| 3 or 4 Children | 0 (0.0%) | 0 (0.0%) |
| 5 or more Children | 0 (0.0%) | 0 (0.0%) |
| Total | 6 (100.0%) | 0 (0.0%) |
Income Below Poverty Among Single-Parent Households in Tatitlek
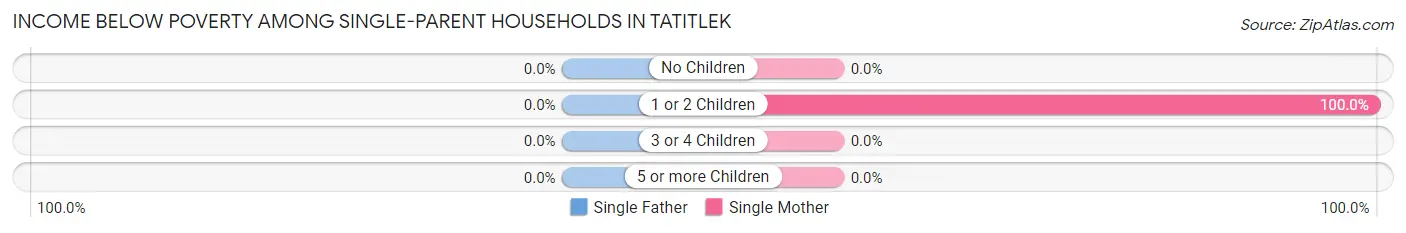
| Children | Single Father | Single Mother |
| No Children | 0 (0.0%) | 0 (0.0%) |
| 1 or 2 Children | 0 (0.0%) | 2 (100.0%) |
| 3 or 4 Children | 0 (0.0%) | 0 (0.0%) |
| 5 or more Children | 0 (0.0%) | 0 (0.0%) |
| Total | 0 (0.0%) | 2 (22.2%) |
Income Below Poverty Among Married-Couple vs Single-Parent Households in Tatitlek
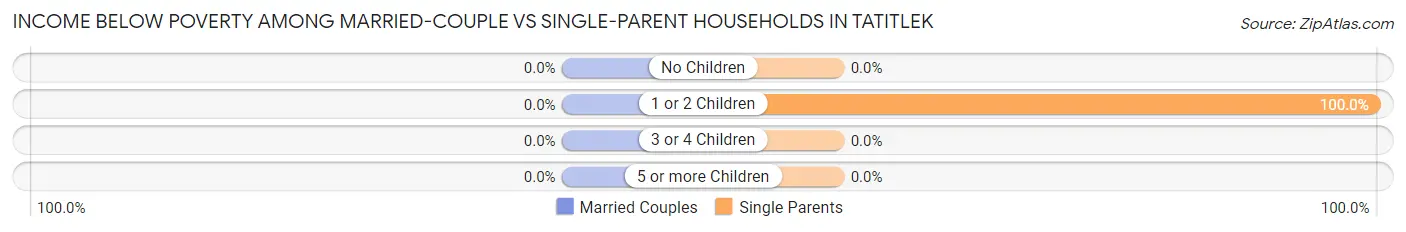
| Children | Married-Couple Families | Single-Parent Households |
| No Children | 0 (0.0%) | 0 (0.0%) |
| 1 or 2 Children | 0 (0.0%) | 2 (100.0%) |
| 3 or 4 Children | 0 (0.0%) | 0 (0.0%) |
| 5 or more Children | 0 (0.0%) | 0 (0.0%) |
| Total | 0 (0.0%) | 2 (22.2%) |
Race in Tatitlek
The most populous races in Tatitlek are Native / Alaskan (36 | 90.0%), and White / Caucasian (4 | 10.0%).
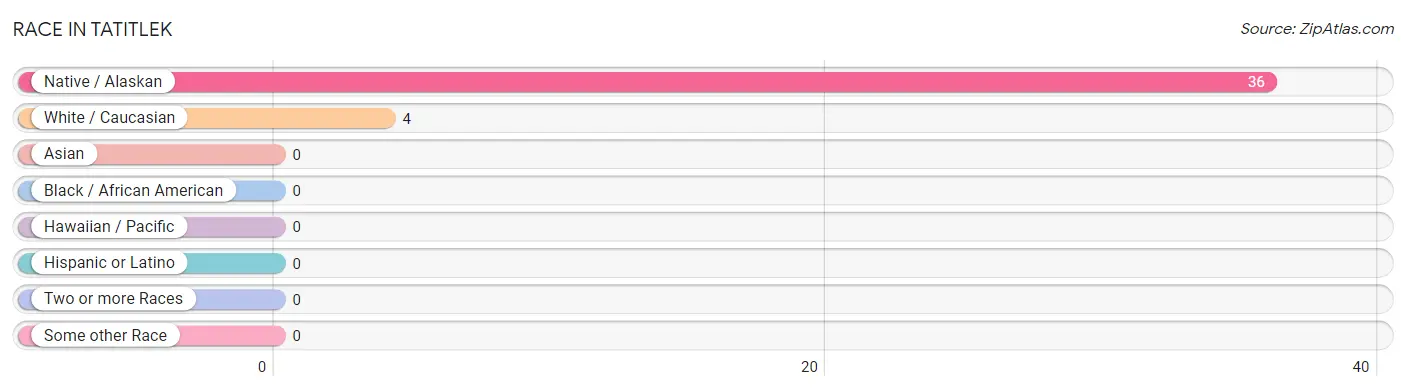
| Race | # Population | % Population |
| Asian | 0 | 0.0% |
| Black / African American | 0 | 0.0% |
| Hawaiian / Pacific | 0 | 0.0% |
| Hispanic or Latino | 0 | 0.0% |
| Native / Alaskan | 36 | 90.0% |
| White / Caucasian | 4 | 10.0% |
| Two or more Races | 0 | 0.0% |
| Some other Race | 0 | 0.0% |
| Total | 40 | 100.0% |
Ancestry in Tatitlek
The most populous ancestries reported in Tatitlek are Aleut (34 | 85.0%), Inupiat (3 | 7.5%), Alaska Native (2 | 5.0%), German (2 | 5.0%), and Norwegian (1 | 2.5%), together accounting for 105.0% of all Tatitlek residents.
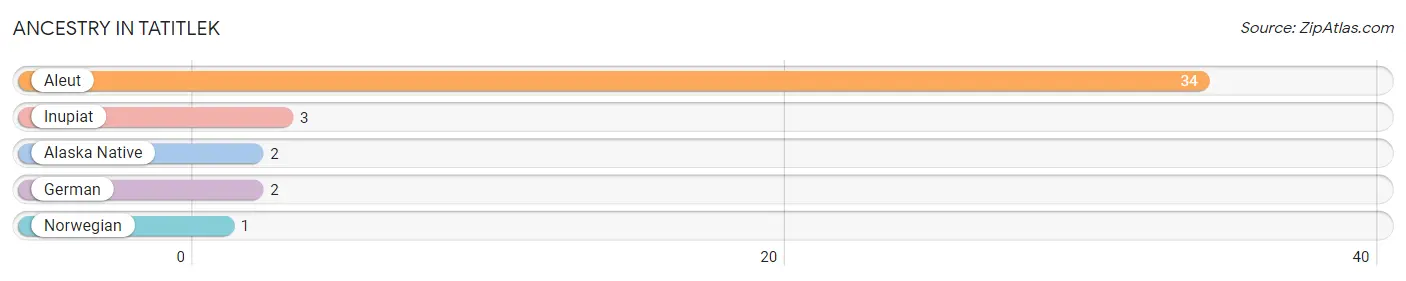
| Ancestry | # Population | % Population |
| Alaska Native | 2 | 5.0% |
| Aleut | 34 | 85.0% |
| German | 2 | 5.0% |
| Inupiat | 3 | 7.5% |
| Norwegian | 1 | 2.5% | View All 5 Rows |
Immigrants in Tatitlek
The most numerous immigrant groups reported in Tatitlek came from Asia (2 | 5.0%), South Eastern Asia (2 | 5.0%), and Thailand (2 | 5.0%), together accounting for 15.0% of all Tatitlek residents.
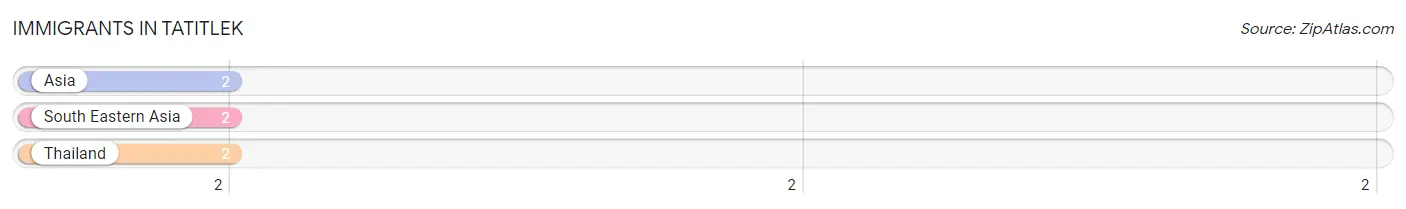
| Immigration Origin | # Population | % Population |
| Asia | 2 | 5.0% |
| South Eastern Asia | 2 | 5.0% |
| Thailand | 2 | 5.0% | View All 3 Rows |
Sex and Age in Tatitlek
Sex and Age in Tatitlek
The most populous age groups in Tatitlek are 10 to 14 Years (5 | 31.2%) for men and 15 to 19 Years (6 | 25.0%) for women.
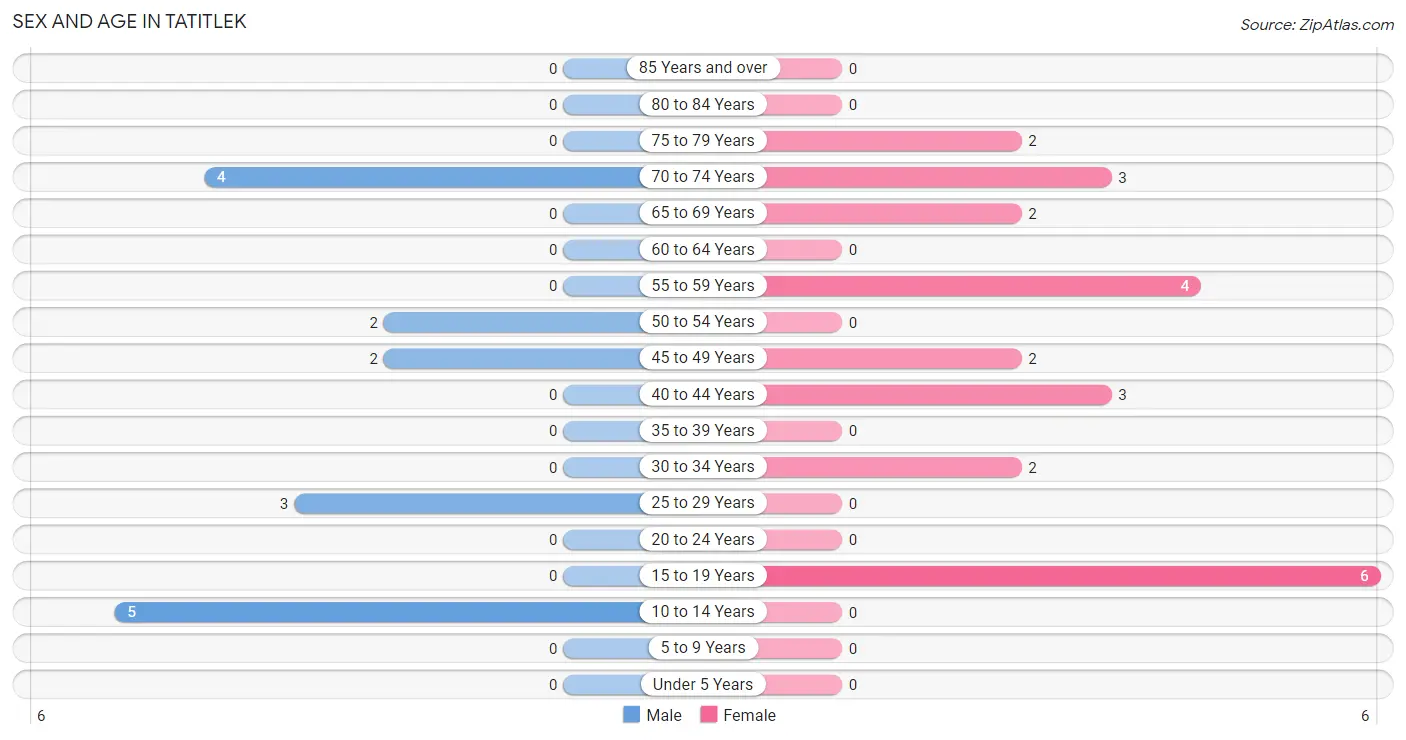
| Age Bracket | Male | Female |
| Under 5 Years | 0 (0.0%) | 0 (0.0%) |
| 5 to 9 Years | 0 (0.0%) | 0 (0.0%) |
| 10 to 14 Years | 5 (31.2%) | 0 (0.0%) |
| 15 to 19 Years | 0 (0.0%) | 6 (25.0%) |
| 20 to 24 Years | 0 (0.0%) | 0 (0.0%) |
| 25 to 29 Years | 3 (18.8%) | 0 (0.0%) |
| 30 to 34 Years | 0 (0.0%) | 2 (8.3%) |
| 35 to 39 Years | 0 (0.0%) | 0 (0.0%) |
| 40 to 44 Years | 0 (0.0%) | 3 (12.5%) |
| 45 to 49 Years | 2 (12.5%) | 2 (8.3%) |
| 50 to 54 Years | 2 (12.5%) | 0 (0.0%) |
| 55 to 59 Years | 0 (0.0%) | 4 (16.7%) |
| 60 to 64 Years | 0 (0.0%) | 0 (0.0%) |
| 65 to 69 Years | 0 (0.0%) | 2 (8.3%) |
| 70 to 74 Years | 4 (25.0%) | 3 (12.5%) |
| 75 to 79 Years | 0 (0.0%) | 2 (8.3%) |
| 80 to 84 Years | 0 (0.0%) | 0 (0.0%) |
| 85 Years and over | 0 (0.0%) | 0 (0.0%) |
| Total | 16 (100.0%) | 24 (100.0%) |
Families and Households in Tatitlek
Median Family Size in Tatitlek
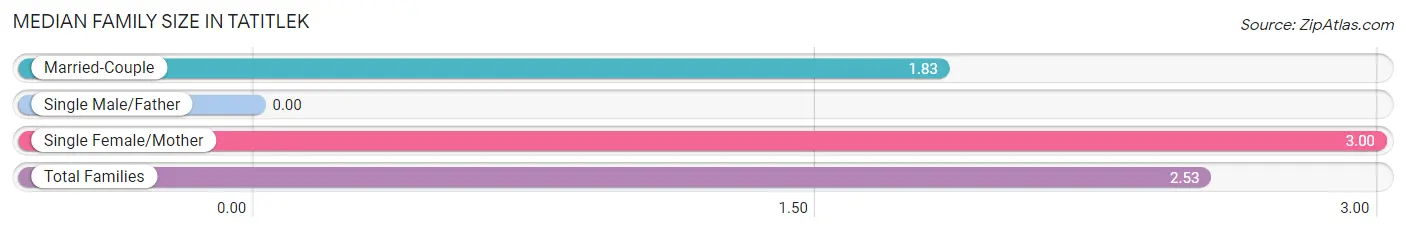
| Family Type | # Families | Family Size |
| Married-Couple | 6 (40.0%) | 1.83 |
| Single Male/Father | 0 (0.0%) | - |
| Single Female/Mother | 9 (60.0%) | 3.00 |
| Total Families | 15 (100.0%) | 2.53 |
Median Household Size in Tatitlek
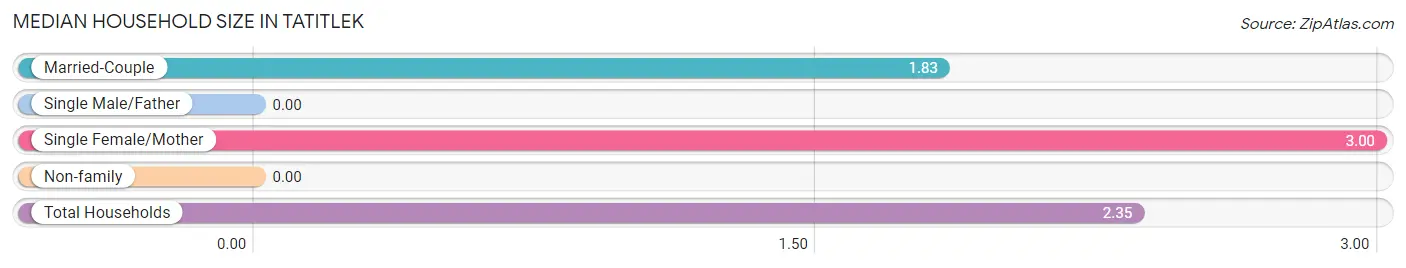
| Household Type | # Households | Household Size |
| Married-Couple | 6 (35.3%) | 1.83 |
| Single Male/Father | 0 (0.0%) | - |
| Single Female/Mother | 9 (52.9%) | 3.00 |
| Non-family | 2 (11.8%) | - |
| Total Households | 17 (100.0%) | 2.35 |
Household Size by Marriage Status in Tatitlek
Out of a total of 17 households in Tatitlek, 15 (88.2%) are family households, while 2 (11.8%) are nonfamily households. The most numerous type of family households are 2-person households, comprising 14, and the most common type of nonfamily households are 1-person households, comprising 2.
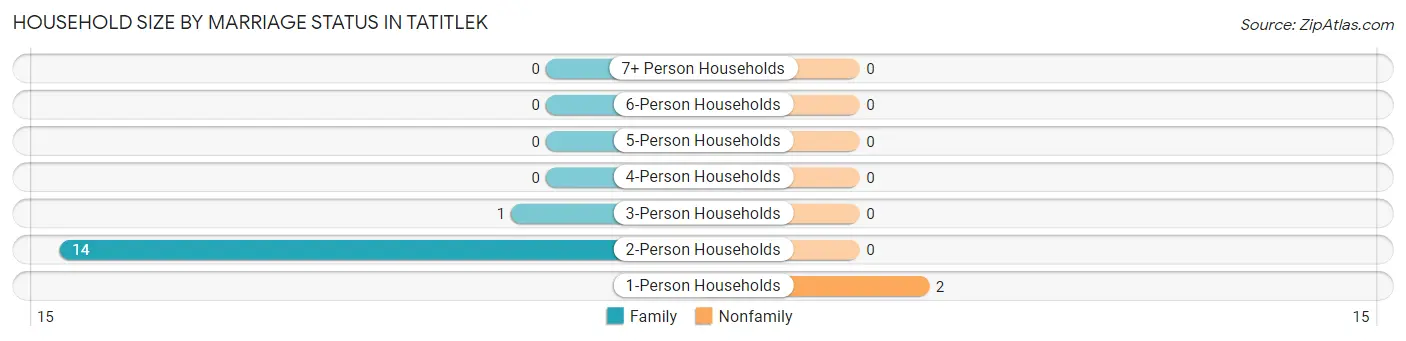
| Household Size | Family Households | Nonfamily Households |
| 1-Person Households | - | 2 (11.8%) |
| 2-Person Households | 14 (82.4%) | 0 (0.0%) |
| 3-Person Households | 1 (5.9%) | 0 (0.0%) |
| 4-Person Households | 0 (0.0%) | 0 (0.0%) |
| 5-Person Households | 0 (0.0%) | 0 (0.0%) |
| 6-Person Households | 0 (0.0%) | 0 (0.0%) |
| 7+ Person Households | 0 (0.0%) | 0 (0.0%) |
| Total | 15 (88.2%) | 2 (11.8%) |
Female Fertility in Tatitlek
Fertility by Age in Tatitlek
| Age Bracket | Women with Births | Births / 1,000 Women |
| 15 to 19 years | 0 (0.0%) | 0.0 |
| 20 to 34 years | 0 (0.0%) | 0.0 |
| 35 to 50 years | 0 (0.0%) | 0.0 |
| Total | 0 (0.0%) | 0.0 |
Fertility by Age by Marriage Status in Tatitlek
| Age Bracket | Married | Unmarried |
| 15 to 19 years | 0 (0.0%) | 0 (0.0%) |
| 20 to 34 years | 0 (0.0%) | 0 (0.0%) |
| 35 to 50 years | 0 (0.0%) | 0 (0.0%) |
| Total | 0 (0.0%) | 0 (0.0%) |
Fertility by Education in Tatitlek
| Educational Attainment | Women with Births | Births / 1,000 Women |
| Less than High School | 0 (0.0%) | 0.0 |
| High School Diploma | 0 (0.0%) | 0.0 |
| College or Associate's Degree | 0 (0.0%) | 0.0 |
| Bachelor's Degree | 0 (0.0%) | 0.0 |
| Graduate Degree | 0 (0.0%) | 0.0 |
| Total | 0 (0.0%) | 0.0 |
Fertility by Education by Marriage Status in Tatitlek
| Educational Attainment | Married | Unmarried |
| Less than High School | 0 (0.0%) | 0 (0.0%) |
| High School Diploma | 0 (0.0%) | 0 (0.0%) |
| College or Associate's Degree | 0 (0.0%) | 0 (0.0%) |
| Bachelor's Degree | 0 (0.0%) | 0 (0.0%) |
| Graduate Degree | 0 (0.0%) | 0 (0.0%) |
| Total | 0 (0.0%) | 0 (0.0%) |
Employment Characteristics in Tatitlek
Employment by Class of Employer in Tatitlek
Among the 15 employed individuals in Tatitlek, state government employees (5 | 33.3%), federal government employees (5 | 33.3%), and not-for-profit organizations (3 | 20.0%) make up the most common classes of employment.
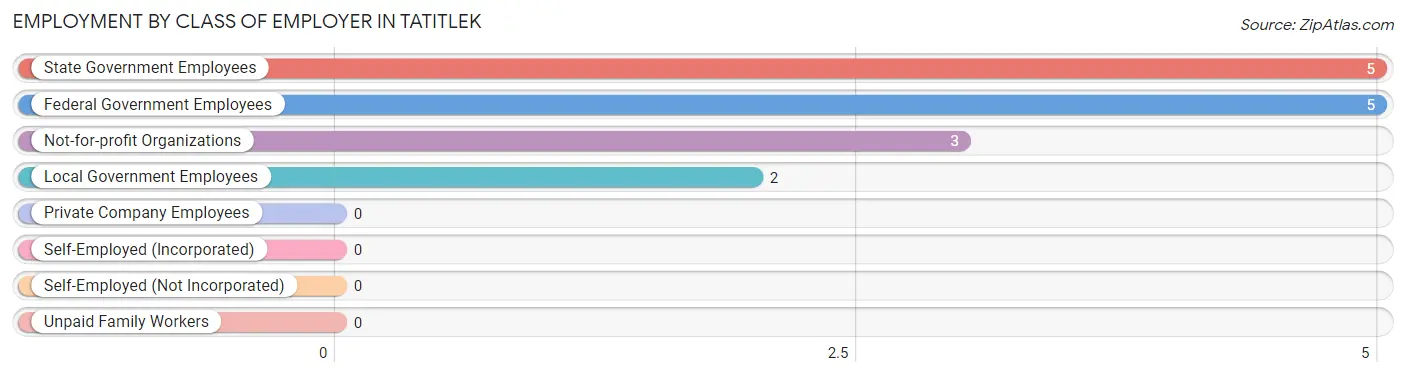
| Employer Class | # Employees | % Employees |
| Private Company Employees | 0 | 0.0% |
| Self-Employed (Incorporated) | 0 | 0.0% |
| Self-Employed (Not Incorporated) | 0 | 0.0% |
| Not-for-profit Organizations | 3 | 20.0% |
| Local Government Employees | 2 | 13.3% |
| State Government Employees | 5 | 33.3% |
| Federal Government Employees | 5 | 33.3% |
| Unpaid Family Workers | 0 | 0.0% |
| Total | 15 | 100.0% |
Employment Status by Age in Tatitlek
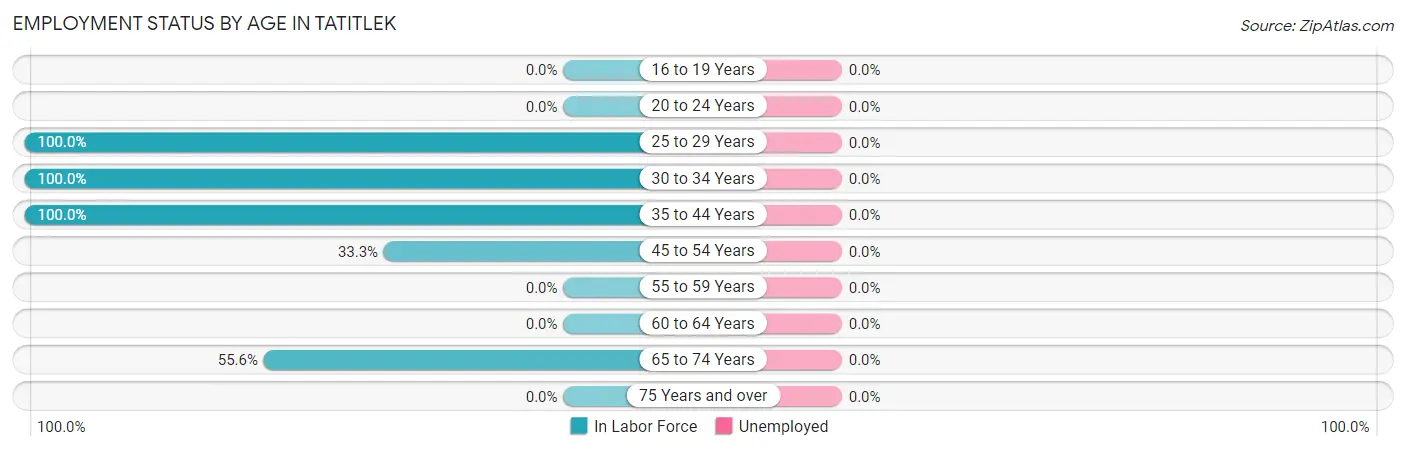
| Age Bracket | In Labor Force | Unemployed |
| 16 to 19 Years | 0 (0.0%) | 0 (0.0%) |
| 20 to 24 Years | 0 (0.0%) | 0 (0.0%) |
| 25 to 29 Years | 3 (100.0%) | 0 (0.0%) |
| 30 to 34 Years | 2 (100.0%) | 0 (0.0%) |
| 35 to 44 Years | 3 (100.0%) | 0 (0.0%) |
| 45 to 54 Years | 2 (33.3%) | 0 (0.0%) |
| 55 to 59 Years | 0 (0.0%) | 0 (0.0%) |
| 60 to 64 Years | 0 (0.0%) | 0 (0.0%) |
| 65 to 74 Years | 5 (55.6%) | 0 (0.0%) |
| 75 Years and over | 0 (0.0%) | 0 (0.0%) |
| Total | 15 (42.9%) | 0 (0.0%) |
Employment Status by Educational Attainment in Tatitlek
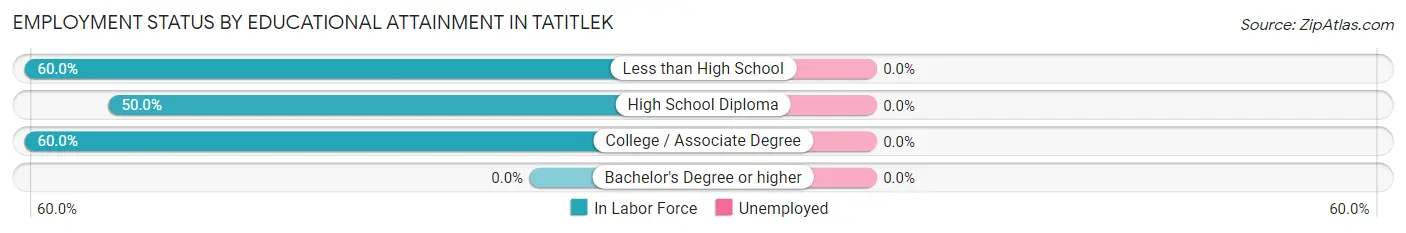
| Educational Attainment | In Labor Force | Unemployed |
| Less than High School | 3 (60.0%) | 0 (0.0%) |
| High School Diploma | 4 (50.0%) | 0 (0.0%) |
| College / Associate Degree | 3 (60.0%) | 0 (0.0%) |
| Bachelor's Degree or higher | 0 (0.0%) | 0 (0.0%) |
| Total | 10 (55.6%) | 0 (0.0%) |
Employment Occupations by Sex in Tatitlek
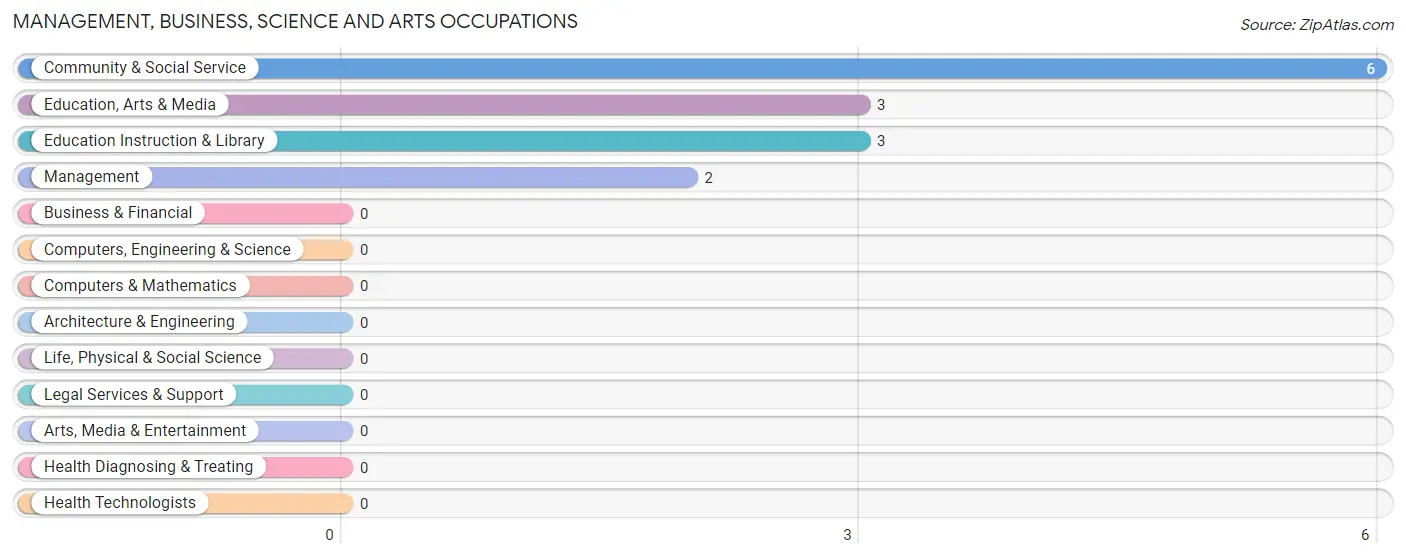
Management, Business, Science and Arts Occupations
The most common Management, Business, Science and Arts occupations in Tatitlek are Community & Social Service (6 | 40.0%), Education, Arts & Media (3 | 20.0%), Education Instruction & Library (3 | 20.0%), and Management (2 | 13.3%).
Management, Business, Science and Arts Occupations by Sex
| Occupation | Male | Female |
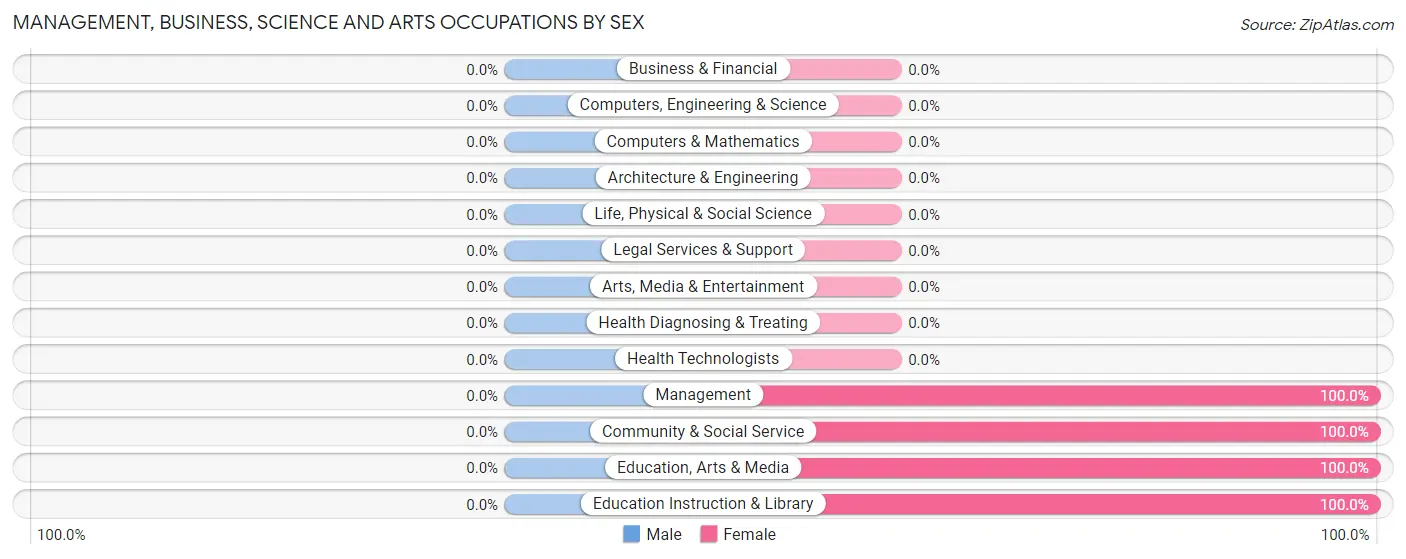
| Management | 0 (0.0%) | 2 (100.0%) |
| Business & Financial | 0 (0.0%) | 0 (0.0%) |
| Computers, Engineering & Science | 0 (0.0%) | 0 (0.0%) |
| Computers & Mathematics | 0 (0.0%) | 0 (0.0%) |
| Architecture & Engineering | 0 (0.0%) | 0 (0.0%) |
| Life, Physical & Social Science | 0 (0.0%) | 0 (0.0%) |
| Community & Social Service | 0 (0.0%) | 6 (100.0%) |
| Education, Arts & Media | 0 (0.0%) | 3 (100.0%) |
| Legal Services & Support | 0 (0.0%) | 0 (0.0%) |
| Education Instruction & Library | 0 (0.0%) | 3 (100.0%) |
| Arts, Media & Entertainment | 0 (0.0%) | 0 (0.0%) |
| Health Diagnosing & Treating | 0 (0.0%) | 0 (0.0%) |
| Health Technologists | 0 (0.0%) | 0 (0.0%) |
| Total (Category) | 0 (0.0%) | 8 (100.0%) |
| Total (Overall) | 5 (33.3%) | 10 (66.7%) |
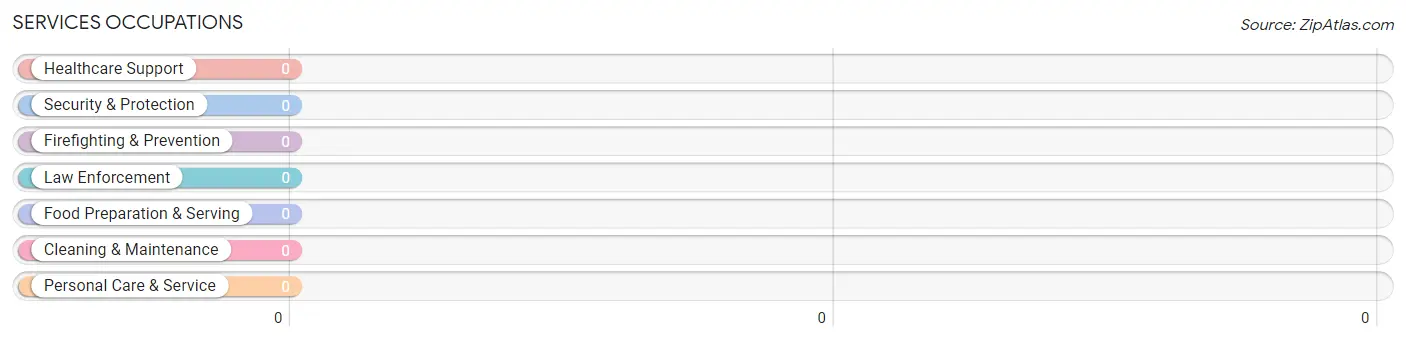
Services Occupations
Services Occupations by Sex
| Occupation | Male | Female |
| Healthcare Support | 0 (0.0%) | 0 (0.0%) |
| Security & Protection | 0 (0.0%) | 0 (0.0%) |
| Firefighting & Prevention | 0 (0.0%) | 0 (0.0%) |
| Law Enforcement | 0 (0.0%) | 0 (0.0%) |
| Food Preparation & Serving | 0 (0.0%) | 0 (0.0%) |
| Cleaning & Maintenance | 0 (0.0%) | 0 (0.0%) |
| Personal Care & Service | 0 (0.0%) | 0 (0.0%) |
| Total (Category) | 0 (0.0%) | 0 (0.0%) |
| Total (Overall) | 5 (33.3%) | 10 (66.7%) |
Sales and Office Occupations
The most common Sales and Office occupations in Tatitlek are , and Office & Administration (2 | 13.3%).
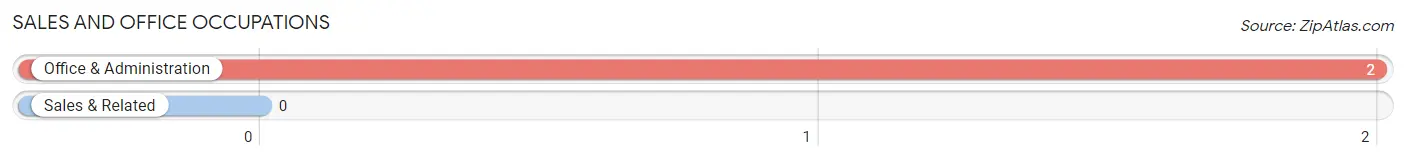
Sales and Office Occupations by Sex

| Occupation | Male | Female |
| Sales & Related | 0 (0.0%) | 0 (0.0%) |
| Office & Administration | 0 (0.0%) | 2 (100.0%) |
| Total (Category) | 0 (0.0%) | 2 (100.0%) |
| Total (Overall) | 5 (33.3%) | 10 (66.7%) |
Natural Resources, Construction and Maintenance Occupations
The most common Natural Resources, Construction and Maintenance occupations in Tatitlek are , and Construction & Extraction (2 | 13.3%).
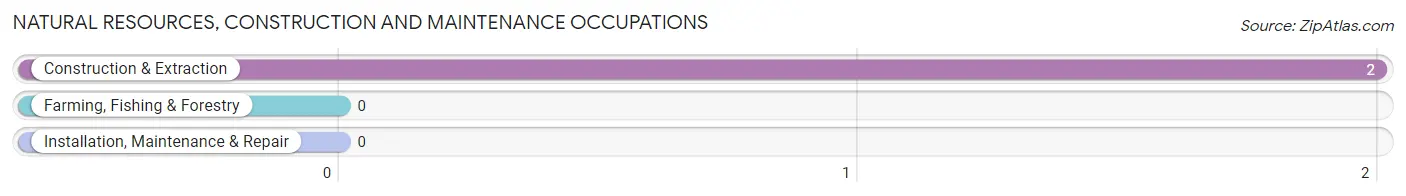
Natural Resources, Construction and Maintenance Occupations by Sex
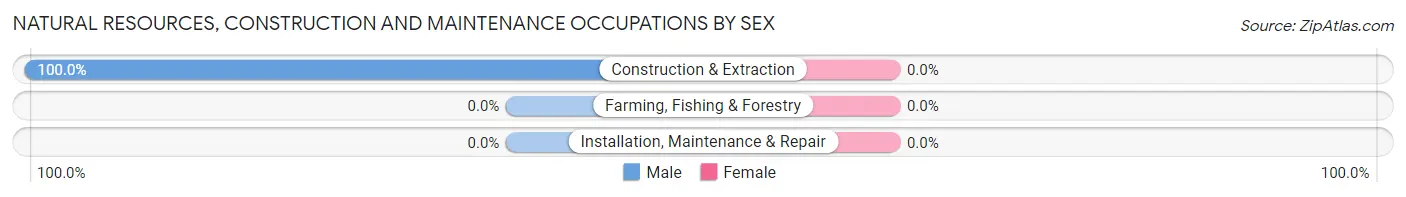
| Occupation | Male | Female |
| Farming, Fishing & Forestry | 0 (0.0%) | 0 (0.0%) |
| Construction & Extraction | 2 (100.0%) | 0 (0.0%) |
| Installation, Maintenance & Repair | 0 (0.0%) | 0 (0.0%) |
| Total (Category) | 2 (100.0%) | 0 (0.0%) |
| Total (Overall) | 5 (33.3%) | 10 (66.7%) |
Production, Transportation and Moving Occupations
The most common Production, Transportation and Moving occupations in Tatitlek are , and Production (3 | 20.0%).
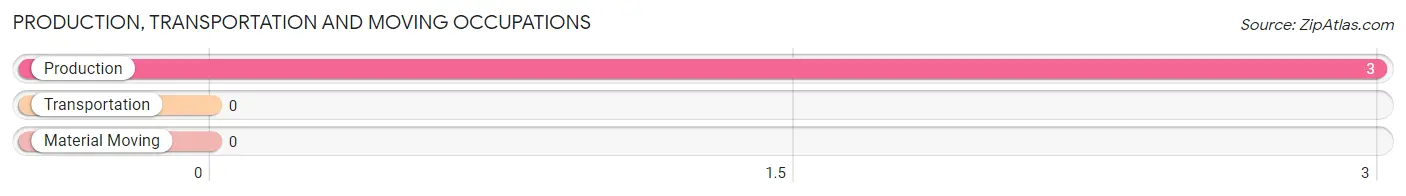
Production, Transportation and Moving Occupations by Sex
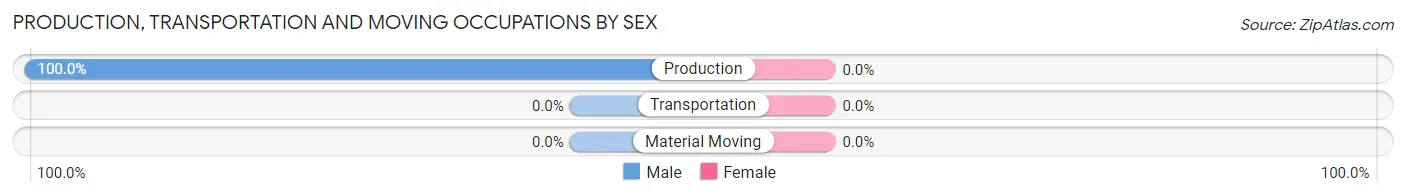
| Occupation | Male | Female |
| Production | 3 (100.0%) | 0 (0.0%) |
| Transportation | 0 (0.0%) | 0 (0.0%) |
| Material Moving | 0 (0.0%) | 0 (0.0%) |
| Total (Category) | 3 (100.0%) | 0 (0.0%) |
| Total (Overall) | 5 (33.3%) | 10 (66.7%) |
Employment Industries by Sex in Tatitlek
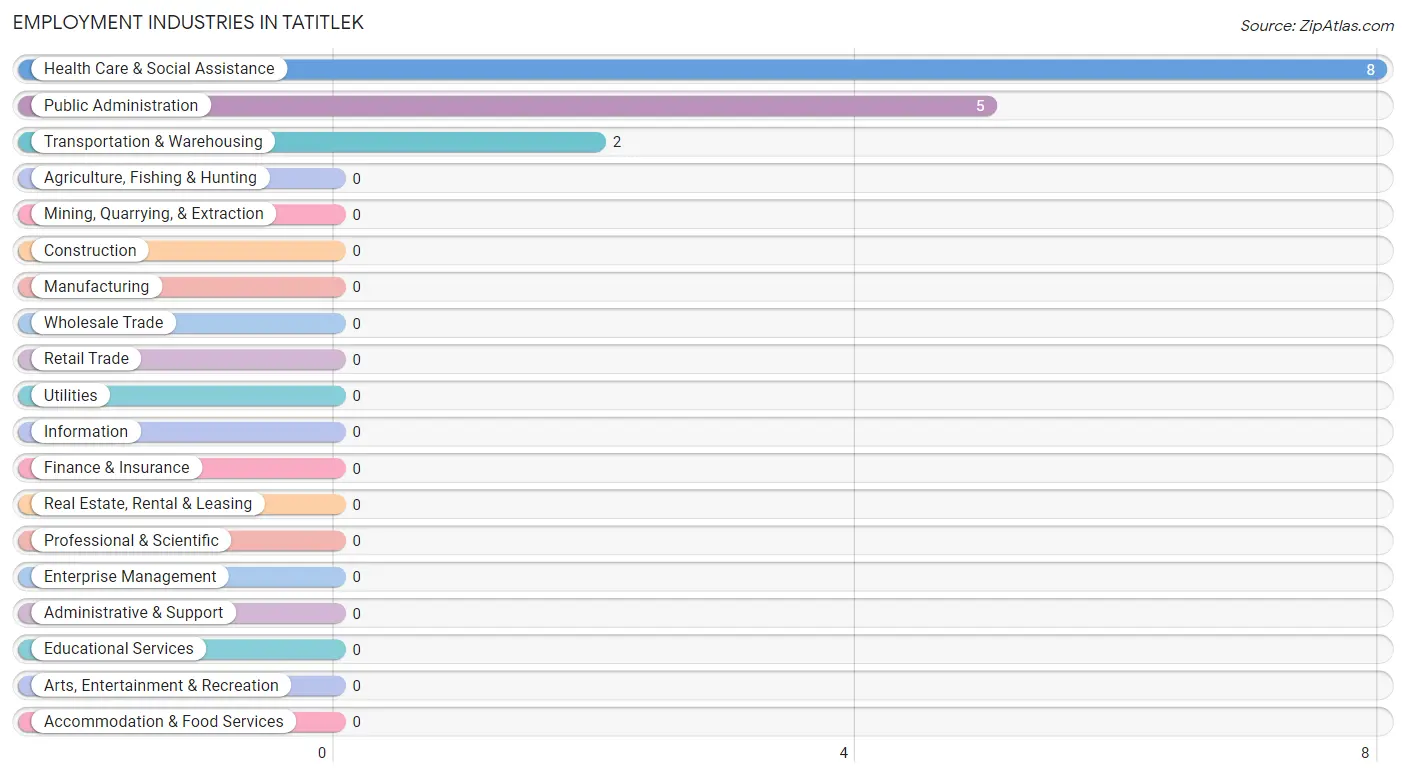
Employment Industries in Tatitlek
The major employment industries in Tatitlek include Health Care & Social Assistance (8 | 53.3%), Public Administration (5 | 33.3%), and Transportation & Warehousing (2 | 13.3%).
Employment Industries by Sex in Tatitlek
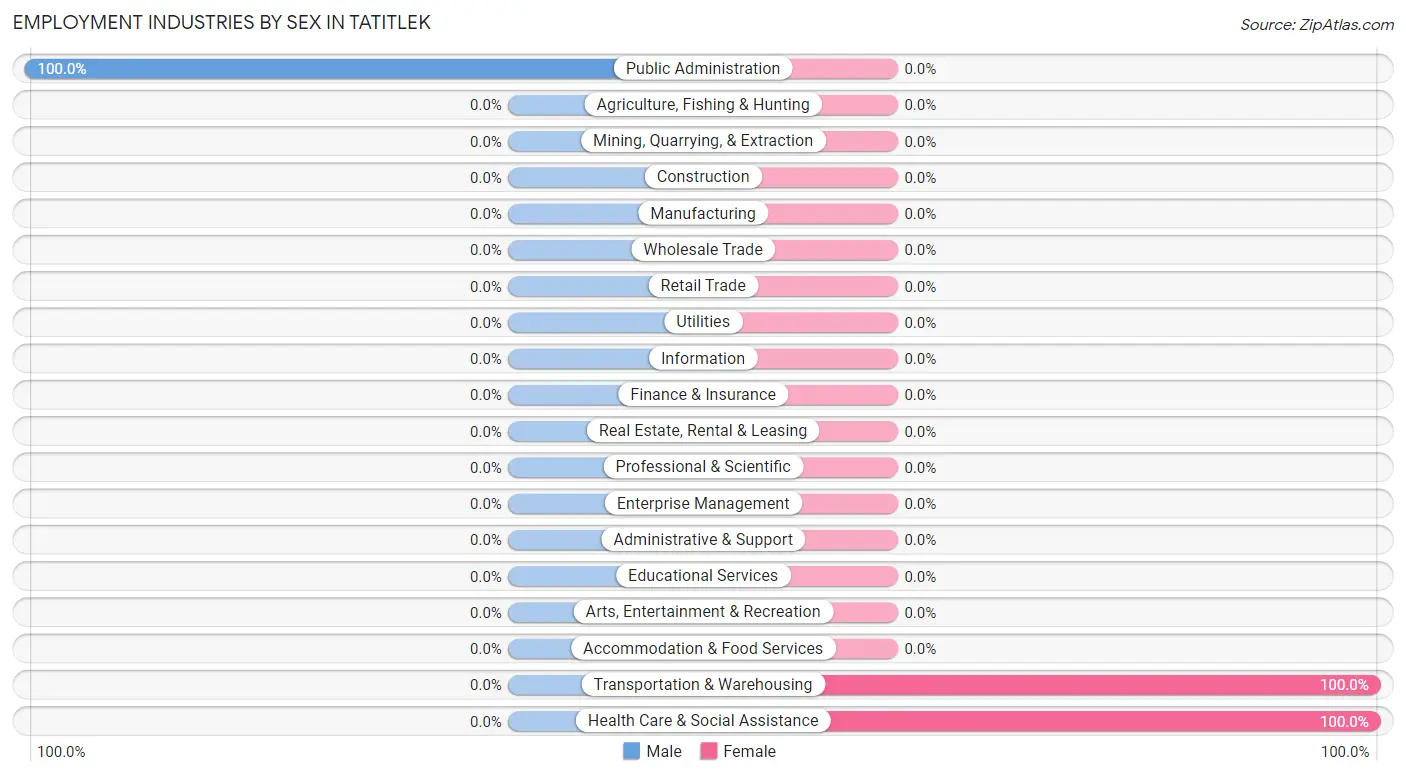
| Industry | Male | Female |
| Agriculture, Fishing & Hunting | 0 (0.0%) | 0 (0.0%) |
| Mining, Quarrying, & Extraction | 0 (0.0%) | 0 (0.0%) |
| Construction | 0 (0.0%) | 0 (0.0%) |
| Manufacturing | 0 (0.0%) | 0 (0.0%) |
| Wholesale Trade | 0 (0.0%) | 0 (0.0%) |
| Retail Trade | 0 (0.0%) | 0 (0.0%) |
| Transportation & Warehousing | 0 (0.0%) | 2 (100.0%) |
| Utilities | 0 (0.0%) | 0 (0.0%) |
| Information | 0 (0.0%) | 0 (0.0%) |
| Finance & Insurance | 0 (0.0%) | 0 (0.0%) |
| Real Estate, Rental & Leasing | 0 (0.0%) | 0 (0.0%) |
| Professional & Scientific | 0 (0.0%) | 0 (0.0%) |
| Enterprise Management | 0 (0.0%) | 0 (0.0%) |
| Administrative & Support | 0 (0.0%) | 0 (0.0%) |
| Educational Services | 0 (0.0%) | 0 (0.0%) |
| Health Care & Social Assistance | 0 (0.0%) | 8 (100.0%) |
| Arts, Entertainment & Recreation | 0 (0.0%) | 0 (0.0%) |
| Accommodation & Food Services | 0 (0.0%) | 0 (0.0%) |
| Public Administration | 5 (100.0%) | 0 (0.0%) |
| Total | 5 (33.3%) | 10 (66.7%) |
Education in Tatitlek
School Enrollment in Tatitlek
The most common levels of schooling among the 14 students in Tatitlek are high school (6 | 42.9%), middle school (5 | 35.7%), and college / undergraduate (3 | 21.4%).
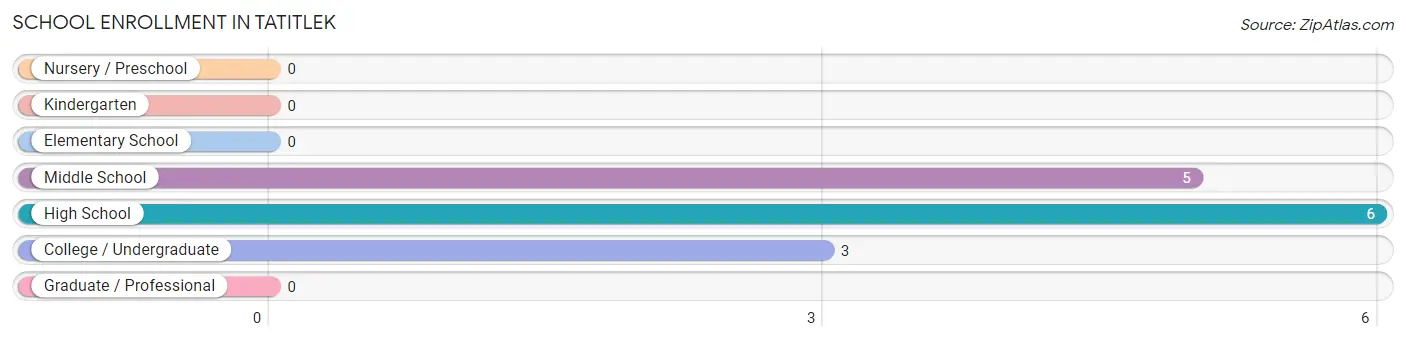
| School Level | # Students | % Students |
| Nursery / Preschool | 0 | 0.0% |
| Kindergarten | 0 | 0.0% |
| Elementary School | 0 | 0.0% |
| Middle School | 5 | 35.7% |
| High School | 6 | 42.9% |
| College / Undergraduate | 3 | 21.4% |
| Graduate / Professional | 0 | 0.0% |
| Total | 14 | 100.0% |
School Enrollment by Age by Funding Source in Tatitlek
Out of a total of 14 students who are enrolled in schools in Tatitlek, 3 (21.4%) attend a private institution, while the remaining 11 (78.6%) are enrolled in public schools. The age group of 35 years and over has the highest likelihood of being enrolled in private schools, with 3 (100.0% in the age bracket) enrolled. Conversely, the age group of 10 to 14 year olds has the lowest likelihood of being enrolled in a private school, with 5 (100.0% in the age bracket) attending a public institution.
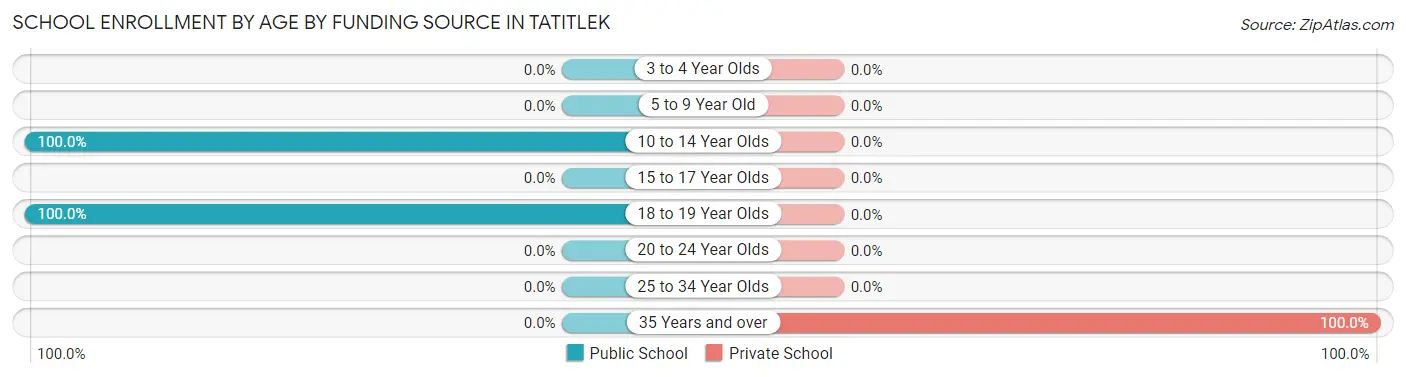
| Age Bracket | Public School | Private School |
| 3 to 4 Year Olds | 0 (0.0%) | 0 (0.0%) |
| 5 to 9 Year Old | 0 (0.0%) | 0 (0.0%) |
| 10 to 14 Year Olds | 5 (100.0%) | 0 (0.0%) |
| 15 to 17 Year Olds | 0 (0.0%) | 0 (0.0%) |
| 18 to 19 Year Olds | 6 (100.0%) | 0 (0.0%) |
| 20 to 24 Year Olds | 0 (0.0%) | 0 (0.0%) |
| 25 to 34 Year Olds | 0 (0.0%) | 0 (0.0%) |
| 35 Years and over | 0 (0.0%) | 3 (100.0%) |
| Total | 11 (78.6%) | 3 (21.4%) |
Educational Attainment by Field of Study in Tatitlek
| Field of Study | # Graduates | % Graduates |
| Computers & Mathematics | 0 | 0.0% |
| Bio, Nature & Agricultural | 0 | 0.0% |
| Physical & Health Sciences | 0 | 0.0% |
| Psychology | 0 | 0.0% |
| Social Sciences | 0 | 0.0% |
| Engineering | 0 | 0.0% |
| Multidisciplinary Studies | 0 | 0.0% |
| Science & Technology | 0 | 0.0% |
| Business | 0 | 0.0% |
| Education | 0 | 0.0% |
| Literature & Languages | 0 | 0.0% |
| Liberal Arts & History | 0 | 0.0% |
| Visual & Performing Arts | 0 | 0.0% |
| Communications | 0 | 0.0% |
| Arts & Humanities | 0 | 0.0% |
| Total | 0 | 0.0% |
Transportation & Commute in Tatitlek
Vehicle Availability by Sex in Tatitlek
The most prevalent vehicle ownership categories in Tatitlek are males with no vehicle (5, accounting for 100.0%) and females with no vehicle (6, making up 50.0%).
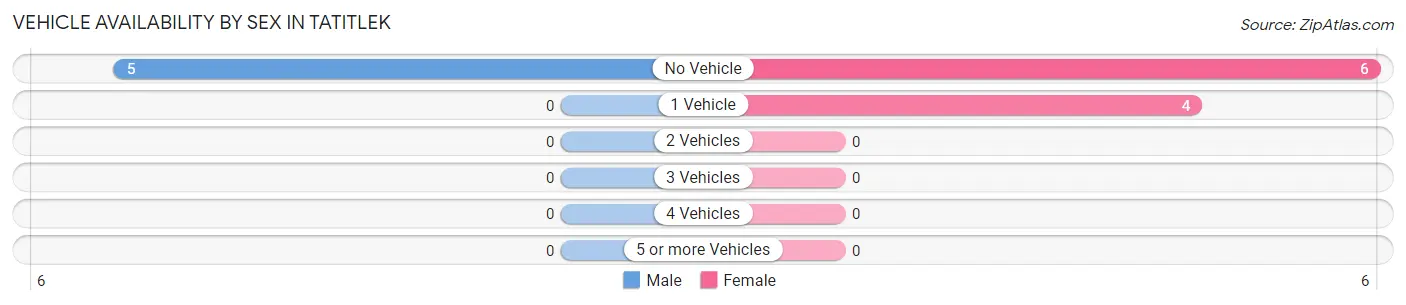
| Vehicles Available | Male | Female |
| No Vehicle | 5 (100.0%) | 6 (60.0%) |
| 1 Vehicle | 0 (0.0%) | 4 (40.0%) |
| 2 Vehicles | 0 (0.0%) | 0 (0.0%) |
| 3 Vehicles | 0 (0.0%) | 0 (0.0%) |
| 4 Vehicles | 0 (0.0%) | 0 (0.0%) |
| 5 or more Vehicles | 0 (0.0%) | 0 (0.0%) |
| Total | 5 (100.0%) | 10 (100.0%) |
Commute Time in Tatitlek
The most frequently occuring commute durations in Tatitlek are 5 to 9 minutes (11 commuters, 73.3%), less than 5 minutes (2 commuters, 13.3%), and 10 to 14 minutes (2 commuters, 13.3%).
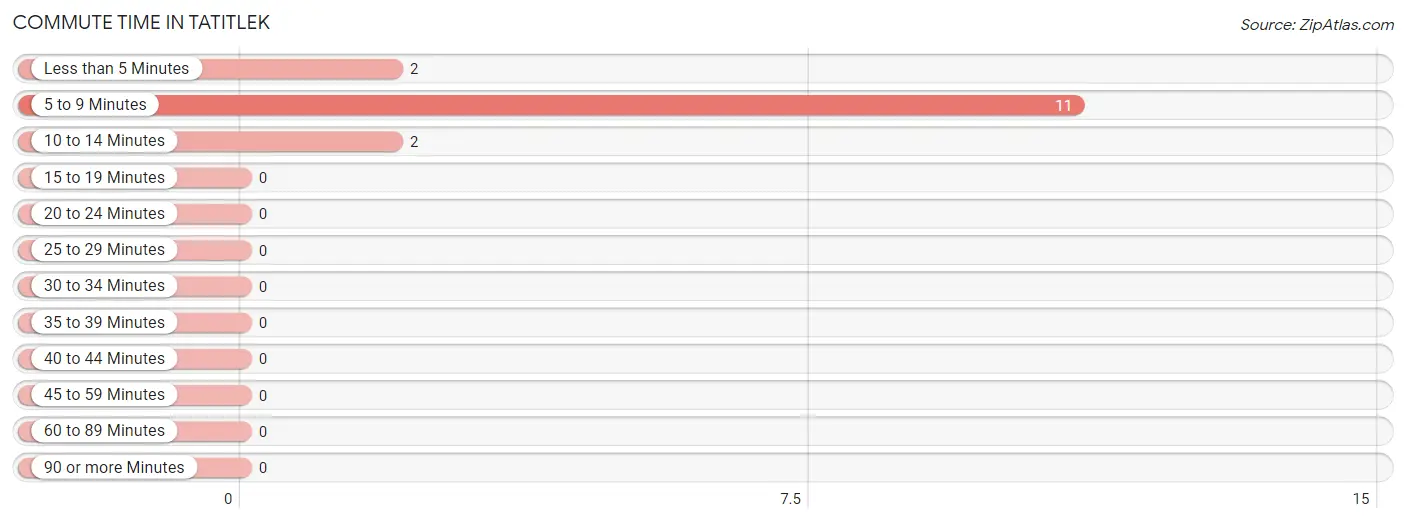
| Commute Time | # Commuters | % Commuters |
| Less than 5 Minutes | 2 | 13.3% |
| 5 to 9 Minutes | 11 | 73.3% |
| 10 to 14 Minutes | 2 | 13.3% |
| 15 to 19 Minutes | 0 | 0.0% |
| 20 to 24 Minutes | 0 | 0.0% |
| 25 to 29 Minutes | 0 | 0.0% |
| 30 to 34 Minutes | 0 | 0.0% |
| 35 to 39 Minutes | 0 | 0.0% |
| 40 to 44 Minutes | 0 | 0.0% |
| 45 to 59 Minutes | 0 | 0.0% |
| 60 to 89 Minutes | 0 | 0.0% |
| 90 or more Minutes | 0 | 0.0% |
Commute Time by Sex in Tatitlek
The most common commute times in Tatitlek are 5 to 9 minutes (5 commuters, 100.0%) for males and 5 to 9 minutes (6 commuters, 60.0%) for females.
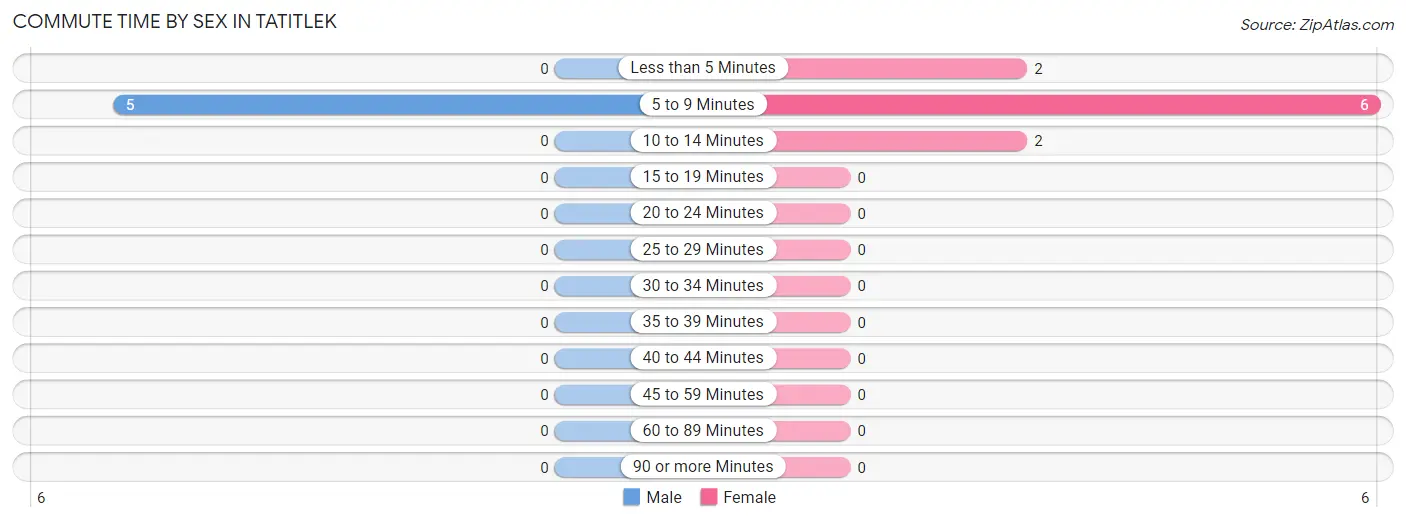
| Commute Time | Male | Female |
| Less than 5 Minutes | 0 (0.0%) | 2 (20.0%) |
| 5 to 9 Minutes | 5 (100.0%) | 6 (60.0%) |
| 10 to 14 Minutes | 0 (0.0%) | 2 (20.0%) |
| 15 to 19 Minutes | 0 (0.0%) | 0 (0.0%) |
| 20 to 24 Minutes | 0 (0.0%) | 0 (0.0%) |
| 25 to 29 Minutes | 0 (0.0%) | 0 (0.0%) |
| 30 to 34 Minutes | 0 (0.0%) | 0 (0.0%) |
| 35 to 39 Minutes | 0 (0.0%) | 0 (0.0%) |
| 40 to 44 Minutes | 0 (0.0%) | 0 (0.0%) |
| 45 to 59 Minutes | 0 (0.0%) | 0 (0.0%) |
| 60 to 89 Minutes | 0 (0.0%) | 0 (0.0%) |
| 90 or more Minutes | 0 (0.0%) | 0 (0.0%) |
Time of Departure to Work by Sex in Tatitlek
The most frequent times of departure to work in Tatitlek are 12:00 PM to 3:59 PM (3, 60.0%) for males and 8:00 AM to 8:29 AM (5, 50.0%) for females.
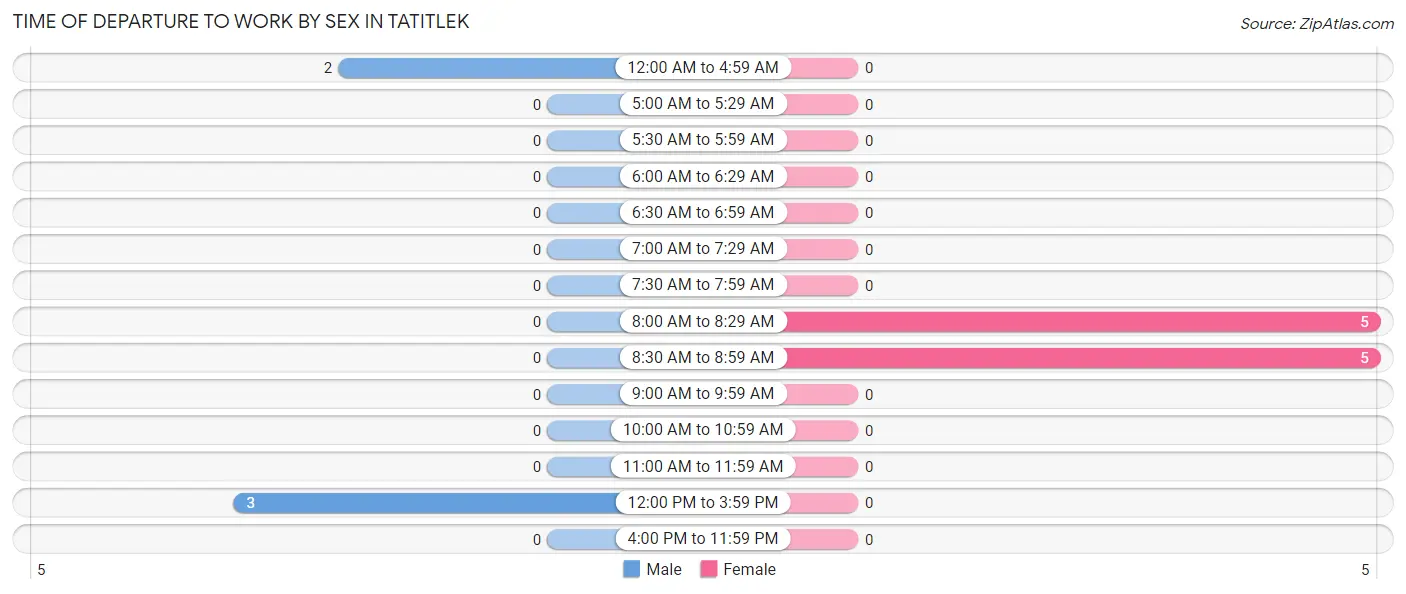
| Time of Departure | Male | Female |
| 12:00 AM to 4:59 AM | 2 (40.0%) | 0 (0.0%) |
| 5:00 AM to 5:29 AM | 0 (0.0%) | 0 (0.0%) |
| 5:30 AM to 5:59 AM | 0 (0.0%) | 0 (0.0%) |
| 6:00 AM to 6:29 AM | 0 (0.0%) | 0 (0.0%) |
| 6:30 AM to 6:59 AM | 0 (0.0%) | 0 (0.0%) |
| 7:00 AM to 7:29 AM | 0 (0.0%) | 0 (0.0%) |
| 7:30 AM to 7:59 AM | 0 (0.0%) | 0 (0.0%) |
| 8:00 AM to 8:29 AM | 0 (0.0%) | 5 (50.0%) |
| 8:30 AM to 8:59 AM | 0 (0.0%) | 5 (50.0%) |
| 9:00 AM to 9:59 AM | 0 (0.0%) | 0 (0.0%) |
| 10:00 AM to 10:59 AM | 0 (0.0%) | 0 (0.0%) |
| 11:00 AM to 11:59 AM | 0 (0.0%) | 0 (0.0%) |
| 12:00 PM to 3:59 PM | 3 (60.0%) | 0 (0.0%) |
| 4:00 PM to 11:59 PM | 0 (0.0%) | 0 (0.0%) |
| Total | 5 (100.0%) | 10 (100.0%) |
Housing Occupancy in Tatitlek
Occupancy by Ownership in Tatitlek
Of the total 17 dwellings in Tatitlek, owner-occupied units account for 10 (58.8%), while renter-occupied units make up 7 (41.2%).
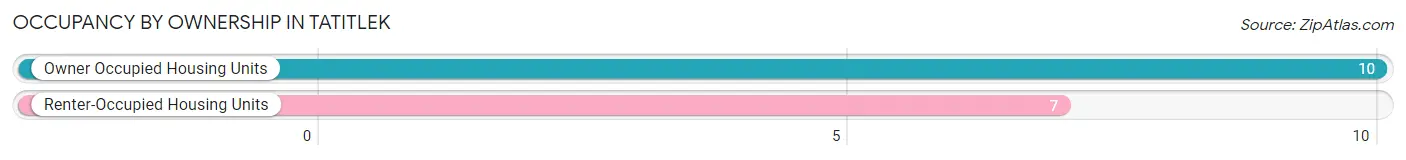
| Occupancy | # Housing Units | % Housing Units |
| Owner Occupied Housing Units | 10 | 58.8% |
| Renter-Occupied Housing Units | 7 | 41.2% |
| Total Occupied Housing Units | 17 | 100.0% |
Occupancy by Household Size in Tatitlek
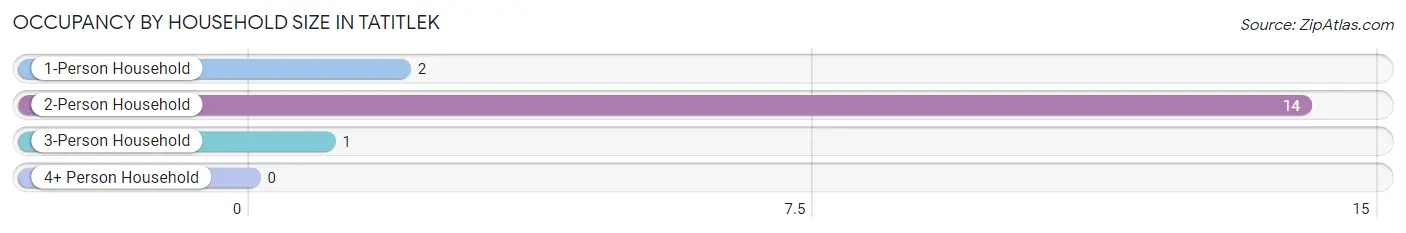
| Household Size | # Housing Units | % Housing Units |
| 1-Person Household | 2 | 11.8% |
| 2-Person Household | 14 | 82.4% |
| 3-Person Household | 1 | 5.9% |
| 4+ Person Household | 0 | 0.0% |
| Total Housing Units | 17 | 100.0% |
Occupancy by Ownership by Household Size in Tatitlek
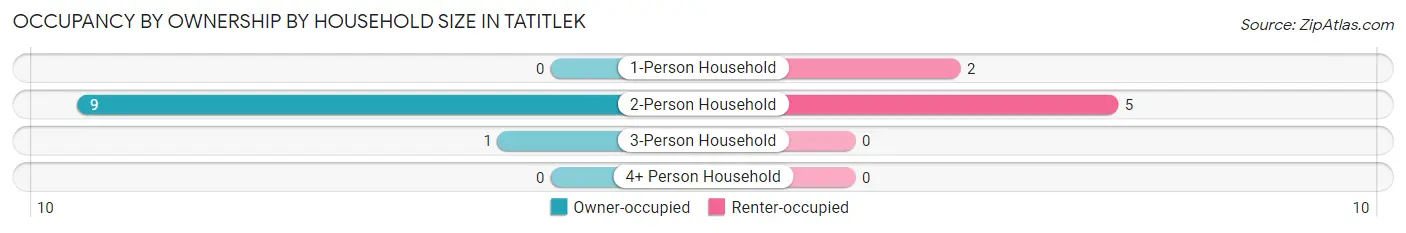
| Household Size | Owner-occupied | Renter-occupied |
| 1-Person Household | 0 (0.0%) | 2 (100.0%) |
| 2-Person Household | 9 (64.3%) | 5 (35.7%) |
| 3-Person Household | 1 (100.0%) | 0 (0.0%) |
| 4+ Person Household | 0 (0.0%) | 0 (0.0%) |
| Total Housing Units | 10 (58.8%) | 7 (41.2%) |
Occupancy by Educational Attainment in Tatitlek
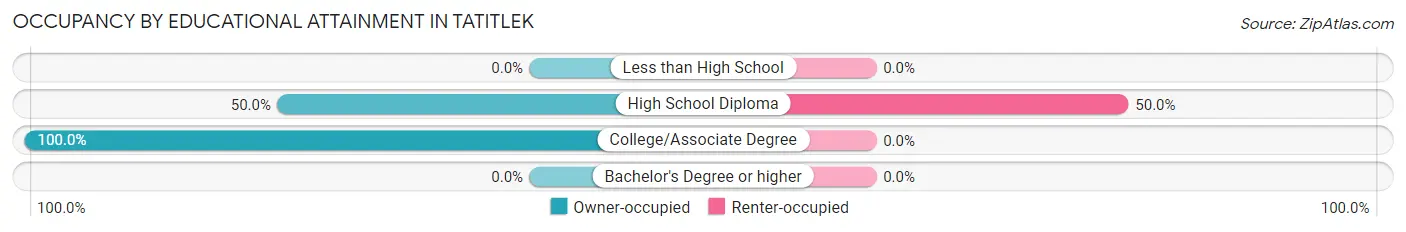
| Household Size | Owner-occupied | Renter-occupied |
| Less than High School | 0 (0.0%) | 0 (0.0%) |
| High School Diploma | 7 (50.0%) | 7 (50.0%) |
| College/Associate Degree | 3 (100.0%) | 0 (0.0%) |
| Bachelor's Degree or higher | 0 (0.0%) | 0 (0.0%) |
Occupancy by Age of Householder in Tatitlek
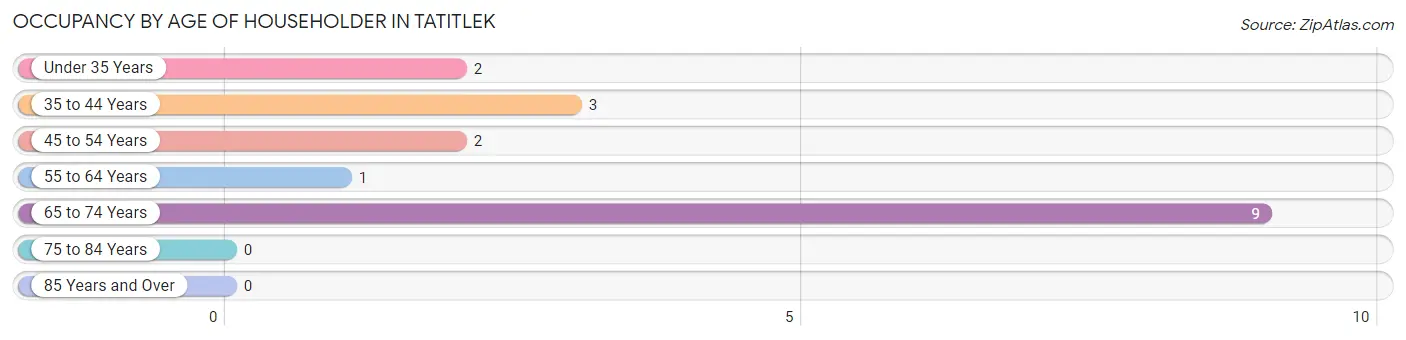
| Age Bracket | # Households | % Households |
| Under 35 Years | 2 | 11.8% |
| 35 to 44 Years | 3 | 17.6% |
| 45 to 54 Years | 2 | 11.8% |
| 55 to 64 Years | 1 | 5.9% |
| 65 to 74 Years | 9 | 52.9% |
| 75 to 84 Years | 0 | 0.0% |
| 85 Years and Over | 0 | 0.0% |
| Total | 17 | 100.0% |
Housing Finances in Tatitlek
Median Income by Occupancy in Tatitlek
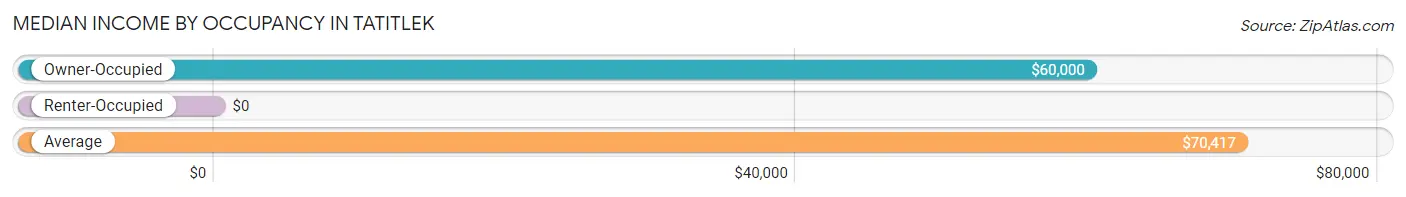
| Occupancy Type | # Households | Median Income |
| Owner-Occupied | 10 (58.8%) | $60,000 |
| Renter-Occupied | 7 (41.2%) | $0 |
| Average | 17 (100.0%) | $70,417 |
Occupancy by Householder Income Bracket in Tatitlek
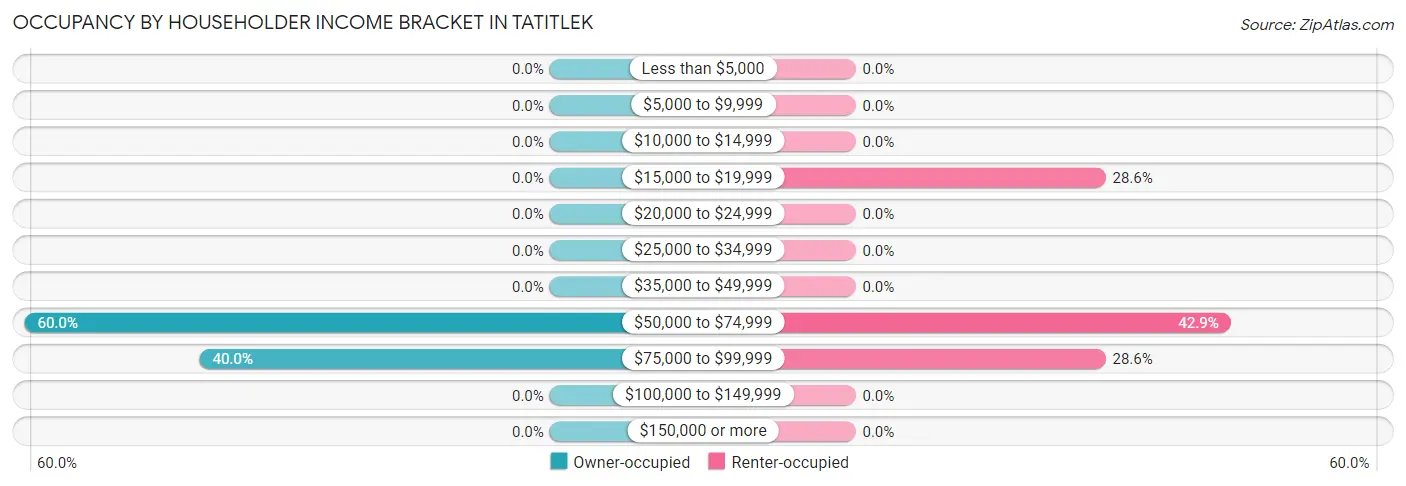
| Income Bracket | Owner-occupied | Renter-occupied |
| Less than $5,000 | 0 (0.0%) | 0 (0.0%) |
| $5,000 to $9,999 | 0 (0.0%) | 0 (0.0%) |
| $10,000 to $14,999 | 0 (0.0%) | 0 (0.0%) |
| $15,000 to $19,999 | 0 (0.0%) | 2 (28.6%) |
| $20,000 to $24,999 | 0 (0.0%) | 0 (0.0%) |
| $25,000 to $34,999 | 0 (0.0%) | 0 (0.0%) |
| $35,000 to $49,999 | 0 (0.0%) | 0 (0.0%) |
| $50,000 to $74,999 | 6 (60.0%) | 3 (42.9%) |
| $75,000 to $99,999 | 4 (40.0%) | 2 (28.6%) |
| $100,000 to $149,999 | 0 (0.0%) | 0 (0.0%) |
| $150,000 or more | 0 (0.0%) | 0 (0.0%) |
| Total | 10 (100.0%) | 7 (100.0%) |
Monthly Housing Cost Tiers in Tatitlek
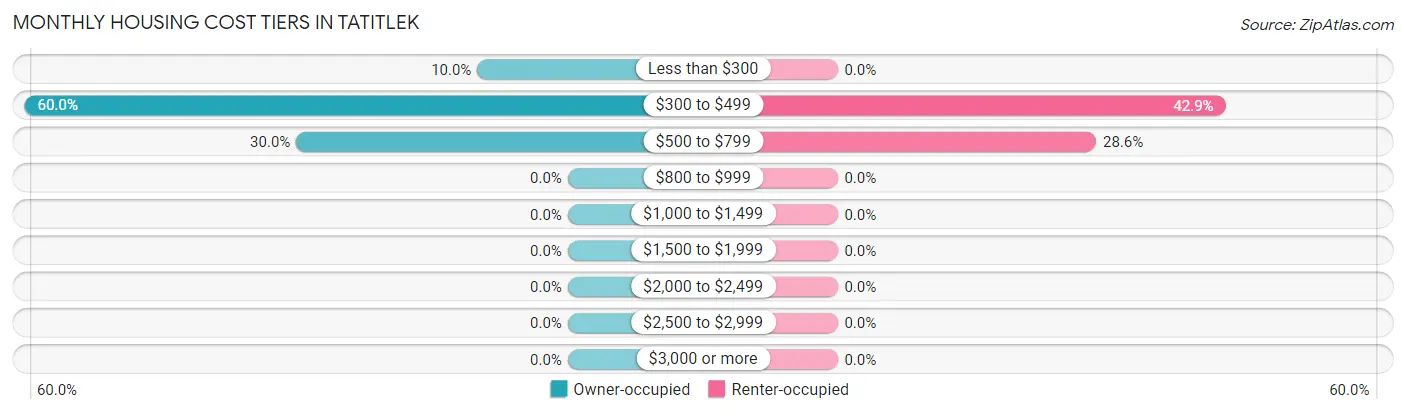
| Monthly Cost | Owner-occupied | Renter-occupied |
| Less than $300 | 1 (10.0%) | 0 (0.0%) |
| $300 to $499 | 6 (60.0%) | 3 (42.9%) |
| $500 to $799 | 3 (30.0%) | 2 (28.6%) |
| $800 to $999 | 0 (0.0%) | 0 (0.0%) |
| $1,000 to $1,499 | 0 (0.0%) | 0 (0.0%) |
| $1,500 to $1,999 | 0 (0.0%) | 0 (0.0%) |
| $2,000 to $2,499 | 0 (0.0%) | 0 (0.0%) |
| $2,500 to $2,999 | 0 (0.0%) | 0 (0.0%) |
| $3,000 or more | 0 (0.0%) | 0 (0.0%) |
| Total | 10 (100.0%) | 7 (100.0%) |
Physical Housing Characteristics in Tatitlek
Housing Structures in Tatitlek
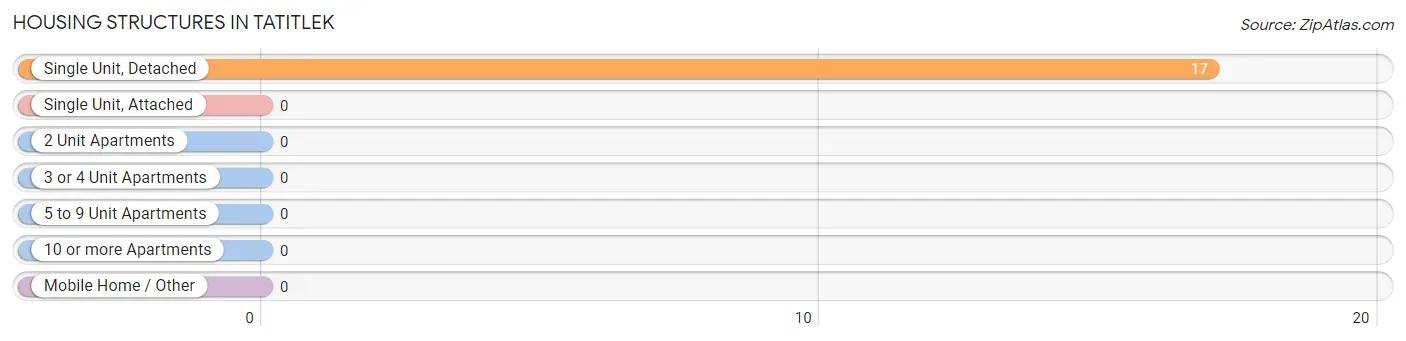
| Structure Type | # Housing Units | % Housing Units |
| Single Unit, Detached | 17 | 100.0% |
| Single Unit, Attached | 0 | 0.0% |
| 2 Unit Apartments | 0 | 0.0% |
| 3 or 4 Unit Apartments | 0 | 0.0% |
| 5 to 9 Unit Apartments | 0 | 0.0% |
| 10 or more Apartments | 0 | 0.0% |
| Mobile Home / Other | 0 | 0.0% |
| Total | 17 | 100.0% |
Housing Structures by Occupancy in Tatitlek
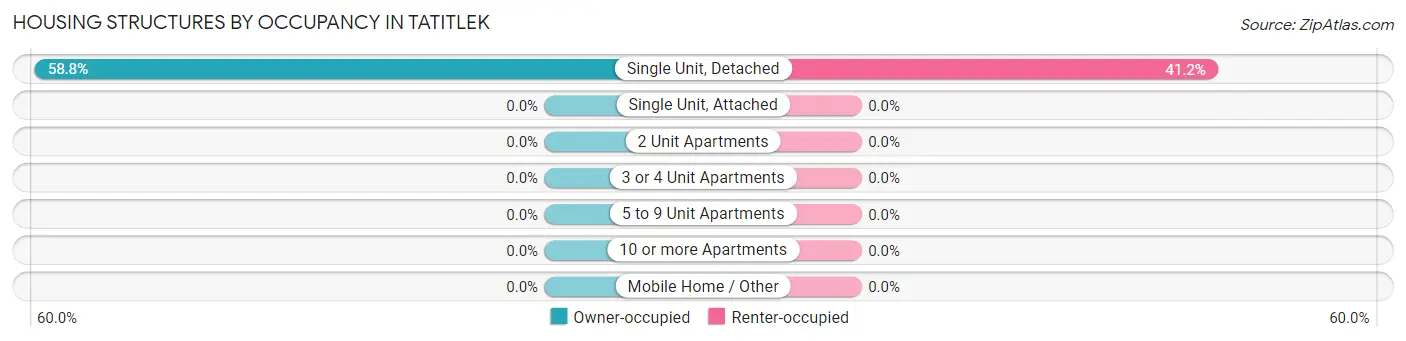
| Structure Type | Owner-occupied | Renter-occupied |
| Single Unit, Detached | 10 (58.8%) | 7 (41.2%) |
| Single Unit, Attached | 0 (0.0%) | 0 (0.0%) |
| 2 Unit Apartments | 0 (0.0%) | 0 (0.0%) |
| 3 or 4 Unit Apartments | 0 (0.0%) | 0 (0.0%) |
| 5 to 9 Unit Apartments | 0 (0.0%) | 0 (0.0%) |
| 10 or more Apartments | 0 (0.0%) | 0 (0.0%) |
| Mobile Home / Other | 0 (0.0%) | 0 (0.0%) |
| Total | 10 (58.8%) | 7 (41.2%) |
Housing Structures by Number of Rooms in Tatitlek
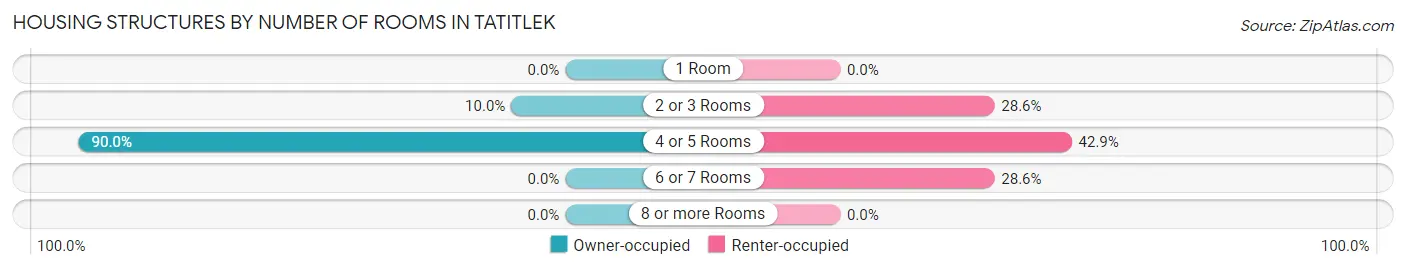
| Number of Rooms | Owner-occupied | Renter-occupied |
| 1 Room | 0 (0.0%) | 0 (0.0%) |
| 2 or 3 Rooms | 1 (10.0%) | 2 (28.6%) |
| 4 or 5 Rooms | 9 (90.0%) | 3 (42.9%) |
| 6 or 7 Rooms | 0 (0.0%) | 2 (28.6%) |
| 8 or more Rooms | 0 (0.0%) | 0 (0.0%) |
| Total | 10 (100.0%) | 7 (100.0%) |
Housing Structure by Heating Type in Tatitlek
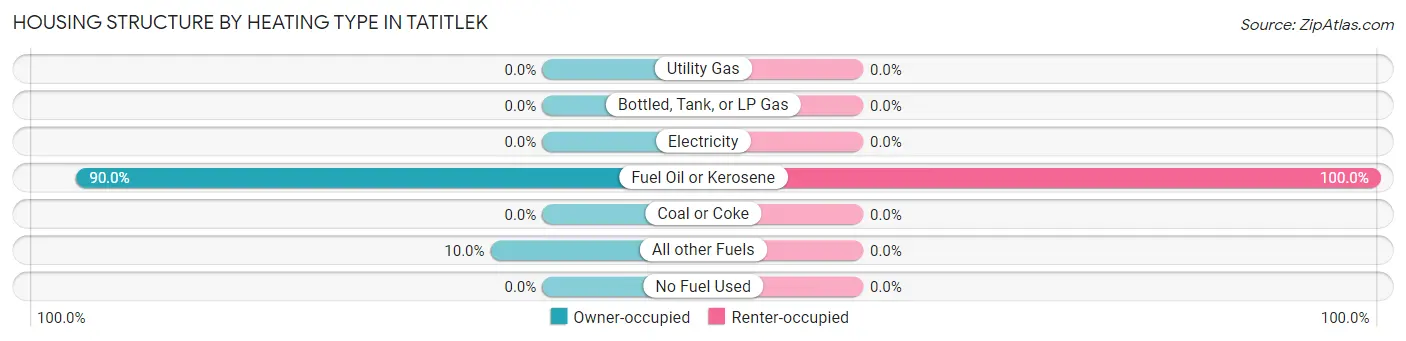
| Heating Type | Owner-occupied | Renter-occupied |
| Utility Gas | 0 (0.0%) | 0 (0.0%) |
| Bottled, Tank, or LP Gas | 0 (0.0%) | 0 (0.0%) |
| Electricity | 0 (0.0%) | 0 (0.0%) |
| Fuel Oil or Kerosene | 9 (90.0%) | 7 (100.0%) |
| Coal or Coke | 0 (0.0%) | 0 (0.0%) |
| All other Fuels | 1 (10.0%) | 0 (0.0%) |
| No Fuel Used | 0 (0.0%) | 0 (0.0%) |
| Total | 10 (100.0%) | 7 (100.0%) |
Household Vehicle Usage in Tatitlek
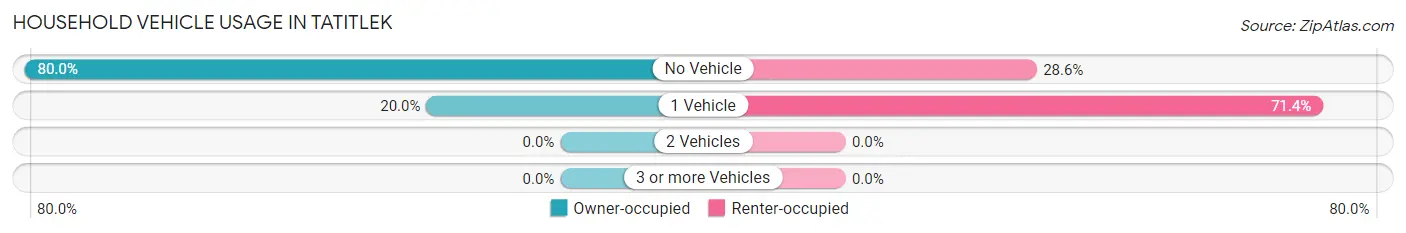
| Vehicles per Household | Owner-occupied | Renter-occupied |
| No Vehicle | 8 (80.0%) | 2 (28.6%) |
| 1 Vehicle | 2 (20.0%) | 5 (71.4%) |
| 2 Vehicles | 0 (0.0%) | 0 (0.0%) |
| 3 or more Vehicles | 0 (0.0%) | 0 (0.0%) |
| Total | 10 (100.0%) | 7 (100.0%) |
Real Estate & Mortgages in Tatitlek
Real Estate and Mortgage Overview in Tatitlek
| Characteristic | Without Mortgage | With Mortgage |
| Housing Units | 7 | 3 |
| Median Property Value | $95,000 | $0 |
| Median Household Income | $78,750 | $0 |
| Monthly Housing Costs | $358 | $0 |
| Real Estate Taxes | - | - |
Property Value by Mortgage Status in Tatitlek
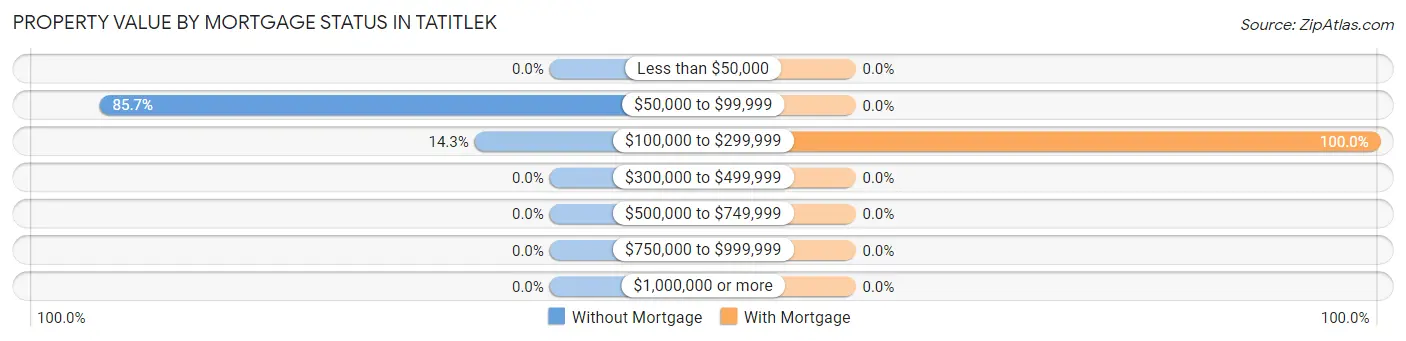
| Property Value | Without Mortgage | With Mortgage |
| Less than $50,000 | 0 (0.0%) | 0 (0.0%) |
| $50,000 to $99,999 | 6 (85.7%) | 0 (0.0%) |
| $100,000 to $299,999 | 1 (14.3%) | 3 (100.0%) |
| $300,000 to $499,999 | 0 (0.0%) | 0 (0.0%) |
| $500,000 to $749,999 | 0 (0.0%) | 0 (0.0%) |
| $750,000 to $999,999 | 0 (0.0%) | 0 (0.0%) |
| $1,000,000 or more | 0 (0.0%) | 0 (0.0%) |
| Total | 7 (100.0%) | 3 (100.0%) |
Household Income by Mortgage Status in Tatitlek
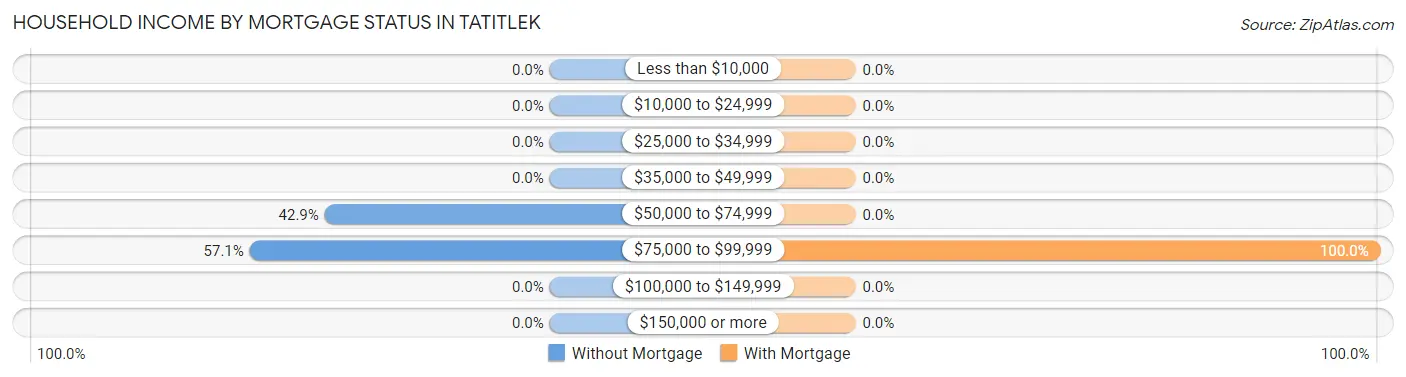
| Household Income | Without Mortgage | With Mortgage |
| Less than $10,000 | 0 (0.0%) | 0 (0.0%) |
| $10,000 to $24,999 | 0 (0.0%) | 0 (0.0%) |
| $25,000 to $34,999 | 0 (0.0%) | 0 (0.0%) |
| $35,000 to $49,999 | 0 (0.0%) | 0 (0.0%) |
| $50,000 to $74,999 | 3 (42.9%) | 0 (0.0%) |
| $75,000 to $99,999 | 4 (57.1%) | 3 (100.0%) |
| $100,000 to $149,999 | 0 (0.0%) | 0 (0.0%) |
| $150,000 or more | 0 (0.0%) | 0 (0.0%) |
| Total | 7 (100.0%) | 3 (100.0%) |
Property Value to Household Income Ratio in Tatitlek
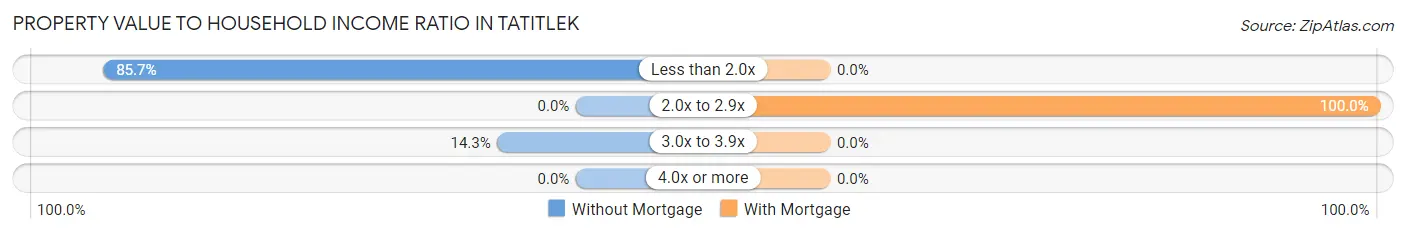
| Value-to-Income Ratio | Without Mortgage | With Mortgage |
| Less than 2.0x | 6 (85.7%) | 0 (0.0%) |
| 2.0x to 2.9x | 0 (0.0%) | 3 (100.0%) |
| 3.0x to 3.9x | 1 (14.3%) | 0 (0.0%) |
| 4.0x or more | 0 (0.0%) | 0 (0.0%) |
| Total | 7 (100.0%) | 3 (100.0%) |
Real Estate Taxes by Mortgage Status in Tatitlek
| Property Taxes | Without Mortgage | With Mortgage |
| Less than $800 | 0 (0.0%) | 0 (0.0%) |
| $800 to $1,499 | 0 (0.0%) | 0 (0.0%) |
| $800 to $1,499 | 0 (0.0%) | 0 (0.0%) |
| Total | 7 (100.0%) | 3 (100.0%) |
Health & Disability in Tatitlek
Health Insurance Coverage by Age in Tatitlek
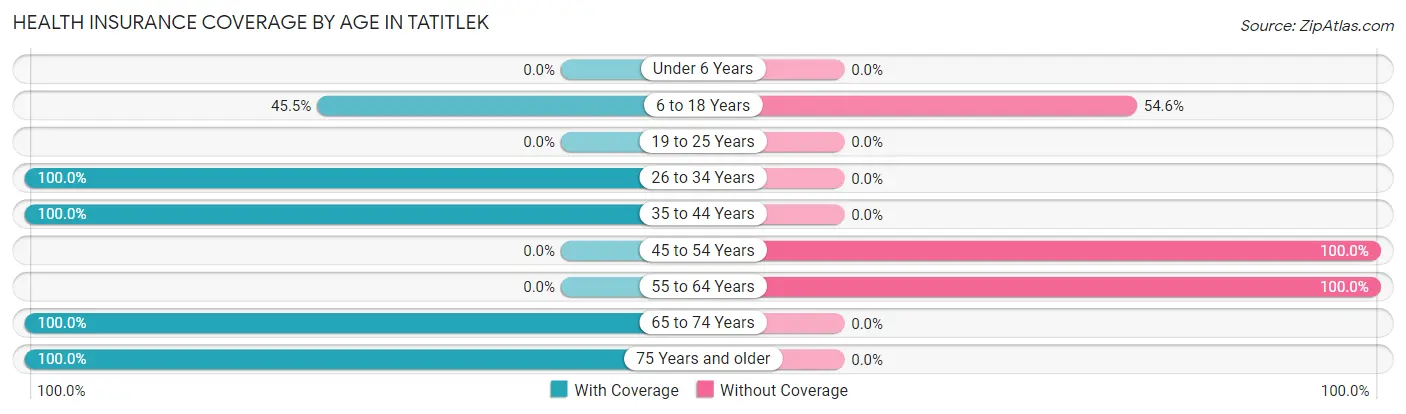
| Age Bracket | With Coverage | Without Coverage |
| Under 6 Years | 0 (0.0%) | 0 (0.0%) |
| 6 to 18 Years | 5 (45.5%) | 6 (54.5%) |
| 19 to 25 Years | 0 (0.0%) | 0 (0.0%) |
| 26 to 34 Years | 5 (100.0%) | 0 (0.0%) |
| 35 to 44 Years | 3 (100.0%) | 0 (0.0%) |
| 45 to 54 Years | 0 (0.0%) | 6 (100.0%) |
| 55 to 64 Years | 0 (0.0%) | 4 (100.0%) |
| 65 to 74 Years | 9 (100.0%) | 0 (0.0%) |
| 75 Years and older | 2 (100.0%) | 0 (0.0%) |
| Total | 24 (60.0%) | 16 (40.0%) |
Health Insurance Coverage by Citizenship Status in Tatitlek
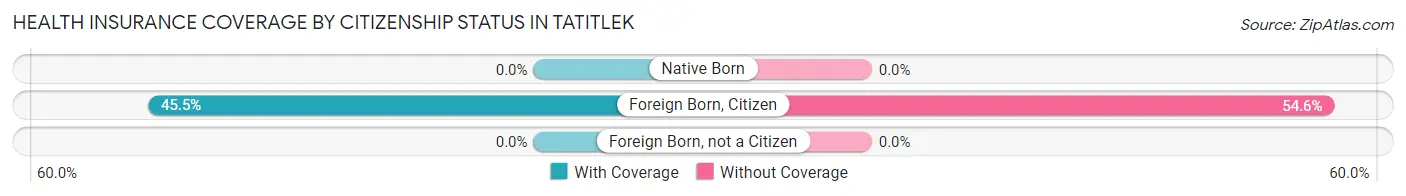
| Citizenship Status | With Coverage | Without Coverage |
| Native Born | 0 (0.0%) | 0 (0.0%) |
| Foreign Born, Citizen | 5 (45.5%) | 6 (54.5%) |
| Foreign Born, not a Citizen | 0 (0.0%) | 0 (0.0%) |
Health Insurance Coverage by Household Income in Tatitlek
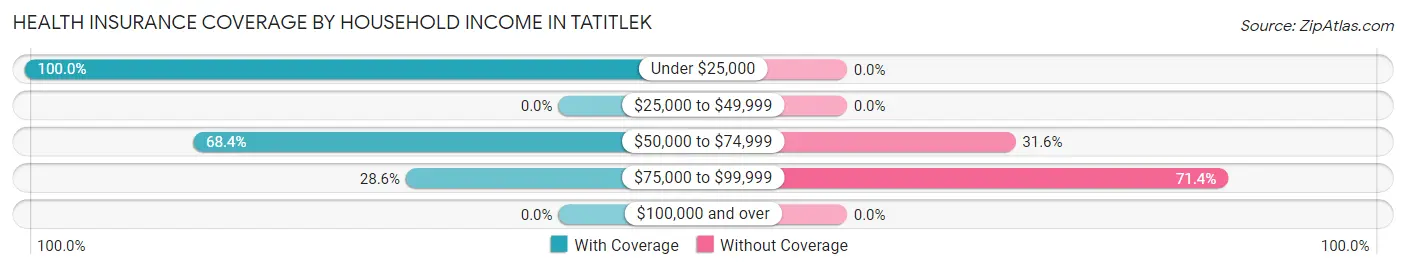
| Household Income | With Coverage | Without Coverage |
| Under $25,000 | 7 (100.0%) | 0 (0.0%) |
| $25,000 to $49,999 | 0 (0.0%) | 0 (0.0%) |
| $50,000 to $74,999 | 13 (68.4%) | 6 (31.6%) |
| $75,000 to $99,999 | 4 (28.6%) | 10 (71.4%) |
| $100,000 and over | 0 (0.0%) | 0 (0.0%) |
Public vs Private Health Insurance Coverage by Age in Tatitlek
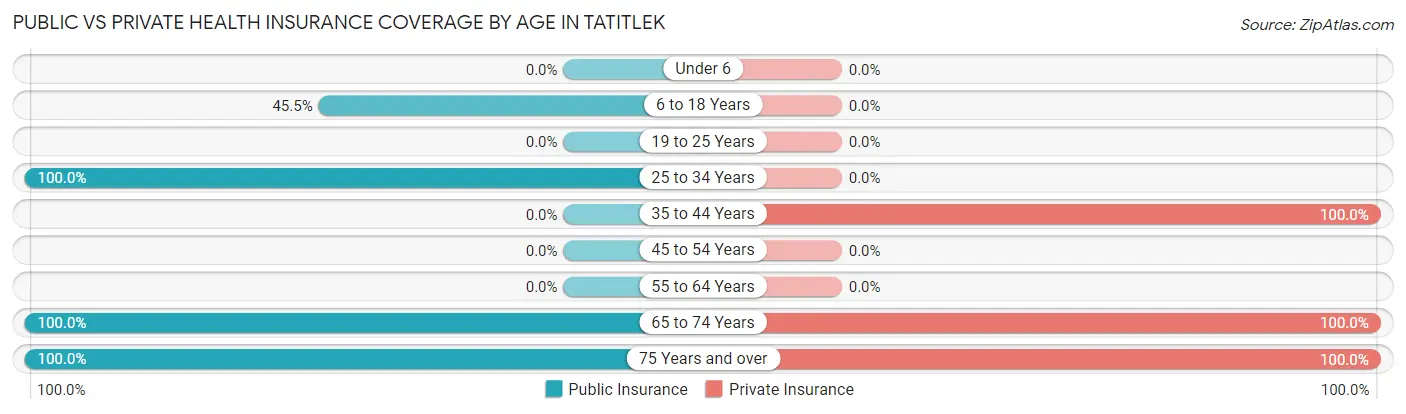
| Age Bracket | Public Insurance | Private Insurance |
| Under 6 | 0 (0.0%) | 0 (0.0%) |
| 6 to 18 Years | 5 (45.5%) | 0 (0.0%) |
| 19 to 25 Years | 0 (0.0%) | 0 (0.0%) |
| 25 to 34 Years | 5 (100.0%) | 0 (0.0%) |
| 35 to 44 Years | 0 (0.0%) | 3 (100.0%) |
| 45 to 54 Years | 0 (0.0%) | 0 (0.0%) |
| 55 to 64 Years | 0 (0.0%) | 0 (0.0%) |
| 65 to 74 Years | 9 (100.0%) | 9 (100.0%) |
| 75 Years and over | 2 (100.0%) | 2 (100.0%) |
| Total | 21 (52.5%) | 14 (35.0%) |
Disability Status by Sex by Age in Tatitlek
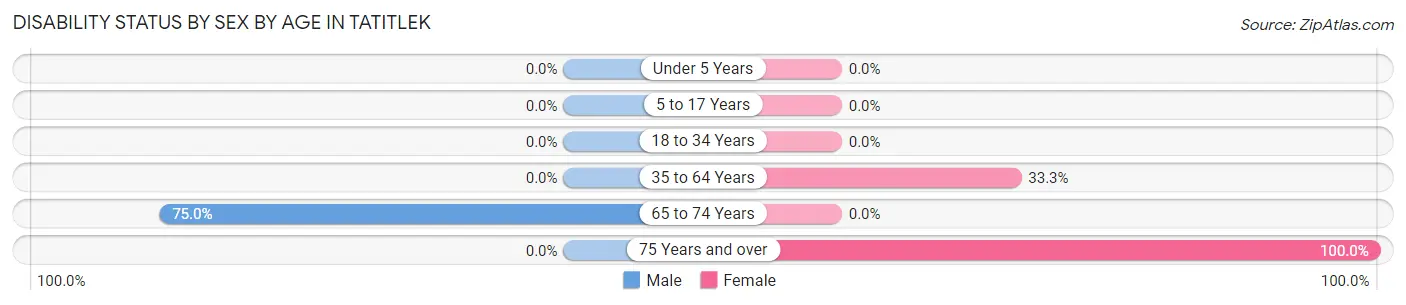
| Age Bracket | Male | Female |
| Under 5 Years | 0 (0.0%) | 0 (0.0%) |
| 5 to 17 Years | 0 (0.0%) | 0 (0.0%) |
| 18 to 34 Years | 0 (0.0%) | 0 (0.0%) |
| 35 to 64 Years | 0 (0.0%) | 3 (33.3%) |
| 65 to 74 Years | 3 (75.0%) | 0 (0.0%) |
| 75 Years and over | 0 (0.0%) | 2 (100.0%) |
Disability Class by Sex by Age in Tatitlek
Disability Class: Hearing Difficulty
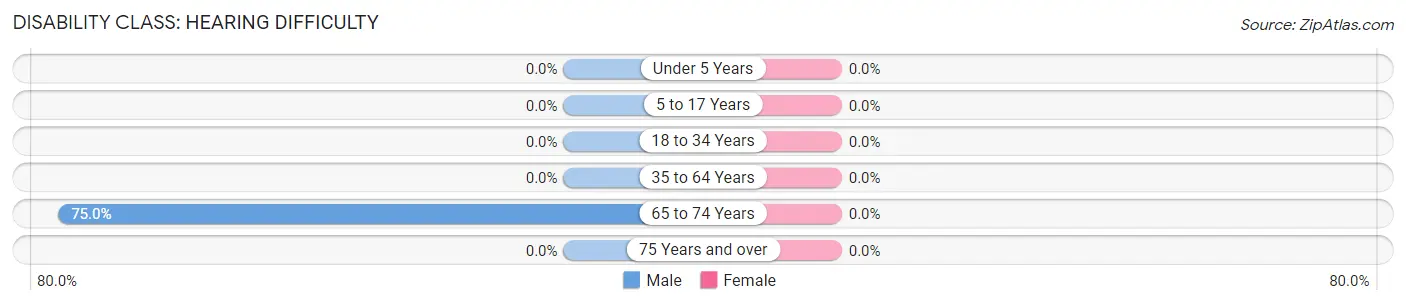
| Age Bracket | Male | Female |
| Under 5 Years | 0 (0.0%) | 0 (0.0%) |
| 5 to 17 Years | 0 (0.0%) | 0 (0.0%) |
| 18 to 34 Years | 0 (0.0%) | 0 (0.0%) |
| 35 to 64 Years | 0 (0.0%) | 0 (0.0%) |
| 65 to 74 Years | 3 (75.0%) | 0 (0.0%) |
| 75 Years and over | 0 (0.0%) | 0 (0.0%) |
Disability Class: Vision Difficulty
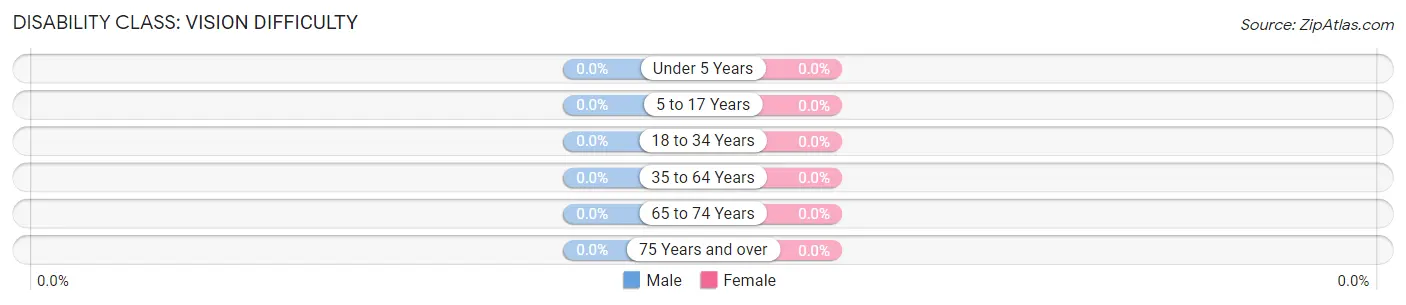
| Age Bracket | Male | Female |
| Under 5 Years | 0 (0.0%) | 0 (0.0%) |
| 5 to 17 Years | 0 (0.0%) | 0 (0.0%) |
| 18 to 34 Years | 0 (0.0%) | 0 (0.0%) |
| 35 to 64 Years | 0 (0.0%) | 0 (0.0%) |
| 65 to 74 Years | 0 (0.0%) | 0 (0.0%) |
| 75 Years and over | 0 (0.0%) | 0 (0.0%) |
Disability Class: Cognitive Difficulty
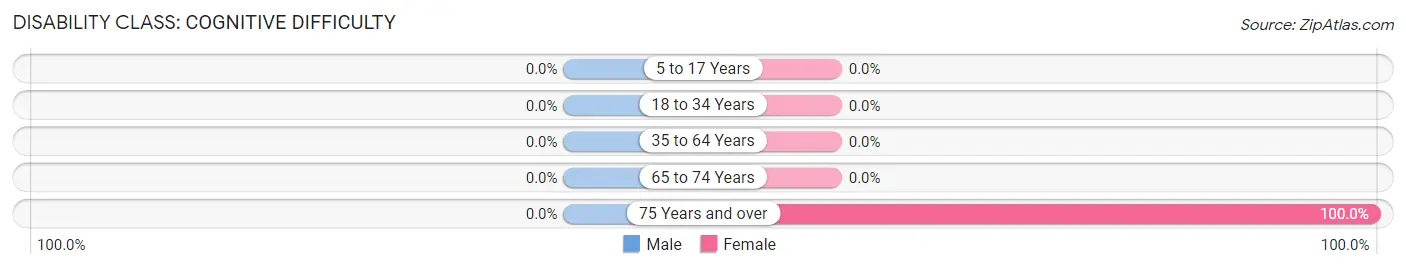
| Age Bracket | Male | Female |
| 5 to 17 Years | 0 (0.0%) | 0 (0.0%) |
| 18 to 34 Years | 0 (0.0%) | 0 (0.0%) |
| 35 to 64 Years | 0 (0.0%) | 0 (0.0%) |
| 65 to 74 Years | 0 (0.0%) | 0 (0.0%) |
| 75 Years and over | 0 (0.0%) | 2 (100.0%) |
Disability Class: Ambulatory Difficulty
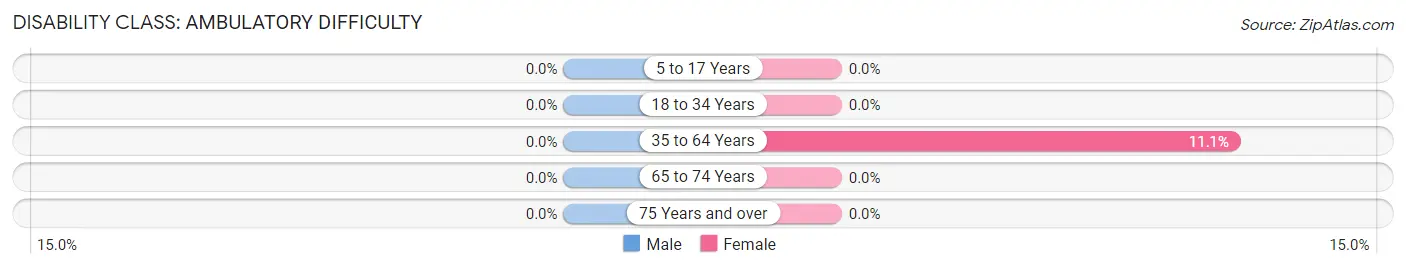
| Age Bracket | Male | Female |
| 5 to 17 Years | 0 (0.0%) | 0 (0.0%) |
| 18 to 34 Years | 0 (0.0%) | 0 (0.0%) |
| 35 to 64 Years | 0 (0.0%) | 1 (11.1%) |
| 65 to 74 Years | 0 (0.0%) | 0 (0.0%) |
| 75 Years and over | 0 (0.0%) | 0 (0.0%) |
Disability Class: Self-Care Difficulty
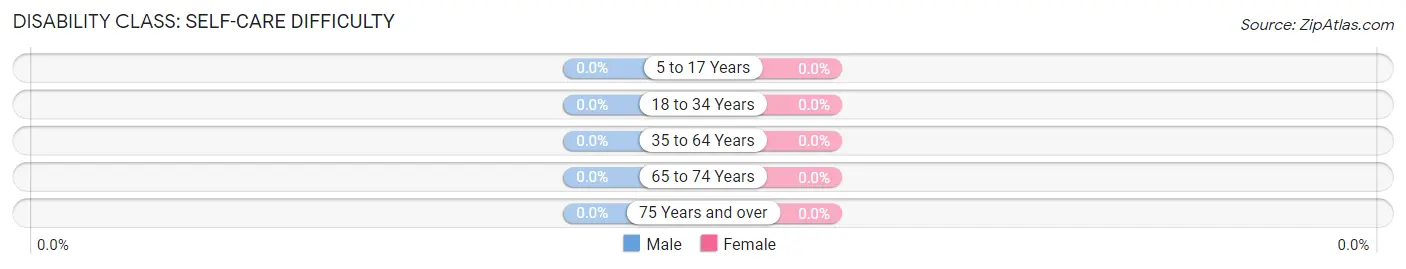
| Age Bracket | Male | Female |
| 5 to 17 Years | 0 (0.0%) | 0 (0.0%) |
| 18 to 34 Years | 0 (0.0%) | 0 (0.0%) |
| 35 to 64 Years | 0 (0.0%) | 0 (0.0%) |
| 65 to 74 Years | 0 (0.0%) | 0 (0.0%) |
| 75 Years and over | 0 (0.0%) | 0 (0.0%) |
Technology Access in Tatitlek
Computing Device Access in Tatitlek
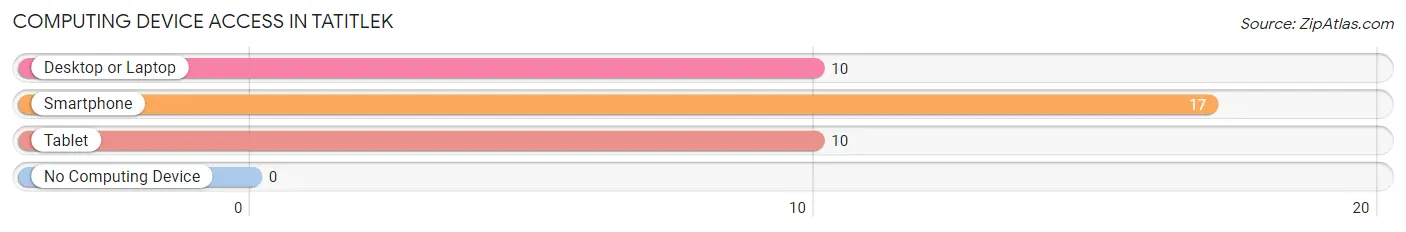
| Device Type | # Households | % Households |
| Desktop or Laptop | 10 | 58.8% |
| Smartphone | 17 | 100.0% |
| Tablet | 10 | 58.8% |
| No Computing Device | 0 | 0.0% |
| Total | 17 | 100.0% |
Internet Access in Tatitlek
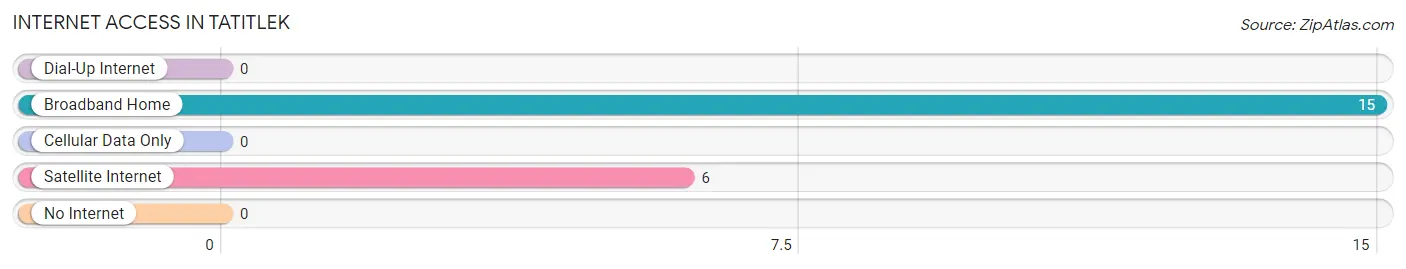
| Internet Type | # Households | % Households |
| Dial-Up Internet | 0 | 0.0% |
| Broadband Home | 15 | 88.2% |
| Cellular Data Only | 0 | 0.0% |
| Satellite Internet | 6 | 35.3% |
| No Internet | 0 | 0.0% |
| Total | 17 | 100.0% |
Tatitlek Summary
Tatitlek is a small unincorporated community located in the Valdez-Cordova Census Area of Alaska. It is situated on the east shore of Tatitlek Bay, at the head of the bay, and is located approximately 40 miles northeast of Cordova. The population of Tatitlek was estimated to be around 100 people in 2020.
History
Tatitlek has a long and rich history. The area was first inhabited by the Eyak people, who lived in the area for thousands of years before the arrival of Europeans. The first Europeans to visit the area were Russian fur traders, who arrived in the late 1700s. The Russians established a trading post in the area, which was later abandoned in the early 1800s.
In the late 1800s, the area was settled by the Chugach people, who were of Athabaskan and Aleut descent. The Chugach people established a village in the area, which was later abandoned in the early 1900s.
In the early 1900s, the area was settled by the Tatitlek Corporation, which was established in 1915. The corporation was formed to manage the resources of the area, including timber, fish, and fur. The corporation also established a cannery in the area, which was later abandoned in the late 1950s.
In the late 1950s, the area was settled by the Tatitlek Corporation, which was established in 1959. The corporation was formed to manage the resources of the area, including timber, fish, and fur. The corporation also established a cannery in the area, which was later abandoned in the late 1970s.
Geography
Tatitlek is located in the Valdez-Cordova Census Area of Alaska. It is situated on the east shore of Tatitlek Bay, at the head of the bay, and is located approximately 40 miles northeast of Cordova. The area is surrounded by mountains and is home to a variety of wildlife, including moose, bear, and bald eagles.
The climate in Tatitlek is generally mild, with temperatures ranging from the mid-30s in the winter to the mid-60s in the summer. The area receives an average of 40 inches of precipitation per year, with most of the precipitation falling in the form of snow.
Economy
The economy of Tatitlek is largely based on fishing and tourism. The area is home to a variety of fish, including salmon, halibut, and cod. The area is also popular with tourists, who come to enjoy the area’s natural beauty and wildlife.
The Tatitlek Corporation is the largest employer in the area, employing approximately 50 people. The corporation is responsible for managing the resources of the area, including timber, fish, and fur. The corporation also operates a cannery in the area, which processes fish for local consumption and export.
Demographics
The population of Tatitlek was estimated to be around 100 people in 2020. The majority of the population is of Native American descent, with the majority being of Chugach and Eyak descent. The area is also home to a small number of non-Native Americans, primarily of European descent.
The primary language spoken in Tatitlek is English, although some residents also speak Chugach and Eyak. The area is served by a single school, which is part of the Cordova School District. The area is also served by a single post office.
Conclusion
Tatitlek is a small unincorporated community located in the Valdez-Cordova Census Area of Alaska. It has a long and rich history, and is home to a variety of wildlife. The economy of the area is largely based on fishing and tourism, and the population is primarily of Native American descent. The area is served by a single school and post office, and is a popular destination for tourists.
Common Questions
What is Per Capita Income in Tatitlek?
Per Capita income in Tatitlek is $30,215.
What is the Median Family Income in Tatitlek?
Median Family Income in Tatitlek is $61,250.
What is the Median Household income in Tatitlek?
Median Household Income in Tatitlek is $70,417.
What is Inequality or Gini Index in Tatitlek?
Inequality or Gini Index in Tatitlek is 0.19.
What is the Total Population of Tatitlek?
Total Population of Tatitlek is 40.
What is the Total Male Population of Tatitlek?
Total Male Population of Tatitlek is 16.
What is the Total Female Population of Tatitlek?
Total Female Population of Tatitlek is 24.
What is the Ratio of Males per 100 Females in Tatitlek?
There are 66.67 Males per 100 Females in Tatitlek.
What is the Ratio of Females per 100 Males in Tatitlek?
There are 150.00 Females per 100 Males in Tatitlek.
What is the Median Population Age in Tatitlek?
Median Population Age in Tatitlek is 48.3 Years.
What is the Average Family Size in Tatitlek
Average Family Size in Tatitlek is 2.5 People.
What is the Average Household Size in Tatitlek
Average Household Size in Tatitlek is 2.4 People.
How Large is the Labor Force in Tatitlek?
There are 15 People in the Labor Forcein in Tatitlek.
What is the Percentage of People in the Labor Force in Tatitlek?
42.9% of People are in the Labor Force in Tatitlek.