Levelock, AK Map & Demographics
Levelock Map
Levelock Overview
$33,282
PER CAPITA INCOME
0.43
INEQUALITY / GINI INDEX
28
TOTAL POPULATION
16
MALE POPULATION
12
FEMALE POPULATION
133.33
MALES / 100 FEMALES
75.00
FEMALES / 100 MALES
27.0
MEDIAN AGE
2.1
AVG FAMILY SIZE
1.8
AVG HOUSEHOLD SIZE
17
LABOR FORCE [ PEOPLE ]
85.0%
PERCENT IN LABOR FORCE
29.4%
UNEMPLOYMENT RATE
Levelock Zip Codes
Levelock Area Codes
Income in Levelock
Income Overview in Levelock
| Characteristic | Number | Measure |
| Per Capita Income | 28 | $33,282 |
| Median Family Income | 11 | $0 |
| Mean Family Income | 11 | $72,555 |
| Median Household Income | 16 | $0 |
| Mean Household Income | 16 | $58,244 |
| Income Deficit | 11 | $0 |
| Wage / Income Gap (%) | 28 | 0.00% |
| Wage / Income Gap ($) | 28 | 100.00¢ per $1 |
| Gini / Inequality Index | 28 | 0.43 |
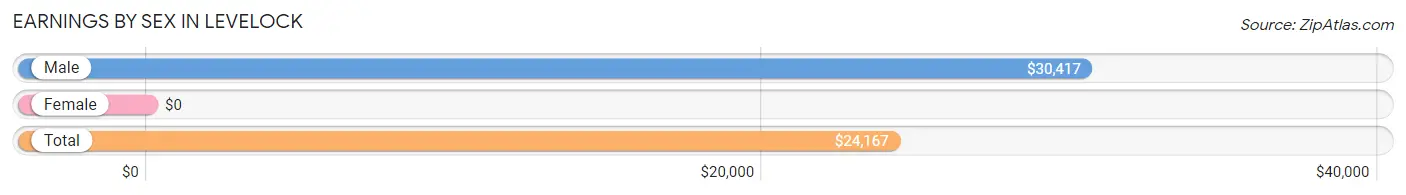
Earnings by Sex in Levelock
| Sex | Number | Average Earnings |
| Male | 15 (75.0%) | $30,417 |
| Female | 5 (25.0%) | $0 |
| Total | 20 (100.0%) | $24,167 |
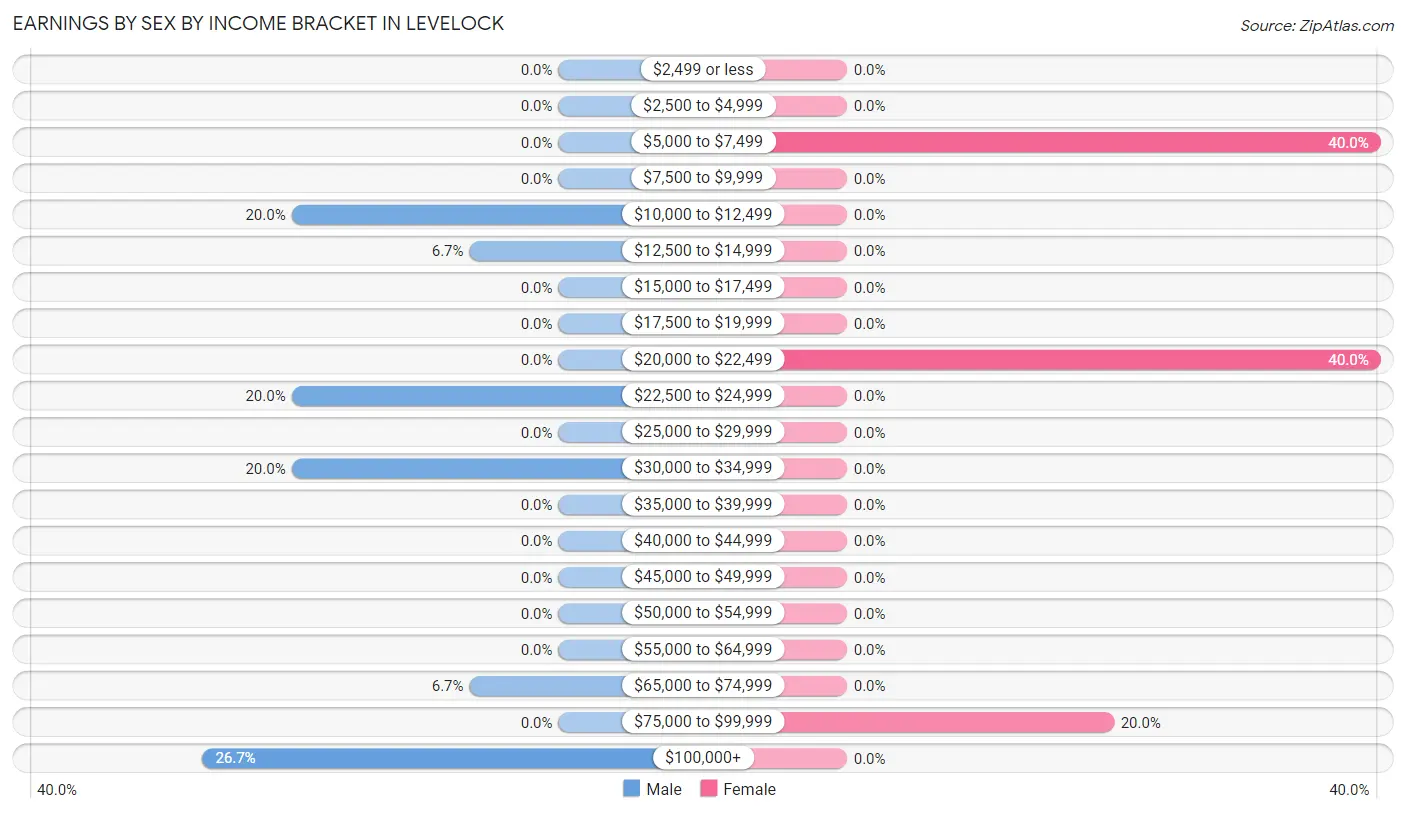
Earnings by Sex by Income Bracket in Levelock
The most common earnings brackets in Levelock are $100,000+ for men (4 | 26.7%) and $5,000 to $7,499 for women (2 | 40.0%).
| Income | Male | Female |
| $2,499 or less | 0 (0.0%) | 0 (0.0%) |
| $2,500 to $4,999 | 0 (0.0%) | 0 (0.0%) |
| $5,000 to $7,499 | 0 (0.0%) | 2 (40.0%) |
| $7,500 to $9,999 | 0 (0.0%) | 0 (0.0%) |
| $10,000 to $12,499 | 3 (20.0%) | 0 (0.0%) |
| $12,500 to $14,999 | 1 (6.7%) | 0 (0.0%) |
| $15,000 to $17,499 | 0 (0.0%) | 0 (0.0%) |
| $17,500 to $19,999 | 0 (0.0%) | 0 (0.0%) |
| $20,000 to $22,499 | 0 (0.0%) | 2 (40.0%) |
| $22,500 to $24,999 | 3 (20.0%) | 0 (0.0%) |
| $25,000 to $29,999 | 0 (0.0%) | 0 (0.0%) |
| $30,000 to $34,999 | 3 (20.0%) | 0 (0.0%) |
| $35,000 to $39,999 | 0 (0.0%) | 0 (0.0%) |
| $40,000 to $44,999 | 0 (0.0%) | 0 (0.0%) |
| $45,000 to $49,999 | 0 (0.0%) | 0 (0.0%) |
| $50,000 to $54,999 | 0 (0.0%) | 0 (0.0%) |
| $55,000 to $64,999 | 0 (0.0%) | 0 (0.0%) |
| $65,000 to $74,999 | 1 (6.7%) | 0 (0.0%) |
| $75,000 to $99,999 | 0 (0.0%) | 1 (20.0%) |
| $100,000+ | 4 (26.7%) | 0 (0.0%) |
| Total | 15 (100.0%) | 5 (100.0%) |
Earnings by Sex by Educational Attainment in Levelock
| Educational Attainment | Male Income | Female Income |
| Less than High School | - | - |
| High School Diploma | - | - |
| College or Associate's Degree | - | - |
| Bachelor's Degree | - | - |
| Graduate Degree | - | - |
| Total | - | - |
Family Income in Levelock
Family Income Brackets in Levelock
According to the Levelock family income data, there are 4 families falling into the $15,000 to $24,999 income range, which is the most common income bracket and makes up 36.4% of all families.
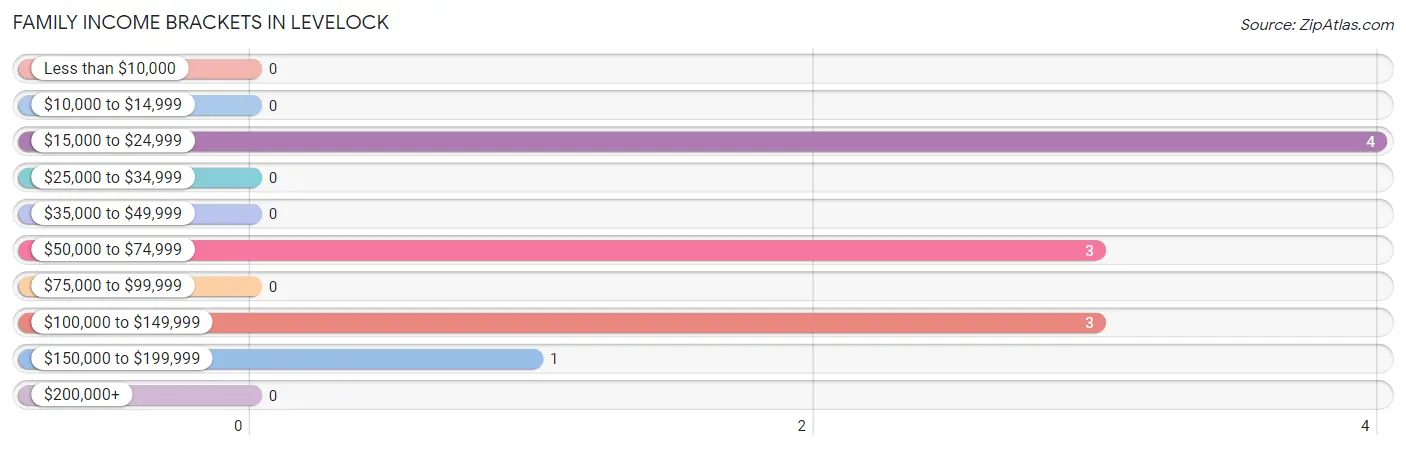
| Income Bracket | # Families | % Families |
| Less than $10,000 | 0 | 0.0% |
| $10,000 to $14,999 | 0 | 0.0% |
| $15,000 to $24,999 | 4 | 36.4% |
| $25,000 to $34,999 | 0 | 0.0% |
| $35,000 to $49,999 | 0 | 0.0% |
| $50,000 to $74,999 | 3 | 27.3% |
| $75,000 to $99,999 | 0 | 0.0% |
| $100,000 to $149,999 | 3 | 27.3% |
| $150,000 to $199,999 | 1 | 9.1% |
| $200,000+ | 0 | 0.0% |
Family Income by Famaliy Size in Levelock
| Income Bracket | # Families | Median Income |
| 2-Person Families | 9 (81.8%) | $0 |
| 3-Person Families | 0 (0.0%) | $0 |
| 4-Person Families | 2 (18.2%) | $0 |
| 5-Person Families | 0 (0.0%) | $0 |
| 6-Person Families | 0 (0.0%) | $0 |
| 7+ Person Families | 0 (0.0%) | $0 |
| Total | 11 (100.0%) | $0 |
Family Income by Number of Earners in Levelock
| Number of Earners | # Families | Median Income |
| No Earners | 0 (0.0%) | $0 |
| 1 Earner | 7 (63.6%) | $0 |
| 2 Earners | 4 (36.4%) | $0 |
| 3+ Earners | 0 (0.0%) | $0 |
| Total | 11 (100.0%) | $0 |
Household Income in Levelock
Household Income Brackets in Levelock
With 5 households falling in the category, the $15,000 to $24,999 income range is the most frequent in Levelock, accounting for 31.2% of all households.
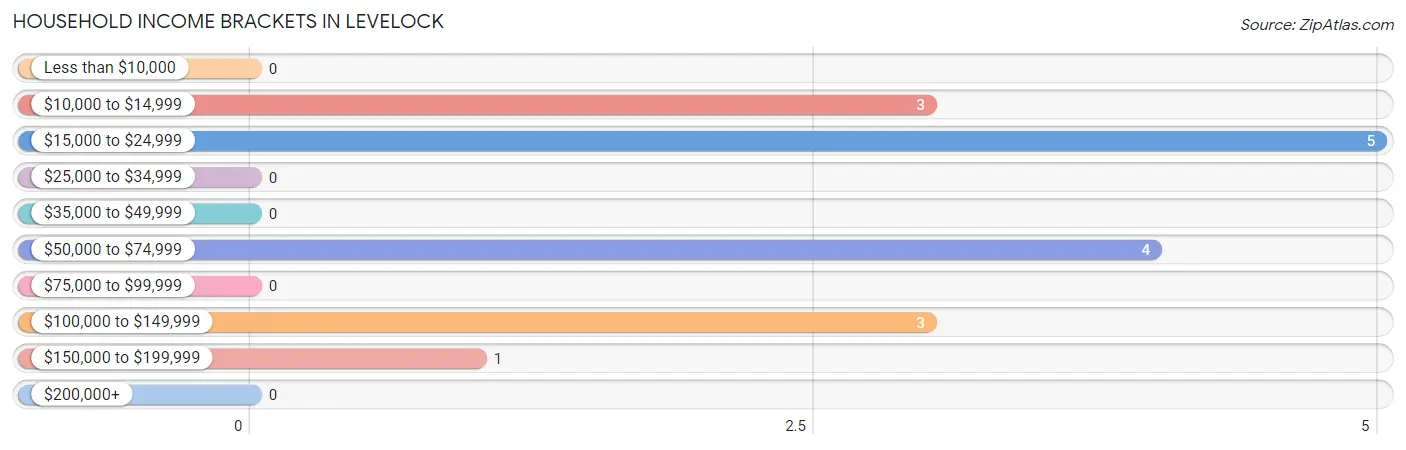
| Income Bracket | # Households | % Households |
| Less than $10,000 | 0 | 0.0% |
| $10,000 to $14,999 | 3 | 18.8% |
| $15,000 to $24,999 | 5 | 31.3% |
| $25,000 to $34,999 | 0 | 0.0% |
| $35,000 to $49,999 | 0 | 0.0% |
| $50,000 to $74,999 | 4 | 25.0% |
| $75,000 to $99,999 | 0 | 0.0% |
| $100,000 to $149,999 | 3 | 18.8% |
| $150,000 to $199,999 | 1 | 6.3% |
| $200,000+ | 0 | 0.0% |
Household Income by Householder Age in Levelock
The median household income in Levelock is $0, with the highest median household income of $22,083 found in the 25 to 44 years age bracket for the primary householder. A total of 11 households (68.8%) fall into this category. Meanwhile, the 15 to 24 years age bracket for the primary householder has the lowest median household income of $0, with 3 households (18.8%) in this group.
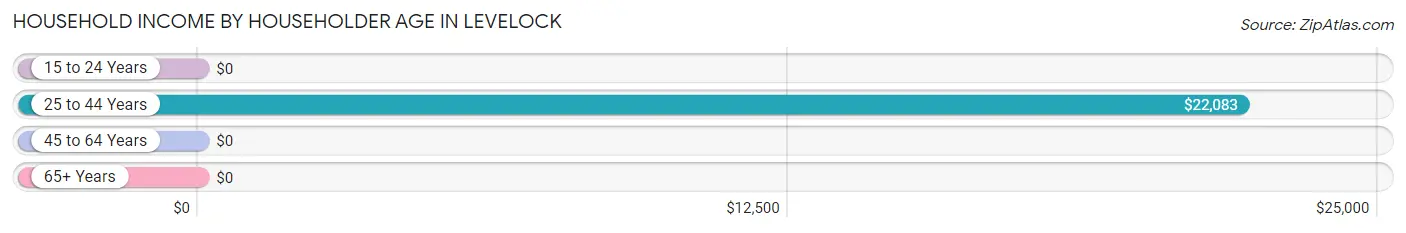
| Income Bracket | # Households | Median Income |
| 15 to 24 Years | 3 (18.8%) | $0 |
| 25 to 44 Years | 11 (68.8%) | $22,083 |
| 45 to 64 Years | 2 (12.5%) | $0 |
| 65+ Years | 0 (0.0%) | $0 |
| Total | 16 (100.0%) | $0 |
Poverty in Levelock
Income Below Poverty by Sex and Age in Levelock
With 18.8% poverty level for males and 66.7% for females among the residents of Levelock, 35 to 44 year old males and 6 to 11 year old females are the most vulnerable to poverty, with 3 males (50.0%) and 4 females (100.0%) in their respective age groups living below the poverty level.
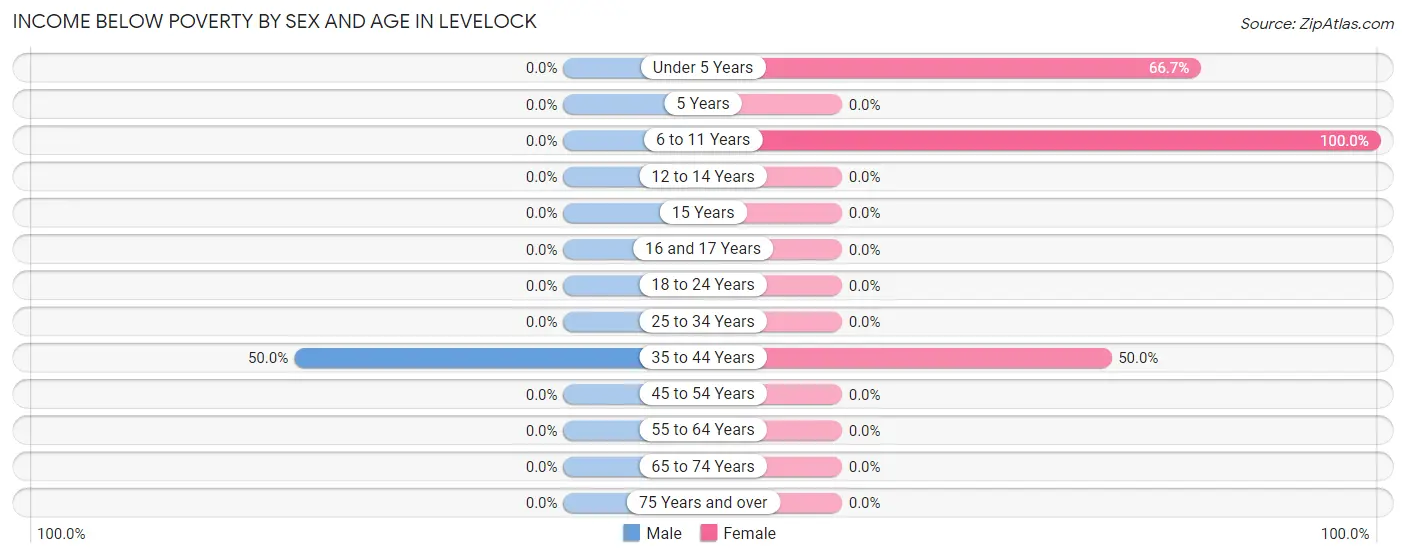
| Age Bracket | Male | Female |
| Under 5 Years | 0 (0.0%) | 2 (66.7%) |
| 5 Years | 0 (0.0%) | 0 (0.0%) |
| 6 to 11 Years | 0 (0.0%) | 4 (100.0%) |
| 12 to 14 Years | 0 (0.0%) | 0 (0.0%) |
| 15 Years | 0 (0.0%) | 0 (0.0%) |
| 16 and 17 Years | 0 (0.0%) | 0 (0.0%) |
| 18 to 24 Years | 0 (0.0%) | 0 (0.0%) |
| 25 to 34 Years | 0 (0.0%) | 0 (0.0%) |
| 35 to 44 Years | 3 (50.0%) | 2 (50.0%) |
| 45 to 54 Years | 0 (0.0%) | 0 (0.0%) |
| 55 to 64 Years | 0 (0.0%) | 0 (0.0%) |
| 65 to 74 Years | 0 (0.0%) | 0 (0.0%) |
| 75 Years and over | 0 (0.0%) | 0 (0.0%) |
| Total | 3 (18.8%) | 8 (66.7%) |
Income Above Poverty by Sex and Age in Levelock
According to the poverty statistics in Levelock, males aged 12 to 14 years and females aged 55 to 64 years are the age groups that are most secure financially, with 100.0% of males and 100.0% of females in these age groups living above the poverty line.
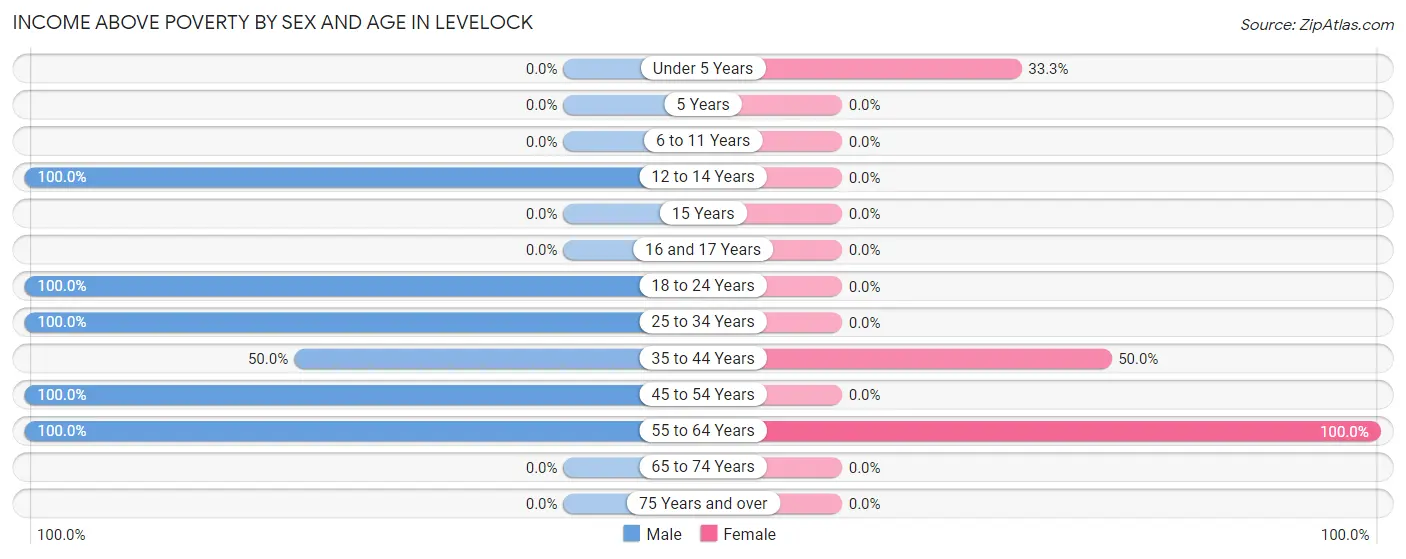
| Age Bracket | Male | Female |
| Under 5 Years | 0 (0.0%) | 1 (33.3%) |
| 5 Years | 0 (0.0%) | 0 (0.0%) |
| 6 to 11 Years | 0 (0.0%) | 0 (0.0%) |
| 12 to 14 Years | 1 (100.0%) | 0 (0.0%) |
| 15 Years | 0 (0.0%) | 0 (0.0%) |
| 16 and 17 Years | 0 (0.0%) | 0 (0.0%) |
| 18 to 24 Years | 6 (100.0%) | 0 (0.0%) |
| 25 to 34 Years | 1 (100.0%) | 0 (0.0%) |
| 35 to 44 Years | 3 (50.0%) | 2 (50.0%) |
| 45 to 54 Years | 1 (100.0%) | 0 (0.0%) |
| 55 to 64 Years | 1 (100.0%) | 1 (100.0%) |
| 65 to 74 Years | 0 (0.0%) | 0 (0.0%) |
| 75 Years and over | 0 (0.0%) | 0 (0.0%) |
| Total | 13 (81.2%) | 4 (33.3%) |
Income Below Poverty Among Married-Couple Families in Levelock
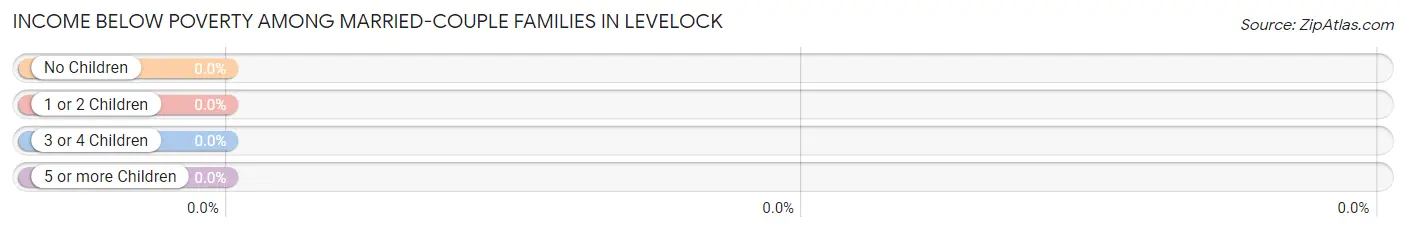
| Children | Above Poverty | Below Poverty |
| No Children | 1 (100.0%) | 0 (0.0%) |
| 1 or 2 Children | 0 (0.0%) | 0 (0.0%) |
| 3 or 4 Children | 0 (0.0%) | 0 (0.0%) |
| 5 or more Children | 0 (0.0%) | 0 (0.0%) |
| Total | 1 (100.0%) | 0 (0.0%) |
Income Below Poverty Among Single-Parent Households in Levelock
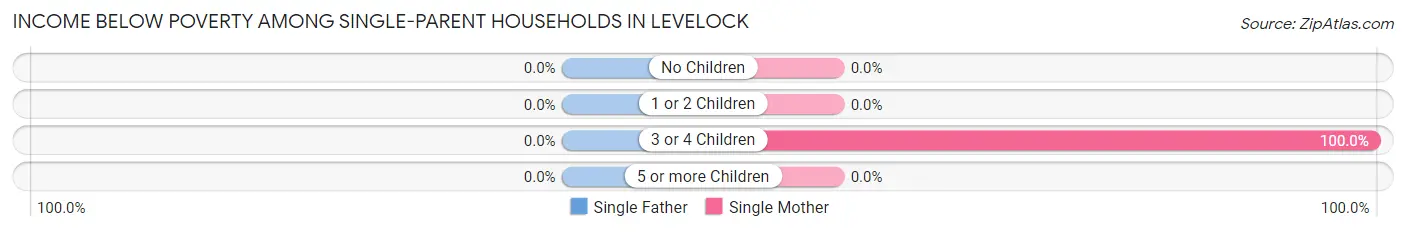
| Children | Single Father | Single Mother |
| No Children | 0 (0.0%) | 0 (0.0%) |
| 1 or 2 Children | 0 (0.0%) | 0 (0.0%) |
| 3 or 4 Children | 0 (0.0%) | 2 (100.0%) |
| 5 or more Children | 0 (0.0%) | 0 (0.0%) |
| Total | 0 (0.0%) | 2 (50.0%) |
Income Below Poverty Among Married-Couple vs Single-Parent Households in Levelock
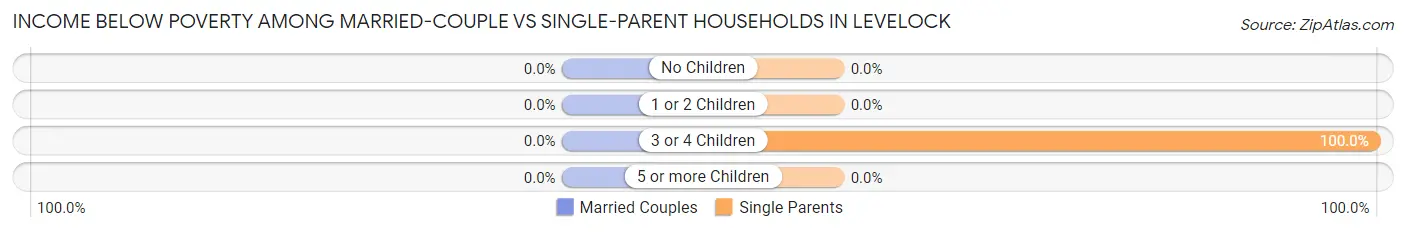
| Children | Married-Couple Families | Single-Parent Households |
| No Children | 0 (0.0%) | 0 (0.0%) |
| 1 or 2 Children | 0 (0.0%) | 0 (0.0%) |
| 3 or 4 Children | 0 (0.0%) | 2 (100.0%) |
| 5 or more Children | 0 (0.0%) | 0 (0.0%) |
| Total | 0 (0.0%) | 2 (20.0%) |
Race in Levelock
The most populous races in Levelock are Native / Alaskan (26 | 92.9%), and White / Caucasian (2 | 7.1%).
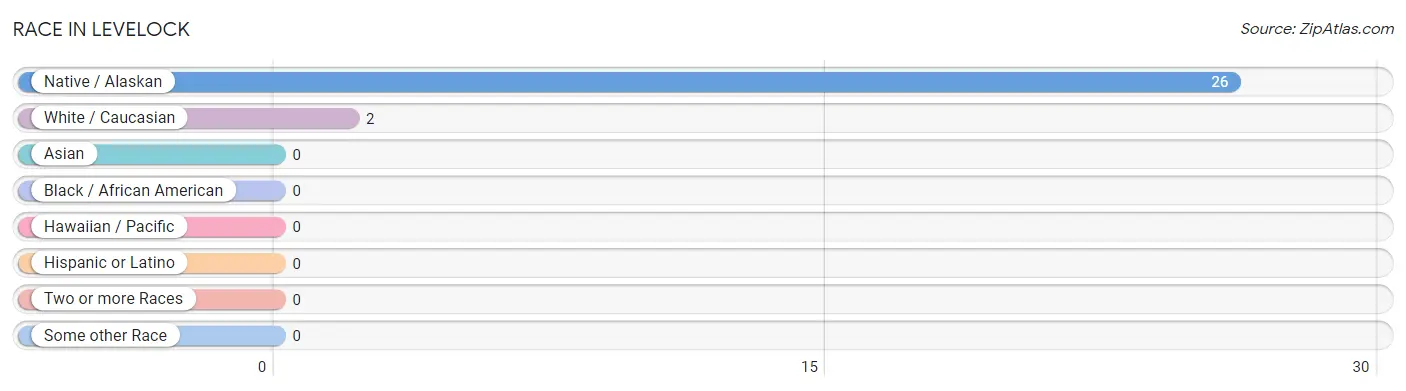
| Race | # Population | % Population |
| Asian | 0 | 0.0% |
| Black / African American | 0 | 0.0% |
| Hawaiian / Pacific | 0 | 0.0% |
| Hispanic or Latino | 0 | 0.0% |
| Native / Alaskan | 26 | 92.9% |
| White / Caucasian | 2 | 7.1% |
| Two or more Races | 0 | 0.0% |
| Some other Race | 0 | 0.0% |
| Total | 28 | 100.0% |
Ancestry in Levelock
The most populous ancestries reported in Levelock are , and Yup'ik (26 | 92.9%), together accounting for 92.9% of all Levelock residents.

| Ancestry | # Population | % Population |
| Yup'ik | 26 | 92.9% | View All 1 Rows |
Immigrants in Levelock

| Immigration Origin | # Population | % Population | View All 0 Rows |
Sex and Age in Levelock
Sex and Age in Levelock
The most populous age groups in Levelock are 20 to 24 Years (6 | 37.5%) for men and Under 5 Years (3 | 25.0%) for women.
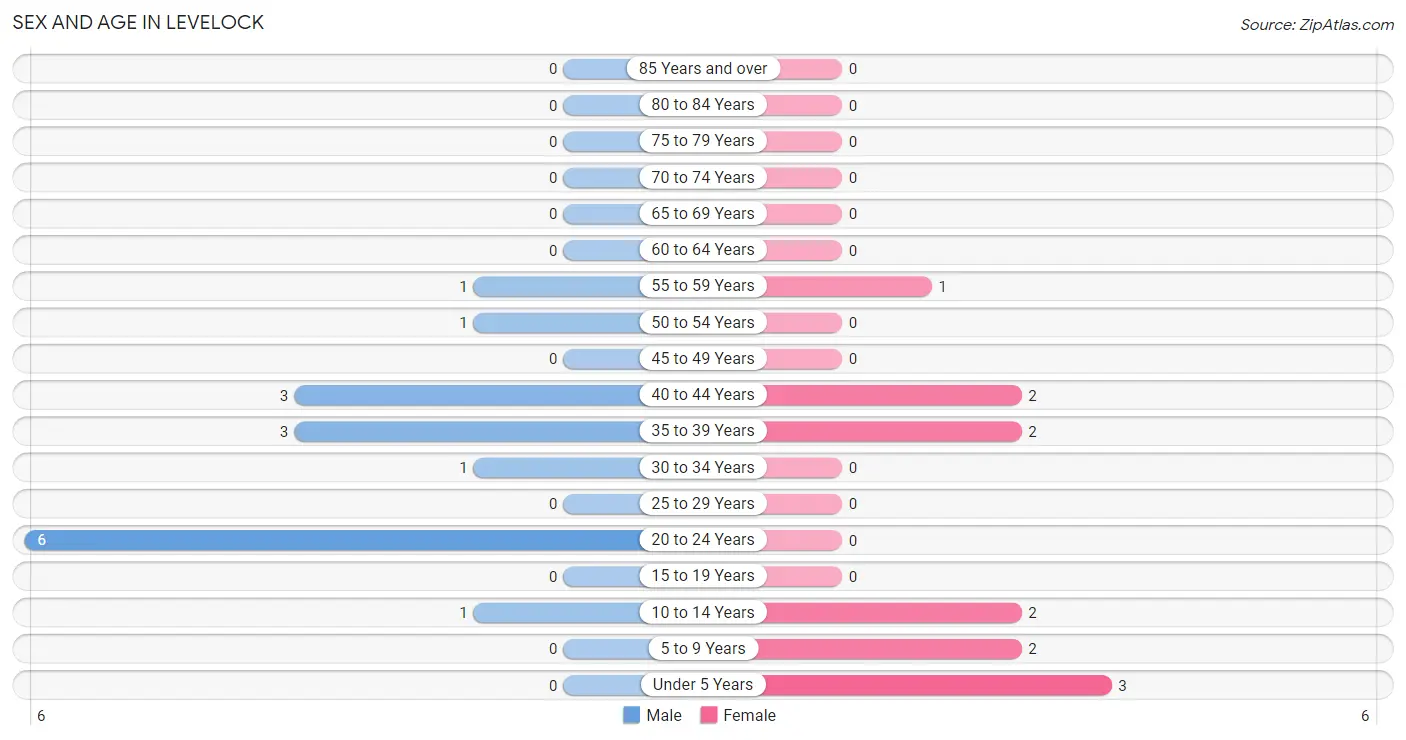
| Age Bracket | Male | Female |
| Under 5 Years | 0 (0.0%) | 3 (25.0%) |
| 5 to 9 Years | 0 (0.0%) | 2 (16.7%) |
| 10 to 14 Years | 1 (6.2%) | 2 (16.7%) |
| 15 to 19 Years | 0 (0.0%) | 0 (0.0%) |
| 20 to 24 Years | 6 (37.5%) | 0 (0.0%) |
| 25 to 29 Years | 0 (0.0%) | 0 (0.0%) |
| 30 to 34 Years | 1 (6.2%) | 0 (0.0%) |
| 35 to 39 Years | 3 (18.8%) | 2 (16.7%) |
| 40 to 44 Years | 3 (18.8%) | 2 (16.7%) |
| 45 to 49 Years | 0 (0.0%) | 0 (0.0%) |
| 50 to 54 Years | 1 (6.2%) | 0 (0.0%) |
| 55 to 59 Years | 1 (6.2%) | 1 (8.3%) |
| 60 to 64 Years | 0 (0.0%) | 0 (0.0%) |
| 65 to 69 Years | 0 (0.0%) | 0 (0.0%) |
| 70 to 74 Years | 0 (0.0%) | 0 (0.0%) |
| 75 to 79 Years | 0 (0.0%) | 0 (0.0%) |
| 80 to 84 Years | 0 (0.0%) | 0 (0.0%) |
| 85 Years and over | 0 (0.0%) | 0 (0.0%) |
| Total | 16 (100.0%) | 12 (100.0%) |
Families and Households in Levelock
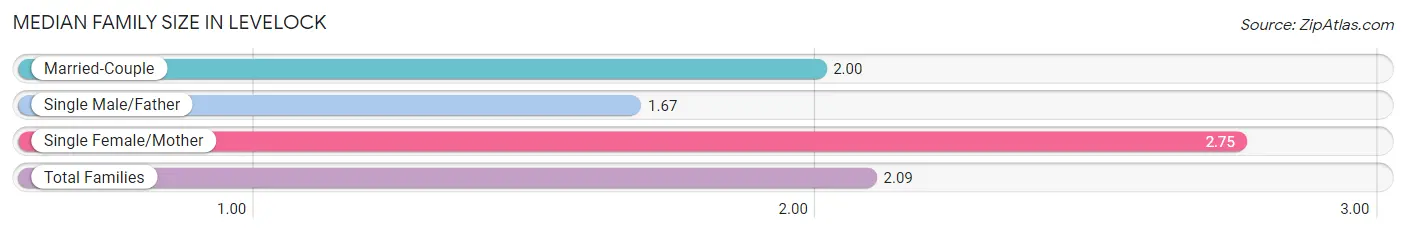
Median Family Size in Levelock
The median family size in Levelock is 2.09 persons per family, with single female/mother families (4 | 36.4%) accounting for the largest median family size of 2.75 persons per family. On the other hand, single male/father families (6 | 54.5%) represent the smallest median family size with 1.67 persons per family.
| Family Type | # Families | Family Size |
| Married-Couple | 1 (9.1%) | 2.00 |
| Single Male/Father | 6 (54.5%) | 1.67 |
| Single Female/Mother | 4 (36.4%) | 2.75 |
| Total Families | 11 (100.0%) | 2.09 |
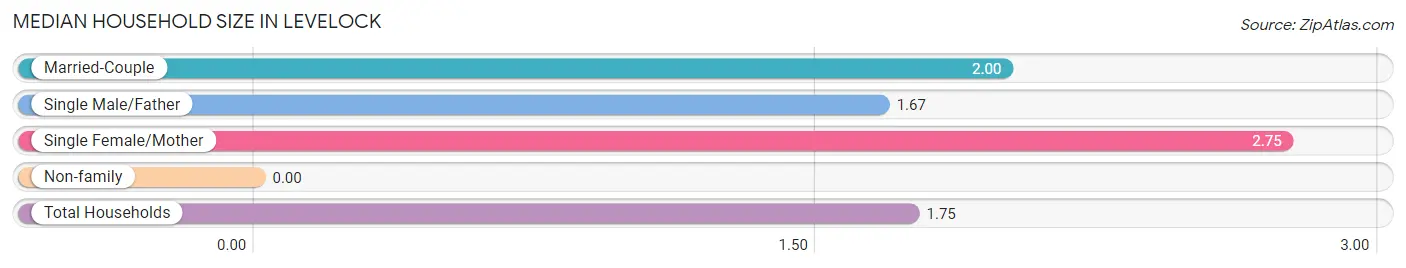
Median Household Size in Levelock
| Household Type | # Households | Household Size |
| Married-Couple | 1 (6.2%) | 2.00 |
| Single Male/Father | 6 (37.5%) | 1.67 |
| Single Female/Mother | 4 (25.0%) | 2.75 |
| Non-family | 5 (31.2%) | - |
| Total Households | 16 (100.0%) | 1.75 |
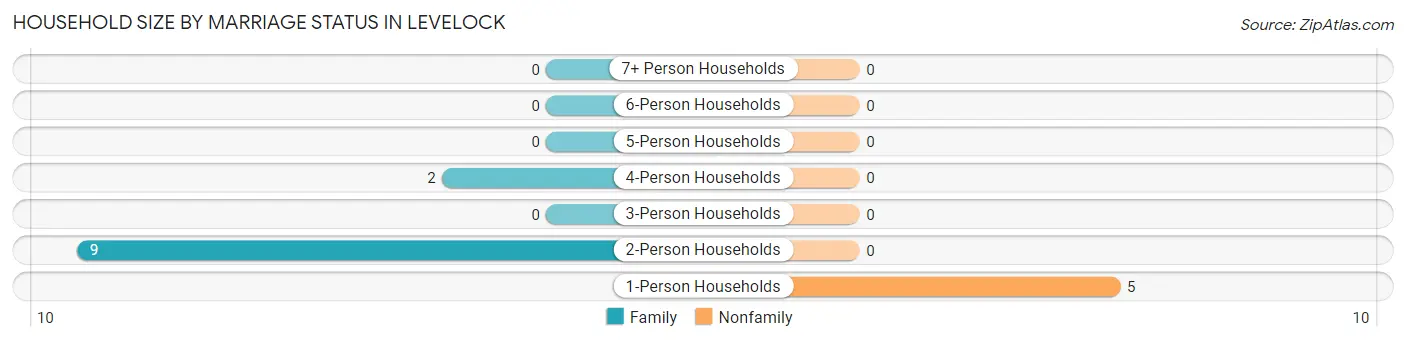
Household Size by Marriage Status in Levelock
Out of a total of 16 households in Levelock, 11 (68.8%) are family households, while 5 (31.2%) are nonfamily households. The most numerous type of family households are 2-person households, comprising 9, and the most common type of nonfamily households are 1-person households, comprising 5.
| Household Size | Family Households | Nonfamily Households |
| 1-Person Households | - | 5 (31.2%) |
| 2-Person Households | 9 (56.2%) | 0 (0.0%) |
| 3-Person Households | 0 (0.0%) | 0 (0.0%) |
| 4-Person Households | 2 (12.5%) | 0 (0.0%) |
| 5-Person Households | 0 (0.0%) | 0 (0.0%) |
| 6-Person Households | 0 (0.0%) | 0 (0.0%) |
| 7+ Person Households | 0 (0.0%) | 0 (0.0%) |
| Total | 11 (68.8%) | 5 (31.2%) |
Female Fertility in Levelock
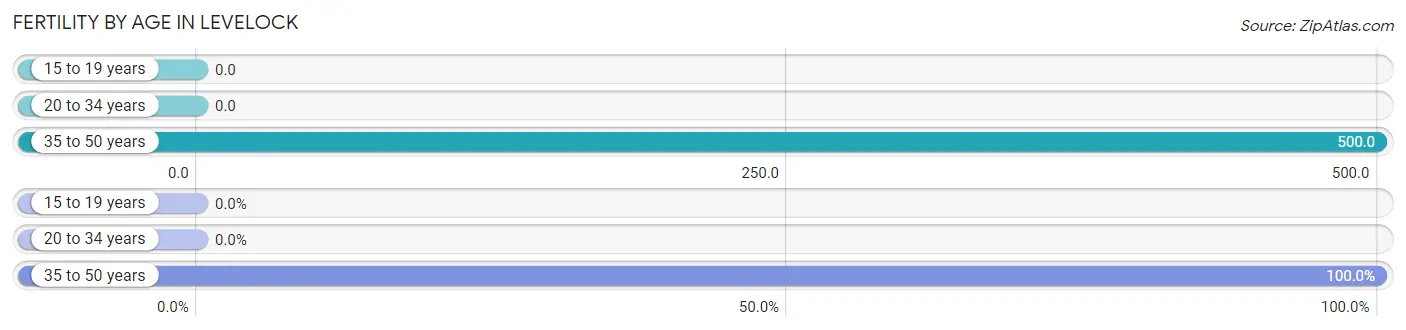
Fertility by Age in Levelock
Average fertility rate in Levelock is 500.0 births per 1,000 women. Women in the age bracket of 35 to 50 years have the highest fertility rate with 500.0 births per 1,000 women. Women in the age bracket of 35 to 50 years acount for 100.0% of all women with births.
| Age Bracket | Women with Births | Births / 1,000 Women |
| 15 to 19 years | 0 (0.0%) | 0.0 |
| 20 to 34 years | 0 (0.0%) | 0.0 |
| 35 to 50 years | 2 (100.0%) | 500.0 |
| Total | 2 (100.0%) | 500.0 |
Fertility by Age by Marriage Status in Levelock
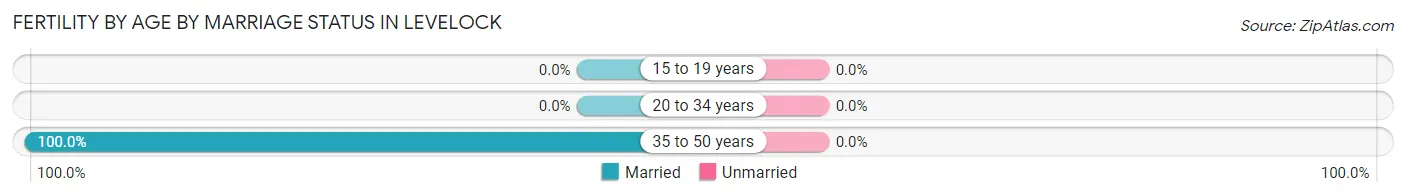
| Age Bracket | Married | Unmarried |
| 15 to 19 years | 0 (0.0%) | 0 (0.0%) |
| 20 to 34 years | 0 (0.0%) | 0 (0.0%) |
| 35 to 50 years | 2 (100.0%) | 0 (0.0%) |
| Total | 2 (100.0%) | 0 (0.0%) |
Fertility by Education in Levelock
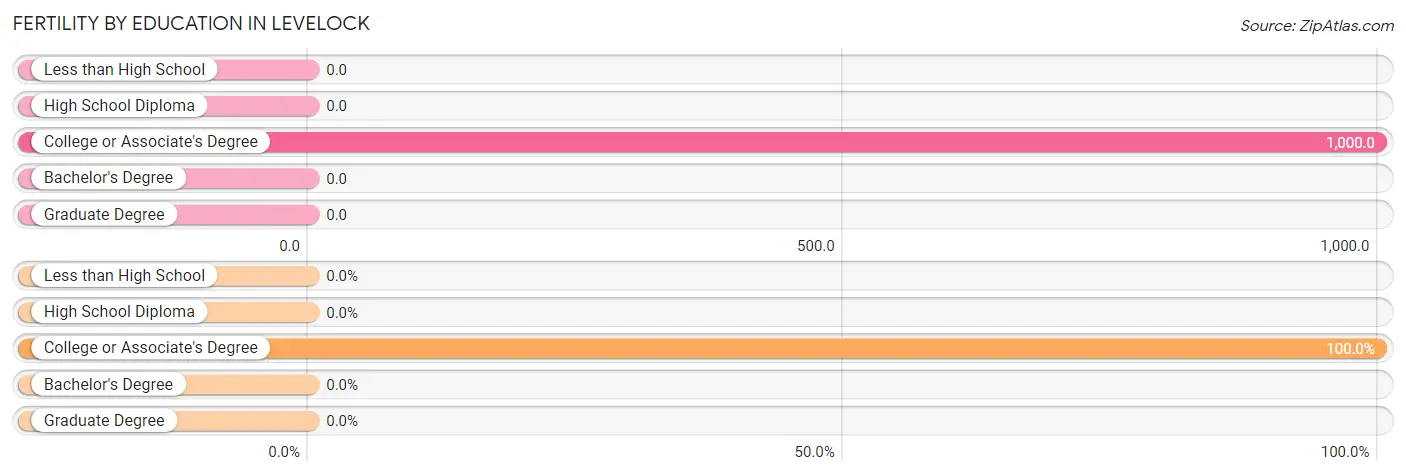
| Educational Attainment | Women with Births | Births / 1,000 Women |
| Less than High School | 0 (0.0%) | 0.0 |
| High School Diploma | 0 (0.0%) | 0.0 |
| College or Associate's Degree | 2 (100.0%) | 1,000.0 |
| Bachelor's Degree | 0 (0.0%) | 0.0 |
| Graduate Degree | 0 (0.0%) | 0.0 |
| Total | 2 (100.0%) | 500.0 |
Fertility by Education by Marriage Status in Levelock
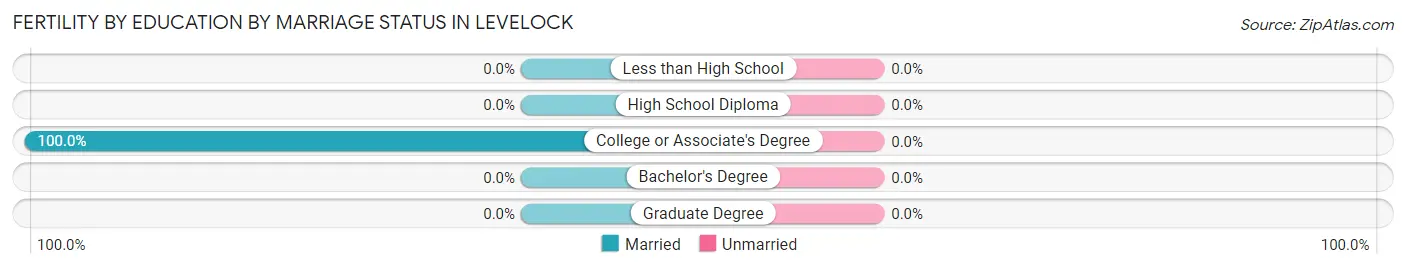
| Educational Attainment | Married | Unmarried |
| Less than High School | 0 (0.0%) | 0 (0.0%) |
| High School Diploma | 0 (0.0%) | 0 (0.0%) |
| College or Associate's Degree | 2 (100.0%) | 0 (0.0%) |
| Bachelor's Degree | 0 (0.0%) | 0 (0.0%) |
| Graduate Degree | 0 (0.0%) | 0 (0.0%) |
| Total | 2 (100.0%) | 0 (0.0%) |
Employment Characteristics in Levelock
Employment by Class of Employer in Levelock
Among the 12 employed individuals in Levelock, local government employees (6 | 50.0%), state government employees (5 | 41.7%), and not-for-profit organizations (1 | 8.3%) make up the most common classes of employment.
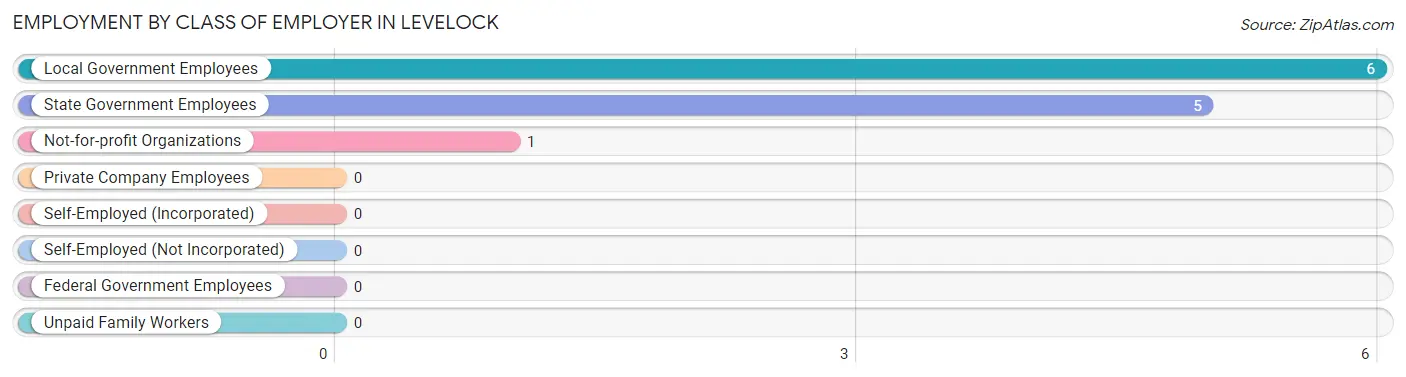
| Employer Class | # Employees | % Employees |
| Private Company Employees | 0 | 0.0% |
| Self-Employed (Incorporated) | 0 | 0.0% |
| Self-Employed (Not Incorporated) | 0 | 0.0% |
| Not-for-profit Organizations | 1 | 8.3% |
| Local Government Employees | 6 | 50.0% |
| State Government Employees | 5 | 41.7% |
| Federal Government Employees | 0 | 0.0% |
| Unpaid Family Workers | 0 | 0.0% |
| Total | 12 | 100.0% |
Employment Status by Age in Levelock
According to the labor force statistics for Levelock, out of the total population over 16 years of age (20), 85.0% or 17 individuals are in the labor force, with 29.4% or 5 of them unemployed. The age group with the highest labor force participation rate is 20 to 24 years, with 100.0% or 6 individuals in the labor force. Within the labor force, the 35 to 44 years age range has the highest percentage of unemployed individuals, with 71.4% or 5 of them being unemployed.
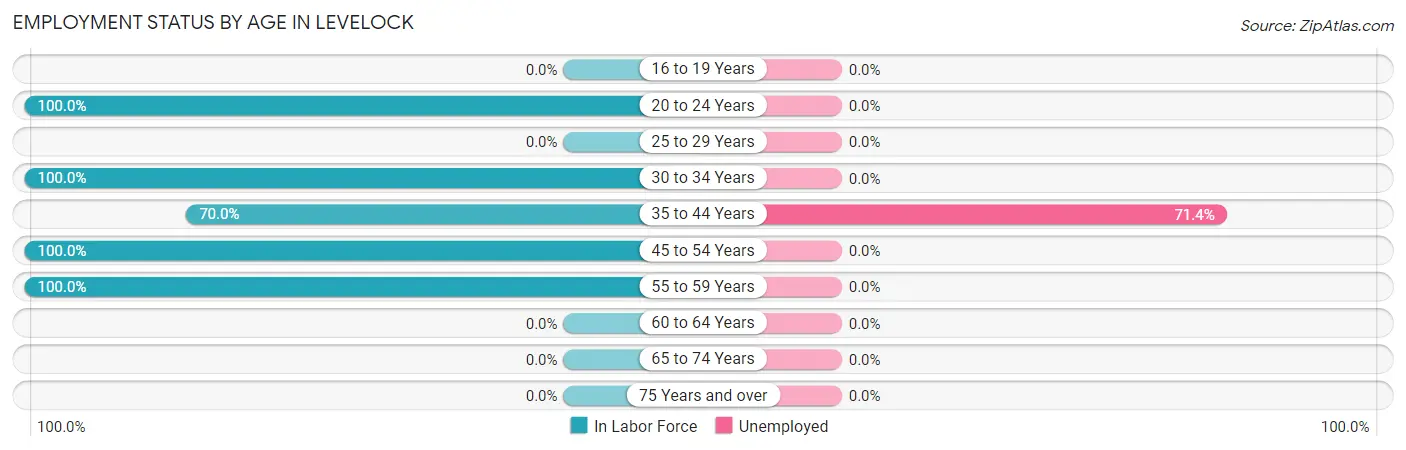
| Age Bracket | In Labor Force | Unemployed |
| 16 to 19 Years | 0 (0.0%) | 0 (0.0%) |
| 20 to 24 Years | 6 (100.0%) | 0 (0.0%) |
| 25 to 29 Years | 0 (0.0%) | 0 (0.0%) |
| 30 to 34 Years | 1 (100.0%) | 0 (0.0%) |
| 35 to 44 Years | 7 (70.0%) | 5 (71.4%) |
| 45 to 54 Years | 1 (100.0%) | 0 (0.0%) |
| 55 to 59 Years | 2 (100.0%) | 0 (0.0%) |
| 60 to 64 Years | 0 (0.0%) | 0 (0.0%) |
| 65 to 74 Years | 0 (0.0%) | 0 (0.0%) |
| 75 Years and over | 0 (0.0%) | 0 (0.0%) |
| Total | 17 (85.0%) | 5 (29.4%) |
Employment Status by Educational Attainment in Levelock
According to labor force statistics for Levelock, 78.6% of individuals (11) out of the total population between 25 and 64 years of age (14) are in the labor force, with 45.5% or 5 of them being unemployed. The group with the highest labor force participation rate are those with the educational attainment of less than high school, with 100.0% or 3 individuals in the labor force. Within the labor force, individuals with less than high school education have the highest percentage of unemployment, with 100.0% or 3 of them being unemployed.
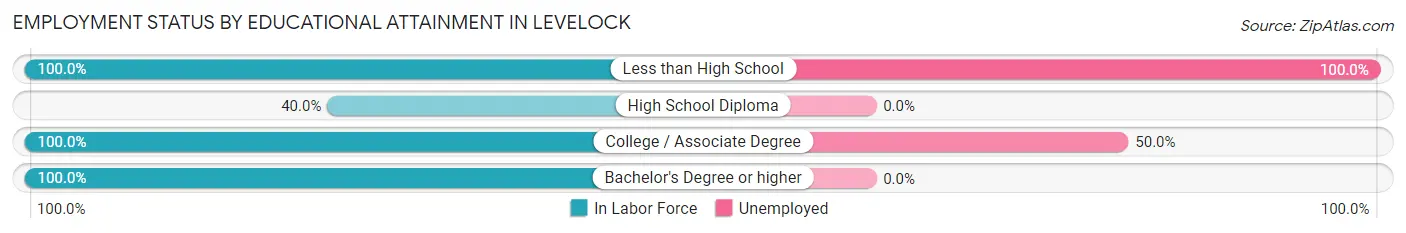
| Educational Attainment | In Labor Force | Unemployed |
| Less than High School | 3 (100.0%) | 3 (100.0%) |
| High School Diploma | 2 (40.0%) | 0 (0.0%) |
| College / Associate Degree | 4 (100.0%) | 2 (50.0%) |
| Bachelor's Degree or higher | 2 (100.0%) | 0 (0.0%) |
| Total | 11 (78.6%) | 6 (45.5%) |
Employment Occupations by Sex in Levelock
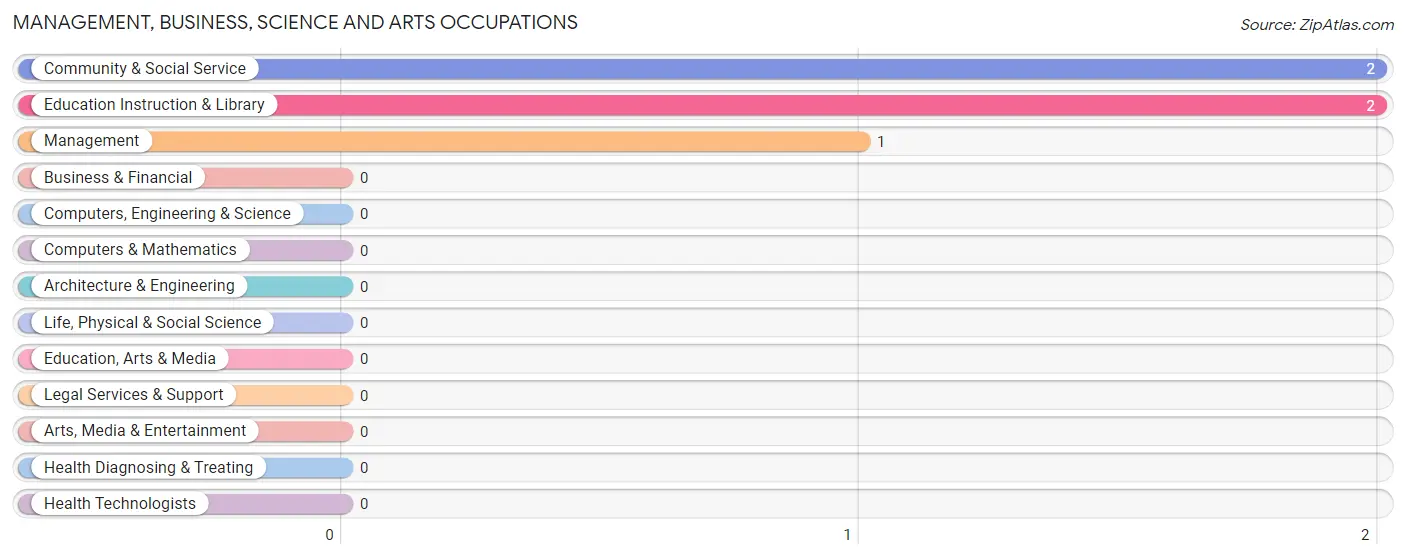
Management, Business, Science and Arts Occupations
The most common Management, Business, Science and Arts occupations in Levelock are Community & Social Service (2 | 16.7%), Education Instruction & Library (2 | 16.7%), and Management (1 | 8.3%).
Management, Business, Science and Arts Occupations by Sex
Within the Management, Business, Science and Arts occupations in Levelock, the most male-oriented occupations are Management (100.0%), Community & Social Service (50.0%), and Education Instruction & Library (50.0%), while the most female-oriented occupations are Community & Social Service (50.0%), and Education Instruction & Library (50.0%).
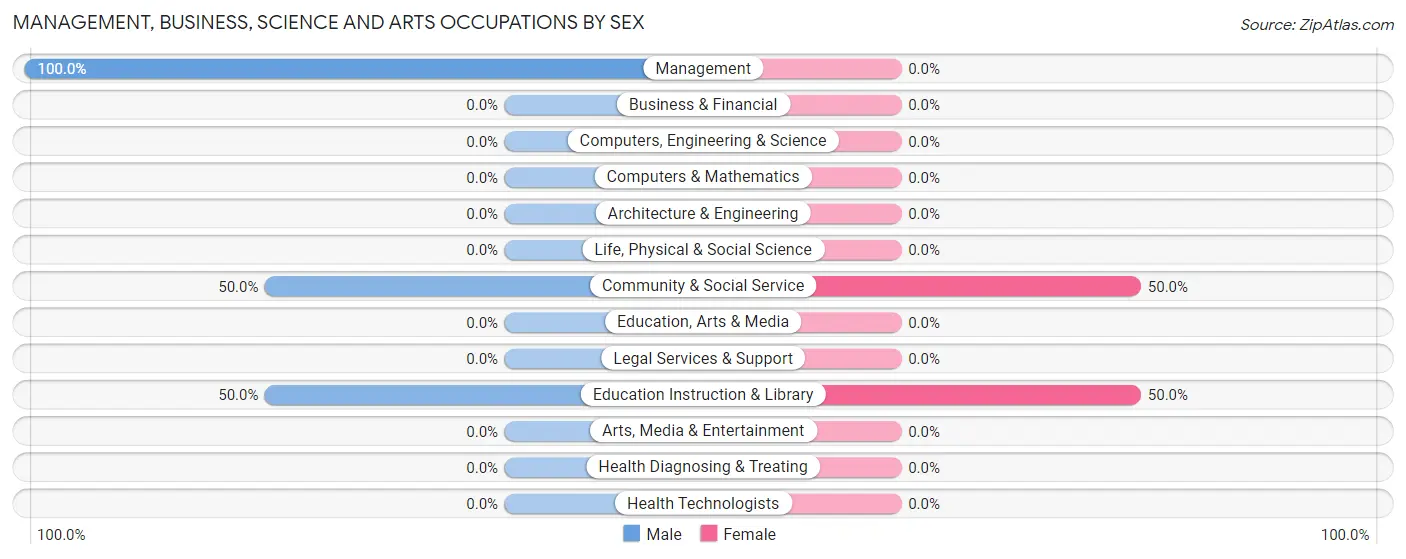
| Occupation | Male | Female |
| Management | 1 (100.0%) | 0 (0.0%) |
| Business & Financial | 0 (0.0%) | 0 (0.0%) |
| Computers, Engineering & Science | 0 (0.0%) | 0 (0.0%) |
| Computers & Mathematics | 0 (0.0%) | 0 (0.0%) |
| Architecture & Engineering | 0 (0.0%) | 0 (0.0%) |
| Life, Physical & Social Science | 0 (0.0%) | 0 (0.0%) |
| Community & Social Service | 1 (50.0%) | 1 (50.0%) |
| Education, Arts & Media | 0 (0.0%) | 0 (0.0%) |
| Legal Services & Support | 0 (0.0%) | 0 (0.0%) |
| Education Instruction & Library | 1 (50.0%) | 1 (50.0%) |
| Arts, Media & Entertainment | 0 (0.0%) | 0 (0.0%) |
| Health Diagnosing & Treating | 0 (0.0%) | 0 (0.0%) |
| Health Technologists | 0 (0.0%) | 0 (0.0%) |
| Total (Category) | 2 (66.7%) | 1 (33.3%) |
| Total (Overall) | 9 (75.0%) | 3 (25.0%) |
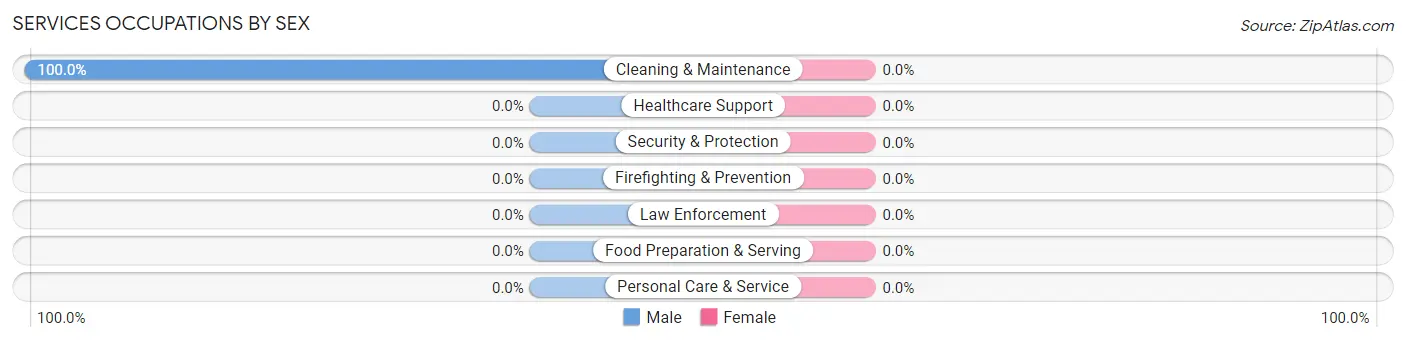
Services Occupations
The most common Services occupations in Levelock are , and Cleaning & Maintenance (3 | 25.0%).
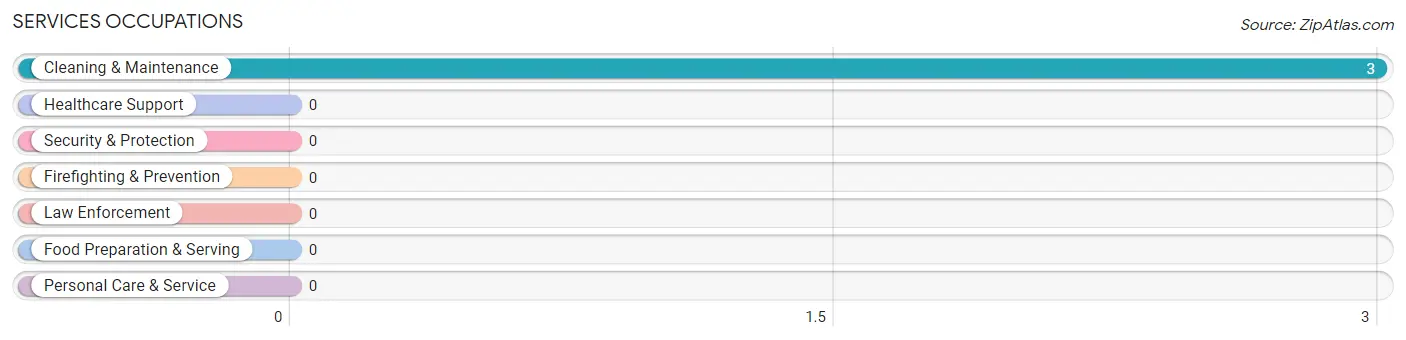
Services Occupations by Sex
| Occupation | Male | Female |
| Healthcare Support | 0 (0.0%) | 0 (0.0%) |
| Security & Protection | 0 (0.0%) | 0 (0.0%) |
| Firefighting & Prevention | 0 (0.0%) | 0 (0.0%) |
| Law Enforcement | 0 (0.0%) | 0 (0.0%) |
| Food Preparation & Serving | 0 (0.0%) | 0 (0.0%) |
| Cleaning & Maintenance | 3 (100.0%) | 0 (0.0%) |
| Personal Care & Service | 0 (0.0%) | 0 (0.0%) |
| Total (Category) | 3 (100.0%) | 0 (0.0%) |
| Total (Overall) | 9 (75.0%) | 3 (25.0%) |
Sales and Office Occupations
The most common Sales and Office occupations in Levelock are , and Office & Administration (2 | 16.7%).
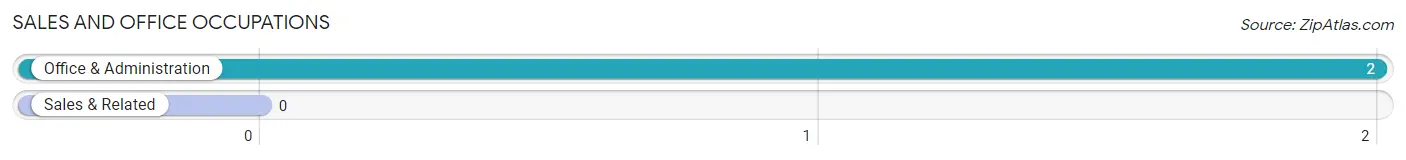
Sales and Office Occupations by Sex
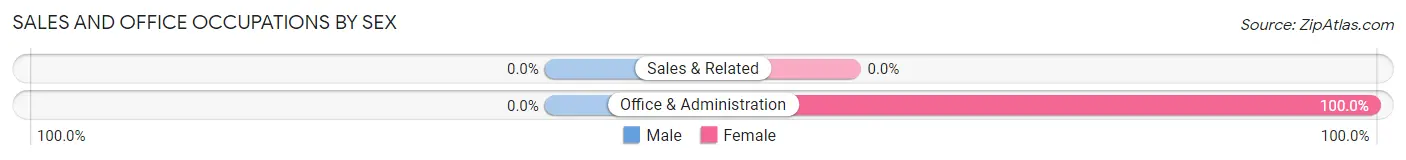
| Occupation | Male | Female |
| Sales & Related | 0 (0.0%) | 0 (0.0%) |
| Office & Administration | 0 (0.0%) | 2 (100.0%) |
| Total (Category) | 0 (0.0%) | 2 (100.0%) |
| Total (Overall) | 9 (75.0%) | 3 (25.0%) |
Natural Resources, Construction and Maintenance Occupations
Natural Resources, Construction and Maintenance Occupations by Sex
| Occupation | Male | Female |
| Farming, Fishing & Forestry | 0 (0.0%) | 0 (0.0%) |
| Construction & Extraction | 0 (0.0%) | 0 (0.0%) |
| Installation, Maintenance & Repair | 0 (0.0%) | 0 (0.0%) |
| Total (Category) | 0 (0.0%) | 0 (0.0%) |
| Total (Overall) | 9 (75.0%) | 3 (25.0%) |
Production, Transportation and Moving Occupations
The most common Production, Transportation and Moving occupations in Levelock are , and Production (4 | 33.3%).
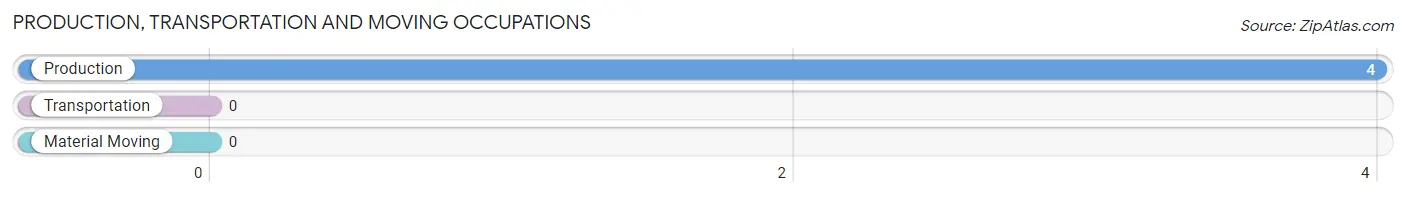
Production, Transportation and Moving Occupations by Sex
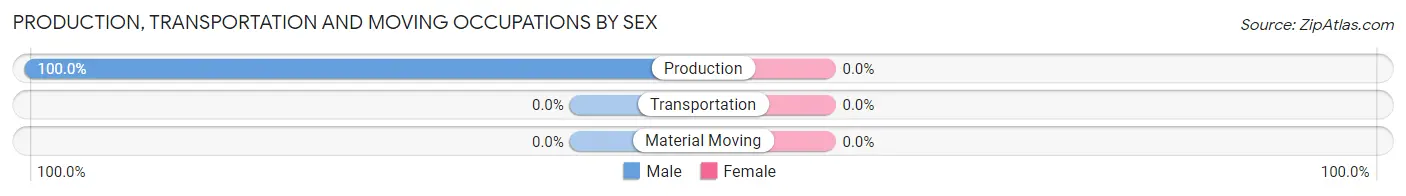
| Occupation | Male | Female |
| Production | 4 (100.0%) | 0 (0.0%) |
| Transportation | 0 (0.0%) | 0 (0.0%) |
| Material Moving | 0 (0.0%) | 0 (0.0%) |
| Total (Category) | 4 (100.0%) | 0 (0.0%) |
| Total (Overall) | 9 (75.0%) | 3 (25.0%) |
Employment Industries by Sex in Levelock
Employment Industries in Levelock
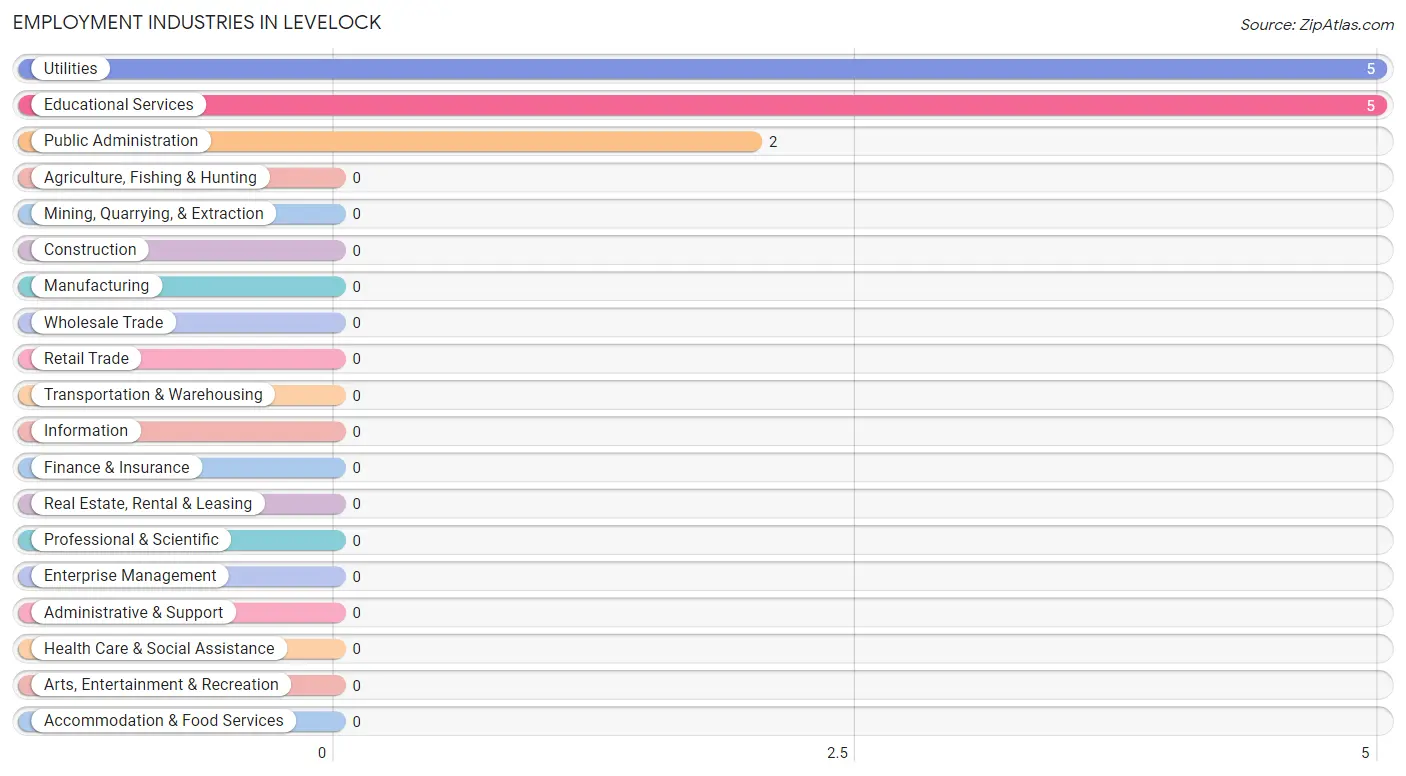
The major employment industries in Levelock include Utilities (5 | 41.7%), Educational Services (5 | 41.7%), and Public Administration (2 | 16.7%).
Employment Industries by Sex in Levelock
The Levelock industries that see more men than women are Utilities (100.0%), and Educational Services (80.0%), whereas the industries that tend to have a higher number of women are Public Administration (100.0%), and Educational Services (20.0%).
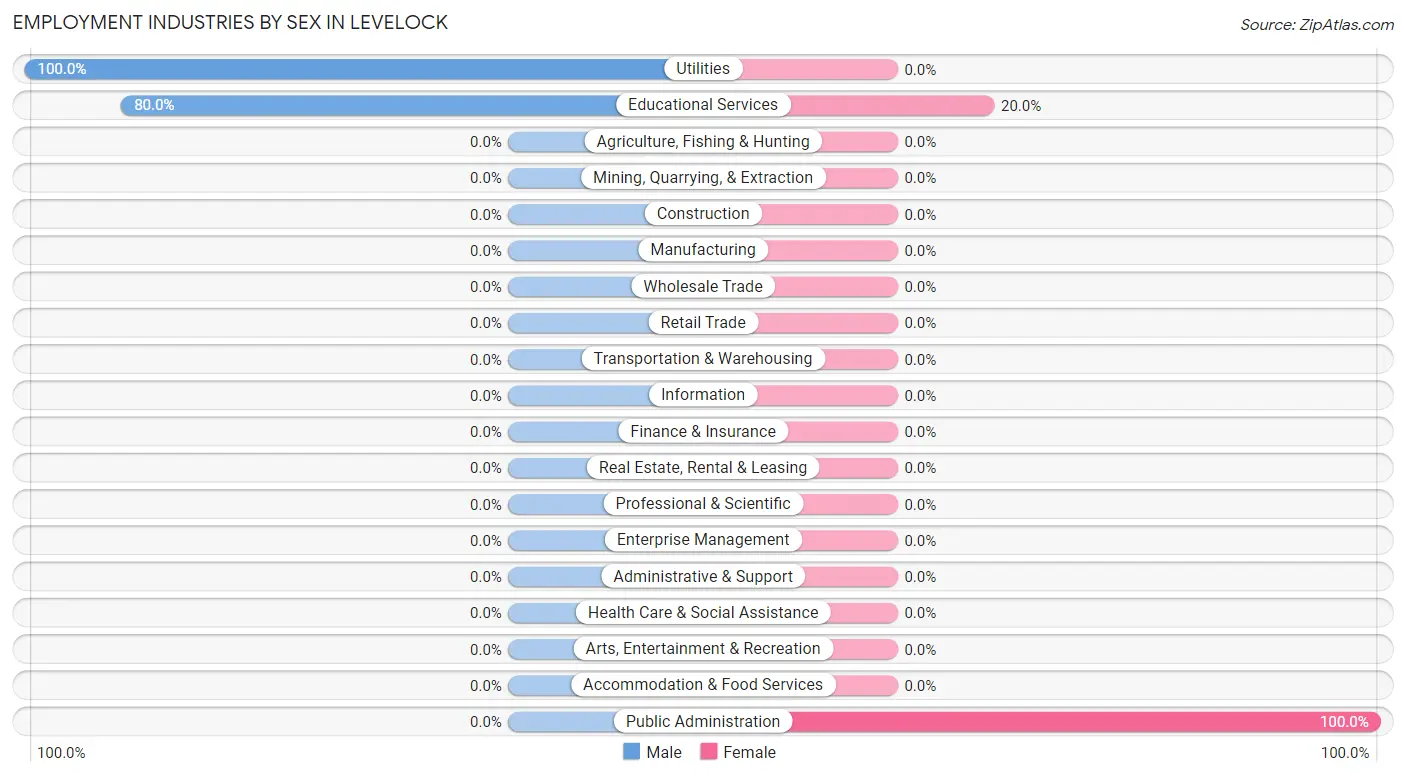
| Industry | Male | Female |
| Agriculture, Fishing & Hunting | 0 (0.0%) | 0 (0.0%) |
| Mining, Quarrying, & Extraction | 0 (0.0%) | 0 (0.0%) |
| Construction | 0 (0.0%) | 0 (0.0%) |
| Manufacturing | 0 (0.0%) | 0 (0.0%) |
| Wholesale Trade | 0 (0.0%) | 0 (0.0%) |
| Retail Trade | 0 (0.0%) | 0 (0.0%) |
| Transportation & Warehousing | 0 (0.0%) | 0 (0.0%) |
| Utilities | 5 (100.0%) | 0 (0.0%) |
| Information | 0 (0.0%) | 0 (0.0%) |
| Finance & Insurance | 0 (0.0%) | 0 (0.0%) |
| Real Estate, Rental & Leasing | 0 (0.0%) | 0 (0.0%) |
| Professional & Scientific | 0 (0.0%) | 0 (0.0%) |
| Enterprise Management | 0 (0.0%) | 0 (0.0%) |
| Administrative & Support | 0 (0.0%) | 0 (0.0%) |
| Educational Services | 4 (80.0%) | 1 (20.0%) |
| Health Care & Social Assistance | 0 (0.0%) | 0 (0.0%) |
| Arts, Entertainment & Recreation | 0 (0.0%) | 0 (0.0%) |
| Accommodation & Food Services | 0 (0.0%) | 0 (0.0%) |
| Public Administration | 0 (0.0%) | 2 (100.0%) |
| Total | 9 (75.0%) | 3 (25.0%) |
Education in Levelock
School Enrollment in Levelock
The most common levels of schooling among the 5 students in Levelock are elementary school (2 | 40.0%), middle school (2 | 40.0%), and high school (1 | 20.0%).
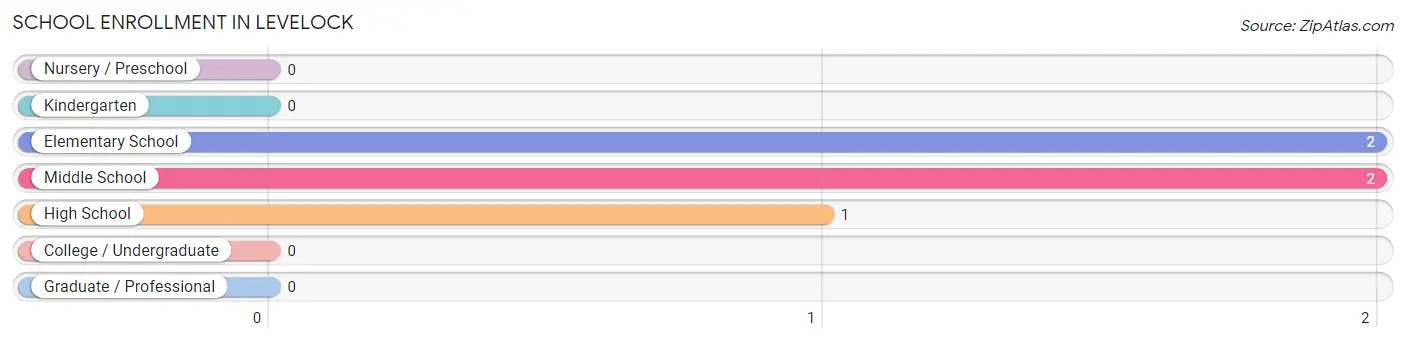
| School Level | # Students | % Students |
| Nursery / Preschool | 0 | 0.0% |
| Kindergarten | 0 | 0.0% |
| Elementary School | 2 | 40.0% |
| Middle School | 2 | 40.0% |
| High School | 1 | 20.0% |
| College / Undergraduate | 0 | 0.0% |
| Graduate / Professional | 0 | 0.0% |
| Total | 5 | 100.0% |
School Enrollment by Age by Funding Source in Levelock
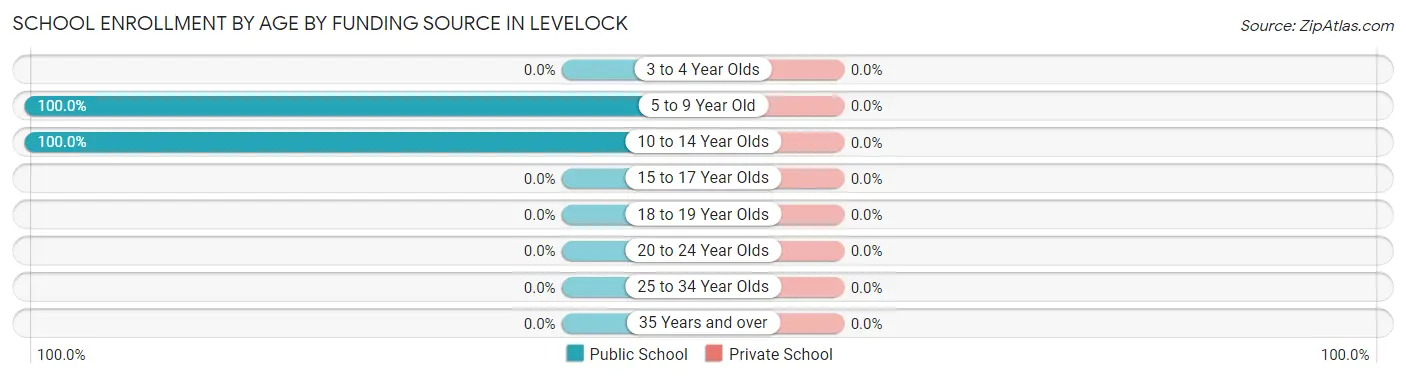
| Age Bracket | Public School | Private School |
| 3 to 4 Year Olds | 0 (0.0%) | 0 (0.0%) |
| 5 to 9 Year Old | 2 (100.0%) | 0 (0.0%) |
| 10 to 14 Year Olds | 3 (100.0%) | 0 (0.0%) |
| 15 to 17 Year Olds | 0 (0.0%) | 0 (0.0%) |
| 18 to 19 Year Olds | 0 (0.0%) | 0 (0.0%) |
| 20 to 24 Year Olds | 0 (0.0%) | 0 (0.0%) |
| 25 to 34 Year Olds | 0 (0.0%) | 0 (0.0%) |
| 35 Years and over | 0 (0.0%) | 0 (0.0%) |
| Total | 5 (100.0%) | 0 (0.0%) |
Educational Attainment by Field of Study in Levelock
Education (1 | 50.0%), and visual & performing arts (1 | 50.0%) are the most common fields of study among 2 individuals in Levelock who have obtained a bachelor's degree or higher.
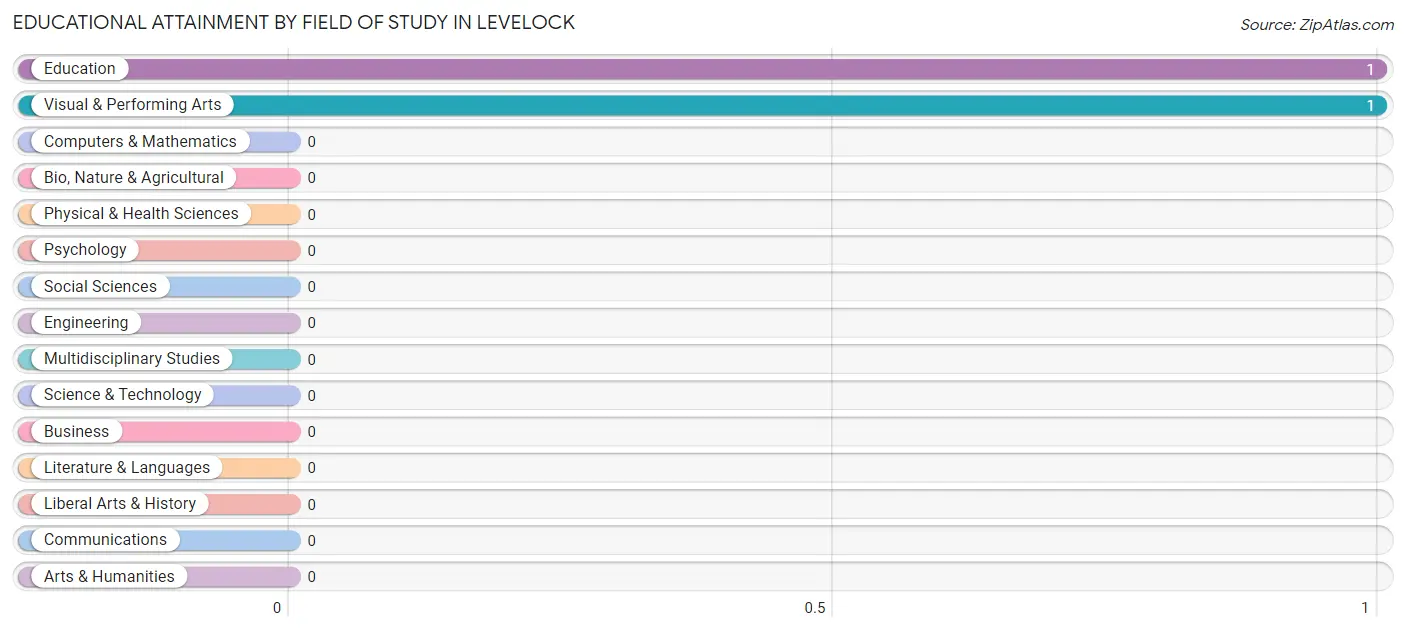
| Field of Study | # Graduates | % Graduates |
| Computers & Mathematics | 0 | 0.0% |
| Bio, Nature & Agricultural | 0 | 0.0% |
| Physical & Health Sciences | 0 | 0.0% |
| Psychology | 0 | 0.0% |
| Social Sciences | 0 | 0.0% |
| Engineering | 0 | 0.0% |
| Multidisciplinary Studies | 0 | 0.0% |
| Science & Technology | 0 | 0.0% |
| Business | 0 | 0.0% |
| Education | 1 | 50.0% |
| Literature & Languages | 0 | 0.0% |
| Liberal Arts & History | 0 | 0.0% |
| Visual & Performing Arts | 1 | 50.0% |
| Communications | 0 | 0.0% |
| Arts & Humanities | 0 | 0.0% |
| Total | 2 | 100.0% |
Transportation & Commute in Levelock
Vehicle Availability by Sex in Levelock
The most prevalent vehicle ownership categories in Levelock are males with no vehicle (8, accounting for 88.9%) and females with no vehicle (3, making up 266.7%).
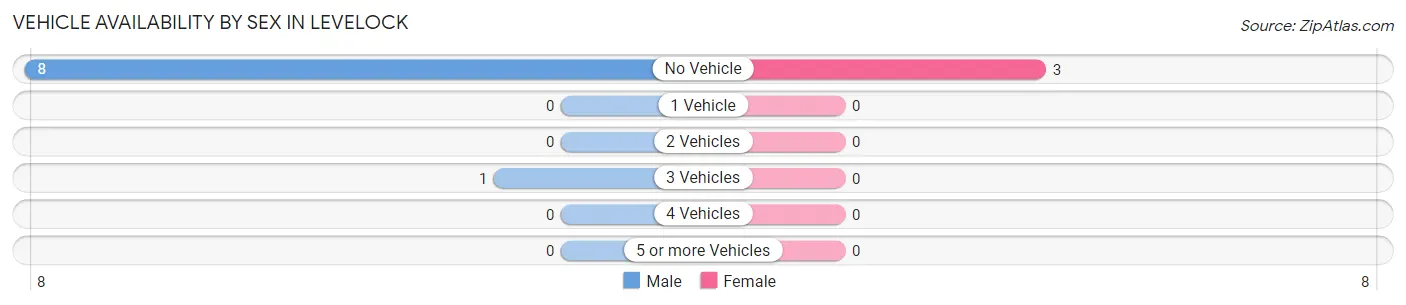
| Vehicles Available | Male | Female |
| No Vehicle | 8 (88.9%) | 3 (100.0%) |
| 1 Vehicle | 0 (0.0%) | 0 (0.0%) |
| 2 Vehicles | 0 (0.0%) | 0 (0.0%) |
| 3 Vehicles | 1 (11.1%) | 0 (0.0%) |
| 4 Vehicles | 0 (0.0%) | 0 (0.0%) |
| 5 or more Vehicles | 0 (0.0%) | 0 (0.0%) |
| Total | 9 (100.0%) | 3 (100.0%) |
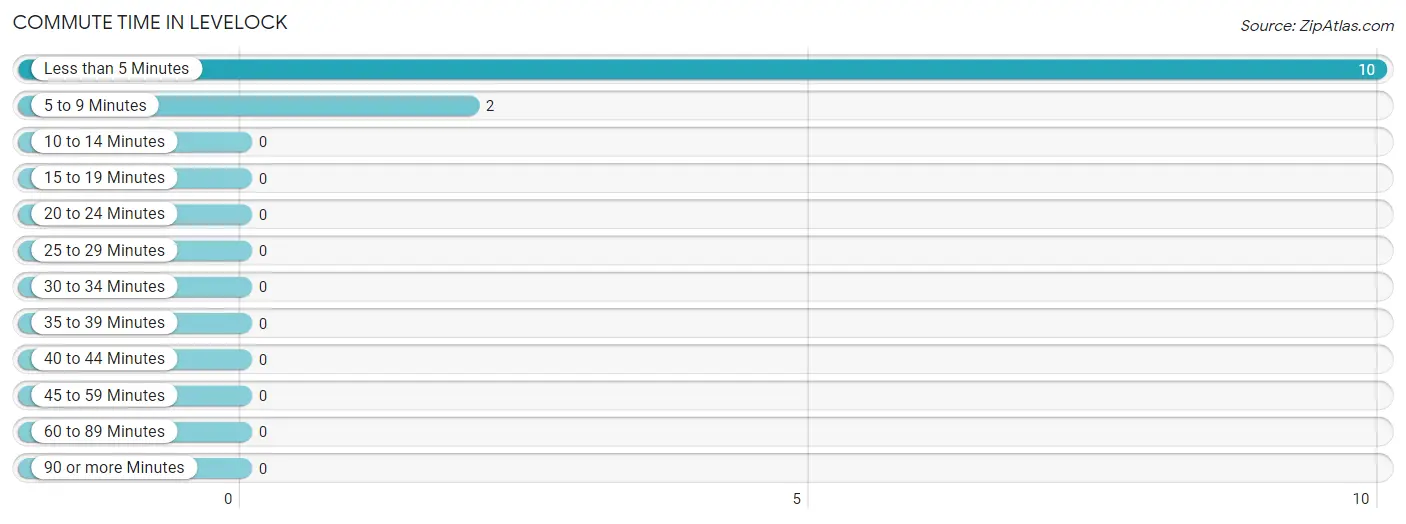
Commute Time in Levelock
The most frequently occuring commute durations in Levelock are less than 5 minutes (10 commuters, 83.3%), 5 to 9 minutes (2 commuters, 16.7%), and 10 to 14 minutes (0 commuters, 0.0%).
| Commute Time | # Commuters | % Commuters |
| Less than 5 Minutes | 10 | 83.3% |
| 5 to 9 Minutes | 2 | 16.7% |
| 10 to 14 Minutes | 0 | 0.0% |
| 15 to 19 Minutes | 0 | 0.0% |
| 20 to 24 Minutes | 0 | 0.0% |
| 25 to 29 Minutes | 0 | 0.0% |
| 30 to 34 Minutes | 0 | 0.0% |
| 35 to 39 Minutes | 0 | 0.0% |
| 40 to 44 Minutes | 0 | 0.0% |
| 45 to 59 Minutes | 0 | 0.0% |
| 60 to 89 Minutes | 0 | 0.0% |
| 90 or more Minutes | 0 | 0.0% |
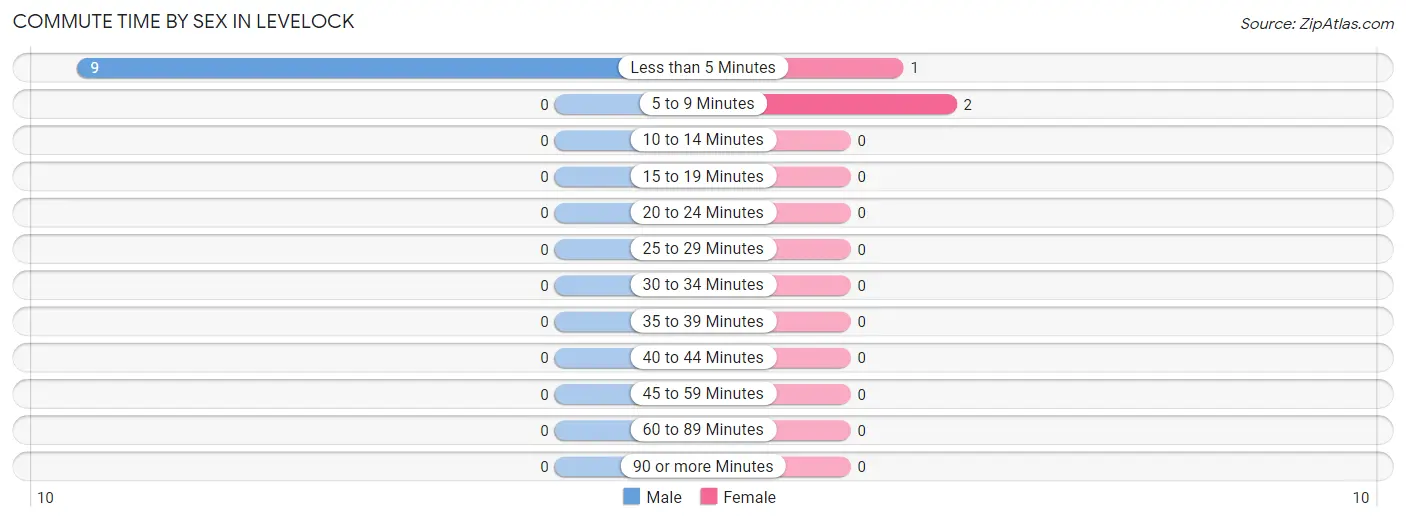
Commute Time by Sex in Levelock
The most common commute times in Levelock are less than 5 minutes (9 commuters, 100.0%) for males and 5 to 9 minutes (2 commuters, 66.7%) for females.
| Commute Time | Male | Female |
| Less than 5 Minutes | 9 (100.0%) | 1 (33.3%) |
| 5 to 9 Minutes | 0 (0.0%) | 2 (66.7%) |
| 10 to 14 Minutes | 0 (0.0%) | 0 (0.0%) |
| 15 to 19 Minutes | 0 (0.0%) | 0 (0.0%) |
| 20 to 24 Minutes | 0 (0.0%) | 0 (0.0%) |
| 25 to 29 Minutes | 0 (0.0%) | 0 (0.0%) |
| 30 to 34 Minutes | 0 (0.0%) | 0 (0.0%) |
| 35 to 39 Minutes | 0 (0.0%) | 0 (0.0%) |
| 40 to 44 Minutes | 0 (0.0%) | 0 (0.0%) |
| 45 to 59 Minutes | 0 (0.0%) | 0 (0.0%) |
| 60 to 89 Minutes | 0 (0.0%) | 0 (0.0%) |
| 90 or more Minutes | 0 (0.0%) | 0 (0.0%) |
Time of Departure to Work by Sex in Levelock
The most frequent times of departure to work in Levelock are 9:00 AM to 9:59 AM (3, 33.3%) for males and 9:00 AM to 9:59 AM (2, 66.7%) for females.
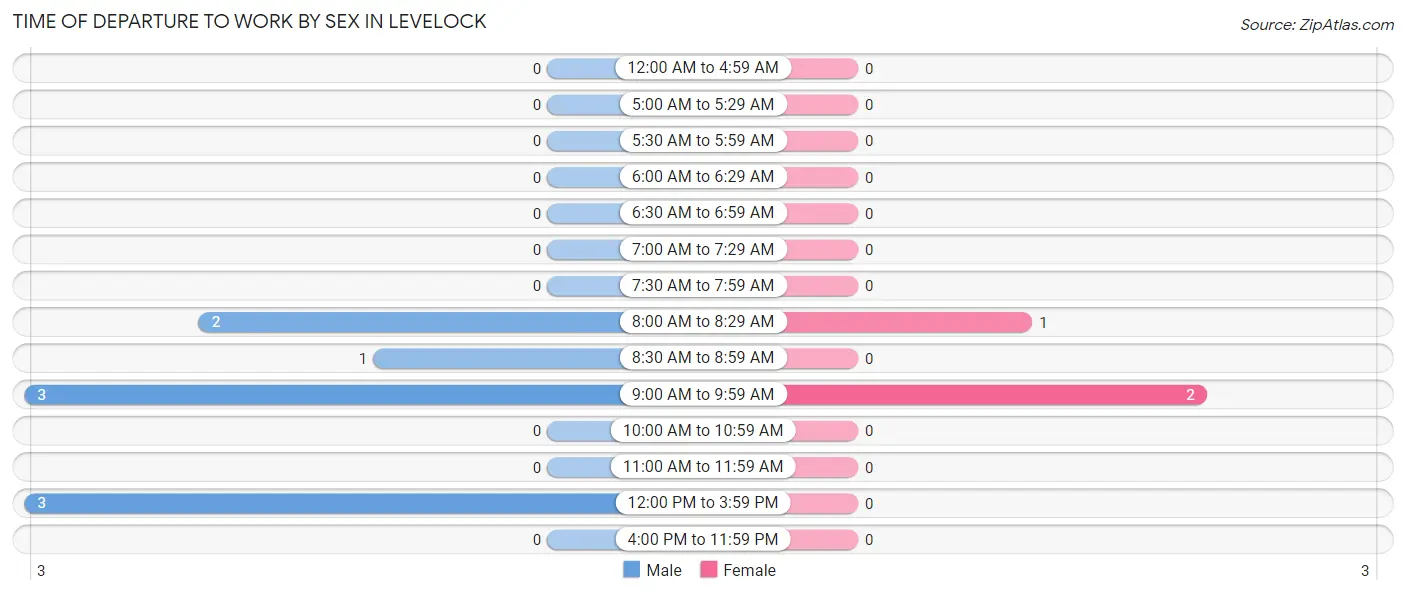
| Time of Departure | Male | Female |
| 12:00 AM to 4:59 AM | 0 (0.0%) | 0 (0.0%) |
| 5:00 AM to 5:29 AM | 0 (0.0%) | 0 (0.0%) |
| 5:30 AM to 5:59 AM | 0 (0.0%) | 0 (0.0%) |
| 6:00 AM to 6:29 AM | 0 (0.0%) | 0 (0.0%) |
| 6:30 AM to 6:59 AM | 0 (0.0%) | 0 (0.0%) |
| 7:00 AM to 7:29 AM | 0 (0.0%) | 0 (0.0%) |
| 7:30 AM to 7:59 AM | 0 (0.0%) | 0 (0.0%) |
| 8:00 AM to 8:29 AM | 2 (22.2%) | 1 (33.3%) |
| 8:30 AM to 8:59 AM | 1 (11.1%) | 0 (0.0%) |
| 9:00 AM to 9:59 AM | 3 (33.3%) | 2 (66.7%) |
| 10:00 AM to 10:59 AM | 0 (0.0%) | 0 (0.0%) |
| 11:00 AM to 11:59 AM | 0 (0.0%) | 0 (0.0%) |
| 12:00 PM to 3:59 PM | 3 (33.3%) | 0 (0.0%) |
| 4:00 PM to 11:59 PM | 0 (0.0%) | 0 (0.0%) |
| Total | 9 (100.0%) | 3 (100.0%) |
Housing Occupancy in Levelock
Occupancy by Ownership in Levelock
Of the total 16 dwellings in Levelock, owner-occupied units account for 6 (37.5%), while renter-occupied units make up 10 (62.5%).
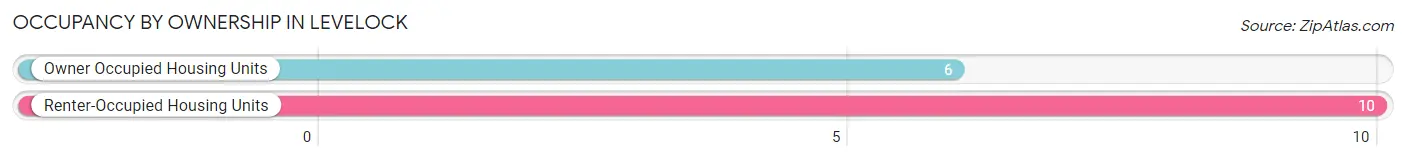
| Occupancy | # Housing Units | % Housing Units |
| Owner Occupied Housing Units | 6 | 37.5% |
| Renter-Occupied Housing Units | 10 | 62.5% |
| Total Occupied Housing Units | 16 | 100.0% |
Occupancy by Household Size in Levelock
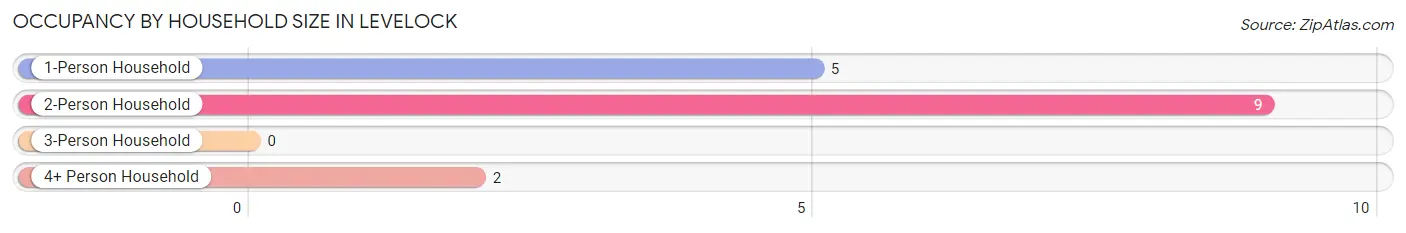
| Household Size | # Housing Units | % Housing Units |
| 1-Person Household | 5 | 31.2% |
| 2-Person Household | 9 | 56.2% |
| 3-Person Household | 0 | 0.0% |
| 4+ Person Household | 2 | 12.5% |
| Total Housing Units | 16 | 100.0% |
Occupancy by Ownership by Household Size in Levelock
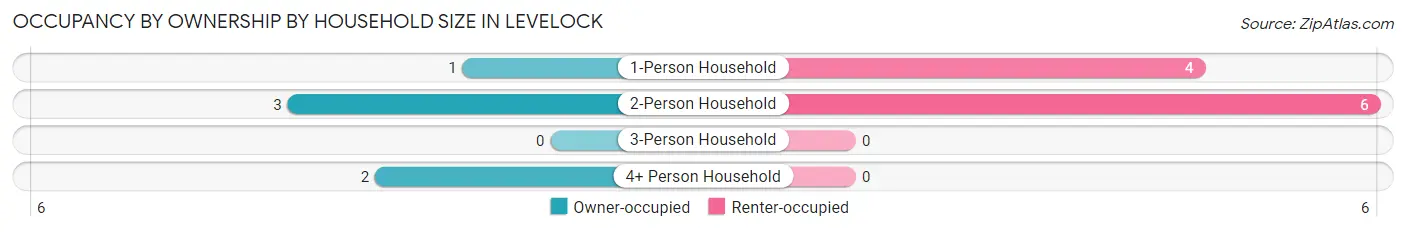
| Household Size | Owner-occupied | Renter-occupied |
| 1-Person Household | 1 (20.0%) | 4 (80.0%) |
| 2-Person Household | 3 (33.3%) | 6 (66.7%) |
| 3-Person Household | 0 (0.0%) | 0 (0.0%) |
| 4+ Person Household | 2 (100.0%) | 0 (0.0%) |
| Total Housing Units | 6 (37.5%) | 10 (62.5%) |
Occupancy by Educational Attainment in Levelock
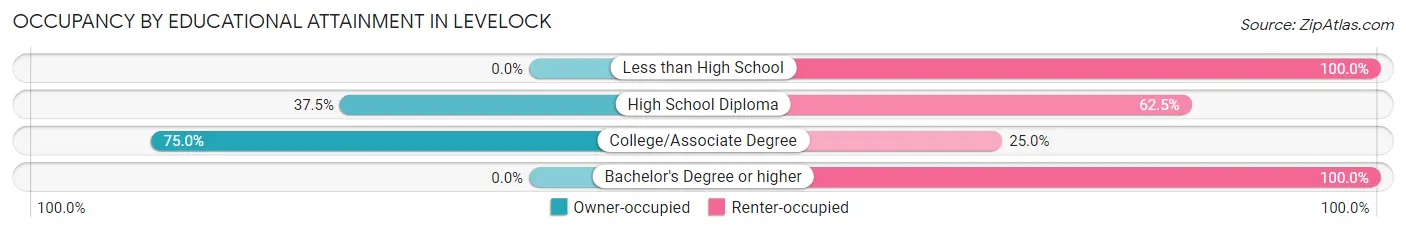
| Household Size | Owner-occupied | Renter-occupied |
| Less than High School | 0 (0.0%) | 3 (100.0%) |
| High School Diploma | 3 (37.5%) | 5 (62.5%) |
| College/Associate Degree | 3 (75.0%) | 1 (25.0%) |
| Bachelor's Degree or higher | 0 (0.0%) | 1 (100.0%) |
Occupancy by Age of Householder in Levelock
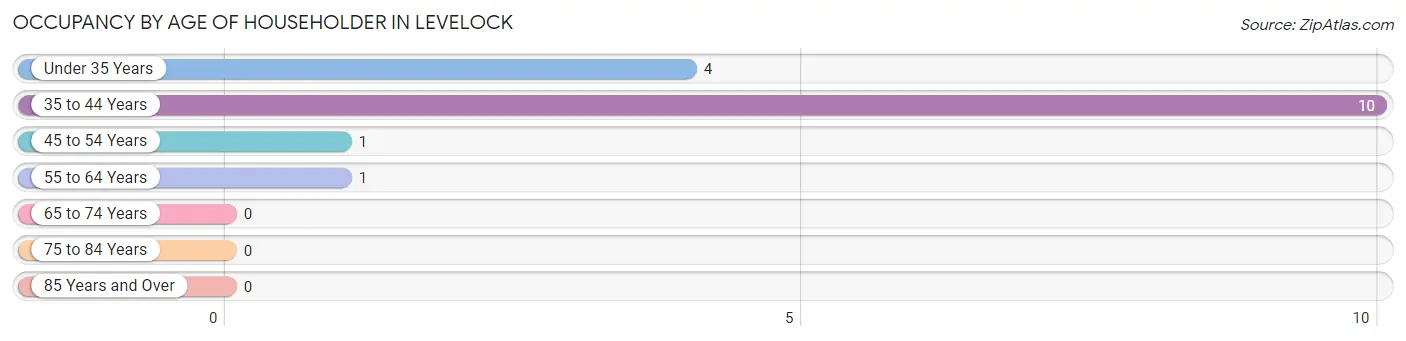
| Age Bracket | # Households | % Households |
| Under 35 Years | 4 | 25.0% |
| 35 to 44 Years | 10 | 62.5% |
| 45 to 54 Years | 1 | 6.2% |
| 55 to 64 Years | 1 | 6.2% |
| 65 to 74 Years | 0 | 0.0% |
| 75 to 84 Years | 0 | 0.0% |
| 85 Years and Over | 0 | 0.0% |
| Total | 16 | 100.0% |
Housing Finances in Levelock
Median Income by Occupancy in Levelock
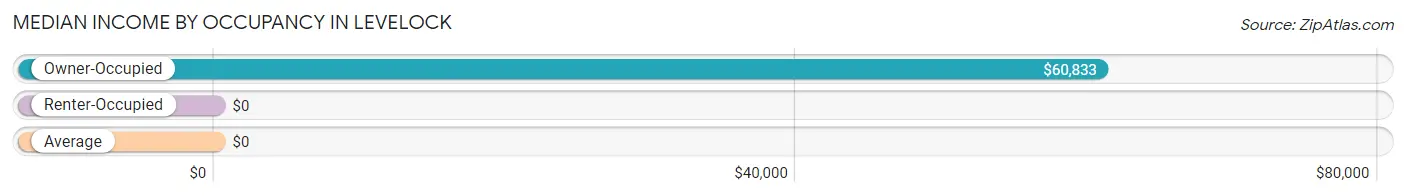
| Occupancy Type | # Households | Median Income |
| Owner-Occupied | 6 (37.5%) | $60,833 |
| Renter-Occupied | 10 (62.5%) | $0 |
| Average | 16 (100.0%) | $0 |
Occupancy by Householder Income Bracket in Levelock
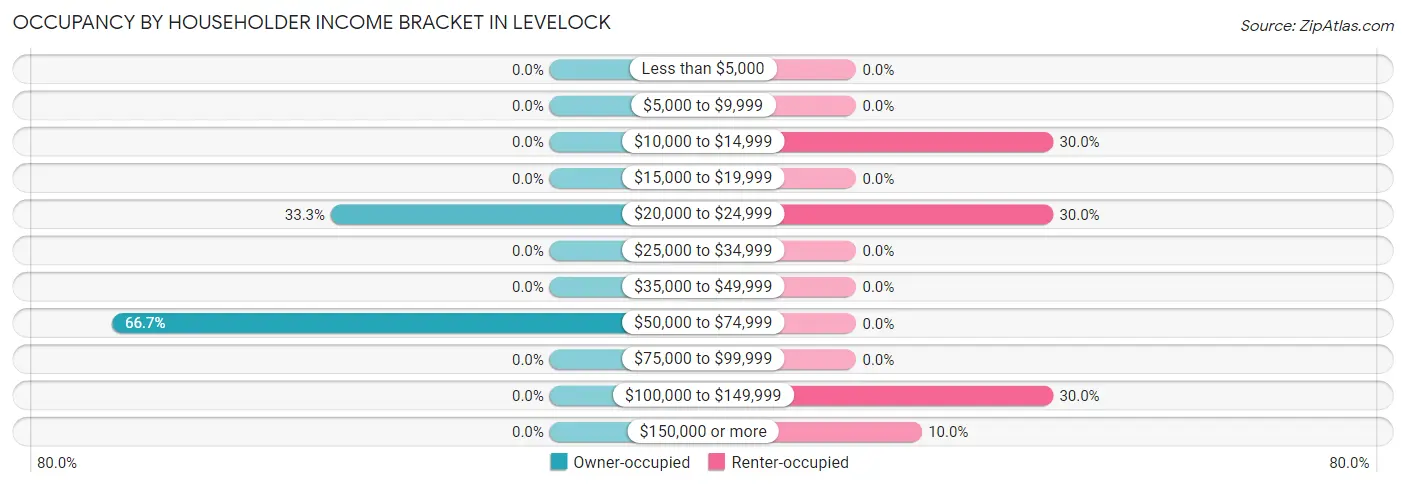
| Income Bracket | Owner-occupied | Renter-occupied |
| Less than $5,000 | 0 (0.0%) | 0 (0.0%) |
| $5,000 to $9,999 | 0 (0.0%) | 0 (0.0%) |
| $10,000 to $14,999 | 0 (0.0%) | 3 (30.0%) |
| $15,000 to $19,999 | 0 (0.0%) | 0 (0.0%) |
| $20,000 to $24,999 | 2 (33.3%) | 3 (30.0%) |
| $25,000 to $34,999 | 0 (0.0%) | 0 (0.0%) |
| $35,000 to $49,999 | 0 (0.0%) | 0 (0.0%) |
| $50,000 to $74,999 | 4 (66.7%) | 0 (0.0%) |
| $75,000 to $99,999 | 0 (0.0%) | 0 (0.0%) |
| $100,000 to $149,999 | 0 (0.0%) | 3 (30.0%) |
| $150,000 or more | 0 (0.0%) | 1 (10.0%) |
| Total | 6 (100.0%) | 10 (100.0%) |
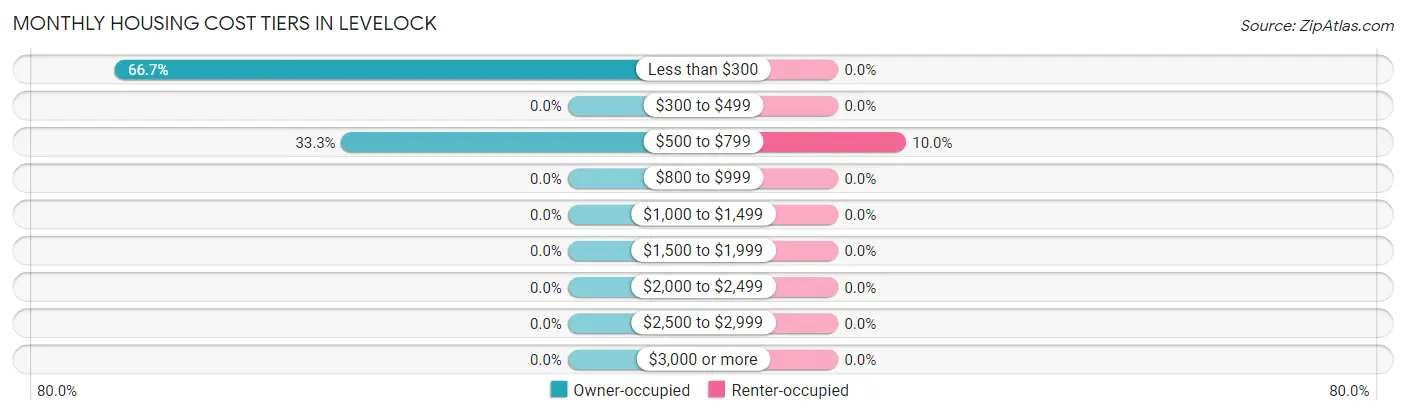
Monthly Housing Cost Tiers in Levelock
| Monthly Cost | Owner-occupied | Renter-occupied |
| Less than $300 | 4 (66.7%) | 0 (0.0%) |
| $300 to $499 | 0 (0.0%) | 0 (0.0%) |
| $500 to $799 | 2 (33.3%) | 1 (10.0%) |
| $800 to $999 | 0 (0.0%) | 0 (0.0%) |
| $1,000 to $1,499 | 0 (0.0%) | 0 (0.0%) |
| $1,500 to $1,999 | 0 (0.0%) | 0 (0.0%) |
| $2,000 to $2,499 | 0 (0.0%) | 0 (0.0%) |
| $2,500 to $2,999 | 0 (0.0%) | 0 (0.0%) |
| $3,000 or more | 0 (0.0%) | 0 (0.0%) |
| Total | 6 (100.0%) | 10 (100.0%) |
Physical Housing Characteristics in Levelock
Housing Structures in Levelock
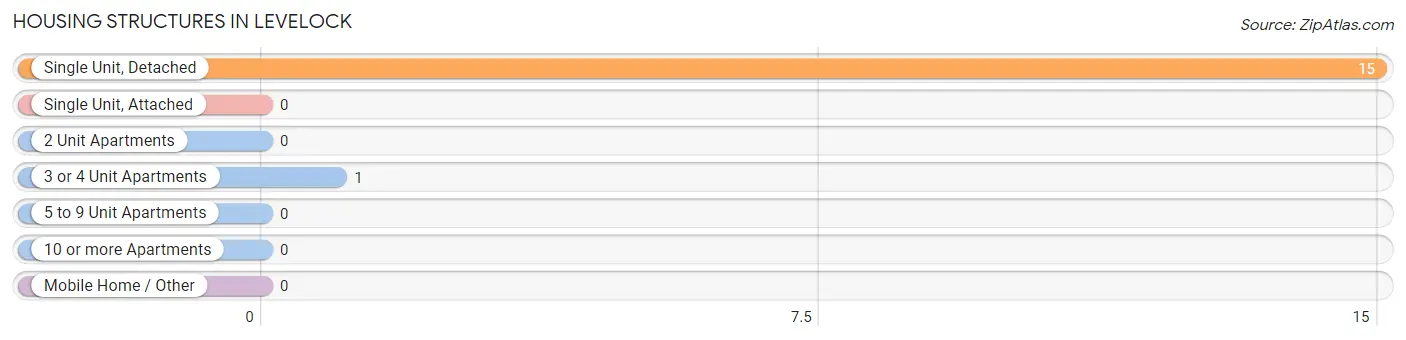
| Structure Type | # Housing Units | % Housing Units |
| Single Unit, Detached | 15 | 93.8% |
| Single Unit, Attached | 0 | 0.0% |
| 2 Unit Apartments | 0 | 0.0% |
| 3 or 4 Unit Apartments | 1 | 6.2% |
| 5 to 9 Unit Apartments | 0 | 0.0% |
| 10 or more Apartments | 0 | 0.0% |
| Mobile Home / Other | 0 | 0.0% |
| Total | 16 | 100.0% |
Housing Structures by Occupancy in Levelock
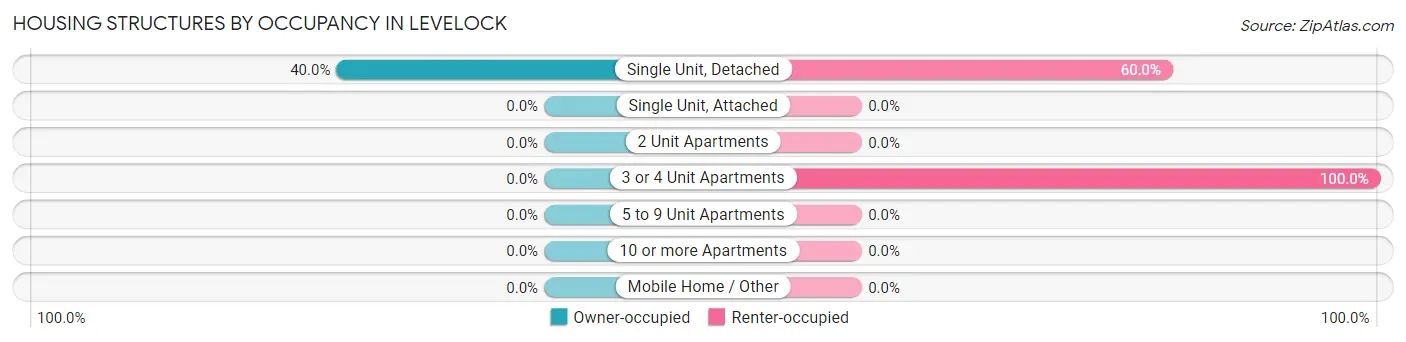
| Structure Type | Owner-occupied | Renter-occupied |
| Single Unit, Detached | 6 (40.0%) | 9 (60.0%) |
| Single Unit, Attached | 0 (0.0%) | 0 (0.0%) |
| 2 Unit Apartments | 0 (0.0%) | 0 (0.0%) |
| 3 or 4 Unit Apartments | 0 (0.0%) | 1 (100.0%) |
| 5 to 9 Unit Apartments | 0 (0.0%) | 0 (0.0%) |
| 10 or more Apartments | 0 (0.0%) | 0 (0.0%) |
| Mobile Home / Other | 0 (0.0%) | 0 (0.0%) |
| Total | 6 (37.5%) | 10 (62.5%) |
Housing Structures by Number of Rooms in Levelock
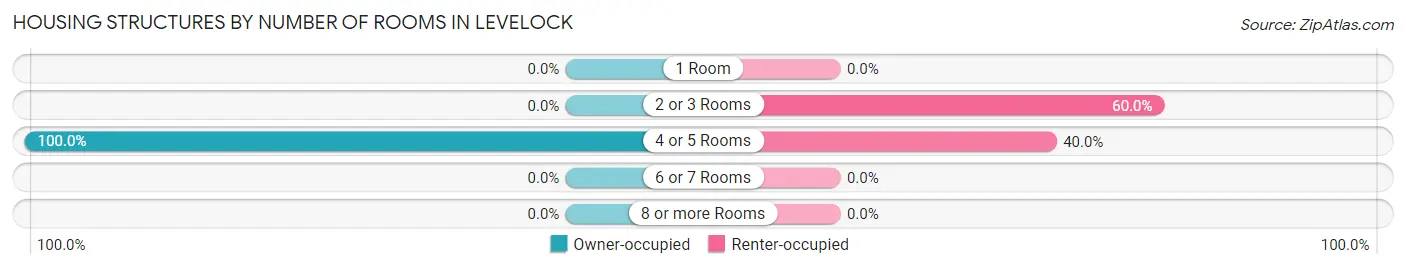
| Number of Rooms | Owner-occupied | Renter-occupied |
| 1 Room | 0 (0.0%) | 0 (0.0%) |
| 2 or 3 Rooms | 0 (0.0%) | 6 (60.0%) |
| 4 or 5 Rooms | 6 (100.0%) | 4 (40.0%) |
| 6 or 7 Rooms | 0 (0.0%) | 0 (0.0%) |
| 8 or more Rooms | 0 (0.0%) | 0 (0.0%) |
| Total | 6 (100.0%) | 10 (100.0%) |
Housing Structure by Heating Type in Levelock
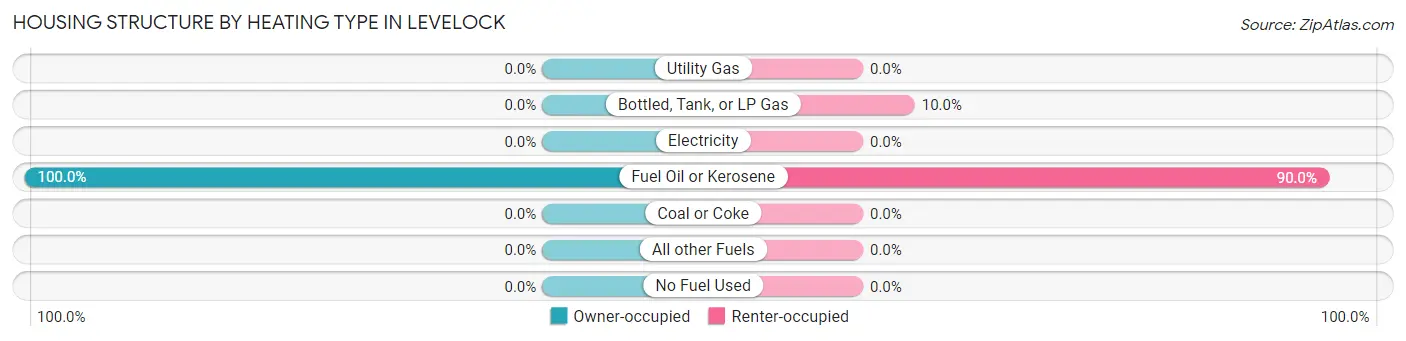
| Heating Type | Owner-occupied | Renter-occupied |
| Utility Gas | 0 (0.0%) | 0 (0.0%) |
| Bottled, Tank, or LP Gas | 0 (0.0%) | 1 (10.0%) |
| Electricity | 0 (0.0%) | 0 (0.0%) |
| Fuel Oil or Kerosene | 6 (100.0%) | 9 (90.0%) |
| Coal or Coke | 0 (0.0%) | 0 (0.0%) |
| All other Fuels | 0 (0.0%) | 0 (0.0%) |
| No Fuel Used | 0 (0.0%) | 0 (0.0%) |
| Total | 6 (100.0%) | 10 (100.0%) |
Household Vehicle Usage in Levelock
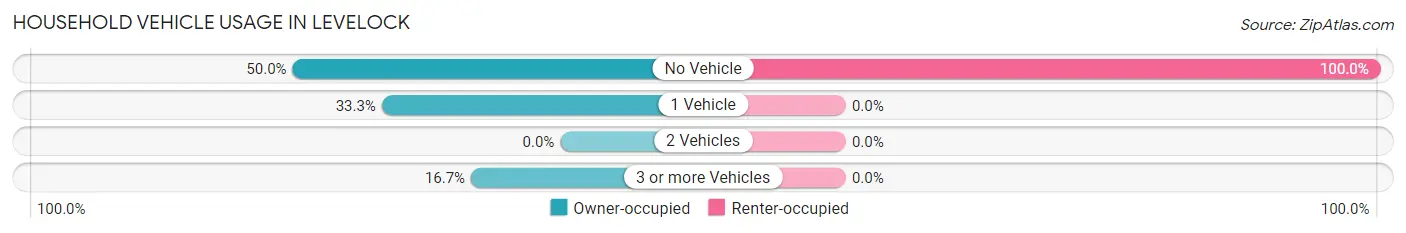
| Vehicles per Household | Owner-occupied | Renter-occupied |
| No Vehicle | 3 (50.0%) | 10 (100.0%) |
| 1 Vehicle | 2 (33.3%) | 0 (0.0%) |
| 2 Vehicles | 0 (0.0%) | 0 (0.0%) |
| 3 or more Vehicles | 1 (16.7%) | 0 (0.0%) |
| Total | 6 (100.0%) | 10 (100.0%) |
Real Estate & Mortgages in Levelock
Real Estate and Mortgage Overview in Levelock
| Characteristic | Without Mortgage | With Mortgage |
| Housing Units | 4 | 2 |
| Median Property Value | - | - |
| Median Household Income | - | - |
| Monthly Housing Costs | - | - |
| Real Estate Taxes | - | - |
Property Value by Mortgage Status in Levelock
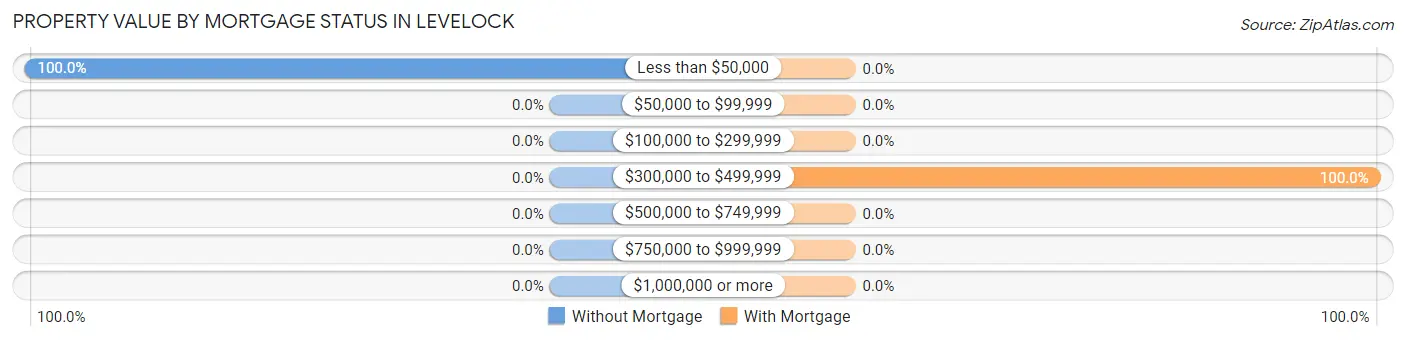
| Property Value | Without Mortgage | With Mortgage |
| Less than $50,000 | 4 (100.0%) | 0 (0.0%) |
| $50,000 to $99,999 | 0 (0.0%) | 0 (0.0%) |
| $100,000 to $299,999 | 0 (0.0%) | 0 (0.0%) |
| $300,000 to $499,999 | 0 (0.0%) | 2 (100.0%) |
| $500,000 to $749,999 | 0 (0.0%) | 0 (0.0%) |
| $750,000 to $999,999 | 0 (0.0%) | 0 (0.0%) |
| $1,000,000 or more | 0 (0.0%) | 0 (0.0%) |
| Total | 4 (100.0%) | 2 (100.0%) |
Household Income by Mortgage Status in Levelock
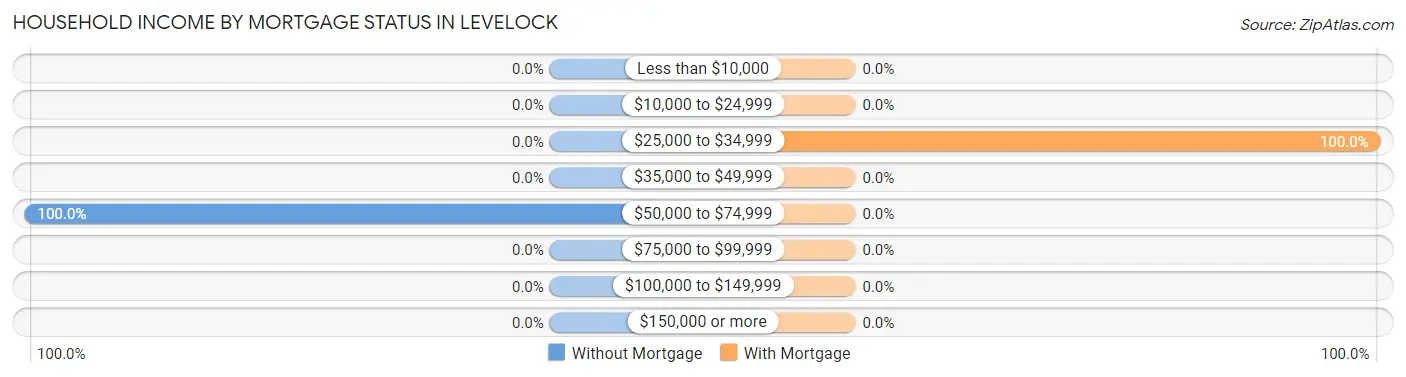
| Household Income | Without Mortgage | With Mortgage |
| Less than $10,000 | 0 (0.0%) | 0 (0.0%) |
| $10,000 to $24,999 | 0 (0.0%) | 0 (0.0%) |
| $25,000 to $34,999 | 0 (0.0%) | 2 (100.0%) |
| $35,000 to $49,999 | 0 (0.0%) | 0 (0.0%) |
| $50,000 to $74,999 | 4 (100.0%) | 0 (0.0%) |
| $75,000 to $99,999 | 0 (0.0%) | 0 (0.0%) |
| $100,000 to $149,999 | 0 (0.0%) | 0 (0.0%) |
| $150,000 or more | 0 (0.0%) | 0 (0.0%) |
| Total | 4 (100.0%) | 2 (100.0%) |
Property Value to Household Income Ratio in Levelock
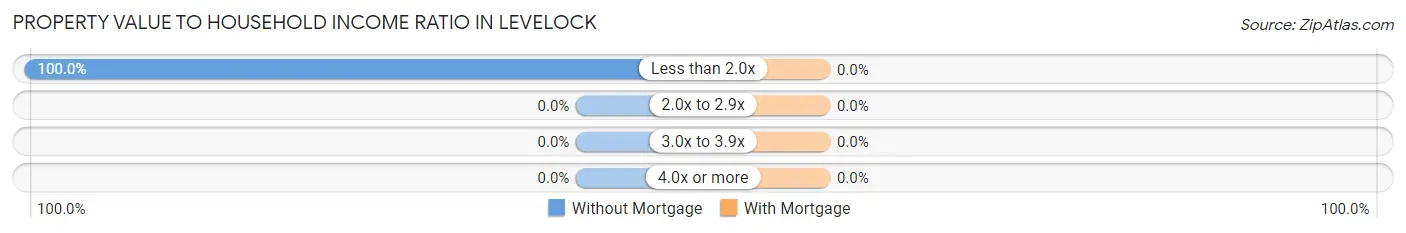
| Value-to-Income Ratio | Without Mortgage | With Mortgage |
| Less than 2.0x | 4 (100.0%) | 0 (0.0%) |
| 2.0x to 2.9x | 0 (0.0%) | 0 (0.0%) |
| 3.0x to 3.9x | 0 (0.0%) | 0 (0.0%) |
| 4.0x or more | 0 (0.0%) | 0 (0.0%) |
| Total | 4 (100.0%) | 2 (100.0%) |
Real Estate Taxes by Mortgage Status in Levelock
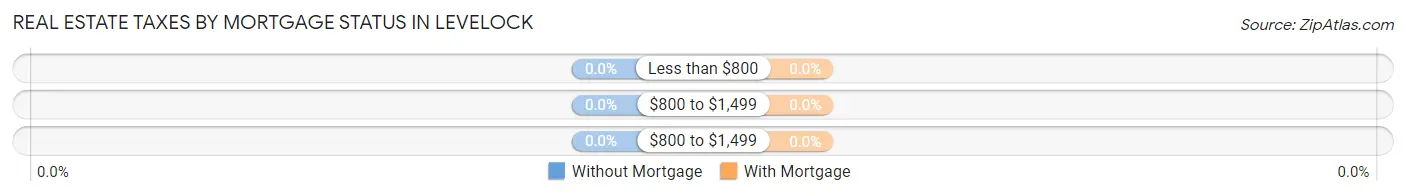
| Property Taxes | Without Mortgage | With Mortgage |
| Less than $800 | 0 (0.0%) | 0 (0.0%) |
| $800 to $1,499 | 0 (0.0%) | 0 (0.0%) |
| $800 to $1,499 | 0 (0.0%) | 0 (0.0%) |
| Total | 4 (100.0%) | 2 (100.0%) |
Health & Disability in Levelock
Health Insurance Coverage by Age in Levelock
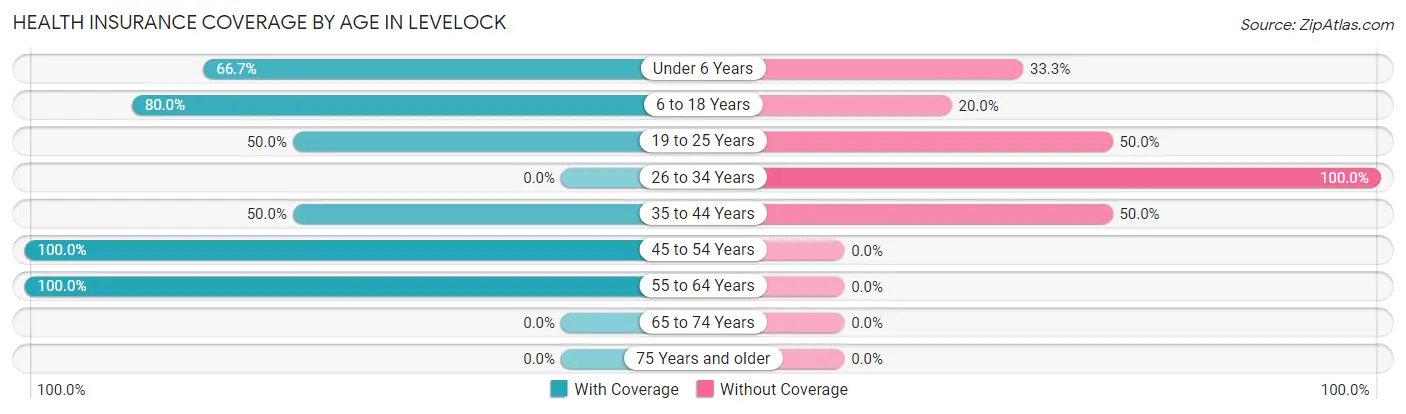
| Age Bracket | With Coverage | Without Coverage |
| Under 6 Years | 2 (66.7%) | 1 (33.3%) |
| 6 to 18 Years | 4 (80.0%) | 1 (20.0%) |
| 19 to 25 Years | 3 (50.0%) | 3 (50.0%) |
| 26 to 34 Years | 0 (0.0%) | 1 (100.0%) |
| 35 to 44 Years | 5 (50.0%) | 5 (50.0%) |
| 45 to 54 Years | 1 (100.0%) | 0 (0.0%) |
| 55 to 64 Years | 2 (100.0%) | 0 (0.0%) |
| 65 to 74 Years | 0 (0.0%) | 0 (0.0%) |
| 75 Years and older | 0 (0.0%) | 0 (0.0%) |
| Total | 17 (60.7%) | 11 (39.3%) |
Health Insurance Coverage by Citizenship Status in Levelock
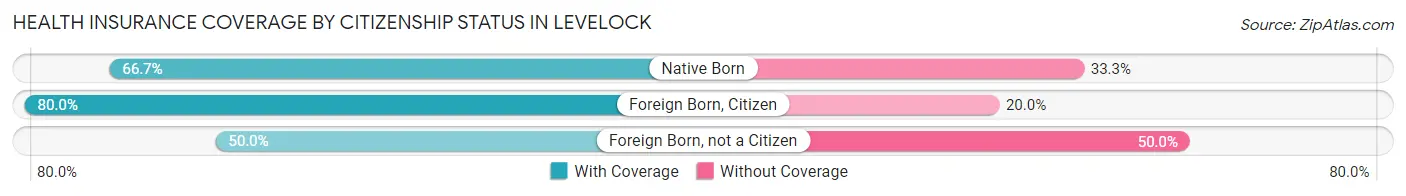
| Citizenship Status | With Coverage | Without Coverage |
| Native Born | 2 (66.7%) | 1 (33.3%) |
| Foreign Born, Citizen | 4 (80.0%) | 1 (20.0%) |
| Foreign Born, not a Citizen | 3 (50.0%) | 3 (50.0%) |
Health Insurance Coverage by Household Income in Levelock
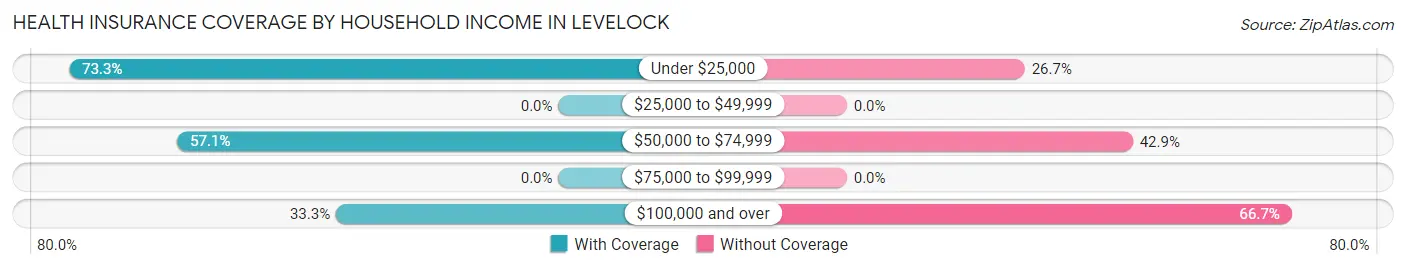
| Household Income | With Coverage | Without Coverage |
| Under $25,000 | 11 (73.3%) | 4 (26.7%) |
| $25,000 to $49,999 | 0 (0.0%) | 0 (0.0%) |
| $50,000 to $74,999 | 4 (57.1%) | 3 (42.9%) |
| $75,000 to $99,999 | 0 (0.0%) | 0 (0.0%) |
| $100,000 and over | 2 (33.3%) | 4 (66.7%) |
Public vs Private Health Insurance Coverage by Age in Levelock
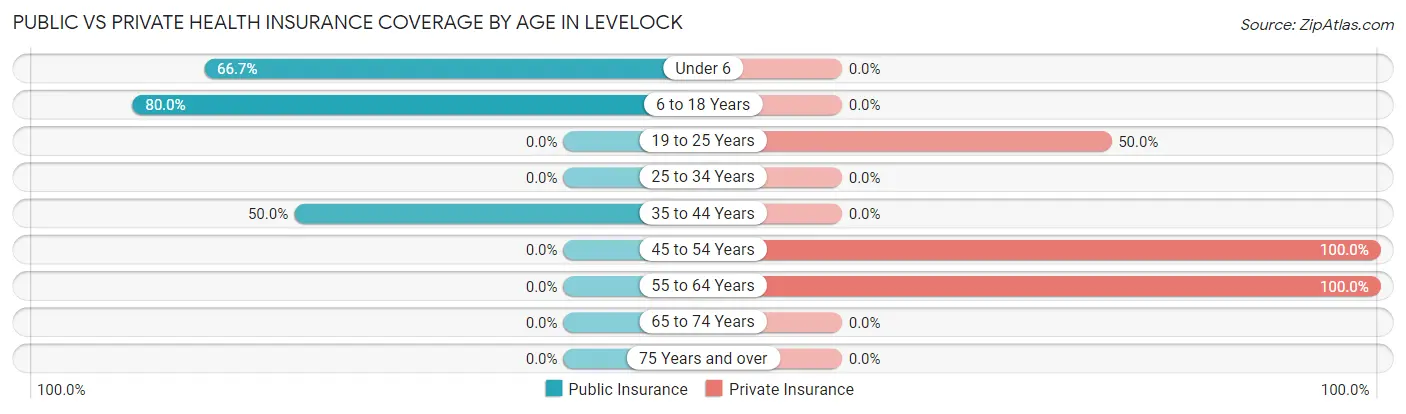
| Age Bracket | Public Insurance | Private Insurance |
| Under 6 | 2 (66.7%) | 0 (0.0%) |
| 6 to 18 Years | 4 (80.0%) | 0 (0.0%) |
| 19 to 25 Years | 0 (0.0%) | 3 (50.0%) |
| 25 to 34 Years | 0 (0.0%) | 0 (0.0%) |
| 35 to 44 Years | 5 (50.0%) | 0 (0.0%) |
| 45 to 54 Years | 0 (0.0%) | 1 (100.0%) |
| 55 to 64 Years | 0 (0.0%) | 2 (100.0%) |
| 65 to 74 Years | 0 (0.0%) | 0 (0.0%) |
| 75 Years and over | 0 (0.0%) | 0 (0.0%) |
| Total | 11 (39.3%) | 6 (21.4%) |
Disability Status by Sex by Age in Levelock
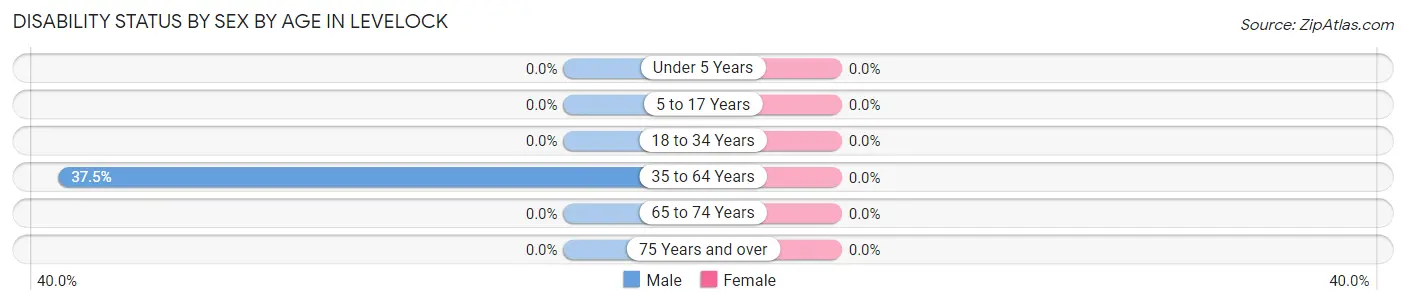
| Age Bracket | Male | Female |
| Under 5 Years | 0 (0.0%) | 0 (0.0%) |
| 5 to 17 Years | 0 (0.0%) | 0 (0.0%) |
| 18 to 34 Years | 0 (0.0%) | 0 (0.0%) |
| 35 to 64 Years | 3 (37.5%) | 0 (0.0%) |
| 65 to 74 Years | 0 (0.0%) | 0 (0.0%) |
| 75 Years and over | 0 (0.0%) | 0 (0.0%) |
Disability Class by Sex by Age in Levelock
Disability Class: Hearing Difficulty
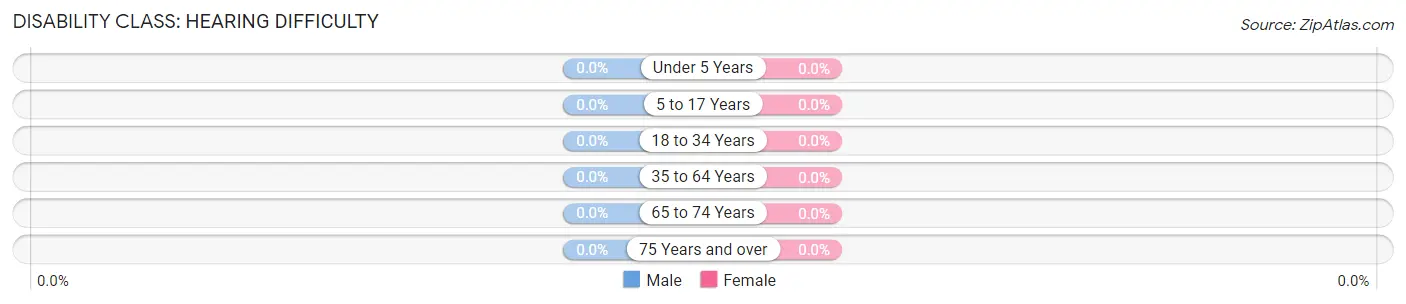
| Age Bracket | Male | Female |
| Under 5 Years | 0 (0.0%) | 0 (0.0%) |
| 5 to 17 Years | 0 (0.0%) | 0 (0.0%) |
| 18 to 34 Years | 0 (0.0%) | 0 (0.0%) |
| 35 to 64 Years | 0 (0.0%) | 0 (0.0%) |
| 65 to 74 Years | 0 (0.0%) | 0 (0.0%) |
| 75 Years and over | 0 (0.0%) | 0 (0.0%) |
Disability Class: Vision Difficulty
| Age Bracket | Male | Female |
| Under 5 Years | 0 (0.0%) | 0 (0.0%) |
| 5 to 17 Years | 0 (0.0%) | 0 (0.0%) |
| 18 to 34 Years | 0 (0.0%) | 0 (0.0%) |
| 35 to 64 Years | 0 (0.0%) | 0 (0.0%) |
| 65 to 74 Years | 0 (0.0%) | 0 (0.0%) |
| 75 Years and over | 0 (0.0%) | 0 (0.0%) |
Disability Class: Cognitive Difficulty
| Age Bracket | Male | Female |
| 5 to 17 Years | 0 (0.0%) | 0 (0.0%) |
| 18 to 34 Years | 0 (0.0%) | 0 (0.0%) |
| 35 to 64 Years | 0 (0.0%) | 0 (0.0%) |
| 65 to 74 Years | 0 (0.0%) | 0 (0.0%) |
| 75 Years and over | 0 (0.0%) | 0 (0.0%) |
Disability Class: Ambulatory Difficulty
| Age Bracket | Male | Female |
| 5 to 17 Years | 0 (0.0%) | 0 (0.0%) |
| 18 to 34 Years | 0 (0.0%) | 0 (0.0%) |
| 35 to 64 Years | 3 (37.5%) | 0 (0.0%) |
| 65 to 74 Years | 0 (0.0%) | 0 (0.0%) |
| 75 Years and over | 0 (0.0%) | 0 (0.0%) |
Disability Class: Self-Care Difficulty
| Age Bracket | Male | Female |
| 5 to 17 Years | 0 (0.0%) | 0 (0.0%) |
| 18 to 34 Years | 0 (0.0%) | 0 (0.0%) |
| 35 to 64 Years | 0 (0.0%) | 0 (0.0%) |
| 65 to 74 Years | 0 (0.0%) | 0 (0.0%) |
| 75 Years and over | 0 (0.0%) | 0 (0.0%) |
Technology Access in Levelock
Computing Device Access in Levelock
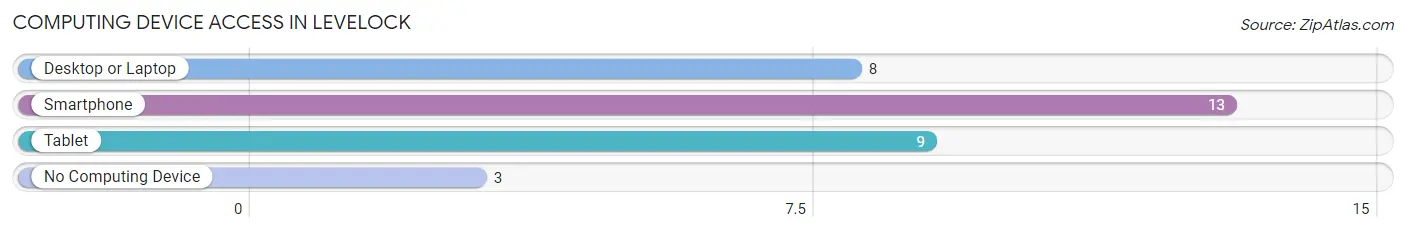
| Device Type | # Households | % Households |
| Desktop or Laptop | 8 | 50.0% |
| Smartphone | 13 | 81.2% |
| Tablet | 9 | 56.2% |
| No Computing Device | 3 | 18.8% |
| Total | 16 | 100.0% |
Internet Access in Levelock
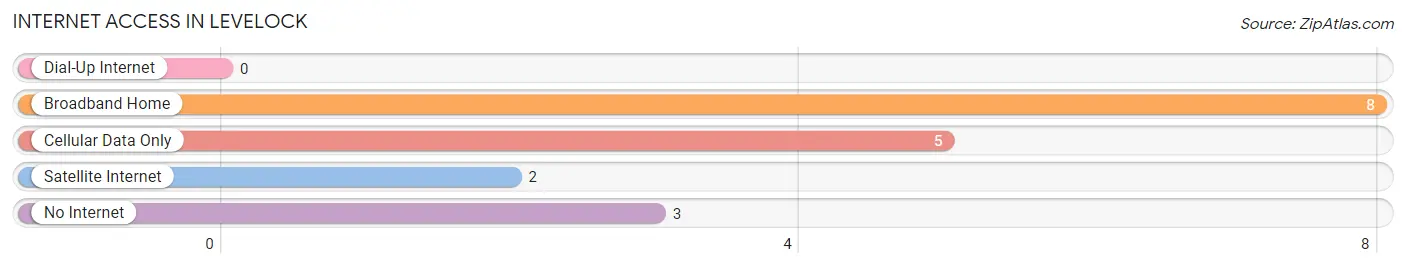
| Internet Type | # Households | % Households |
| Dial-Up Internet | 0 | 0.0% |
| Broadband Home | 8 | 50.0% |
| Cellular Data Only | 5 | 31.2% |
| Satellite Internet | 2 | 12.5% |
| No Internet | 3 | 18.8% |
| Total | 16 | 100.0% |
Levelock Summary
Levelock is a small unincorporated community located in the Lake and Peninsula Borough of Alaska. It is situated on the south bank of the Kvichak River, approximately 40 miles east of Dillingham. The population of Levelock was estimated to be around 100 people in 2000.
History
Levelock has a long history of human habitation. The area was first inhabited by the Yup'ik people, who have lived in the region for thousands of years. The Yup'ik people were semi-nomadic, living off the land and relying on the resources of the Kvichak River and its tributaries.
The first non-native settlers arrived in Levelock in the late 1800s. These settlers were primarily fishermen and trappers, who were drawn to the area by the abundance of fish and fur-bearing animals. The first post office in Levelock was established in 1902.
Geography
Levelock is located in the Lake and Peninsula Borough of Alaska. It is situated on the south bank of the Kvichak River, approximately 40 miles east of Dillingham. The area is characterized by rolling hills, wetlands, and boreal forests. The climate is subarctic, with cold winters and mild summers.
Economy
The economy of Levelock is largely based on fishing and subsistence activities. Commercial fishing is the primary source of income for many residents, with salmon, halibut, and cod being the most commonly caught species. Subsistence activities, such as hunting and gathering, are also important sources of food and income for many residents.
The local economy is also supported by tourism. The area is popular with sport fishermen, hunters, and wildlife watchers. There are several lodges and cabins in the area that cater to visitors.
Demographics
The population of Levelock was estimated to be around 100 people in 2000. The majority of the population is Native American, primarily Yup'ik. The median age of the population is 33. The median household income is $25,000.
Conclusion
Levelock is a small unincorporated community located in the Lake and Peninsula Borough of Alaska. It has a long history of human habitation, with the first non-native settlers arriving in the late 1800s. The economy of Levelock is largely based on fishing and subsistence activities, with commercial fishing being the primary source of income for many residents. The population of Levelock was estimated to be around 100 people in 2000, with the majority of the population being Native American.
Common Questions
What is Per Capita Income in Levelock?
Per Capita income in Levelock is $33,282.
What is Inequality or Gini Index in Levelock?
Inequality or Gini Index in Levelock is 0.43.
What is the Total Population of Levelock?
Total Population of Levelock is 28.
What is the Total Male Population of Levelock?
Total Male Population of Levelock is 16.
What is the Total Female Population of Levelock?
Total Female Population of Levelock is 12.
What is the Ratio of Males per 100 Females in Levelock?
There are 133.33 Males per 100 Females in Levelock.
What is the Ratio of Females per 100 Males in Levelock?
There are 75.00 Females per 100 Males in Levelock.
What is the Median Population Age in Levelock?
Median Population Age in Levelock is 27.0 Years.
What is the Average Family Size in Levelock
Average Family Size in Levelock is 2.1 People.
What is the Average Household Size in Levelock
Average Household Size in Levelock is 1.8 People.
How Large is the Labor Force in Levelock?
There are 17 People in the Labor Forcein in Levelock.
What is the Percentage of People in the Labor Force in Levelock?
85.0% of People are in the Labor Force in Levelock.
What is the Unemployment Rate in Levelock?
Unemployment Rate in Levelock is 29.4%.