Chignik Lake, AK Map & Demographics
Chignik Lake Map
Chignik Lake Overview
$18,603
PER CAPITA INCOME
$68,125
AVG FAMILY INCOME
$53,750
AVG HOUSEHOLD INCOME
83.0%
WAGE / INCOME GAP [ % ]
17.0¢/ $1
WAGE / INCOME GAP [ $ ]
0.22
INEQUALITY / GINI INDEX
30
TOTAL POPULATION
17
MALE POPULATION
13
FEMALE POPULATION
130.77
MALES / 100 FEMALES
76.47
FEMALES / 100 MALES
35.3
MEDIAN AGE
3.1
AVG FAMILY SIZE
2.7
AVG HOUSEHOLD SIZE
10
LABOR FORCE [ PEOPLE ]
47.6%
PERCENT IN LABOR FORCE
Chignik Lake Zip Codes
Chignik Lake Area Codes
Income in Chignik Lake
Income Overview in Chignik Lake
Per Capita Income in Chignik Lake is $18,603, while median incomes of families and households are $68,125 and $53,750 respectively.
| Characteristic | Number | Measure |
| Per Capita Income | 30 | $18,603 |
| Median Family Income | 9 | $68,125 |
| Mean Family Income | 9 | $58,967 |
| Median Household Income | 11 | $53,750 |
| Mean Household Income | 11 | $52,318 |
| Income Deficit | 9 | $0 |
| Wage / Income Gap (%) | 30 | 82.95% |
| Wage / Income Gap ($) | 30 | 17.05¢ per $1 |
| Gini / Inequality Index | 30 | 0.22 |
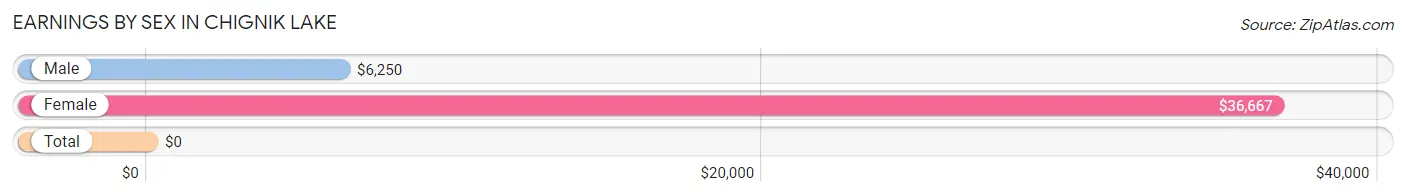
Earnings by Sex in Chignik Lake
| Sex | Number | Average Earnings |
| Male | 10 (62.5%) | $6,250 |
| Female | 6 (37.5%) | $36,667 |
| Total | 16 (100.0%) | $0 |
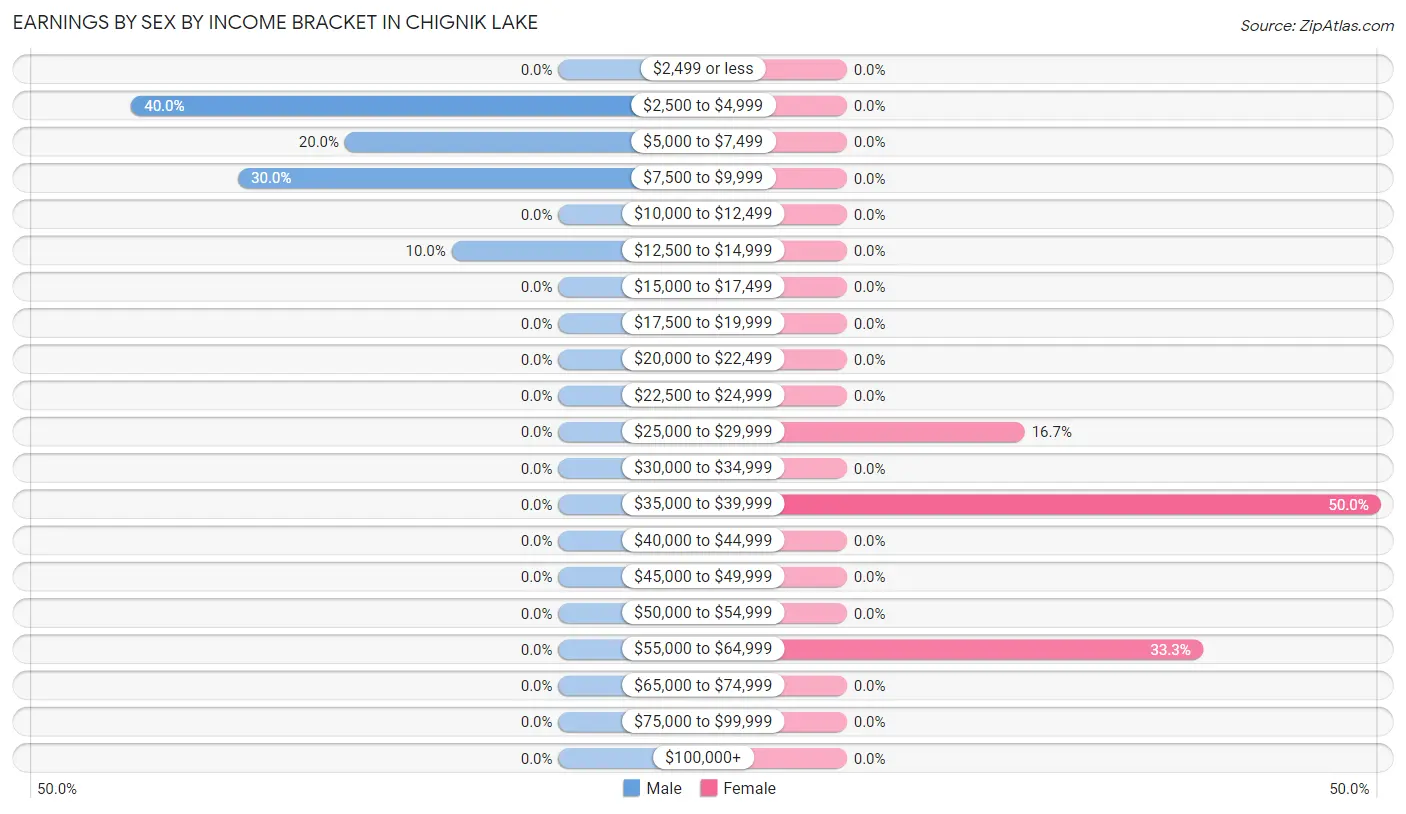
Earnings by Sex by Income Bracket in Chignik Lake
The most common earnings brackets in Chignik Lake are $2,500 to $4,999 for men (4 | 40.0%) and $35,000 to $39,999 for women (3 | 50.0%).
| Income | Male | Female |
| $2,499 or less | 0 (0.0%) | 0 (0.0%) |
| $2,500 to $4,999 | 4 (40.0%) | 0 (0.0%) |
| $5,000 to $7,499 | 2 (20.0%) | 0 (0.0%) |
| $7,500 to $9,999 | 3 (30.0%) | 0 (0.0%) |
| $10,000 to $12,499 | 0 (0.0%) | 0 (0.0%) |
| $12,500 to $14,999 | 1 (10.0%) | 0 (0.0%) |
| $15,000 to $17,499 | 0 (0.0%) | 0 (0.0%) |
| $17,500 to $19,999 | 0 (0.0%) | 0 (0.0%) |
| $20,000 to $22,499 | 0 (0.0%) | 0 (0.0%) |
| $22,500 to $24,999 | 0 (0.0%) | 0 (0.0%) |
| $25,000 to $29,999 | 0 (0.0%) | 1 (16.7%) |
| $30,000 to $34,999 | 0 (0.0%) | 0 (0.0%) |
| $35,000 to $39,999 | 0 (0.0%) | 3 (50.0%) |
| $40,000 to $44,999 | 0 (0.0%) | 0 (0.0%) |
| $45,000 to $49,999 | 0 (0.0%) | 0 (0.0%) |
| $50,000 to $54,999 | 0 (0.0%) | 0 (0.0%) |
| $55,000 to $64,999 | 0 (0.0%) | 2 (33.3%) |
| $65,000 to $74,999 | 0 (0.0%) | 0 (0.0%) |
| $75,000 to $99,999 | 0 (0.0%) | 0 (0.0%) |
| $100,000+ | 0 (0.0%) | 0 (0.0%) |
| Total | 10 (100.0%) | 6 (100.0%) |
Earnings by Sex by Educational Attainment in Chignik Lake
| Educational Attainment | Male Income | Female Income |
| Less than High School | - | - |
| High School Diploma | - | - |
| College or Associate's Degree | - | - |
| Bachelor's Degree | - | - |
| Graduate Degree | - | - |
| Total | $8,750 | $36,667 |
Family Income in Chignik Lake
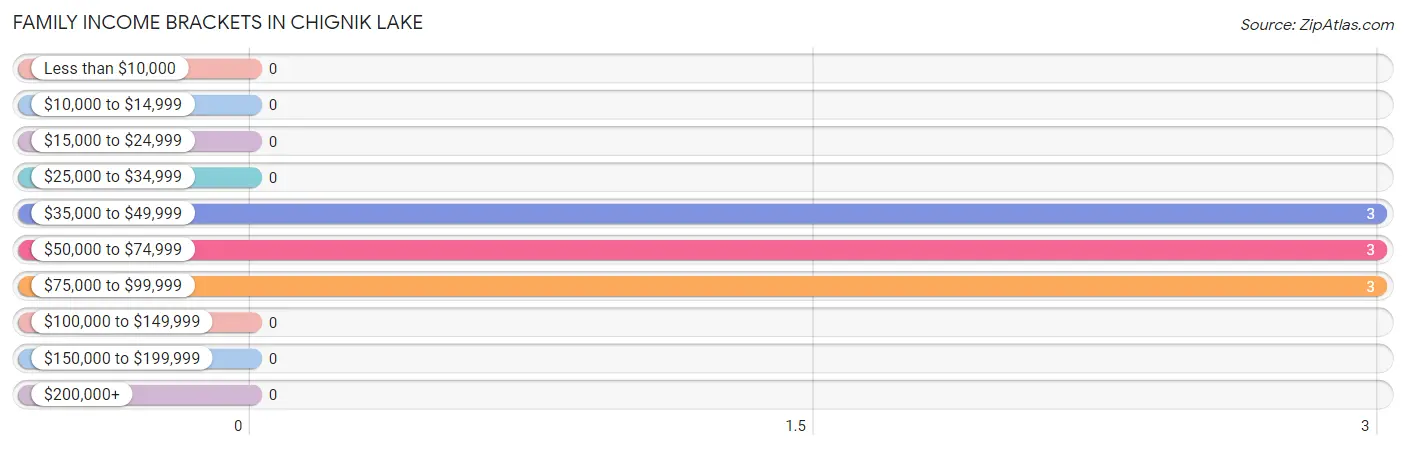
Family Income Brackets in Chignik Lake
According to the Chignik Lake family income data, there are 3 families falling into the $35,000 to $49,999 income range, which is the most common income bracket and makes up 33.3% of all families.
| Income Bracket | # Families | % Families |
| Less than $10,000 | 0 | 0.0% |
| $10,000 to $14,999 | 0 | 0.0% |
| $15,000 to $24,999 | 0 | 0.0% |
| $25,000 to $34,999 | 0 | 0.0% |
| $35,000 to $49,999 | 3 | 33.3% |
| $50,000 to $74,999 | 3 | 33.3% |
| $75,000 to $99,999 | 3 | 33.3% |
| $100,000 to $149,999 | 0 | 0.0% |
| $150,000 to $199,999 | 0 | 0.0% |
| $200,000+ | 0 | 0.0% |
Family Income by Famaliy Size in Chignik Lake
| Income Bracket | # Families | Median Income |
| 2-Person Families | 5 (55.6%) | $0 |
| 3-Person Families | 0 (0.0%) | $0 |
| 4-Person Families | 0 (0.0%) | $0 |
| 5-Person Families | 0 (0.0%) | $0 |
| 6-Person Families | 1 (11.1%) | $0 |
| 7+ Person Families | 3 (33.3%) | $0 |
| Total | 9 (100.0%) | $68,125 |
Family Income by Number of Earners in Chignik Lake
| Number of Earners | # Families | Median Income |
| No Earners | 0 (0.0%) | $0 |
| 1 Earner | 5 (55.6%) | $0 |
| 2 Earners | 0 (0.0%) | $0 |
| 3+ Earners | 4 (44.4%) | $0 |
| Total | 9 (100.0%) | $68,125 |
Household Income in Chignik Lake
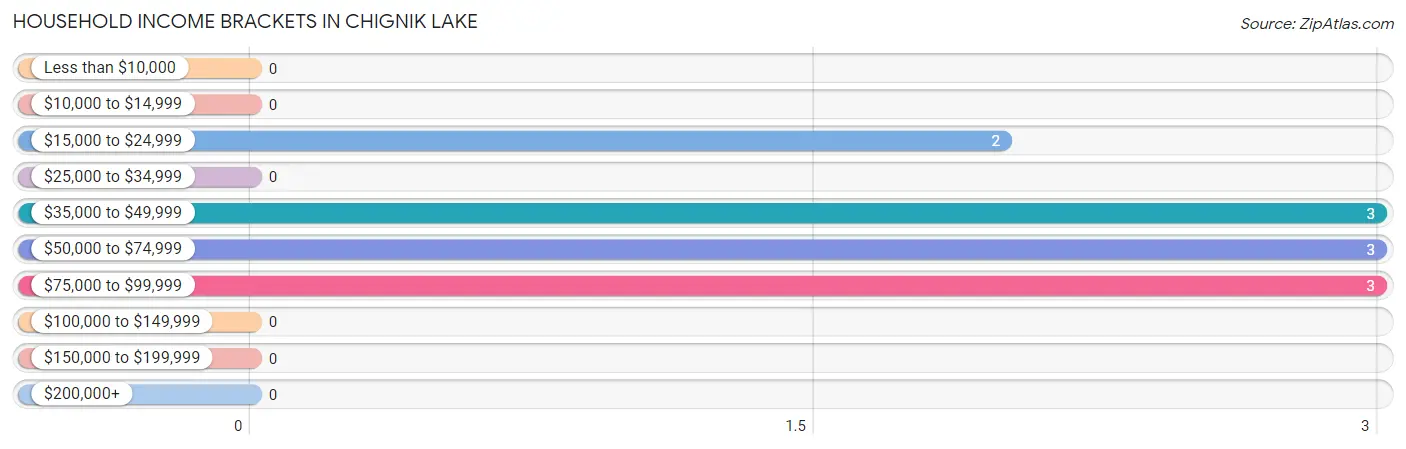
Household Income Brackets in Chignik Lake
With 3 households falling in the category, the $35,000 to $49,999 income range is the most frequent in Chignik Lake, accounting for 27.3% of all households.
| Income Bracket | # Households | % Households |
| Less than $10,000 | 0 | 0.0% |
| $10,000 to $14,999 | 0 | 0.0% |
| $15,000 to $24,999 | 2 | 18.2% |
| $25,000 to $34,999 | 0 | 0.0% |
| $35,000 to $49,999 | 3 | 27.3% |
| $50,000 to $74,999 | 3 | 27.3% |
| $75,000 to $99,999 | 3 | 27.3% |
| $100,000 to $149,999 | 0 | 0.0% |
| $150,000 to $199,999 | 0 | 0.0% |
| $200,000+ | 0 | 0.0% |
Household Income by Householder Age in Chignik Lake
| Income Bracket | # Households | Median Income |
| 15 to 24 Years | 0 (0.0%) | $0 |
| 25 to 44 Years | 4 (36.4%) | $0 |
| 45 to 64 Years | 4 (36.4%) | $0 |
| 65+ Years | 3 (27.3%) | $0 |
| Total | 11 (100.0%) | $53,750 |
Poverty in Chignik Lake
Income Below Poverty by Sex and Age in Chignik Lake
| Age Bracket | Male | Female |
| Under 5 Years | 0 (0.0%) | 0 (0.0%) |
| 5 Years | 0 (0.0%) | 0 (0.0%) |
| 6 to 11 Years | 0 (0.0%) | 0 (0.0%) |
| 12 to 14 Years | 0 (0.0%) | 0 (0.0%) |
| 15 Years | 0 (0.0%) | 0 (0.0%) |
| 16 and 17 Years | 0 (0.0%) | 0 (0.0%) |
| 18 to 24 Years | 0 (0.0%) | 0 (0.0%) |
| 25 to 34 Years | 0 (0.0%) | 0 (0.0%) |
| 35 to 44 Years | 0 (0.0%) | 0 (0.0%) |
| 45 to 54 Years | 0 (0.0%) | 0 (0.0%) |
| 55 to 64 Years | 0 (0.0%) | 0 (0.0%) |
| 65 to 74 Years | 0 (0.0%) | 0 (0.0%) |
| 75 Years and over | 0 (0.0%) | 0 (0.0%) |
| Total | 0 (0.0%) | 0 (0.0%) |
Income Above Poverty by Sex and Age in Chignik Lake
According to the poverty statistics in Chignik Lake, males aged under 5 years and females aged under 5 years are the age groups that are most secure financially, with 100.0% of males and 100.0% of females in these age groups living above the poverty line.
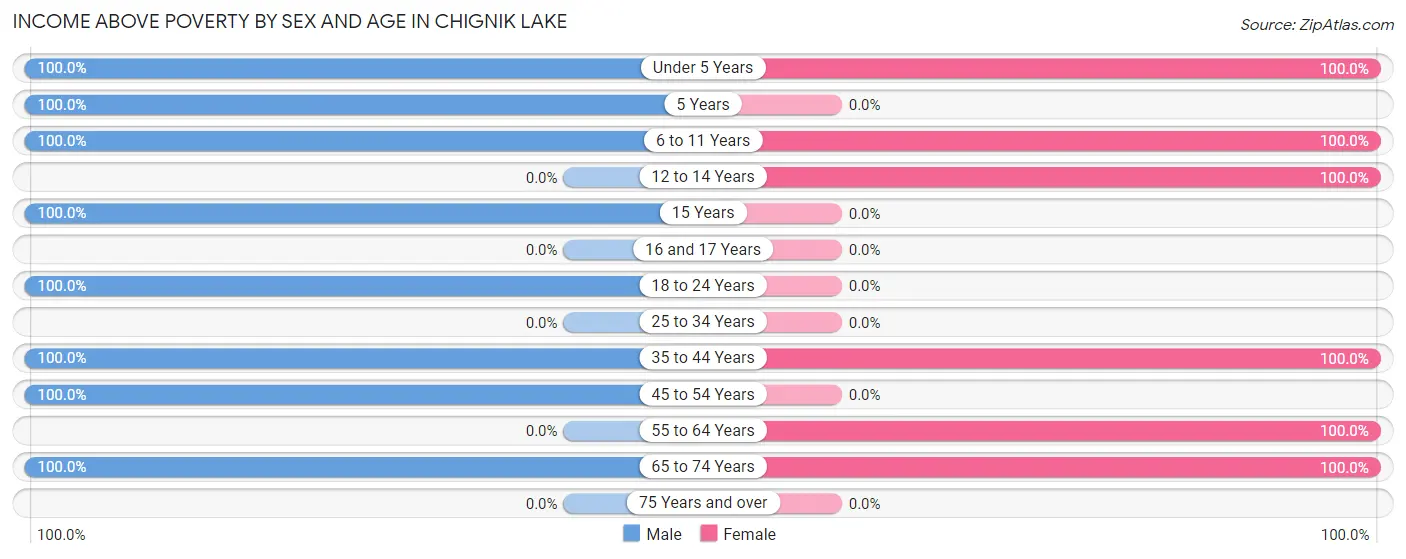
| Age Bracket | Male | Female |
| Under 5 Years | 2 (100.0%) | 2 (100.0%) |
| 5 Years | 1 (100.0%) | 0 (0.0%) |
| 6 to 11 Years | 1 (100.0%) | 1 (100.0%) |
| 12 to 14 Years | 0 (0.0%) | 1 (100.0%) |
| 15 Years | 1 (100.0%) | 0 (0.0%) |
| 16 and 17 Years | 0 (0.0%) | 0 (0.0%) |
| 18 to 24 Years | 5 (100.0%) | 0 (0.0%) |
| 25 to 34 Years | 0 (0.0%) | 0 (0.0%) |
| 35 to 44 Years | 2 (100.0%) | 4 (100.0%) |
| 45 to 54 Years | 2 (100.0%) | 0 (0.0%) |
| 55 to 64 Years | 0 (0.0%) | 4 (100.0%) |
| 65 to 74 Years | 3 (100.0%) | 1 (100.0%) |
| 75 Years and over | 0 (0.0%) | 0 (0.0%) |
| Total | 17 (100.0%) | 13 (100.0%) |
Income Below Poverty Among Married-Couple Families in Chignik Lake
| Children | Above Poverty | Below Poverty |
| No Children | 5 (100.0%) | 0 (0.0%) |
| 1 or 2 Children | 0 (0.0%) | 0 (0.0%) |
| 3 or 4 Children | 1 (100.0%) | 0 (0.0%) |
| 5 or more Children | 3 (100.0%) | 0 (0.0%) |
| Total | 9 (100.0%) | 0 (0.0%) |
Income Below Poverty Among Single-Parent Households in Chignik Lake
| Children | Single Father | Single Mother |
| No Children | 0 (0.0%) | 0 (0.0%) |
| 1 or 2 Children | 0 (0.0%) | 0 (0.0%) |
| 3 or 4 Children | 0 (0.0%) | 0 (0.0%) |
| 5 or more Children | 0 (0.0%) | 0 (0.0%) |
| Total | 0 (0.0%) | 0 (0.0%) |
Income Below Poverty Among Married-Couple vs Single-Parent Households in Chignik Lake
| Children | Married-Couple Families | Single-Parent Households |
| No Children | 0 (0.0%) | 0 (0.0%) |
| 1 or 2 Children | 0 (0.0%) | 0 (0.0%) |
| 3 or 4 Children | 0 (0.0%) | 0 (0.0%) |
| 5 or more Children | 0 (0.0%) | 0 (0.0%) |
| Total | 0 (0.0%) | 0 (0.0%) |
Race in Chignik Lake
The most populous races in Chignik Lake are Native / Alaskan (22 | 73.3%), Two or more Races (7 | 23.3%), and White / Caucasian (1 | 3.3%).
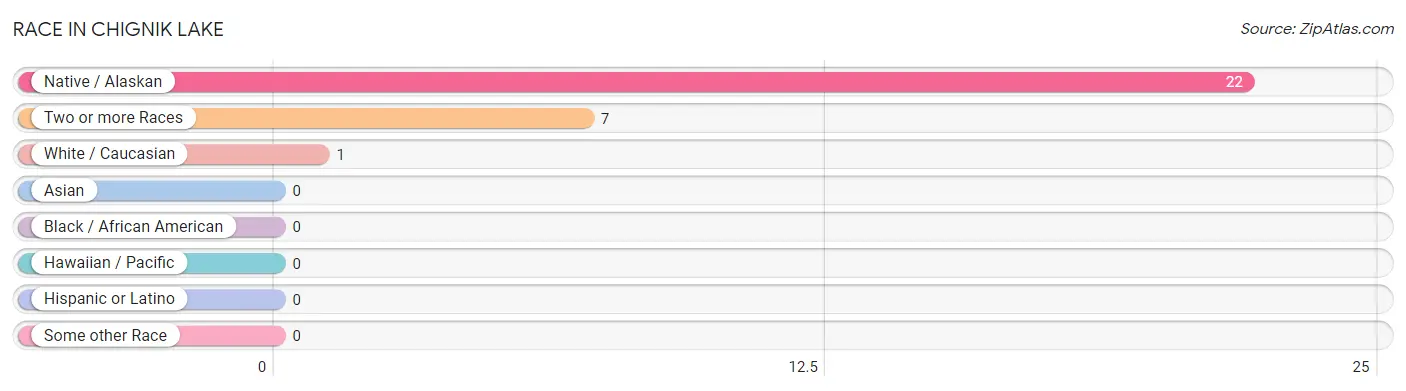
| Race | # Population | % Population |
| Asian | 0 | 0.0% |
| Black / African American | 0 | 0.0% |
| Hawaiian / Pacific | 0 | 0.0% |
| Hispanic or Latino | 0 | 0.0% |
| Native / Alaskan | 22 | 73.3% |
| White / Caucasian | 1 | 3.3% |
| Two or more Races | 7 | 23.3% |
| Some other Race | 0 | 0.0% |
| Total | 30 | 100.0% |
Ancestry in Chignik Lake
The most populous ancestries reported in Chignik Lake are Aleut (18 | 60.0%), Inupiat (15 | 50.0%), Alaska Native (6 | 20.0%), and Swedish (3 | 10.0%), together accounting for 140.0% of all Chignik Lake residents.
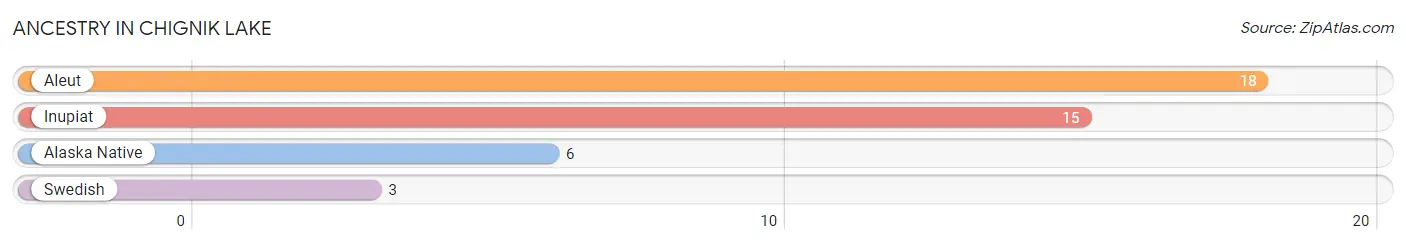
| Ancestry | # Population | % Population |
| Alaska Native | 6 | 20.0% |
| Aleut | 18 | 60.0% |
| Inupiat | 15 | 50.0% |
| Swedish | 3 | 10.0% | View All 4 Rows |
Immigrants in Chignik Lake

| Immigration Origin | # Population | % Population | View All 0 Rows |
Sex and Age in Chignik Lake
Sex and Age in Chignik Lake
The most populous age groups in Chignik Lake are 15 to 19 Years (6 | 35.3%) for men and 35 to 39 Years (4 | 30.8%) for women.
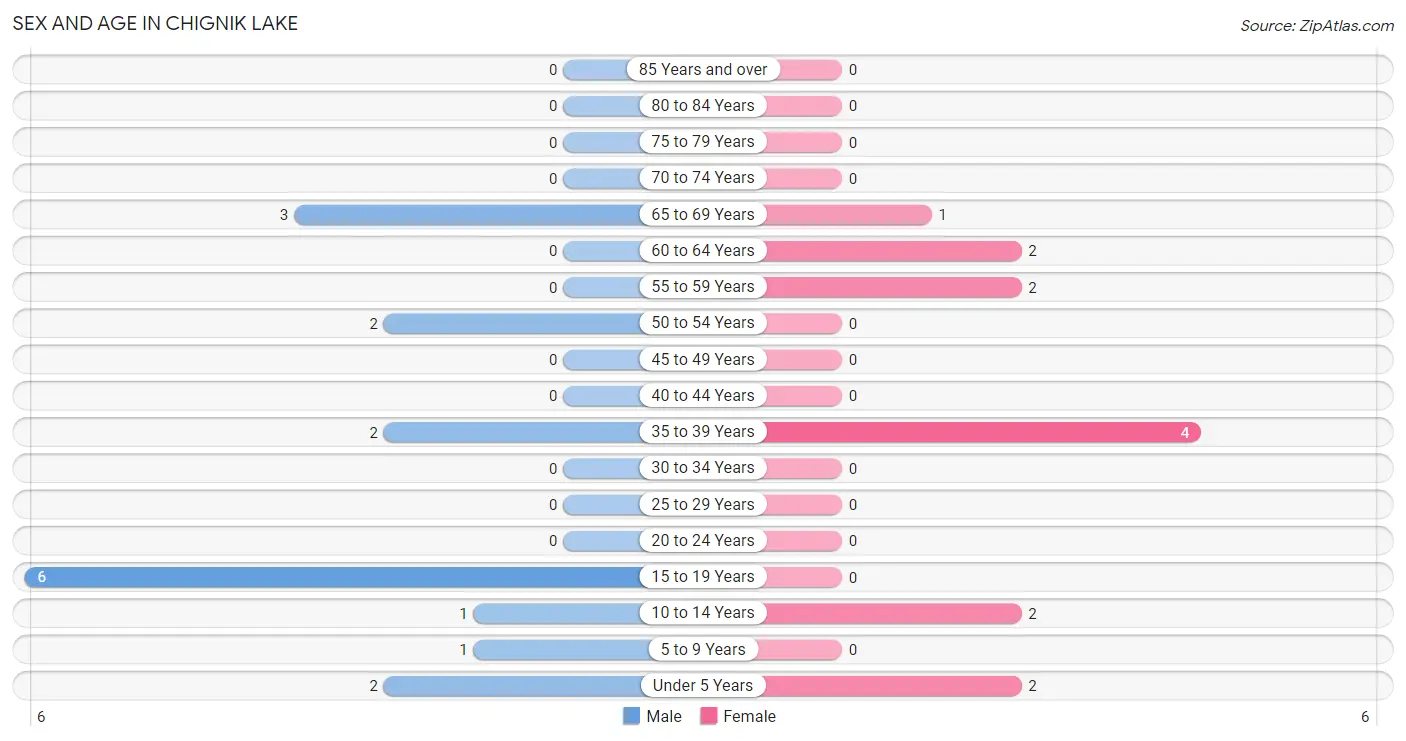
| Age Bracket | Male | Female |
| Under 5 Years | 2 (11.8%) | 2 (15.4%) |
| 5 to 9 Years | 1 (5.9%) | 0 (0.0%) |
| 10 to 14 Years | 1 (5.9%) | 2 (15.4%) |
| 15 to 19 Years | 6 (35.3%) | 0 (0.0%) |
| 20 to 24 Years | 0 (0.0%) | 0 (0.0%) |
| 25 to 29 Years | 0 (0.0%) | 0 (0.0%) |
| 30 to 34 Years | 0 (0.0%) | 0 (0.0%) |
| 35 to 39 Years | 2 (11.8%) | 4 (30.8%) |
| 40 to 44 Years | 0 (0.0%) | 0 (0.0%) |
| 45 to 49 Years | 0 (0.0%) | 0 (0.0%) |
| 50 to 54 Years | 2 (11.8%) | 0 (0.0%) |
| 55 to 59 Years | 0 (0.0%) | 2 (15.4%) |
| 60 to 64 Years | 0 (0.0%) | 2 (15.4%) |
| 65 to 69 Years | 3 (17.6%) | 1 (7.7%) |
| 70 to 74 Years | 0 (0.0%) | 0 (0.0%) |
| 75 to 79 Years | 0 (0.0%) | 0 (0.0%) |
| 80 to 84 Years | 0 (0.0%) | 0 (0.0%) |
| 85 Years and over | 0 (0.0%) | 0 (0.0%) |
| Total | 17 (100.0%) | 13 (100.0%) |
Families and Households in Chignik Lake
Median Family Size in Chignik Lake
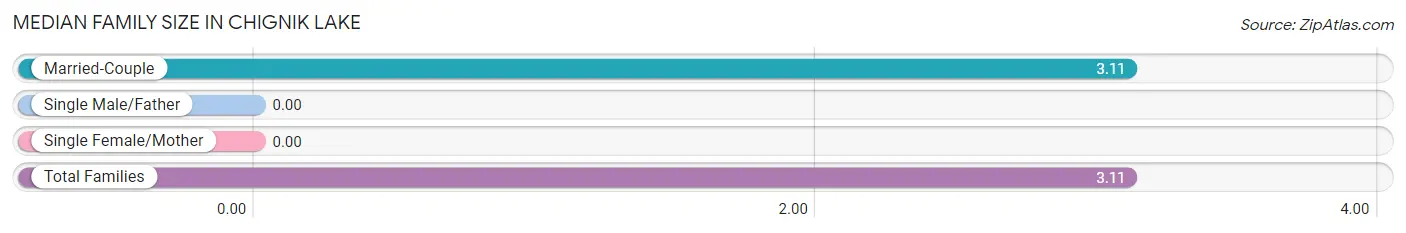
| Family Type | # Families | Family Size |
| Married-Couple | 9 (100.0%) | 3.11 |
| Single Male/Father | 0 (0.0%) | - |
| Single Female/Mother | 0 (0.0%) | - |
| Total Families | 9 (100.0%) | 3.11 |
Median Household Size in Chignik Lake
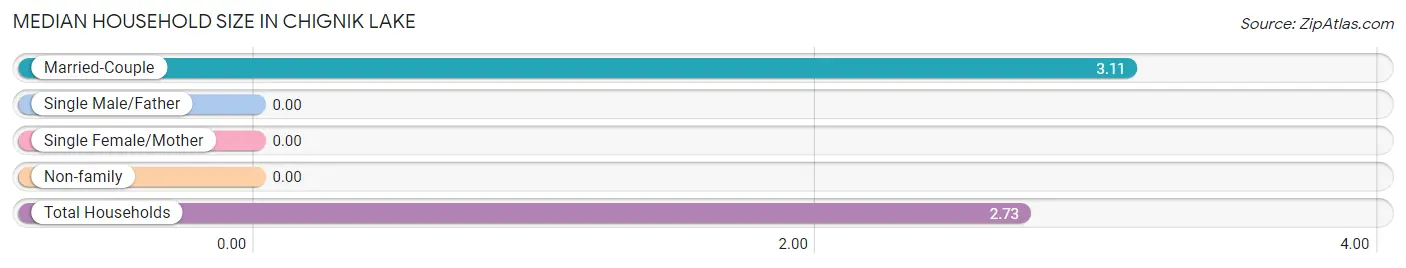
| Household Type | # Households | Household Size |
| Married-Couple | 9 (81.8%) | 3.11 |
| Single Male/Father | 0 (0.0%) | - |
| Single Female/Mother | 0 (0.0%) | - |
| Non-family | 2 (18.2%) | - |
| Total Households | 11 (100.0%) | 2.73 |
Household Size by Marriage Status in Chignik Lake
Out of a total of 11 households in Chignik Lake, 9 (81.8%) are family households, while 2 (18.2%) are nonfamily households. The most numerous type of family households are 2-person households, comprising 5, and the most common type of nonfamily households are 1-person households, comprising 2.
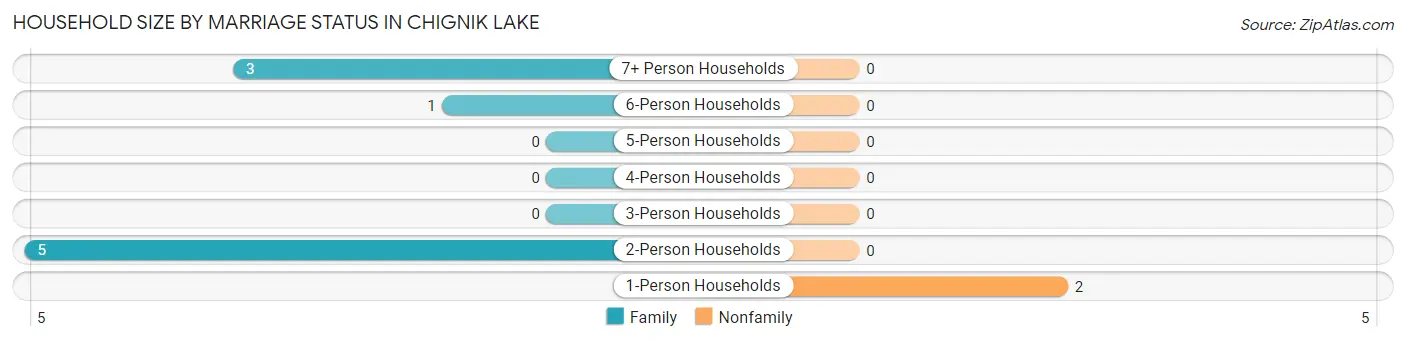
| Household Size | Family Households | Nonfamily Households |
| 1-Person Households | - | 2 (18.2%) |
| 2-Person Households | 5 (45.5%) | 0 (0.0%) |
| 3-Person Households | 0 (0.0%) | 0 (0.0%) |
| 4-Person Households | 0 (0.0%) | 0 (0.0%) |
| 5-Person Households | 0 (0.0%) | 0 (0.0%) |
| 6-Person Households | 1 (9.1%) | 0 (0.0%) |
| 7+ Person Households | 3 (27.3%) | 0 (0.0%) |
| Total | 9 (81.8%) | 2 (18.2%) |
Female Fertility in Chignik Lake
Fertility by Age in Chignik Lake
| Age Bracket | Women with Births | Births / 1,000 Women |
| 15 to 19 years | 0 (0.0%) | 0.0 |
| 20 to 34 years | 0 (0.0%) | 0.0 |
| 35 to 50 years | 0 (0.0%) | 0.0 |
| Total | 0 (0.0%) | 0.0 |
Fertility by Age by Marriage Status in Chignik Lake
| Age Bracket | Married | Unmarried |
| 15 to 19 years | 0 (0.0%) | 0 (0.0%) |
| 20 to 34 years | 0 (0.0%) | 0 (0.0%) |
| 35 to 50 years | 0 (0.0%) | 0 (0.0%) |
| Total | 0 (0.0%) | 0 (0.0%) |
Fertility by Education in Chignik Lake
| Educational Attainment | Women with Births | Births / 1,000 Women |
| Less than High School | 0 (0.0%) | 0.0 |
| High School Diploma | 0 (0.0%) | 0.0 |
| College or Associate's Degree | 0 (0.0%) | 0.0 |
| Bachelor's Degree | 0 (0.0%) | 0.0 |
| Graduate Degree | 0 (0.0%) | 0.0 |
| Total | 0 (0.0%) | 0.0 |
Fertility by Education by Marriage Status in Chignik Lake
| Educational Attainment | Married | Unmarried |
| Less than High School | 0 (0.0%) | 0 (0.0%) |
| High School Diploma | 0 (0.0%) | 0 (0.0%) |
| College or Associate's Degree | 0 (0.0%) | 0 (0.0%) |
| Bachelor's Degree | 0 (0.0%) | 0 (0.0%) |
| Graduate Degree | 0 (0.0%) | 0 (0.0%) |
| Total | 0 (0.0%) | 0 (0.0%) |
Employment Characteristics in Chignik Lake
Employment by Class of Employer in Chignik Lake
Among the 10 employed individuals in Chignik Lake, private company employees (3 | 30.0%), local government employees (3 | 30.0%), and federal government employees (3 | 30.0%) make up the most common classes of employment.
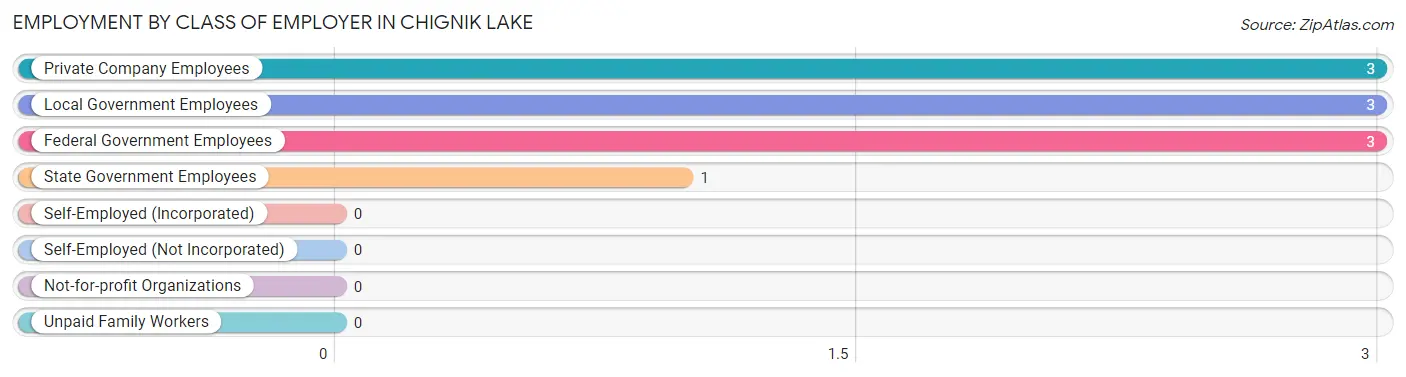
| Employer Class | # Employees | % Employees |
| Private Company Employees | 3 | 30.0% |
| Self-Employed (Incorporated) | 0 | 0.0% |
| Self-Employed (Not Incorporated) | 0 | 0.0% |
| Not-for-profit Organizations | 0 | 0.0% |
| Local Government Employees | 3 | 30.0% |
| State Government Employees | 1 | 10.0% |
| Federal Government Employees | 3 | 30.0% |
| Unpaid Family Workers | 0 | 0.0% |
| Total | 10 | 100.0% |
Employment Status by Age in Chignik Lake
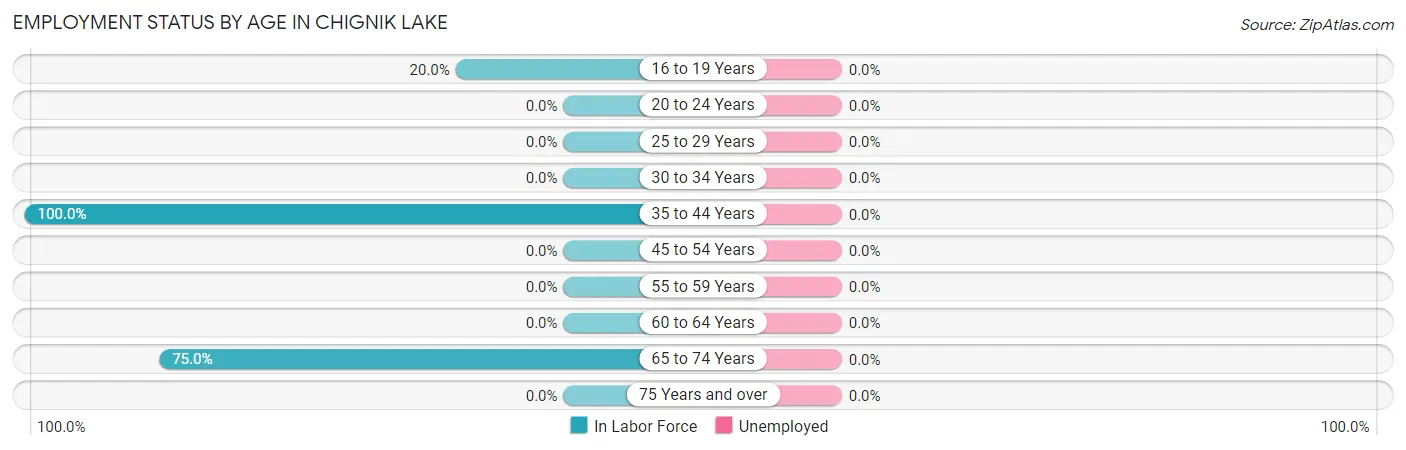
| Age Bracket | In Labor Force | Unemployed |
| 16 to 19 Years | 1 (20.0%) | 0 (0.0%) |
| 20 to 24 Years | 0 (0.0%) | 0 (0.0%) |
| 25 to 29 Years | 0 (0.0%) | 0 (0.0%) |
| 30 to 34 Years | 0 (0.0%) | 0 (0.0%) |
| 35 to 44 Years | 6 (100.0%) | 0 (0.0%) |
| 45 to 54 Years | 0 (0.0%) | 0 (0.0%) |
| 55 to 59 Years | 0 (0.0%) | 0 (0.0%) |
| 60 to 64 Years | 0 (0.0%) | 0 (0.0%) |
| 65 to 74 Years | 3 (75.0%) | 0 (0.0%) |
| 75 Years and over | 0 (0.0%) | 0 (0.0%) |
| Total | 10 (47.6%) | 0 (0.0%) |
Employment Status by Educational Attainment in Chignik Lake
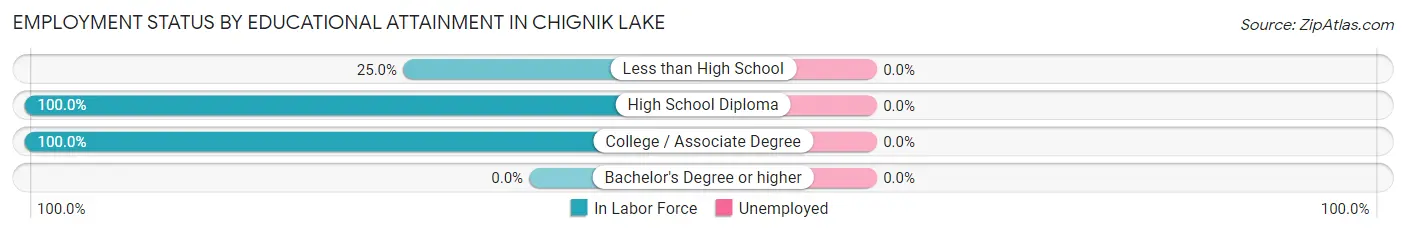
| Educational Attainment | In Labor Force | Unemployed |
| Less than High School | 2 (25.0%) | 0 (0.0%) |
| High School Diploma | 1 (100.0%) | 0 (0.0%) |
| College / Associate Degree | 3 (100.0%) | 0 (0.0%) |
| Bachelor's Degree or higher | 0 (0.0%) | 0 (0.0%) |
| Total | 6 (50.0%) | 0 (0.0%) |
Employment Occupations by Sex in Chignik Lake
Management, Business, Science and Arts Occupations
The most common Management, Business, Science and Arts occupations in Chignik Lake are , and Management (3 | 30.0%).
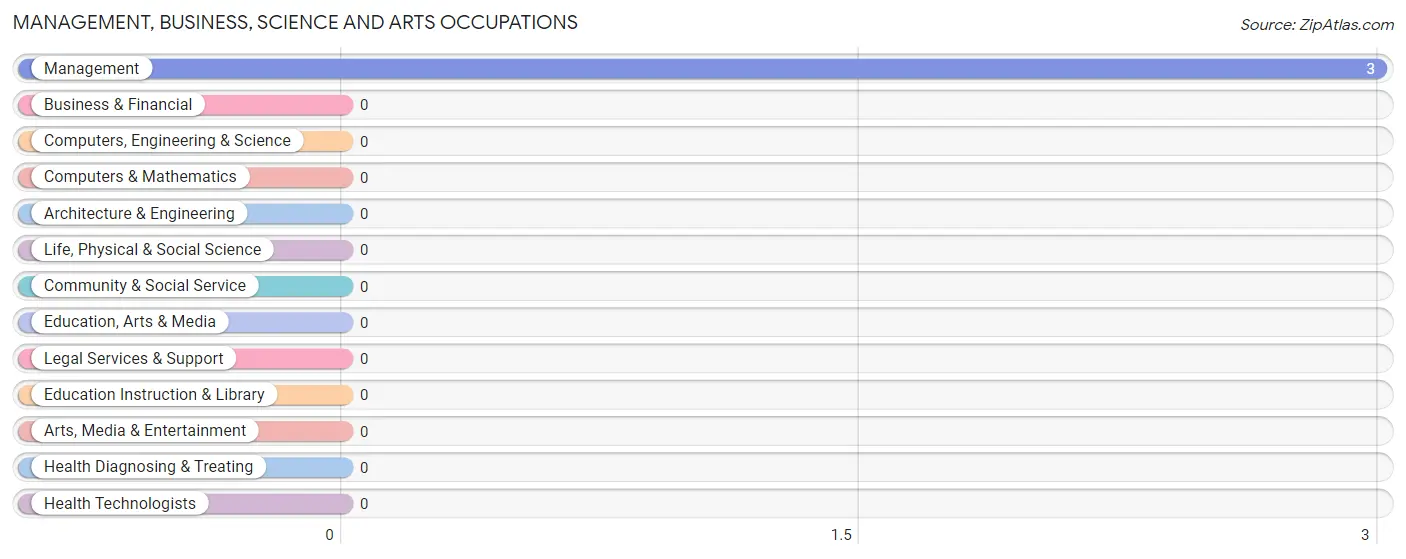
Management, Business, Science and Arts Occupations by Sex
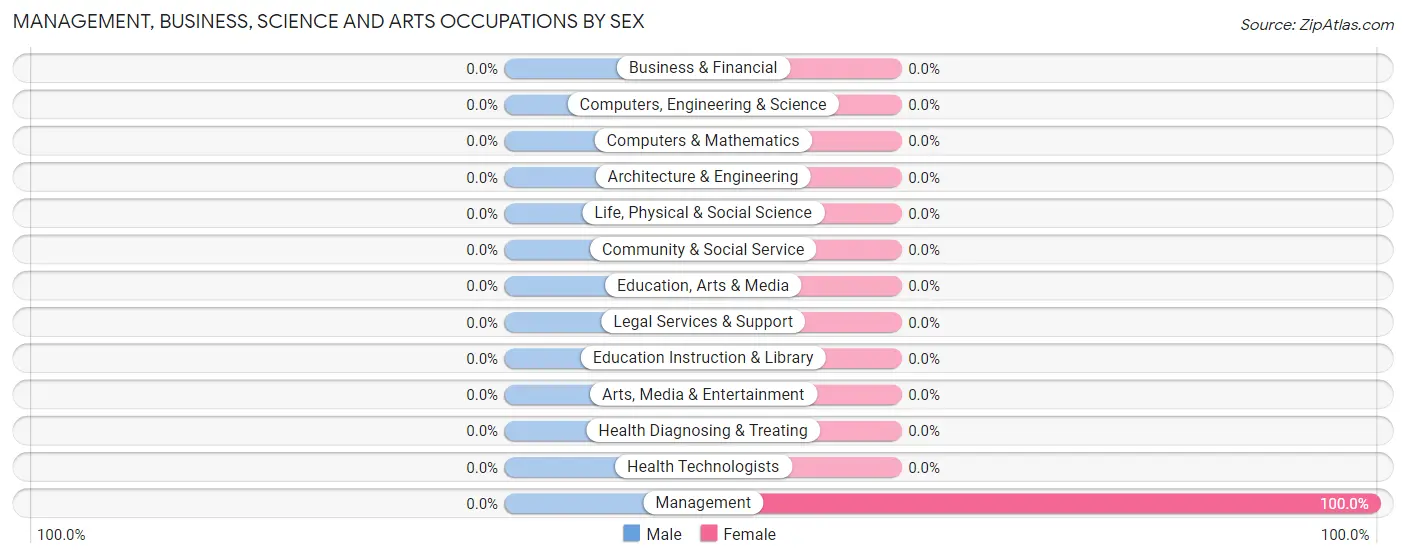
| Occupation | Male | Female |
| Management | 0 (0.0%) | 3 (100.0%) |
| Business & Financial | 0 (0.0%) | 0 (0.0%) |
| Computers, Engineering & Science | 0 (0.0%) | 0 (0.0%) |
| Computers & Mathematics | 0 (0.0%) | 0 (0.0%) |
| Architecture & Engineering | 0 (0.0%) | 0 (0.0%) |
| Life, Physical & Social Science | 0 (0.0%) | 0 (0.0%) |
| Community & Social Service | 0 (0.0%) | 0 (0.0%) |
| Education, Arts & Media | 0 (0.0%) | 0 (0.0%) |
| Legal Services & Support | 0 (0.0%) | 0 (0.0%) |
| Education Instruction & Library | 0 (0.0%) | 0 (0.0%) |
| Arts, Media & Entertainment | 0 (0.0%) | 0 (0.0%) |
| Health Diagnosing & Treating | 0 (0.0%) | 0 (0.0%) |
| Health Technologists | 0 (0.0%) | 0 (0.0%) |
| Total (Category) | 0 (0.0%) | 3 (100.0%) |
| Total (Overall) | 6 (60.0%) | 4 (40.0%) |
Services Occupations
The most common Services occupations in Chignik Lake are , and Cleaning & Maintenance (1 | 10.0%).
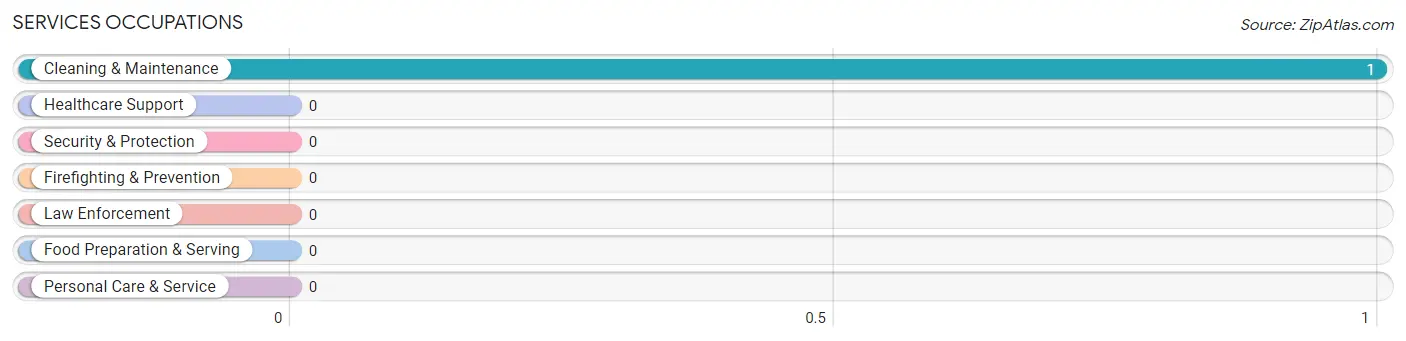
Services Occupations by Sex
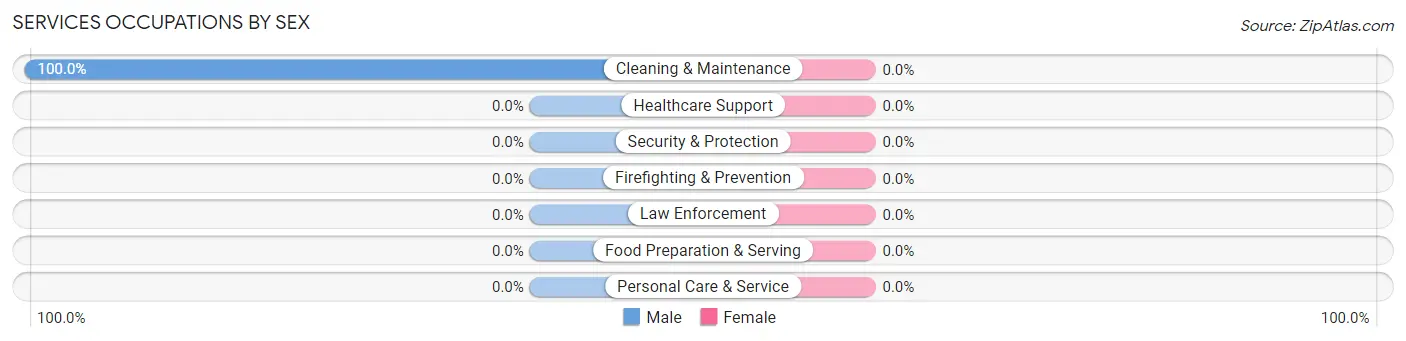
| Occupation | Male | Female |
| Healthcare Support | 0 (0.0%) | 0 (0.0%) |
| Security & Protection | 0 (0.0%) | 0 (0.0%) |
| Firefighting & Prevention | 0 (0.0%) | 0 (0.0%) |
| Law Enforcement | 0 (0.0%) | 0 (0.0%) |
| Food Preparation & Serving | 0 (0.0%) | 0 (0.0%) |
| Cleaning & Maintenance | 1 (100.0%) | 0 (0.0%) |
| Personal Care & Service | 0 (0.0%) | 0 (0.0%) |
| Total (Category) | 1 (100.0%) | 0 (0.0%) |
| Total (Overall) | 6 (60.0%) | 4 (40.0%) |
Sales and Office Occupations
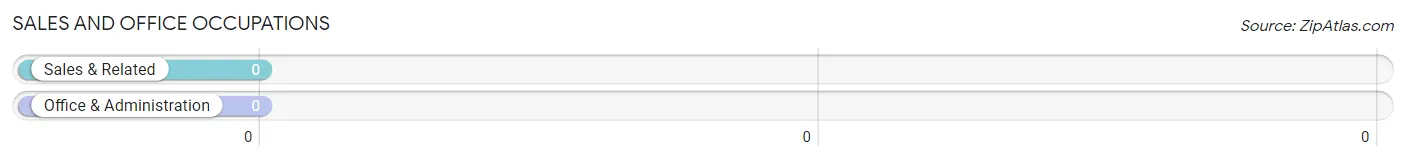
Sales and Office Occupations by Sex
| Occupation | Male | Female |
| Sales & Related | 0 (0.0%) | 0 (0.0%) |
| Office & Administration | 0 (0.0%) | 0 (0.0%) |
| Total (Category) | 0 (0.0%) | 0 (0.0%) |
| Total (Overall) | 6 (60.0%) | 4 (40.0%) |
Natural Resources, Construction and Maintenance Occupations
Natural Resources, Construction and Maintenance Occupations by Sex
| Occupation | Male | Female |
| Farming, Fishing & Forestry | 0 (0.0%) | 0 (0.0%) |
| Construction & Extraction | 0 (0.0%) | 0 (0.0%) |
| Installation, Maintenance & Repair | 0 (0.0%) | 0 (0.0%) |
| Total (Category) | 0 (0.0%) | 0 (0.0%) |
| Total (Overall) | 6 (60.0%) | 4 (40.0%) |
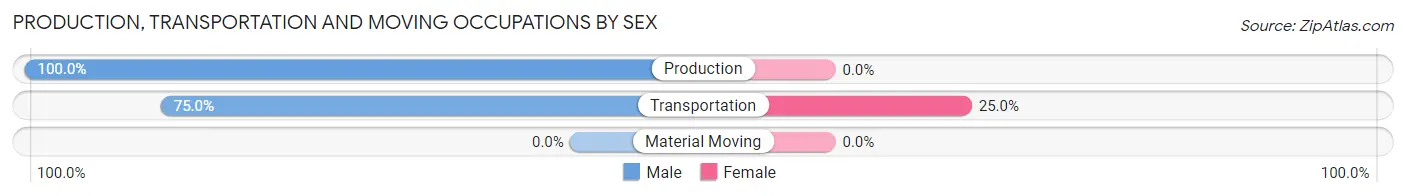
Production, Transportation and Moving Occupations
The most common Production, Transportation and Moving occupations in Chignik Lake are Transportation (4 | 40.0%), and Production (2 | 20.0%).
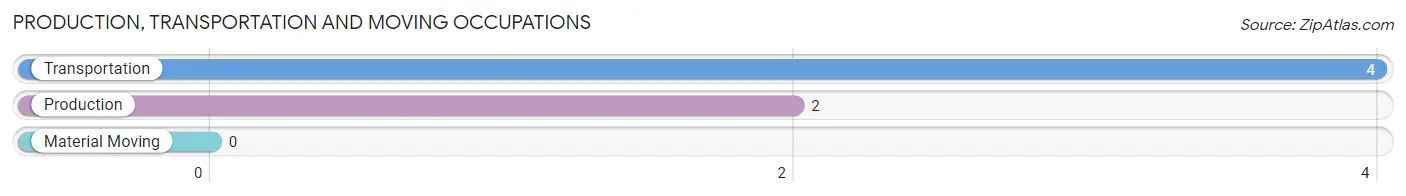
Production, Transportation and Moving Occupations by Sex
| Occupation | Male | Female |
| Production | 2 (100.0%) | 0 (0.0%) |
| Transportation | 3 (75.0%) | 1 (25.0%) |
| Material Moving | 0 (0.0%) | 0 (0.0%) |
| Total (Category) | 5 (83.3%) | 1 (16.7%) |
| Total (Overall) | 6 (60.0%) | 4 (40.0%) |
Employment Industries by Sex in Chignik Lake
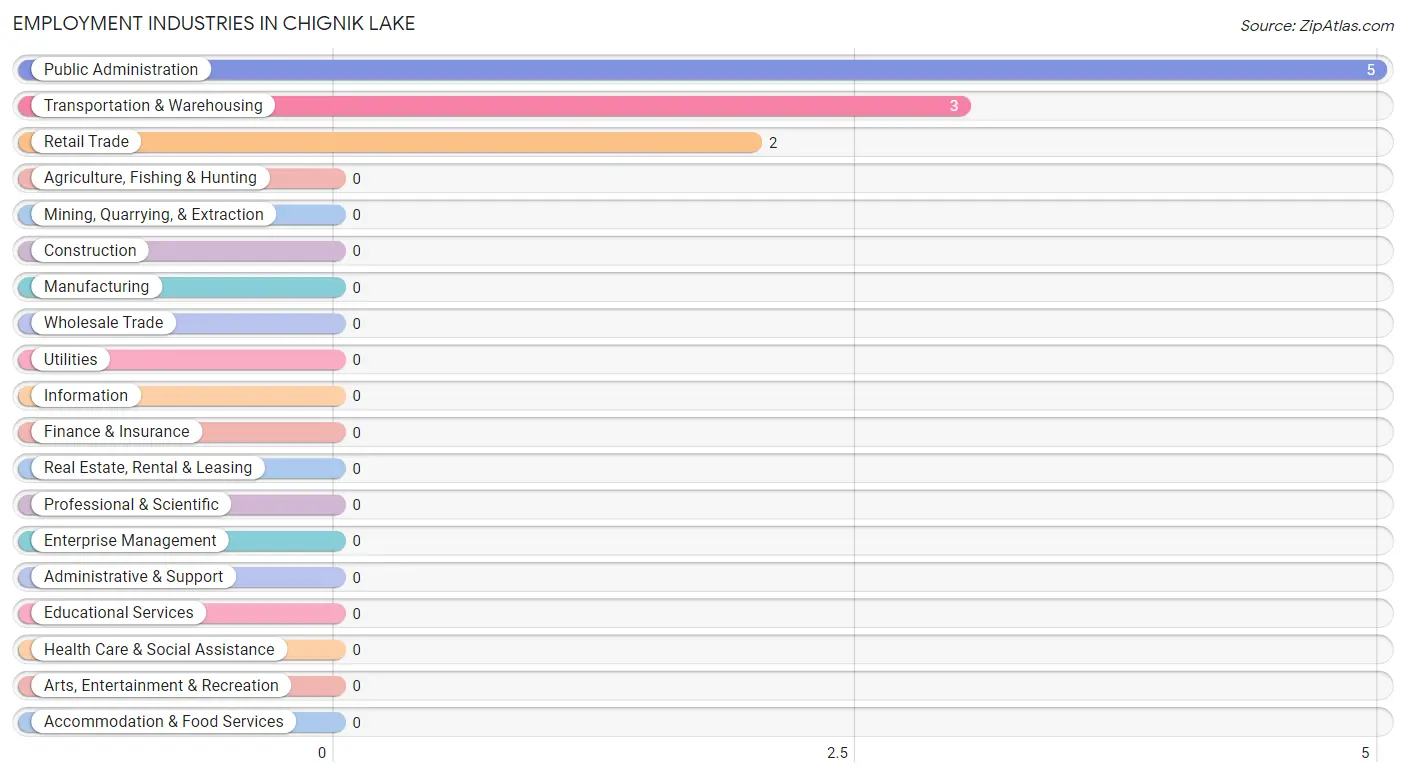
Employment Industries in Chignik Lake
The major employment industries in Chignik Lake include Public Administration (5 | 50.0%), Transportation & Warehousing (3 | 30.0%), and Retail Trade (2 | 20.0%).
Employment Industries by Sex in Chignik Lake
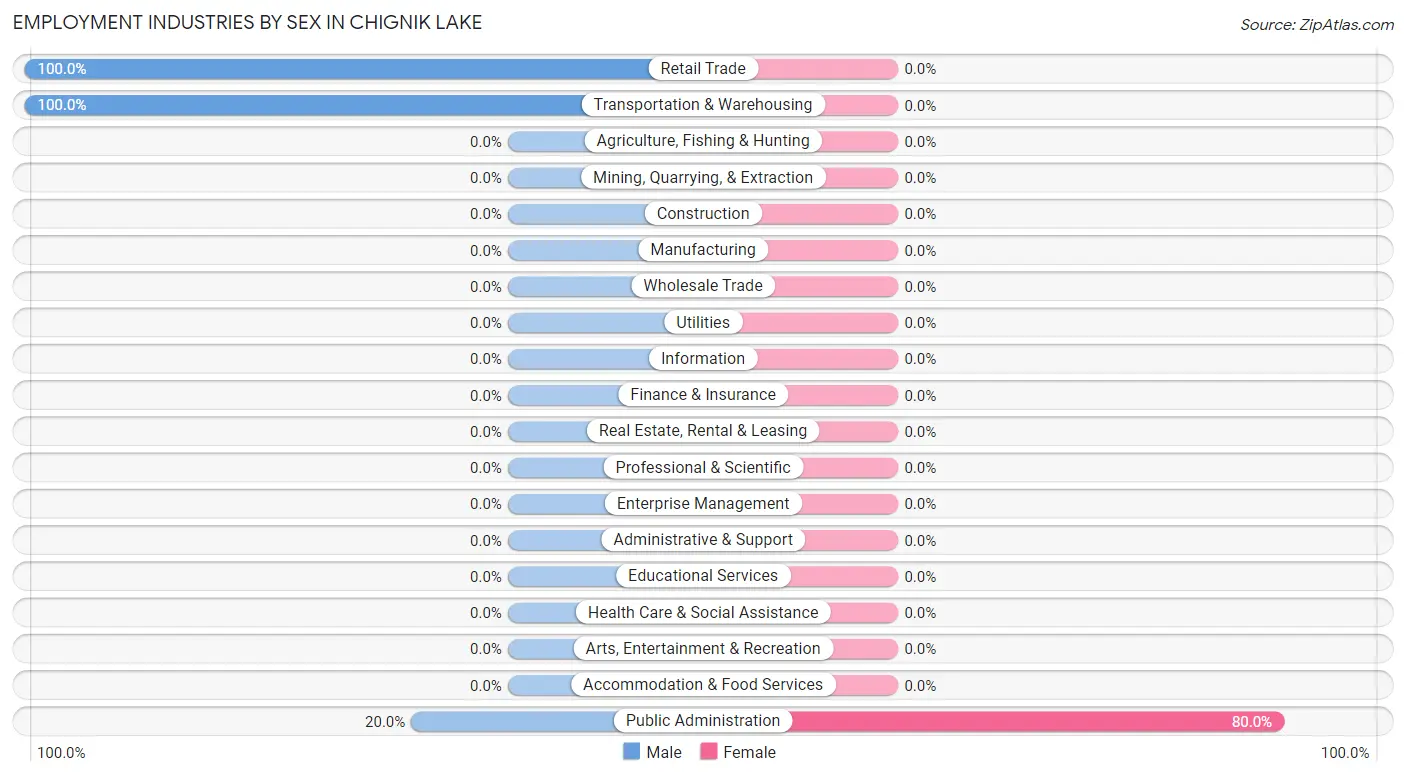
| Industry | Male | Female |
| Agriculture, Fishing & Hunting | 0 (0.0%) | 0 (0.0%) |
| Mining, Quarrying, & Extraction | 0 (0.0%) | 0 (0.0%) |
| Construction | 0 (0.0%) | 0 (0.0%) |
| Manufacturing | 0 (0.0%) | 0 (0.0%) |
| Wholesale Trade | 0 (0.0%) | 0 (0.0%) |
| Retail Trade | 2 (100.0%) | 0 (0.0%) |
| Transportation & Warehousing | 3 (100.0%) | 0 (0.0%) |
| Utilities | 0 (0.0%) | 0 (0.0%) |
| Information | 0 (0.0%) | 0 (0.0%) |
| Finance & Insurance | 0 (0.0%) | 0 (0.0%) |
| Real Estate, Rental & Leasing | 0 (0.0%) | 0 (0.0%) |
| Professional & Scientific | 0 (0.0%) | 0 (0.0%) |
| Enterprise Management | 0 (0.0%) | 0 (0.0%) |
| Administrative & Support | 0 (0.0%) | 0 (0.0%) |
| Educational Services | 0 (0.0%) | 0 (0.0%) |
| Health Care & Social Assistance | 0 (0.0%) | 0 (0.0%) |
| Arts, Entertainment & Recreation | 0 (0.0%) | 0 (0.0%) |
| Accommodation & Food Services | 0 (0.0%) | 0 (0.0%) |
| Public Administration | 1 (20.0%) | 4 (80.0%) |
| Total | 6 (60.0%) | 4 (40.0%) |
Education in Chignik Lake
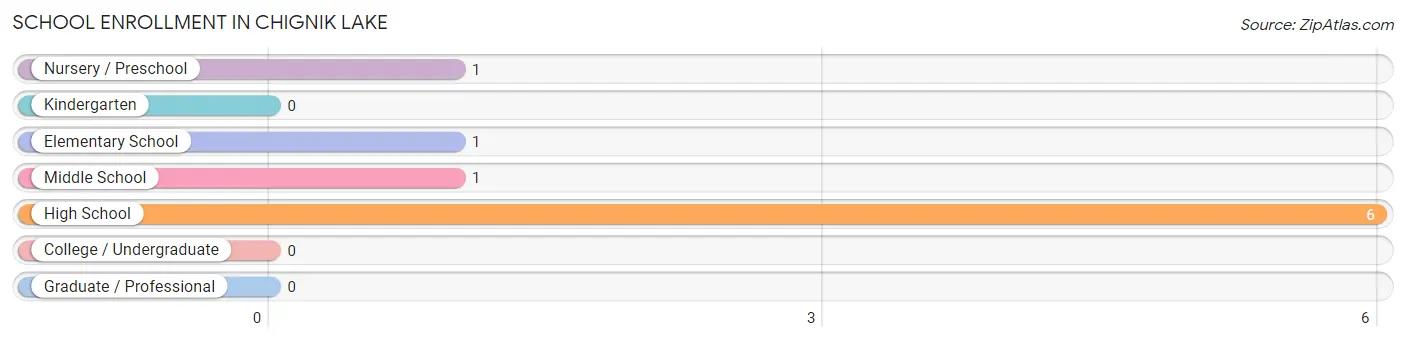
School Enrollment in Chignik Lake
The most common levels of schooling among the 9 students in Chignik Lake are high school (6 | 66.7%), nursery / preschool (1 | 11.1%), and elementary school (1 | 11.1%).
| School Level | # Students | % Students |
| Nursery / Preschool | 1 | 11.1% |
| Kindergarten | 0 | 0.0% |
| Elementary School | 1 | 11.1% |
| Middle School | 1 | 11.1% |
| High School | 6 | 66.7% |
| College / Undergraduate | 0 | 0.0% |
| Graduate / Professional | 0 | 0.0% |
| Total | 9 | 100.0% |
School Enrollment by Age by Funding Source in Chignik Lake
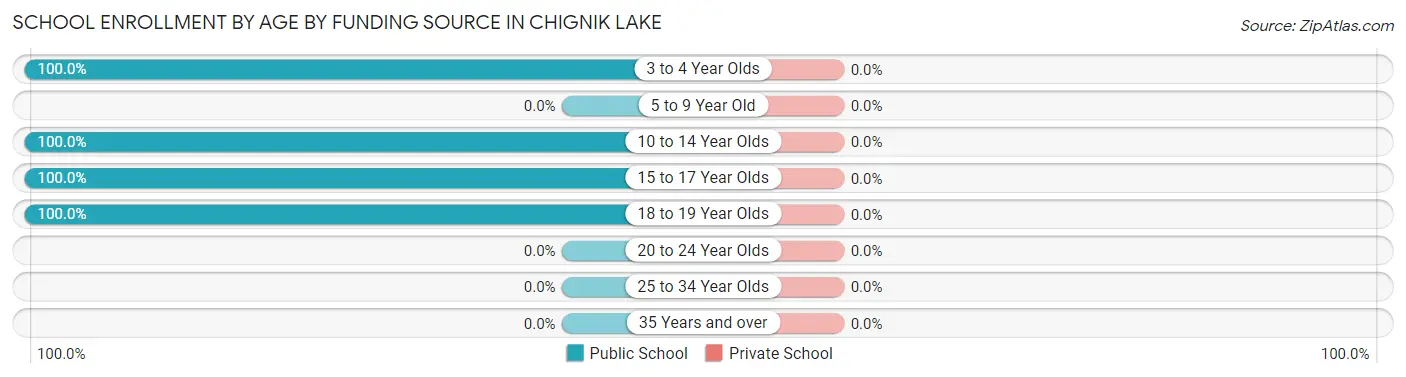
| Age Bracket | Public School | Private School |
| 3 to 4 Year Olds | 1 (100.0%) | 0 (0.0%) |
| 5 to 9 Year Old | 0 (0.0%) | 0 (0.0%) |
| 10 to 14 Year Olds | 3 (100.0%) | 0 (0.0%) |
| 15 to 17 Year Olds | 1 (100.0%) | 0 (0.0%) |
| 18 to 19 Year Olds | 4 (100.0%) | 0 (0.0%) |
| 20 to 24 Year Olds | 0 (0.0%) | 0 (0.0%) |
| 25 to 34 Year Olds | 0 (0.0%) | 0 (0.0%) |
| 35 Years and over | 0 (0.0%) | 0 (0.0%) |
| Total | 9 (100.0%) | 0 (0.0%) |
Educational Attainment by Field of Study in Chignik Lake
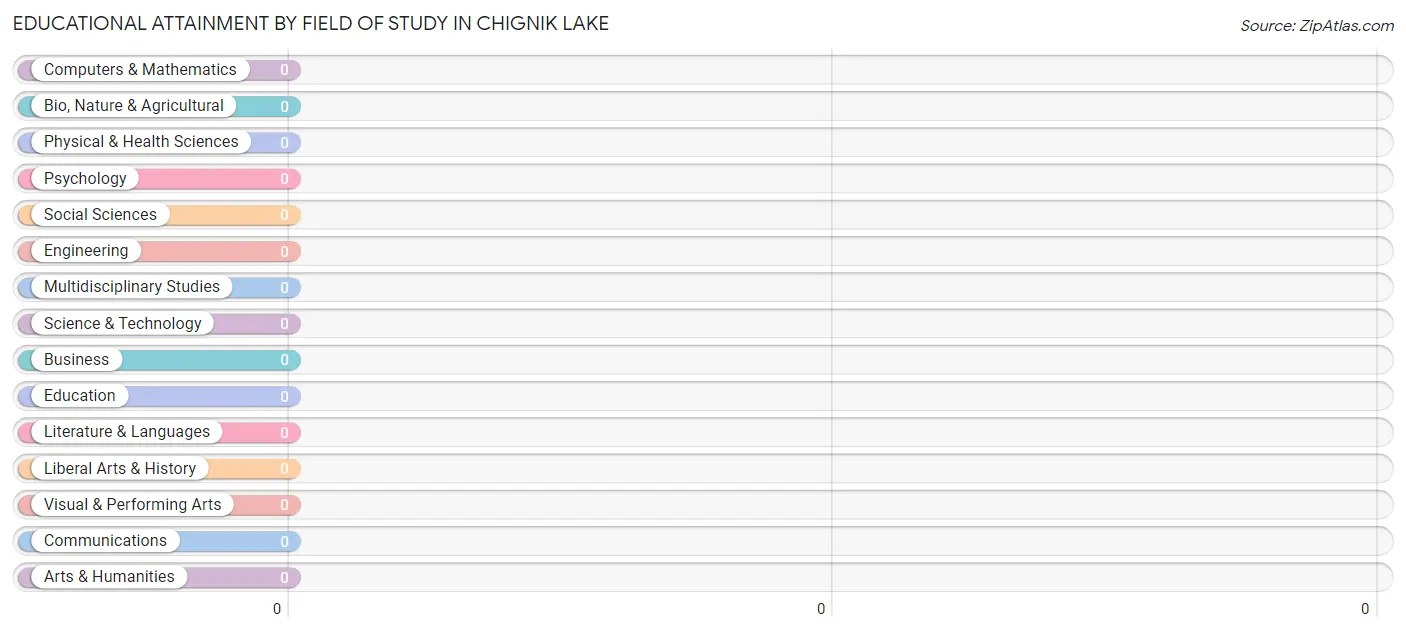
| Field of Study | # Graduates | % Graduates |
| Computers & Mathematics | 0 | 0.0% |
| Bio, Nature & Agricultural | 0 | 0.0% |
| Physical & Health Sciences | 0 | 0.0% |
| Psychology | 0 | 0.0% |
| Social Sciences | 0 | 0.0% |
| Engineering | 0 | 0.0% |
| Multidisciplinary Studies | 0 | 0.0% |
| Science & Technology | 0 | 0.0% |
| Business | 0 | 0.0% |
| Education | 0 | 0.0% |
| Literature & Languages | 0 | 0.0% |
| Liberal Arts & History | 0 | 0.0% |
| Visual & Performing Arts | 0 | 0.0% |
| Communications | 0 | 0.0% |
| Arts & Humanities | 0 | 0.0% |
| Total | 0 | 0.0% |
Transportation & Commute in Chignik Lake
Vehicle Availability by Sex in Chignik Lake
The most prevalent vehicle ownership categories in Chignik Lake are males with 1 vehicle (4, accounting for 66.7%) and females with 1 vehicle (3, making up 100.0%).
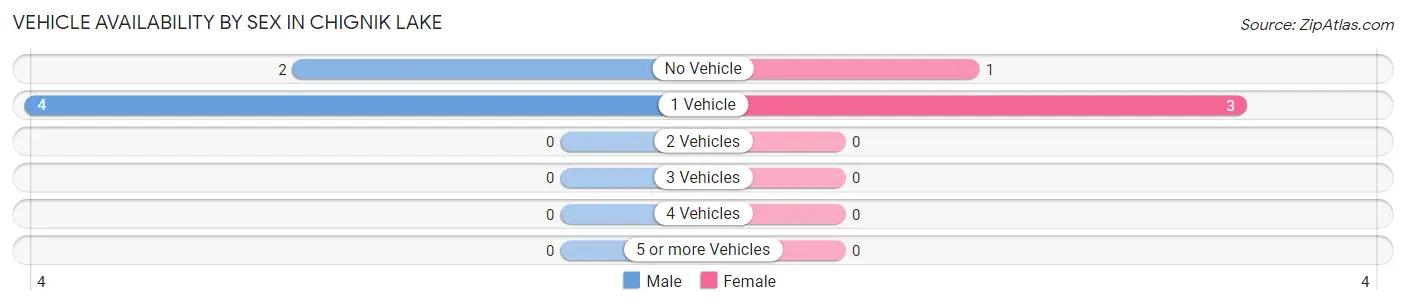
| Vehicles Available | Male | Female |
| No Vehicle | 2 (33.3%) | 1 (25.0%) |
| 1 Vehicle | 4 (66.7%) | 3 (75.0%) |
| 2 Vehicles | 0 (0.0%) | 0 (0.0%) |
| 3 Vehicles | 0 (0.0%) | 0 (0.0%) |
| 4 Vehicles | 0 (0.0%) | 0 (0.0%) |
| 5 or more Vehicles | 0 (0.0%) | 0 (0.0%) |
| Total | 6 (100.0%) | 4 (100.0%) |
Commute Time in Chignik Lake
The most frequently occuring commute durations in Chignik Lake are less than 5 minutes (10 commuters, 100.0%), 5 to 9 minutes (0 commuters, 0.0%), and 10 to 14 minutes (0 commuters, 0.0%).
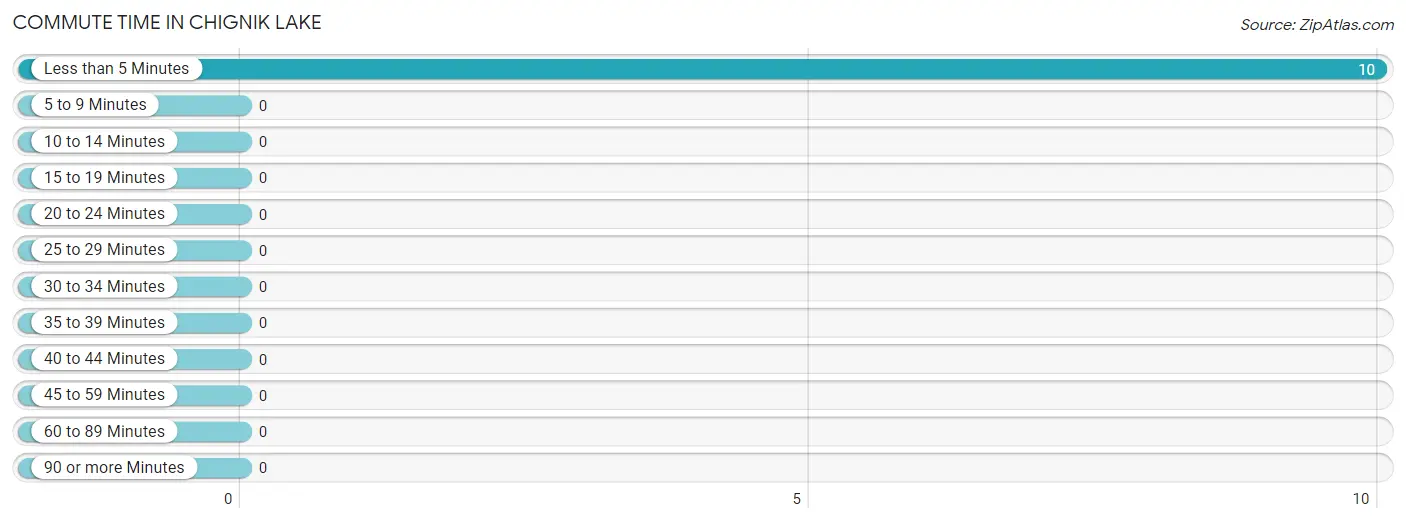
| Commute Time | # Commuters | % Commuters |
| Less than 5 Minutes | 10 | 100.0% |
| 5 to 9 Minutes | 0 | 0.0% |
| 10 to 14 Minutes | 0 | 0.0% |
| 15 to 19 Minutes | 0 | 0.0% |
| 20 to 24 Minutes | 0 | 0.0% |
| 25 to 29 Minutes | 0 | 0.0% |
| 30 to 34 Minutes | 0 | 0.0% |
| 35 to 39 Minutes | 0 | 0.0% |
| 40 to 44 Minutes | 0 | 0.0% |
| 45 to 59 Minutes | 0 | 0.0% |
| 60 to 89 Minutes | 0 | 0.0% |
| 90 or more Minutes | 0 | 0.0% |
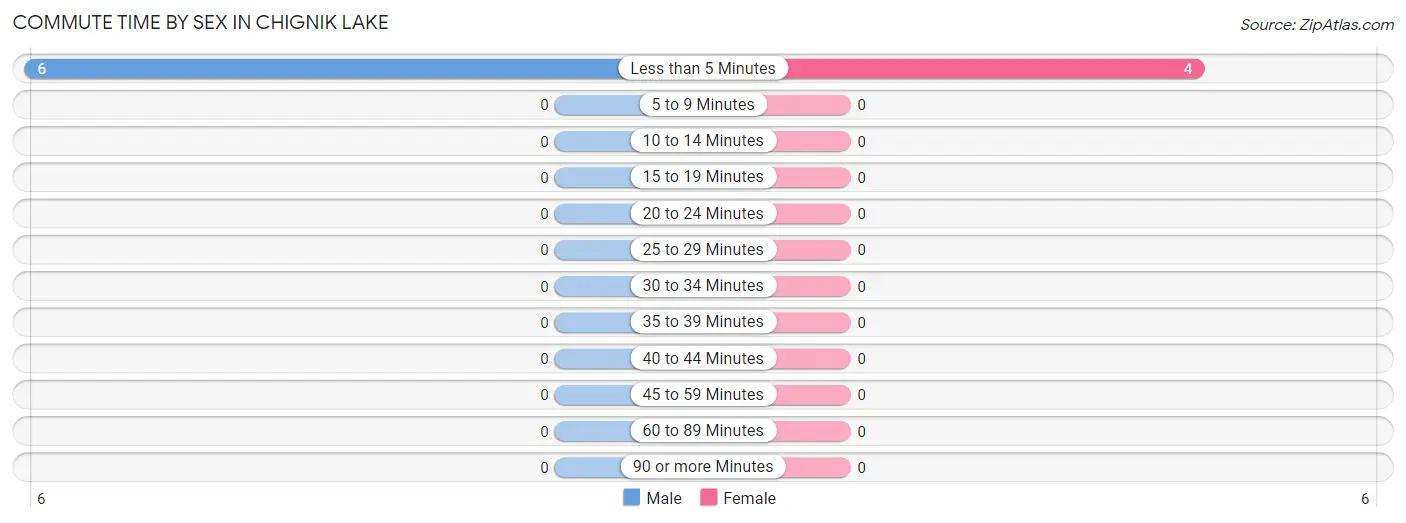
Commute Time by Sex in Chignik Lake
The most common commute times in Chignik Lake are less than 5 minutes (6 commuters, 100.0%) for males and less than 5 minutes (4 commuters, 100.0%) for females.
| Commute Time | Male | Female |
| Less than 5 Minutes | 6 (100.0%) | 4 (100.0%) |
| 5 to 9 Minutes | 0 (0.0%) | 0 (0.0%) |
| 10 to 14 Minutes | 0 (0.0%) | 0 (0.0%) |
| 15 to 19 Minutes | 0 (0.0%) | 0 (0.0%) |
| 20 to 24 Minutes | 0 (0.0%) | 0 (0.0%) |
| 25 to 29 Minutes | 0 (0.0%) | 0 (0.0%) |
| 30 to 34 Minutes | 0 (0.0%) | 0 (0.0%) |
| 35 to 39 Minutes | 0 (0.0%) | 0 (0.0%) |
| 40 to 44 Minutes | 0 (0.0%) | 0 (0.0%) |
| 45 to 59 Minutes | 0 (0.0%) | 0 (0.0%) |
| 60 to 89 Minutes | 0 (0.0%) | 0 (0.0%) |
| 90 or more Minutes | 0 (0.0%) | 0 (0.0%) |
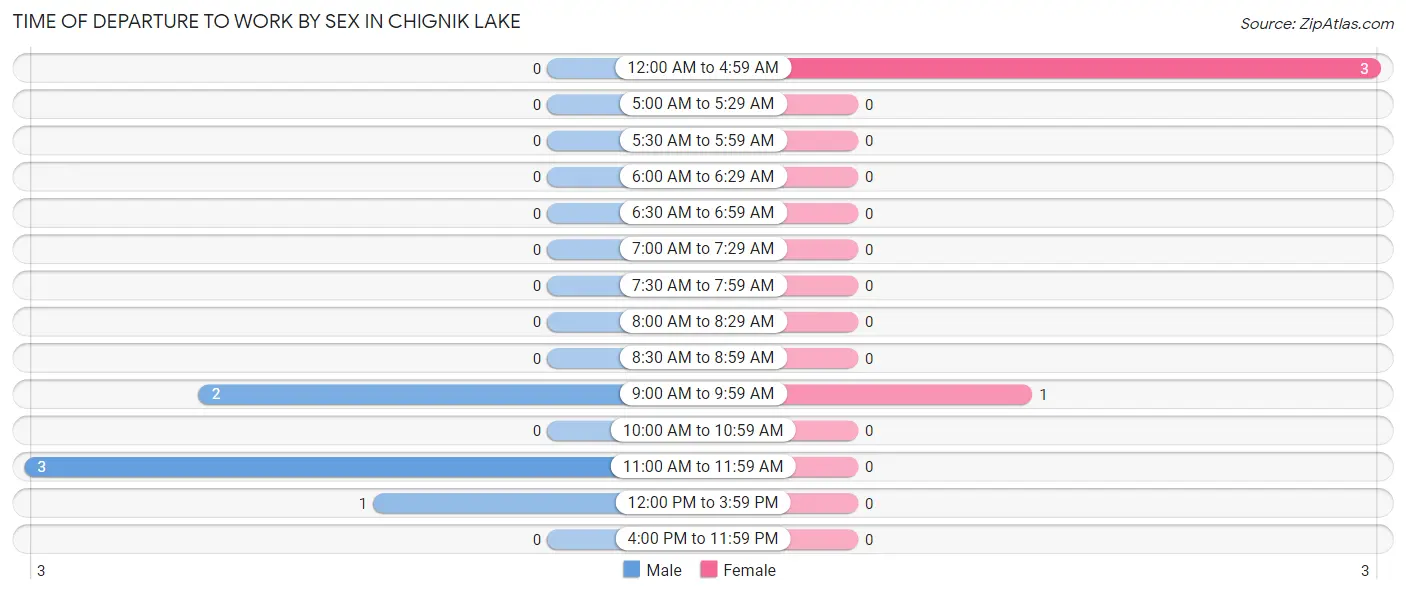
Time of Departure to Work by Sex in Chignik Lake
The most frequent times of departure to work in Chignik Lake are 11:00 AM to 11:59 AM (3, 50.0%) for males and 12:00 AM to 4:59 AM (3, 75.0%) for females.
| Time of Departure | Male | Female |
| 12:00 AM to 4:59 AM | 0 (0.0%) | 3 (75.0%) |
| 5:00 AM to 5:29 AM | 0 (0.0%) | 0 (0.0%) |
| 5:30 AM to 5:59 AM | 0 (0.0%) | 0 (0.0%) |
| 6:00 AM to 6:29 AM | 0 (0.0%) | 0 (0.0%) |
| 6:30 AM to 6:59 AM | 0 (0.0%) | 0 (0.0%) |
| 7:00 AM to 7:29 AM | 0 (0.0%) | 0 (0.0%) |
| 7:30 AM to 7:59 AM | 0 (0.0%) | 0 (0.0%) |
| 8:00 AM to 8:29 AM | 0 (0.0%) | 0 (0.0%) |
| 8:30 AM to 8:59 AM | 0 (0.0%) | 0 (0.0%) |
| 9:00 AM to 9:59 AM | 2 (33.3%) | 1 (25.0%) |
| 10:00 AM to 10:59 AM | 0 (0.0%) | 0 (0.0%) |
| 11:00 AM to 11:59 AM | 3 (50.0%) | 0 (0.0%) |
| 12:00 PM to 3:59 PM | 1 (16.7%) | 0 (0.0%) |
| 4:00 PM to 11:59 PM | 0 (0.0%) | 0 (0.0%) |
| Total | 6 (100.0%) | 4 (100.0%) |
Housing Occupancy in Chignik Lake
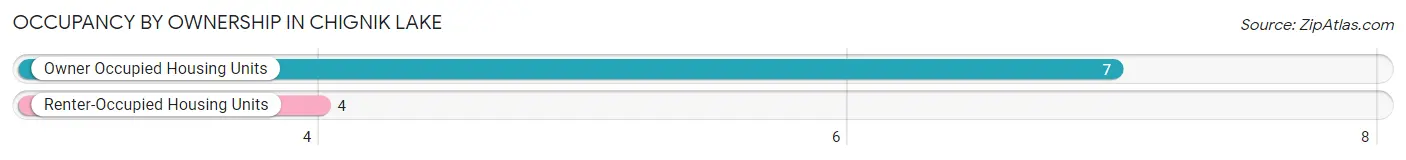
Occupancy by Ownership in Chignik Lake
Of the total 11 dwellings in Chignik Lake, owner-occupied units account for 7 (63.6%), while renter-occupied units make up 4 (36.4%).
| Occupancy | # Housing Units | % Housing Units |
| Owner Occupied Housing Units | 7 | 63.6% |
| Renter-Occupied Housing Units | 4 | 36.4% |
| Total Occupied Housing Units | 11 | 100.0% |
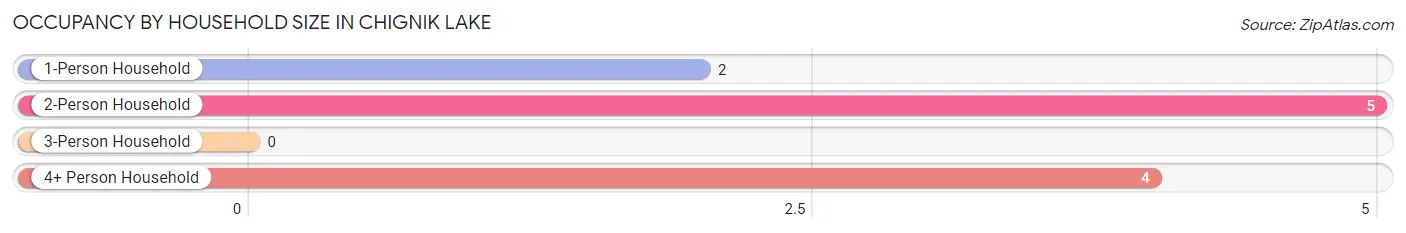
Occupancy by Household Size in Chignik Lake
| Household Size | # Housing Units | % Housing Units |
| 1-Person Household | 2 | 18.2% |
| 2-Person Household | 5 | 45.5% |
| 3-Person Household | 0 | 0.0% |
| 4+ Person Household | 4 | 36.4% |
| Total Housing Units | 11 | 100.0% |
Occupancy by Ownership by Household Size in Chignik Lake
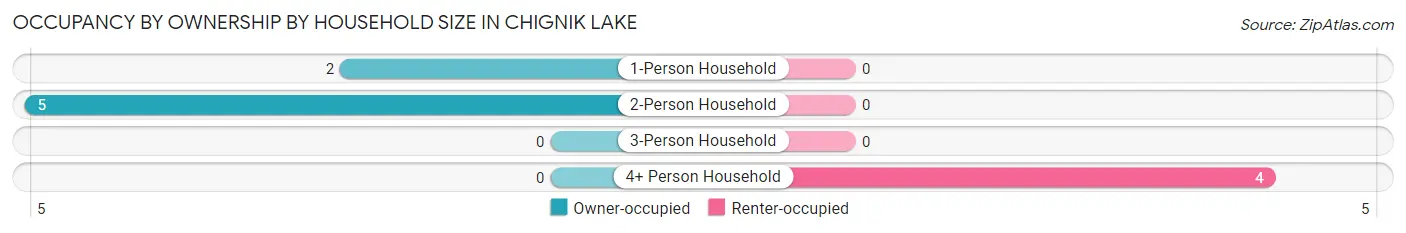
| Household Size | Owner-occupied | Renter-occupied |
| 1-Person Household | 2 (100.0%) | 0 (0.0%) |
| 2-Person Household | 5 (100.0%) | 0 (0.0%) |
| 3-Person Household | 0 (0.0%) | 0 (0.0%) |
| 4+ Person Household | 0 (0.0%) | 4 (100.0%) |
| Total Housing Units | 7 (63.6%) | 4 (36.4%) |
Occupancy by Educational Attainment in Chignik Lake
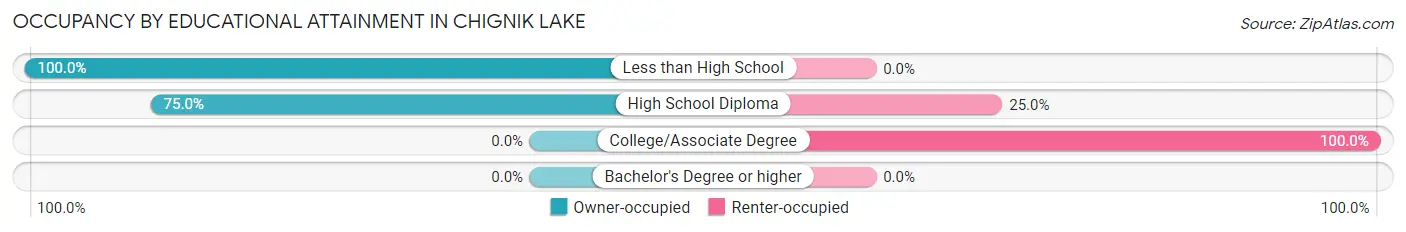
| Household Size | Owner-occupied | Renter-occupied |
| Less than High School | 4 (100.0%) | 0 (0.0%) |
| High School Diploma | 3 (75.0%) | 1 (25.0%) |
| College/Associate Degree | 0 (0.0%) | 3 (100.0%) |
| Bachelor's Degree or higher | 0 (0.0%) | 0 (0.0%) |
Occupancy by Age of Householder in Chignik Lake
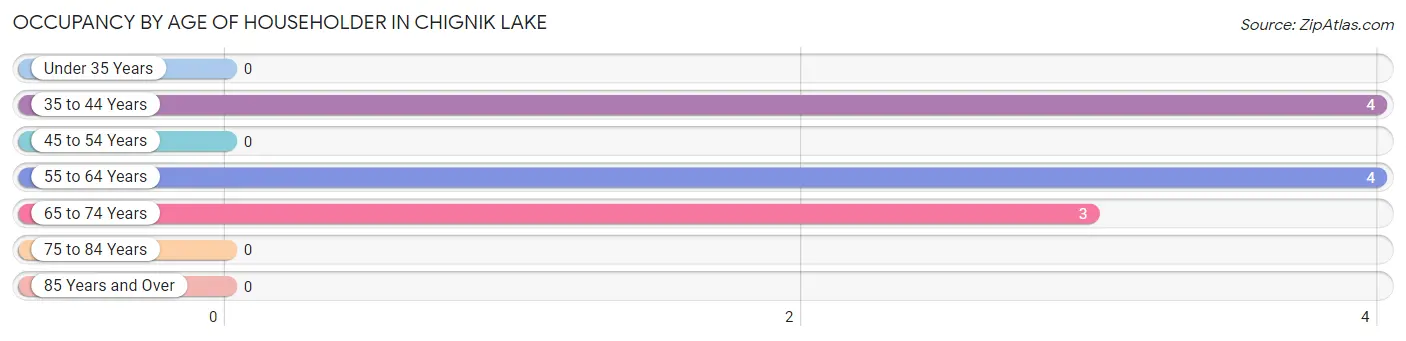
| Age Bracket | # Households | % Households |
| Under 35 Years | 0 | 0.0% |
| 35 to 44 Years | 4 | 36.4% |
| 45 to 54 Years | 0 | 0.0% |
| 55 to 64 Years | 4 | 36.4% |
| 65 to 74 Years | 3 | 27.3% |
| 75 to 84 Years | 0 | 0.0% |
| 85 Years and Over | 0 | 0.0% |
| Total | 11 | 100.0% |
Housing Finances in Chignik Lake
Median Income by Occupancy in Chignik Lake
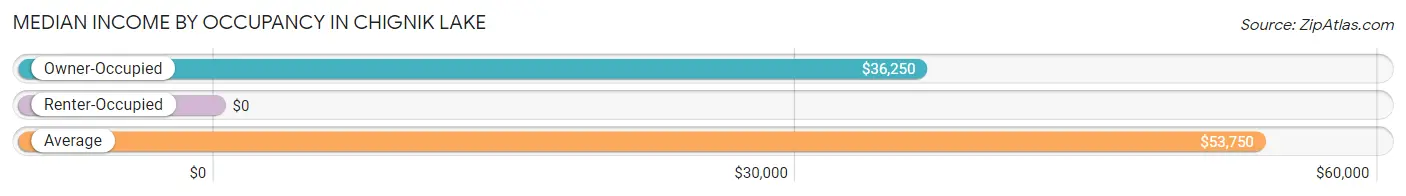
| Occupancy Type | # Households | Median Income |
| Owner-Occupied | 7 (63.6%) | $36,250 |
| Renter-Occupied | 4 (36.4%) | $0 |
| Average | 11 (100.0%) | $53,750 |
Occupancy by Householder Income Bracket in Chignik Lake
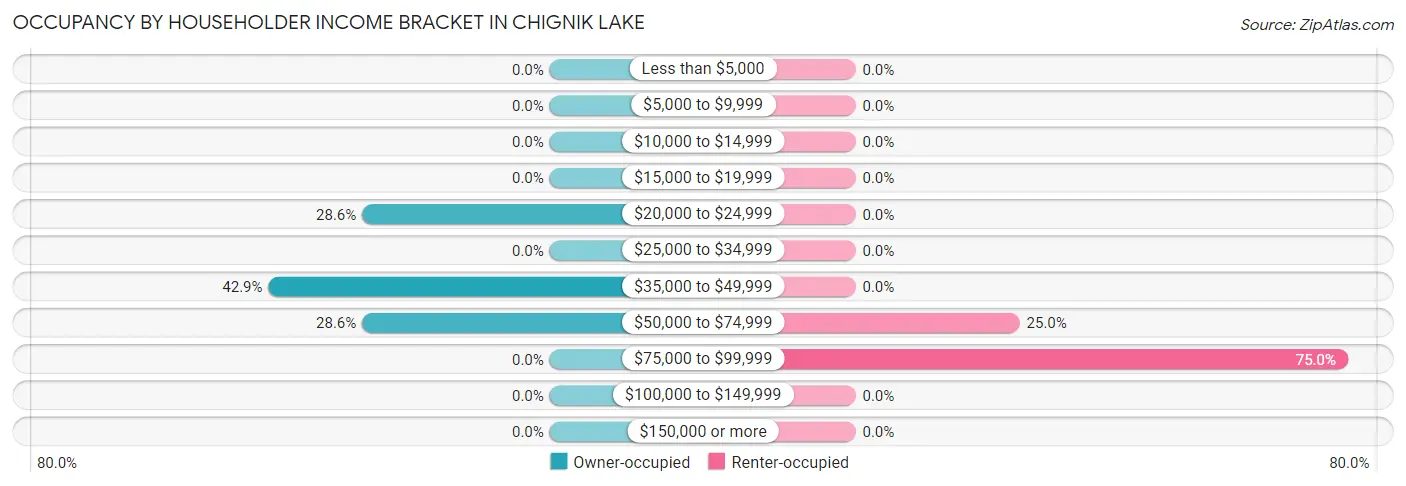
| Income Bracket | Owner-occupied | Renter-occupied |
| Less than $5,000 | 0 (0.0%) | 0 (0.0%) |
| $5,000 to $9,999 | 0 (0.0%) | 0 (0.0%) |
| $10,000 to $14,999 | 0 (0.0%) | 0 (0.0%) |
| $15,000 to $19,999 | 0 (0.0%) | 0 (0.0%) |
| $20,000 to $24,999 | 2 (28.6%) | 0 (0.0%) |
| $25,000 to $34,999 | 0 (0.0%) | 0 (0.0%) |
| $35,000 to $49,999 | 3 (42.9%) | 0 (0.0%) |
| $50,000 to $74,999 | 2 (28.6%) | 1 (25.0%) |
| $75,000 to $99,999 | 0 (0.0%) | 3 (75.0%) |
| $100,000 to $149,999 | 0 (0.0%) | 0 (0.0%) |
| $150,000 or more | 0 (0.0%) | 0 (0.0%) |
| Total | 7 (100.0%) | 4 (100.0%) |
Monthly Housing Cost Tiers in Chignik Lake
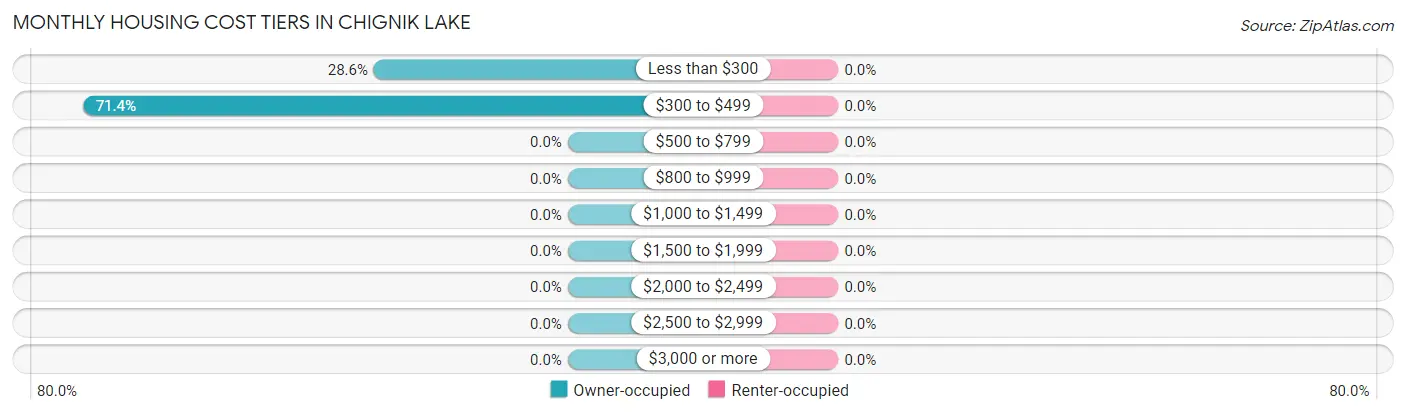
| Monthly Cost | Owner-occupied | Renter-occupied |
| Less than $300 | 2 (28.6%) | 0 (0.0%) |
| $300 to $499 | 5 (71.4%) | 0 (0.0%) |
| $500 to $799 | 0 (0.0%) | 0 (0.0%) |
| $800 to $999 | 0 (0.0%) | 0 (0.0%) |
| $1,000 to $1,499 | 0 (0.0%) | 0 (0.0%) |
| $1,500 to $1,999 | 0 (0.0%) | 0 (0.0%) |
| $2,000 to $2,499 | 0 (0.0%) | 0 (0.0%) |
| $2,500 to $2,999 | 0 (0.0%) | 0 (0.0%) |
| $3,000 or more | 0 (0.0%) | 0 (0.0%) |
| Total | 7 (100.0%) | 4 (100.0%) |
Physical Housing Characteristics in Chignik Lake
Housing Structures in Chignik Lake
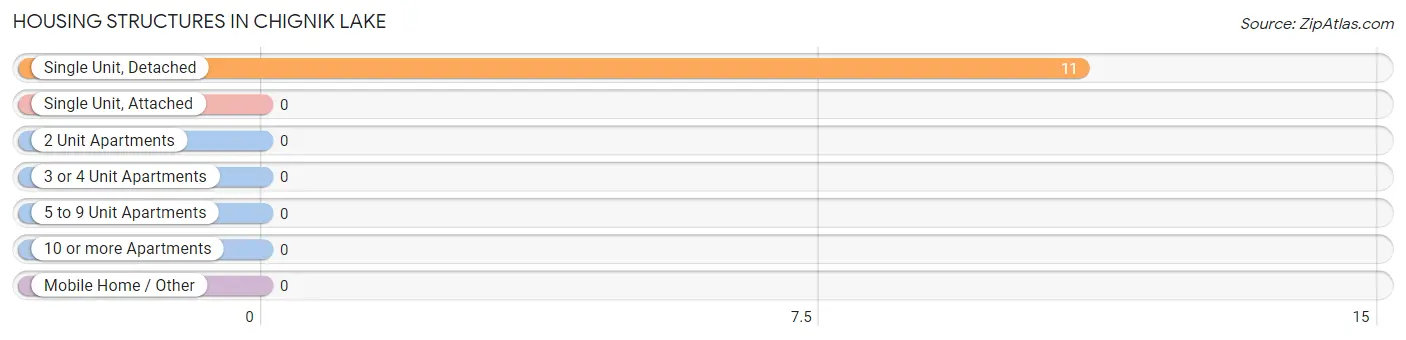
| Structure Type | # Housing Units | % Housing Units |
| Single Unit, Detached | 11 | 100.0% |
| Single Unit, Attached | 0 | 0.0% |
| 2 Unit Apartments | 0 | 0.0% |
| 3 or 4 Unit Apartments | 0 | 0.0% |
| 5 to 9 Unit Apartments | 0 | 0.0% |
| 10 or more Apartments | 0 | 0.0% |
| Mobile Home / Other | 0 | 0.0% |
| Total | 11 | 100.0% |
Housing Structures by Occupancy in Chignik Lake
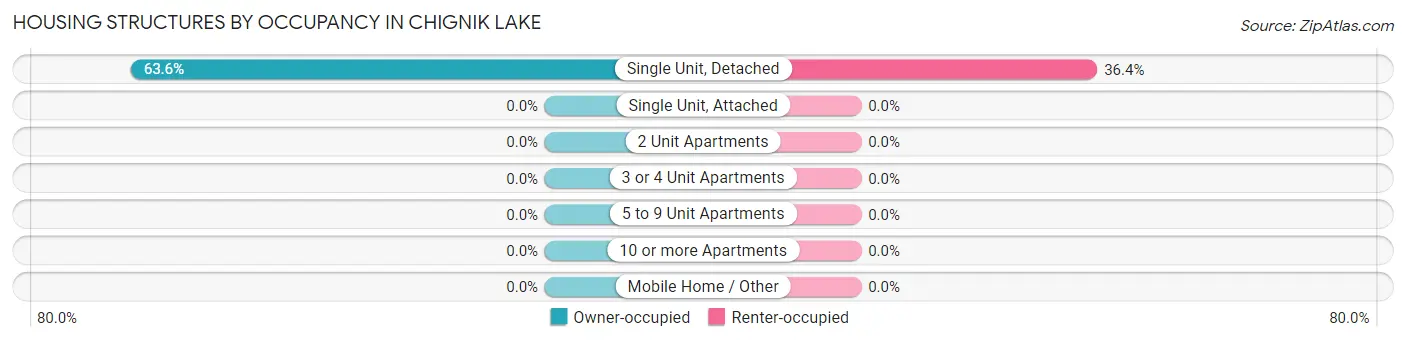
| Structure Type | Owner-occupied | Renter-occupied |
| Single Unit, Detached | 7 (63.6%) | 4 (36.4%) |
| Single Unit, Attached | 0 (0.0%) | 0 (0.0%) |
| 2 Unit Apartments | 0 (0.0%) | 0 (0.0%) |
| 3 or 4 Unit Apartments | 0 (0.0%) | 0 (0.0%) |
| 5 to 9 Unit Apartments | 0 (0.0%) | 0 (0.0%) |
| 10 or more Apartments | 0 (0.0%) | 0 (0.0%) |
| Mobile Home / Other | 0 (0.0%) | 0 (0.0%) |
| Total | 7 (63.6%) | 4 (36.4%) |
Housing Structures by Number of Rooms in Chignik Lake
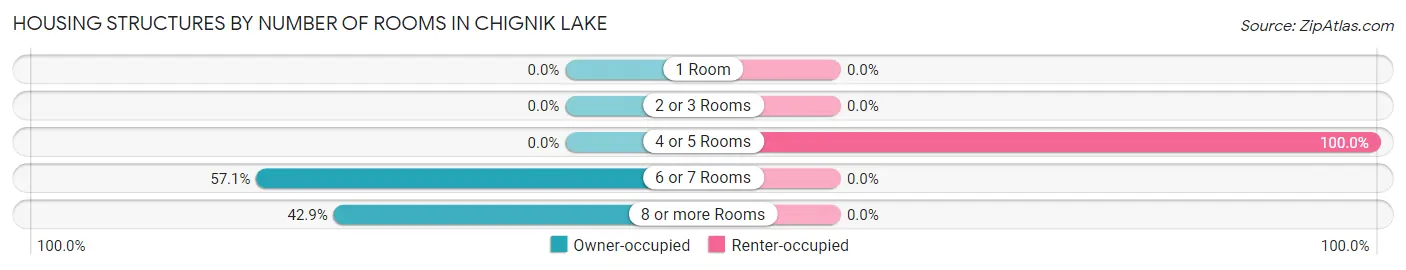
| Number of Rooms | Owner-occupied | Renter-occupied |
| 1 Room | 0 (0.0%) | 0 (0.0%) |
| 2 or 3 Rooms | 0 (0.0%) | 0 (0.0%) |
| 4 or 5 Rooms | 0 (0.0%) | 4 (100.0%) |
| 6 or 7 Rooms | 4 (57.1%) | 0 (0.0%) |
| 8 or more Rooms | 3 (42.9%) | 0 (0.0%) |
| Total | 7 (100.0%) | 4 (100.0%) |
Housing Structure by Heating Type in Chignik Lake
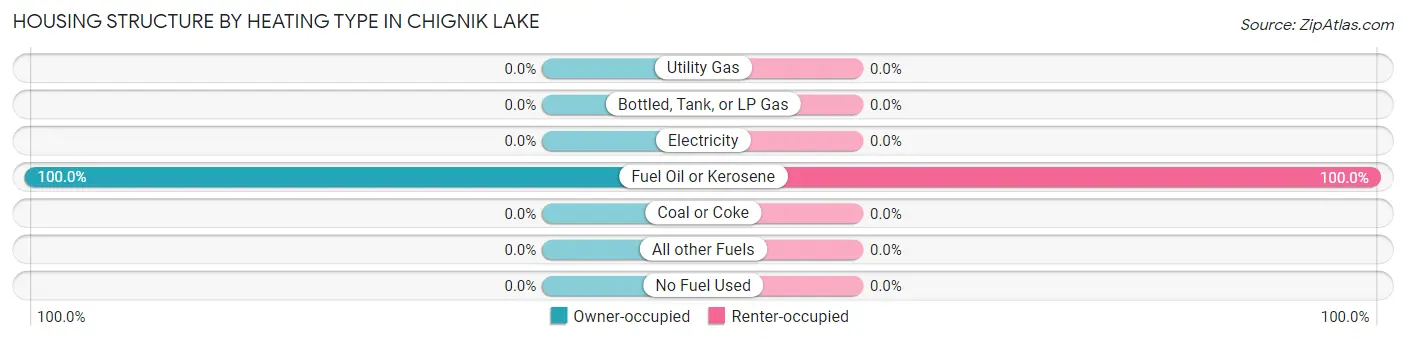
| Heating Type | Owner-occupied | Renter-occupied |
| Utility Gas | 0 (0.0%) | 0 (0.0%) |
| Bottled, Tank, or LP Gas | 0 (0.0%) | 0 (0.0%) |
| Electricity | 0 (0.0%) | 0 (0.0%) |
| Fuel Oil or Kerosene | 7 (100.0%) | 4 (100.0%) |
| Coal or Coke | 0 (0.0%) | 0 (0.0%) |
| All other Fuels | 0 (0.0%) | 0 (0.0%) |
| No Fuel Used | 0 (0.0%) | 0 (0.0%) |
| Total | 7 (100.0%) | 4 (100.0%) |
Household Vehicle Usage in Chignik Lake
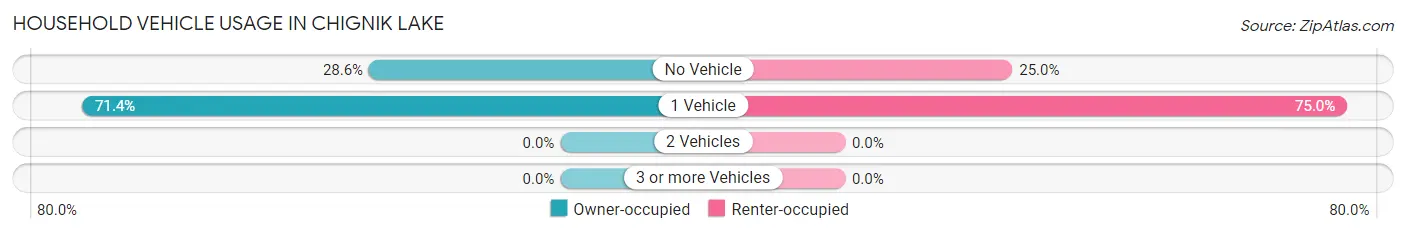
| Vehicles per Household | Owner-occupied | Renter-occupied |
| No Vehicle | 2 (28.6%) | 1 (25.0%) |
| 1 Vehicle | 5 (71.4%) | 3 (75.0%) |
| 2 Vehicles | 0 (0.0%) | 0 (0.0%) |
| 3 or more Vehicles | 0 (0.0%) | 0 (0.0%) |
| Total | 7 (100.0%) | 4 (100.0%) |
Real Estate & Mortgages in Chignik Lake
Real Estate and Mortgage Overview in Chignik Lake
| Characteristic | Without Mortgage | With Mortgage |
| Housing Units | 7 | 0 |
| Median Property Value | - | - |
| Median Household Income | $36,250 | $0 |
| Monthly Housing Costs | $430 | $0 |
| Real Estate Taxes | - | - |
Property Value by Mortgage Status in Chignik Lake
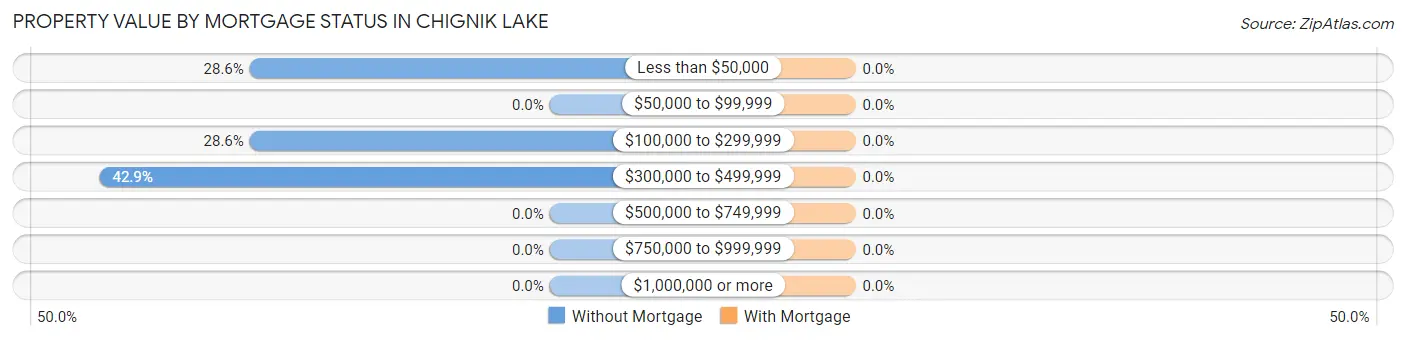
| Property Value | Without Mortgage | With Mortgage |
| Less than $50,000 | 2 (28.6%) | 0 (0.0%) |
| $50,000 to $99,999 | 0 (0.0%) | 0 (0.0%) |
| $100,000 to $299,999 | 2 (28.6%) | 0 (0.0%) |
| $300,000 to $499,999 | 3 (42.9%) | 0 (0.0%) |
| $500,000 to $749,999 | 0 (0.0%) | 0 (0.0%) |
| $750,000 to $999,999 | 0 (0.0%) | 0 (0.0%) |
| $1,000,000 or more | 0 (0.0%) | 0 (0.0%) |
| Total | 7 (100.0%) | 0 (0.0%) |
Household Income by Mortgage Status in Chignik Lake
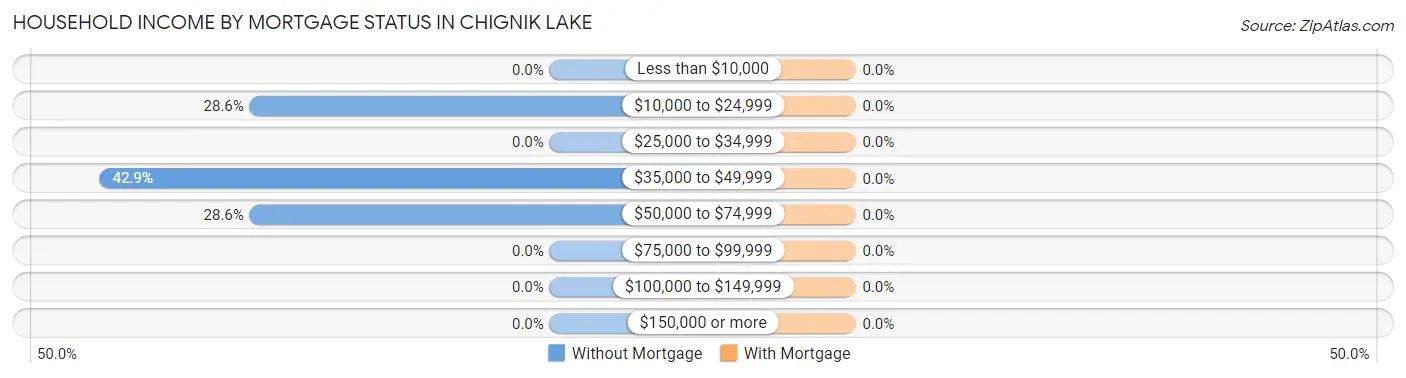
| Household Income | Without Mortgage | With Mortgage |
| Less than $10,000 | 0 (0.0%) | 0 (0.0%) |
| $10,000 to $24,999 | 2 (28.6%) | 0 (0.0%) |
| $25,000 to $34,999 | 0 (0.0%) | 0 (0.0%) |
| $35,000 to $49,999 | 3 (42.9%) | 0 (0.0%) |
| $50,000 to $74,999 | 2 (28.6%) | 0 (0.0%) |
| $75,000 to $99,999 | 0 (0.0%) | 0 (0.0%) |
| $100,000 to $149,999 | 0 (0.0%) | 0 (0.0%) |
| $150,000 or more | 0 (0.0%) | 0 (0.0%) |
| Total | 7 (100.0%) | 0 (0.0%) |
Property Value to Household Income Ratio in Chignik Lake
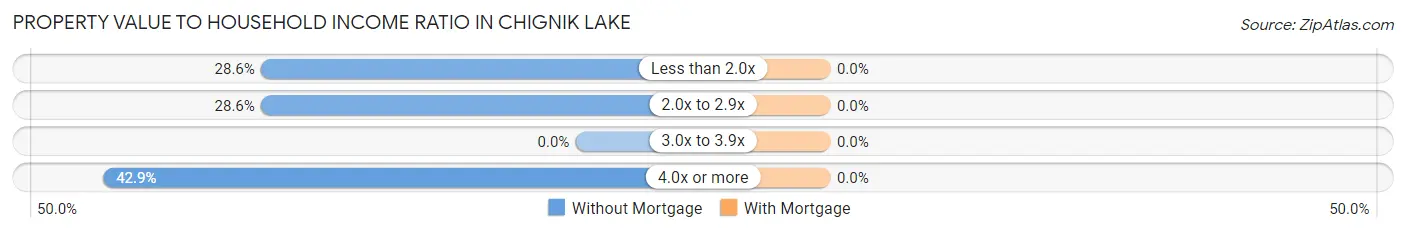
| Value-to-Income Ratio | Without Mortgage | With Mortgage |
| Less than 2.0x | 2 (28.6%) | 0 (0.0%) |
| 2.0x to 2.9x | 2 (28.6%) | 0 (0.0%) |
| 3.0x to 3.9x | 0 (0.0%) | 0 (0.0%) |
| 4.0x or more | 3 (42.9%) | 0 (0.0%) |
| Total | 7 (100.0%) | 0 (0.0%) |
Real Estate Taxes by Mortgage Status in Chignik Lake
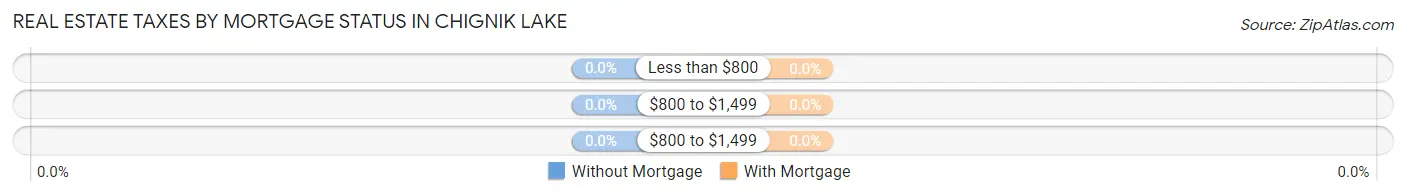
| Property Taxes | Without Mortgage | With Mortgage |
| Less than $800 | 0 (0.0%) | 0 (0.0%) |
| $800 to $1,499 | 0 (0.0%) | 0 (0.0%) |
| $800 to $1,499 | 0 (0.0%) | 0 (0.0%) |
| Total | 7 (100.0%) | 0 (0.0%) |
Health & Disability in Chignik Lake
Health Insurance Coverage by Age in Chignik Lake
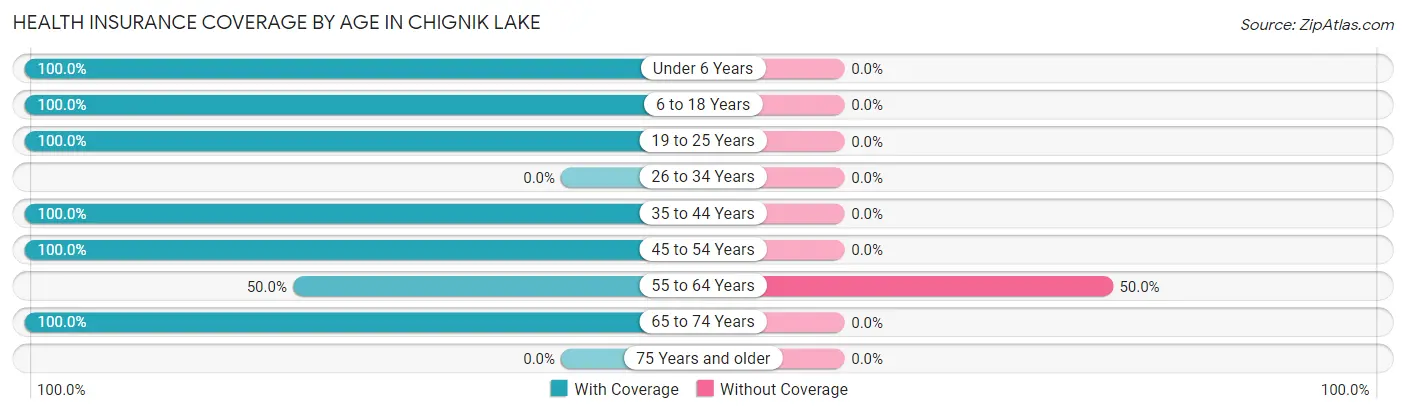
| Age Bracket | With Coverage | Without Coverage |
| Under 6 Years | 5 (100.0%) | 0 (0.0%) |
| 6 to 18 Years | 4 (100.0%) | 0 (0.0%) |
| 19 to 25 Years | 5 (100.0%) | 0 (0.0%) |
| 26 to 34 Years | 0 (0.0%) | 0 (0.0%) |
| 35 to 44 Years | 6 (100.0%) | 0 (0.0%) |
| 45 to 54 Years | 2 (100.0%) | 0 (0.0%) |
| 55 to 64 Years | 2 (50.0%) | 2 (50.0%) |
| 65 to 74 Years | 4 (100.0%) | 0 (0.0%) |
| 75 Years and older | 0 (0.0%) | 0 (0.0%) |
| Total | 28 (93.3%) | 2 (6.7%) |
Health Insurance Coverage by Citizenship Status in Chignik Lake
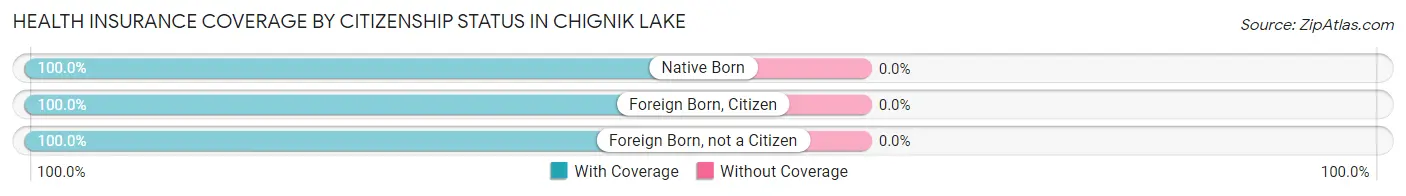
| Citizenship Status | With Coverage | Without Coverage |
| Native Born | 5 (100.0%) | 0 (0.0%) |
| Foreign Born, Citizen | 4 (100.0%) | 0 (0.0%) |
| Foreign Born, not a Citizen | 5 (100.0%) | 0 (0.0%) |
Health Insurance Coverage by Household Income in Chignik Lake
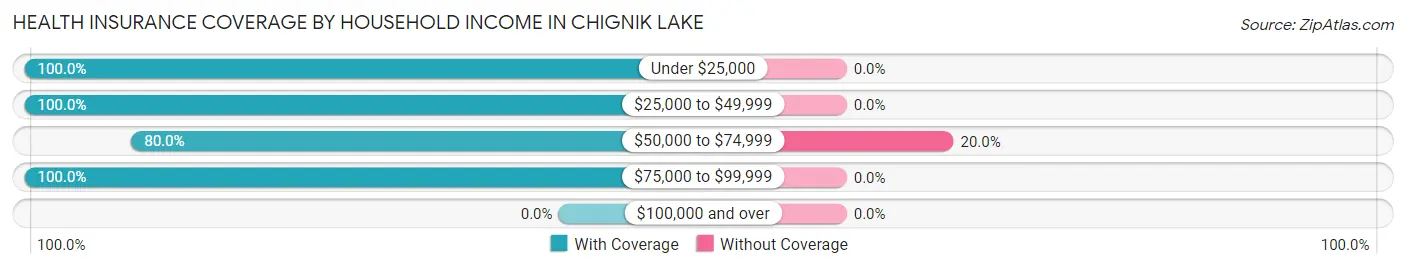
| Household Income | With Coverage | Without Coverage |
| Under $25,000 | 2 (100.0%) | 0 (0.0%) |
| $25,000 to $49,999 | 4 (100.0%) | 0 (0.0%) |
| $50,000 to $74,999 | 8 (80.0%) | 2 (20.0%) |
| $75,000 to $99,999 | 14 (100.0%) | 0 (0.0%) |
| $100,000 and over | 0 (0.0%) | 0 (0.0%) |
Public vs Private Health Insurance Coverage by Age in Chignik Lake
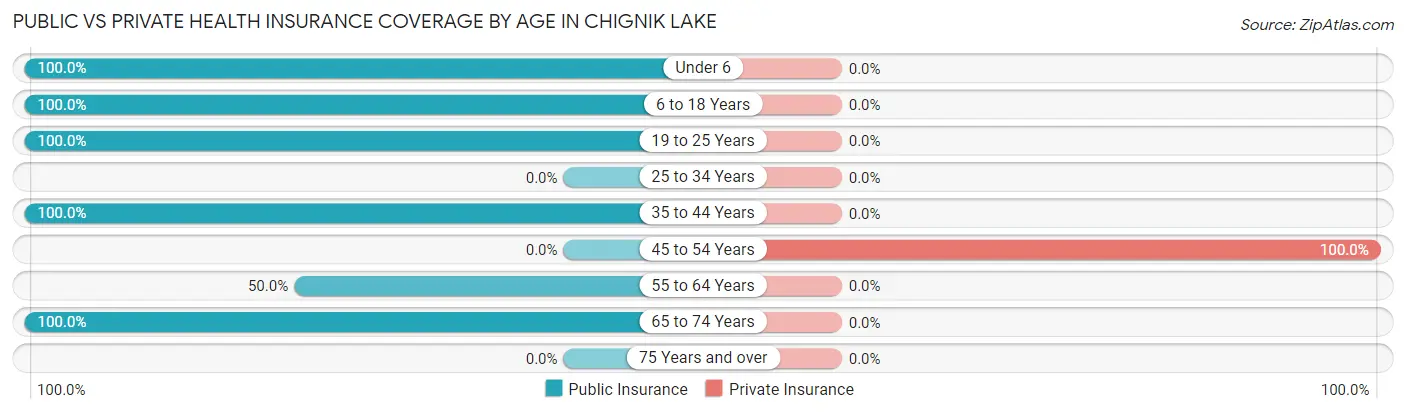
| Age Bracket | Public Insurance | Private Insurance |
| Under 6 | 5 (100.0%) | 0 (0.0%) |
| 6 to 18 Years | 4 (100.0%) | 0 (0.0%) |
| 19 to 25 Years | 5 (100.0%) | 0 (0.0%) |
| 25 to 34 Years | 0 (0.0%) | 0 (0.0%) |
| 35 to 44 Years | 6 (100.0%) | 0 (0.0%) |
| 45 to 54 Years | 0 (0.0%) | 2 (100.0%) |
| 55 to 64 Years | 2 (50.0%) | 0 (0.0%) |
| 65 to 74 Years | 4 (100.0%) | 0 (0.0%) |
| 75 Years and over | 0 (0.0%) | 0 (0.0%) |
| Total | 26 (86.7%) | 2 (6.7%) |
Disability Status by Sex by Age in Chignik Lake
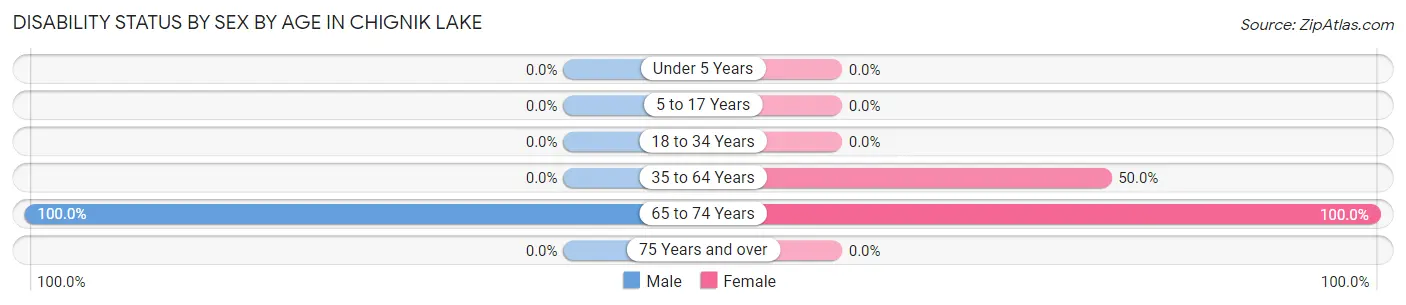
| Age Bracket | Male | Female |
| Under 5 Years | 0 (0.0%) | 0 (0.0%) |
| 5 to 17 Years | 0 (0.0%) | 0 (0.0%) |
| 18 to 34 Years | 0 (0.0%) | 0 (0.0%) |
| 35 to 64 Years | 0 (0.0%) | 4 (50.0%) |
| 65 to 74 Years | 3 (100.0%) | 1 (100.0%) |
| 75 Years and over | 0 (0.0%) | 0 (0.0%) |
Disability Class by Sex by Age in Chignik Lake
Disability Class: Hearing Difficulty
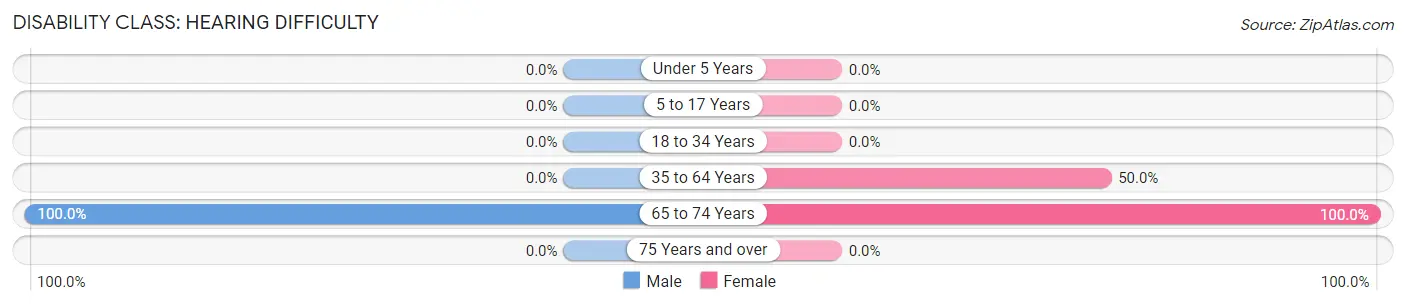
| Age Bracket | Male | Female |
| Under 5 Years | 0 (0.0%) | 0 (0.0%) |
| 5 to 17 Years | 0 (0.0%) | 0 (0.0%) |
| 18 to 34 Years | 0 (0.0%) | 0 (0.0%) |
| 35 to 64 Years | 0 (0.0%) | 4 (50.0%) |
| 65 to 74 Years | 3 (100.0%) | 1 (100.0%) |
| 75 Years and over | 0 (0.0%) | 0 (0.0%) |
Disability Class: Vision Difficulty
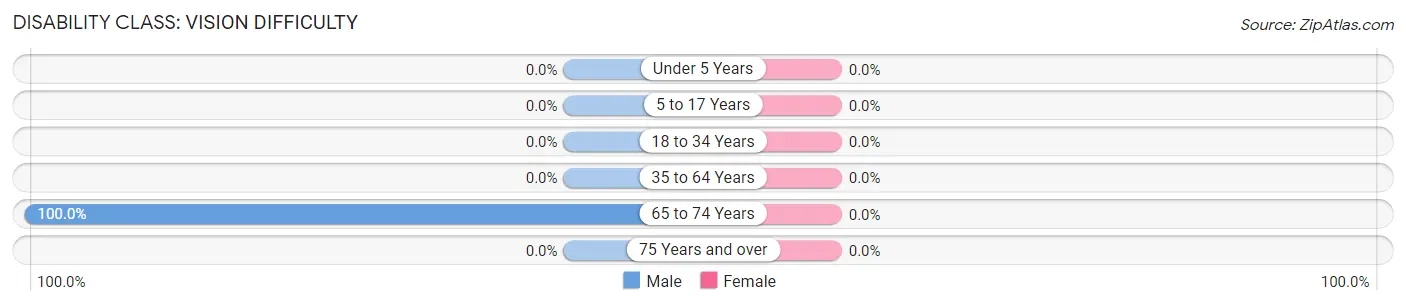
| Age Bracket | Male | Female |
| Under 5 Years | 0 (0.0%) | 0 (0.0%) |
| 5 to 17 Years | 0 (0.0%) | 0 (0.0%) |
| 18 to 34 Years | 0 (0.0%) | 0 (0.0%) |
| 35 to 64 Years | 0 (0.0%) | 0 (0.0%) |
| 65 to 74 Years | 3 (100.0%) | 0 (0.0%) |
| 75 Years and over | 0 (0.0%) | 0 (0.0%) |
Disability Class: Cognitive Difficulty

| Age Bracket | Male | Female |
| 5 to 17 Years | 0 (0.0%) | 0 (0.0%) |
| 18 to 34 Years | 0 (0.0%) | 0 (0.0%) |
| 35 to 64 Years | 0 (0.0%) | 0 (0.0%) |
| 65 to 74 Years | 0 (0.0%) | 0 (0.0%) |
| 75 Years and over | 0 (0.0%) | 0 (0.0%) |
Disability Class: Ambulatory Difficulty
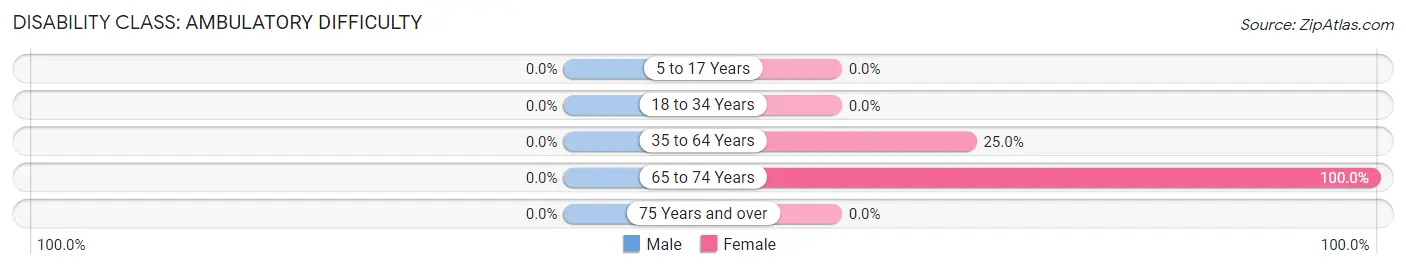
| Age Bracket | Male | Female |
| 5 to 17 Years | 0 (0.0%) | 0 (0.0%) |
| 18 to 34 Years | 0 (0.0%) | 0 (0.0%) |
| 35 to 64 Years | 0 (0.0%) | 2 (25.0%) |
| 65 to 74 Years | 0 (0.0%) | 1 (100.0%) |
| 75 Years and over | 0 (0.0%) | 0 (0.0%) |
Disability Class: Self-Care Difficulty
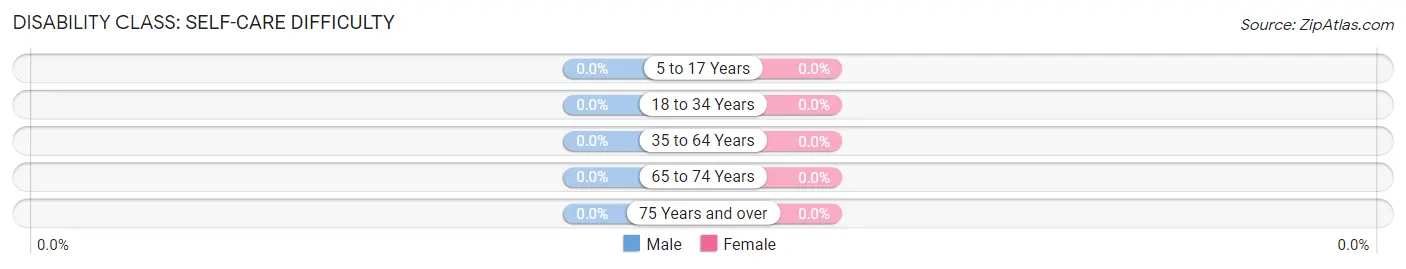
| Age Bracket | Male | Female |
| 5 to 17 Years | 0 (0.0%) | 0 (0.0%) |
| 18 to 34 Years | 0 (0.0%) | 0 (0.0%) |
| 35 to 64 Years | 0 (0.0%) | 0 (0.0%) |
| 65 to 74 Years | 0 (0.0%) | 0 (0.0%) |
| 75 Years and over | 0 (0.0%) | 0 (0.0%) |
Technology Access in Chignik Lake
Computing Device Access in Chignik Lake
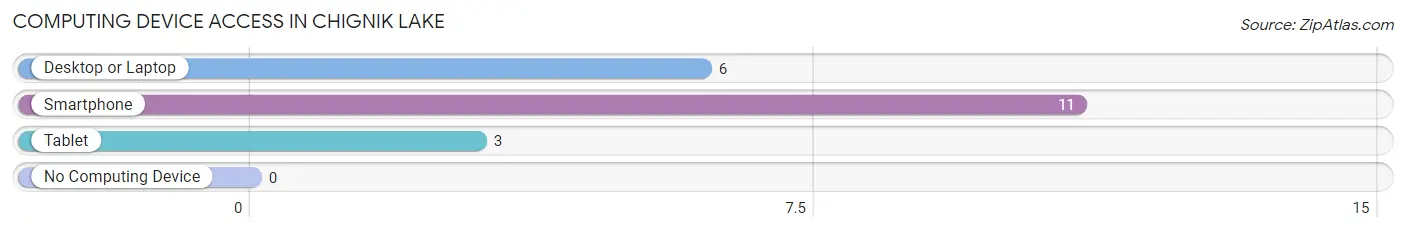
| Device Type | # Households | % Households |
| Desktop or Laptop | 6 | 54.5% |
| Smartphone | 11 | 100.0% |
| Tablet | 3 | 27.3% |
| No Computing Device | 0 | 0.0% |
| Total | 11 | 100.0% |
Internet Access in Chignik Lake

| Internet Type | # Households | % Households |
| Dial-Up Internet | 0 | 0.0% |
| Broadband Home | 7 | 63.6% |
| Cellular Data Only | 0 | 0.0% |
| Satellite Internet | 3 | 27.3% |
| No Internet | 4 | 36.4% |
| Total | 11 | 100.0% |
Chignik Lake Summary
Chignik Lake, Alaska is a small, remote village located on the Alaska Peninsula, approximately 300 miles southwest of Anchorage. It is part of the Lake and Peninsula Borough and is situated on the shore of Chignik Lake, a large, shallow lake that is fed by the Chignik River. The village is home to a small population of Yup’ik Eskimos, who have lived in the area for centuries.
Geography
Chignik Lake is located on the Alaska Peninsula, approximately 300 miles southwest of Anchorage. It is part of the Lake and Peninsula Borough and is situated on the shore of Chignik Lake, a large, shallow lake that is fed by the Chignik River. The lake is surrounded by mountains and is home to a variety of wildlife, including moose, caribou, and bears. The area is also known for its salmon runs, which attract fishermen from all over the world.
The village of Chignik Lake is located on the north shore of the lake, and is accessible by boat or plane. The village is small, with a population of approximately 200 people. The village is home to a variety of businesses, including a general store, a post office, a school, and a clinic.
History
The Yup’ik Eskimos have lived in the Chignik Lake area for centuries. The village was first established in the late 1800s, when Russian fur traders arrived in the area. The village was originally called “Chignik,” which means “big lake” in the Yup’ik language.
In the early 1900s, the village was home to a salmon cannery, which provided employment for many of the local residents. The cannery closed in the 1950s, and the village has since become a fishing and subsistence community.
Economy
The economy of Chignik Lake is largely based on fishing and subsistence activities. The village is home to a number of commercial fishing boats, which provide employment for many of the local residents. The village also has a small fish processing plant, which processes salmon and other fish for sale in local markets.
The village is also home to a number of small businesses, including a general store, a post office, a school, and a clinic. The village is also home to a number of tourist attractions, including a salmon hatchery and a fish wheel.
Demographics
As of the 2010 census, the population of Chignik Lake was 197, of which 97.5% were Native American. The median age of the population was 33.7 years, and the median household income was $31,250. The village is home to a variety of religious denominations, including Catholic, Protestant, and Orthodox.
Conclusion
Chignik Lake, Alaska is a small, remote village located on the Alaska Peninsula, approximately 300 miles southwest of Anchorage. It is part of the Lake and Peninsula Borough and is situated on the shore of Chignik Lake, a large, shallow lake that is fed by the Chignik River. The village is home to a small population of Yup’ik Eskimos, who have lived in the area for centuries. The economy of Chignik Lake is largely based on fishing and subsistence activities, and the village is home to a number of small businesses. As of the 2010 census, the population of Chignik Lake was 197, of which 97.5% were Native American.
Common Questions
What is Per Capita Income in Chignik Lake?
Per Capita income in Chignik Lake is $18,603.
What is the Median Family Income in Chignik Lake?
Median Family Income in Chignik Lake is $68,125.
What is the Median Household income in Chignik Lake?
Median Household Income in Chignik Lake is $53,750.
What is Income or Wage Gap in Chignik Lake?
Income or Wage Gap in Chignik Lake is 83.0%.
Women in Chignik Lake earn 17.0 cents for every dollar earned by a man.
What is Inequality or Gini Index in Chignik Lake?
Inequality or Gini Index in Chignik Lake is 0.22.
What is the Total Population of Chignik Lake?
Total Population of Chignik Lake is 30.
What is the Total Male Population of Chignik Lake?
Total Male Population of Chignik Lake is 17.
What is the Total Female Population of Chignik Lake?
Total Female Population of Chignik Lake is 13.
What is the Ratio of Males per 100 Females in Chignik Lake?
There are 130.77 Males per 100 Females in Chignik Lake.
What is the Ratio of Females per 100 Males in Chignik Lake?
There are 76.47 Females per 100 Males in Chignik Lake.
What is the Median Population Age in Chignik Lake?
Median Population Age in Chignik Lake is 35.3 Years.
What is the Average Family Size in Chignik Lake
Average Family Size in Chignik Lake is 3.1 People.
What is the Average Household Size in Chignik Lake
Average Household Size in Chignik Lake is 2.7 People.
How Large is the Labor Force in Chignik Lake?
There are 10 People in the Labor Forcein in Chignik Lake.
What is the Percentage of People in the Labor Force in Chignik Lake?
47.6% of People are in the Labor Force in Chignik Lake.