Fairlee, VT Map & Demographics
Fairlee Map
Fairlee Overview
$38,083
PER CAPITA INCOME
$57,625
AVG HOUSEHOLD INCOME
30.3%
WAGE / INCOME GAP [ % ]
69.7¢/ $1
WAGE / INCOME GAP [ $ ]
0.33
INEQUALITY / GINI INDEX
119
TOTAL POPULATION
66
MALE POPULATION
53
FEMALE POPULATION
124.53
MALES / 100 FEMALES
80.30
FEMALES / 100 MALES
59.5
MEDIAN AGE
2.4
AVG FAMILY SIZE
1.6
AVG HOUSEHOLD SIZE
61
LABOR FORCE [ PEOPLE ]
52.1%
PERCENT IN LABOR FORCE
4.9%
UNEMPLOYMENT RATE
Fairlee Zip Codes
Fairlee Area Codes
Income in Fairlee
Income Overview in Fairlee
| Characteristic | Number | Measure |
| Per Capita Income | 119 | $38,083 |
| Median Family Income | 21 | $0 |
| Mean Family Income | 21 | $86,310 |
| Median Household Income | 75 | $57,625 |
| Mean Household Income | 75 | $57,700 |
| Income Deficit | 21 | $0 |
| Wage / Income Gap (%) | 119 | 30.30% |
| Wage / Income Gap ($) | 119 | 69.70¢ per $1 |
| Gini / Inequality Index | 119 | 0.33 |
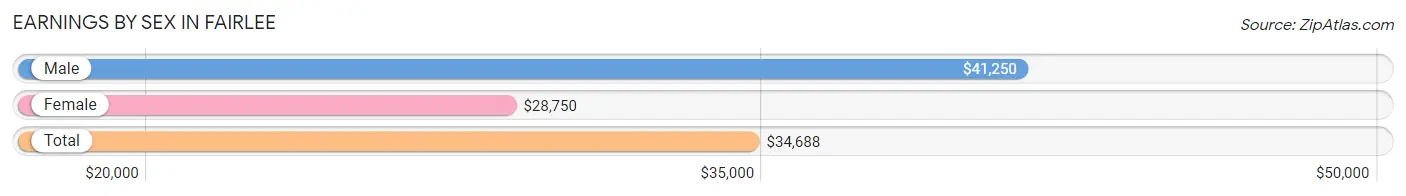
Earnings by Sex in Fairlee
Average Earnings in Fairlee are $34,688, $41,250 for men and $28,750 for women, a difference of 30.3%.
| Sex | Number | Average Earnings |
| Male | 39 (56.5%) | $41,250 |
| Female | 30 (43.5%) | $28,750 |
| Total | 69 (100.0%) | $34,688 |
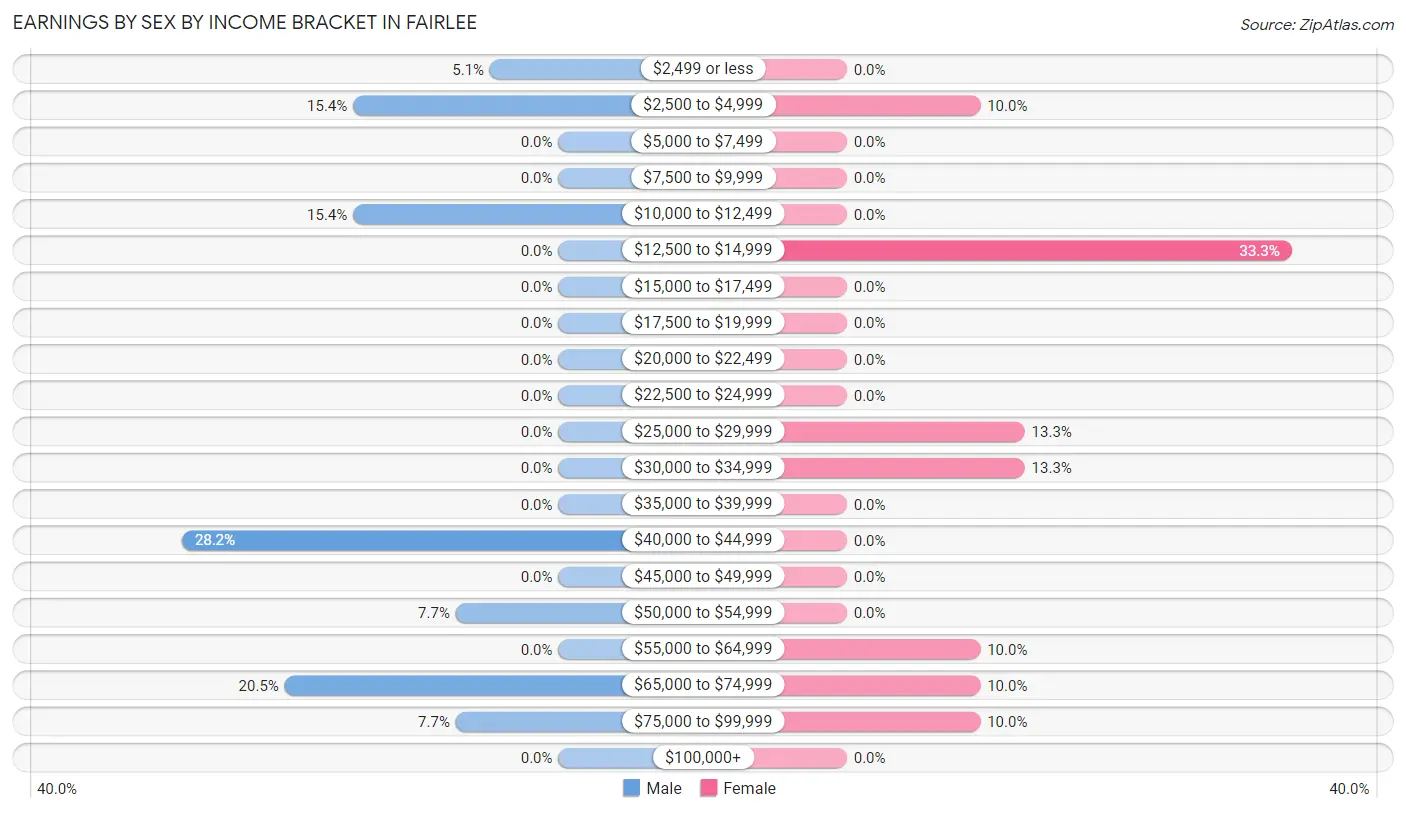
Earnings by Sex by Income Bracket in Fairlee
The most common earnings brackets in Fairlee are $40,000 to $44,999 for men (11 | 28.2%) and $12,500 to $14,999 for women (10 | 33.3%).
| Income | Male | Female |
| $2,499 or less | 2 (5.1%) | 0 (0.0%) |
| $2,500 to $4,999 | 6 (15.4%) | 3 (10.0%) |
| $5,000 to $7,499 | 0 (0.0%) | 0 (0.0%) |
| $7,500 to $9,999 | 0 (0.0%) | 0 (0.0%) |
| $10,000 to $12,499 | 6 (15.4%) | 0 (0.0%) |
| $12,500 to $14,999 | 0 (0.0%) | 10 (33.3%) |
| $15,000 to $17,499 | 0 (0.0%) | 0 (0.0%) |
| $17,500 to $19,999 | 0 (0.0%) | 0 (0.0%) |
| $20,000 to $22,499 | 0 (0.0%) | 0 (0.0%) |
| $22,500 to $24,999 | 0 (0.0%) | 0 (0.0%) |
| $25,000 to $29,999 | 0 (0.0%) | 4 (13.3%) |
| $30,000 to $34,999 | 0 (0.0%) | 4 (13.3%) |
| $35,000 to $39,999 | 0 (0.0%) | 0 (0.0%) |
| $40,000 to $44,999 | 11 (28.2%) | 0 (0.0%) |
| $45,000 to $49,999 | 0 (0.0%) | 0 (0.0%) |
| $50,000 to $54,999 | 3 (7.7%) | 0 (0.0%) |
| $55,000 to $64,999 | 0 (0.0%) | 3 (10.0%) |
| $65,000 to $74,999 | 8 (20.5%) | 3 (10.0%) |
| $75,000 to $99,999 | 3 (7.7%) | 3 (10.0%) |
| $100,000+ | 0 (0.0%) | 0 (0.0%) |
| Total | 39 (100.0%) | 30 (100.0%) |
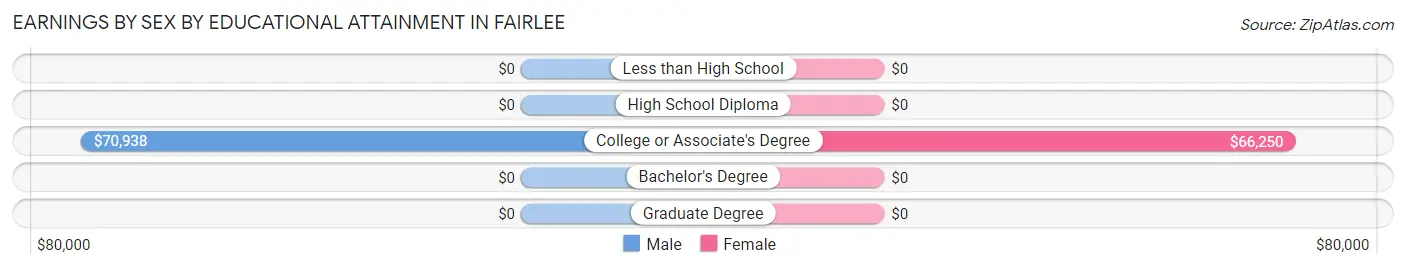
Earnings by Sex by Educational Attainment in Fairlee
| Educational Attainment | Male Income | Female Income |
| Less than High School | - | - |
| High School Diploma | - | - |
| College or Associate's Degree | $70,938 | $66,250 |
| Bachelor's Degree | - | - |
| Graduate Degree | - | - |
| Total | $41,477 | $0 |
Family Income in Fairlee
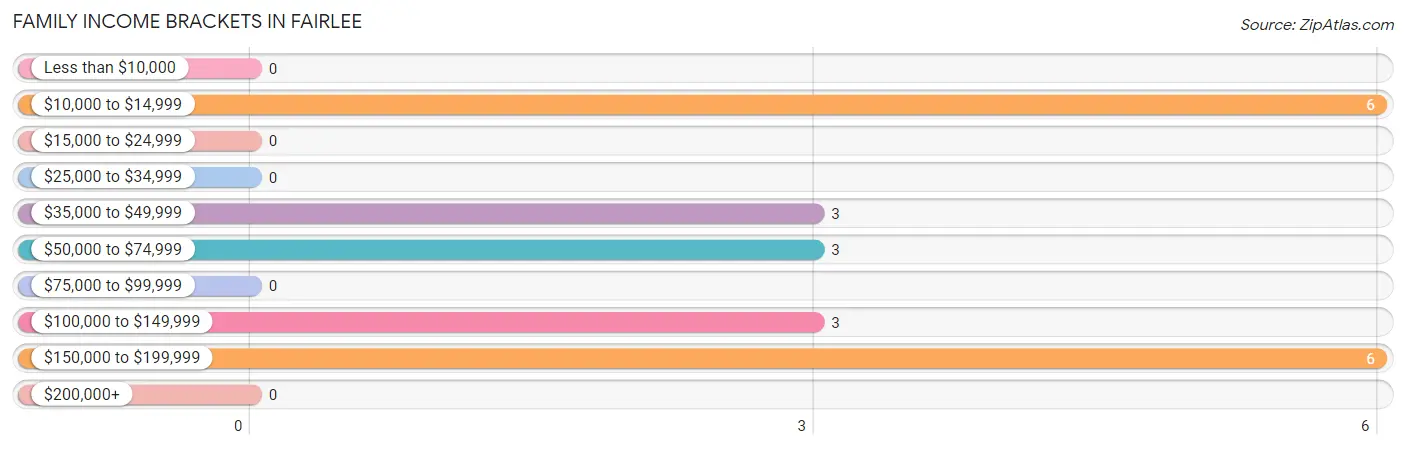
Family Income Brackets in Fairlee
According to the Fairlee family income data, there are 6 families falling into the $10,000 to $14,999 income range, which is the most common income bracket and makes up 28.6% of all families.
| Income Bracket | # Families | % Families |
| Less than $10,000 | 0 | 0.0% |
| $10,000 to $14,999 | 6 | 28.6% |
| $15,000 to $24,999 | 0 | 0.0% |
| $25,000 to $34,999 | 0 | 0.0% |
| $35,000 to $49,999 | 3 | 14.3% |
| $50,000 to $74,999 | 3 | 14.3% |
| $75,000 to $99,999 | 0 | 0.0% |
| $100,000 to $149,999 | 3 | 14.3% |
| $150,000 to $199,999 | 6 | 28.6% |
| $200,000+ | 0 | 0.0% |
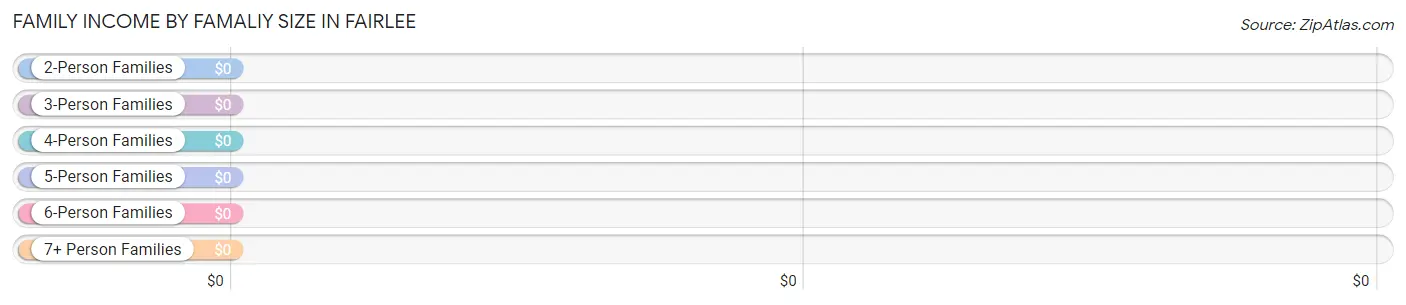
Family Income by Famaliy Size in Fairlee
| Income Bracket | # Families | Median Income |
| 2-Person Families | 15 (71.4%) | $0 |
| 3-Person Families | 3 (14.3%) | $0 |
| 4-Person Families | 3 (14.3%) | $0 |
| 5-Person Families | 0 (0.0%) | $0 |
| 6-Person Families | 0 (0.0%) | $0 |
| 7+ Person Families | 0 (0.0%) | $0 |
| Total | 21 (100.0%) | $0 |
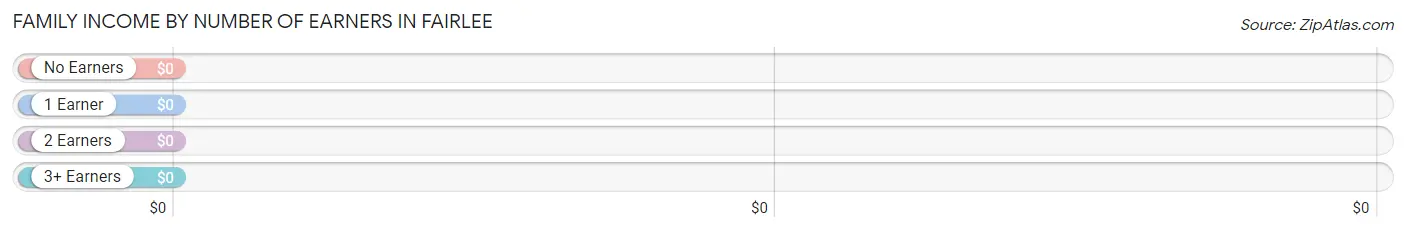
Family Income by Number of Earners in Fairlee
| Number of Earners | # Families | Median Income |
| No Earners | 3 (14.3%) | $0 |
| 1 Earner | 9 (42.9%) | $0 |
| 2 Earners | 3 (14.3%) | $0 |
| 3+ Earners | 6 (28.6%) | $0 |
| Total | 21 (100.0%) | $0 |
Household Income in Fairlee
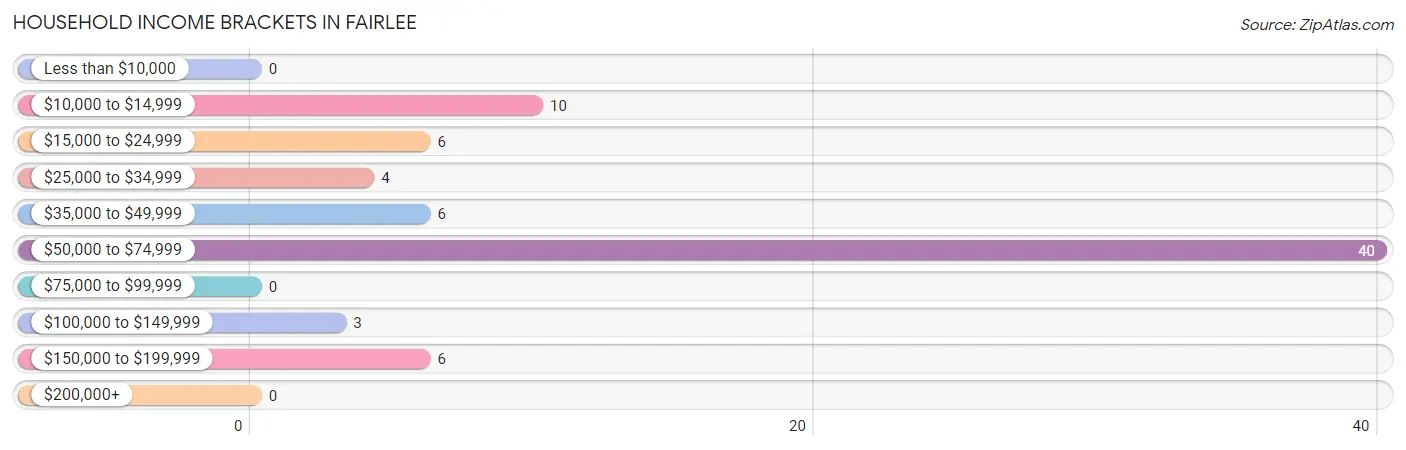
Household Income Brackets in Fairlee
With 40 households falling in the category, the $50,000 to $74,999 income range is the most frequent in Fairlee, accounting for 53.3% of all households.
| Income Bracket | # Households | % Households |
| Less than $10,000 | 0 | 0.0% |
| $10,000 to $14,999 | 10 | 13.3% |
| $15,000 to $24,999 | 6 | 8.0% |
| $25,000 to $34,999 | 4 | 5.3% |
| $35,000 to $49,999 | 6 | 8.0% |
| $50,000 to $74,999 | 40 | 53.3% |
| $75,000 to $99,999 | 0 | 0.0% |
| $100,000 to $149,999 | 3 | 4.0% |
| $150,000 to $199,999 | 6 | 8.0% |
| $200,000+ | 0 | 0.0% |
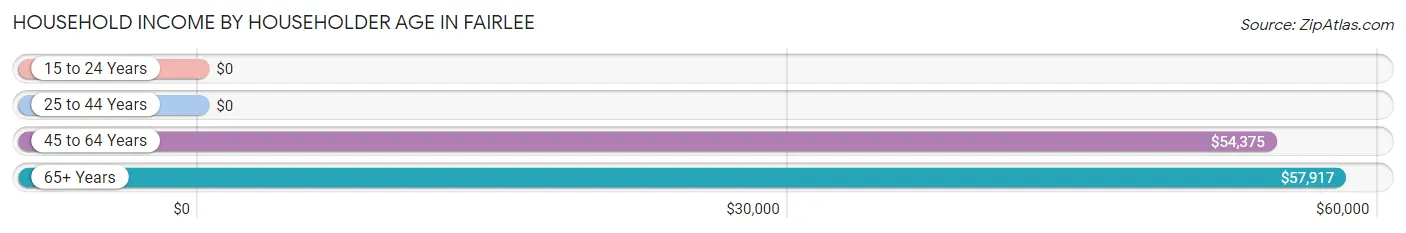
Household Income by Householder Age in Fairlee
The median household income in Fairlee is $57,625, with the highest median household income of $57,917 found in the 65+ years age bracket for the primary householder. A total of 40 households (53.3%) fall into this category.
| Income Bracket | # Households | Median Income |
| 15 to 24 Years | 0 (0.0%) | $0 |
| 25 to 44 Years | 0 (0.0%) | $0 |
| 45 to 64 Years | 35 (46.7%) | $54,375 |
| 65+ Years | 40 (53.3%) | $57,917 |
| Total | 75 (100.0%) | $57,625 |
Poverty in Fairlee
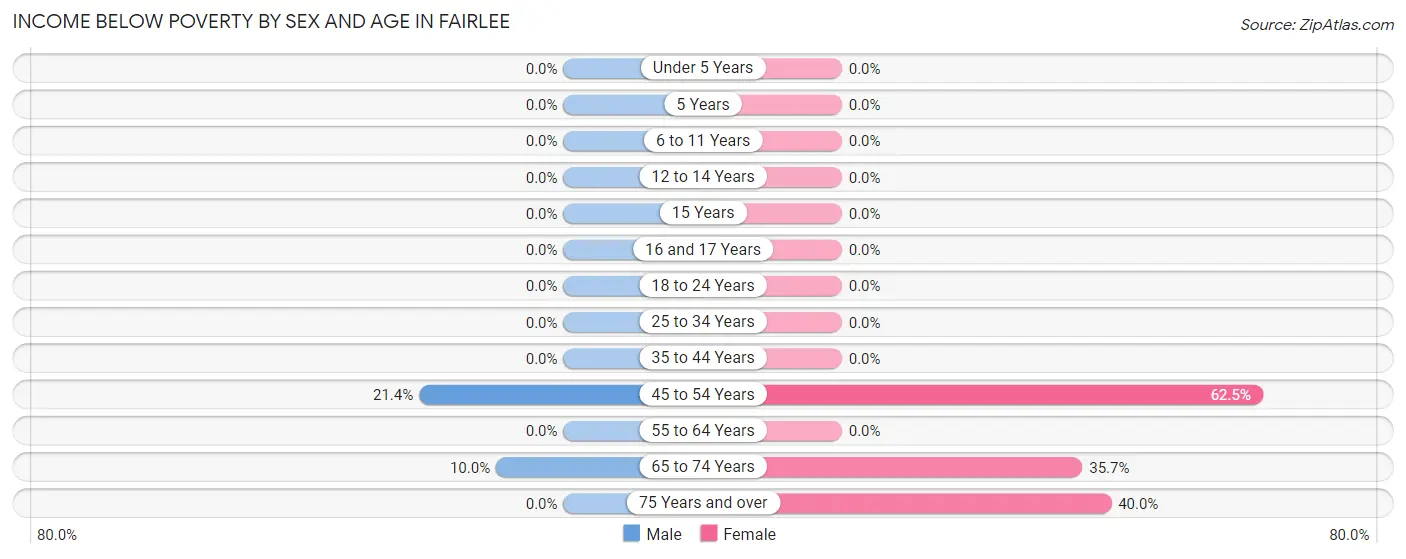
Income Below Poverty by Sex and Age in Fairlee
With 13.6% poverty level for males and 35.8% for females among the residents of Fairlee, 45 to 54 year old males and 45 to 54 year old females are the most vulnerable to poverty, with 6 males (21.4%) and 10 females (62.5%) in their respective age groups living below the poverty level.
| Age Bracket | Male | Female |
| Under 5 Years | 0 (0.0%) | 0 (0.0%) |
| 5 Years | 0 (0.0%) | 0 (0.0%) |
| 6 to 11 Years | 0 (0.0%) | 0 (0.0%) |
| 12 to 14 Years | 0 (0.0%) | 0 (0.0%) |
| 15 Years | 0 (0.0%) | 0 (0.0%) |
| 16 and 17 Years | 0 (0.0%) | 0 (0.0%) |
| 18 to 24 Years | 0 (0.0%) | 0 (0.0%) |
| 25 to 34 Years | 0 (0.0%) | 0 (0.0%) |
| 35 to 44 Years | 0 (0.0%) | 0 (0.0%) |
| 45 to 54 Years | 6 (21.4%) | 10 (62.5%) |
| 55 to 64 Years | 0 (0.0%) | 0 (0.0%) |
| 65 to 74 Years | 3 (10.0%) | 5 (35.7%) |
| 75 Years and over | 0 (0.0%) | 4 (40.0%) |
| Total | 9 (13.6%) | 19 (35.8%) |
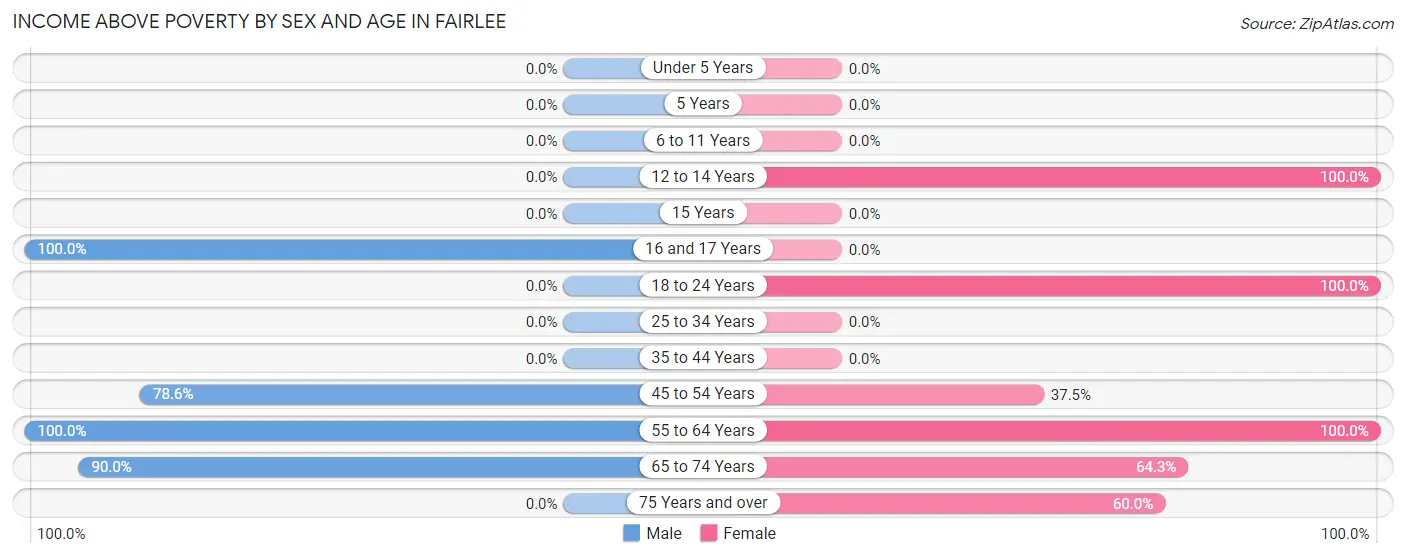
Income Above Poverty by Sex and Age in Fairlee
According to the poverty statistics in Fairlee, males aged 16 and 17 years and females aged 12 to 14 years are the age groups that are most secure financially, with 100.0% of males and 100.0% of females in these age groups living above the poverty line.
| Age Bracket | Male | Female |
| Under 5 Years | 0 (0.0%) | 0 (0.0%) |
| 5 Years | 0 (0.0%) | 0 (0.0%) |
| 6 to 11 Years | 0 (0.0%) | 0 (0.0%) |
| 12 to 14 Years | 0 (0.0%) | 2 (100.0%) |
| 15 Years | 0 (0.0%) | 0 (0.0%) |
| 16 and 17 Years | 2 (100.0%) | 0 (0.0%) |
| 18 to 24 Years | 0 (0.0%) | 4 (100.0%) |
| 25 to 34 Years | 0 (0.0%) | 0 (0.0%) |
| 35 to 44 Years | 0 (0.0%) | 0 (0.0%) |
| 45 to 54 Years | 22 (78.6%) | 6 (37.5%) |
| 55 to 64 Years | 6 (100.0%) | 7 (100.0%) |
| 65 to 74 Years | 27 (90.0%) | 9 (64.3%) |
| 75 Years and over | 0 (0.0%) | 6 (60.0%) |
| Total | 57 (86.4%) | 34 (64.1%) |
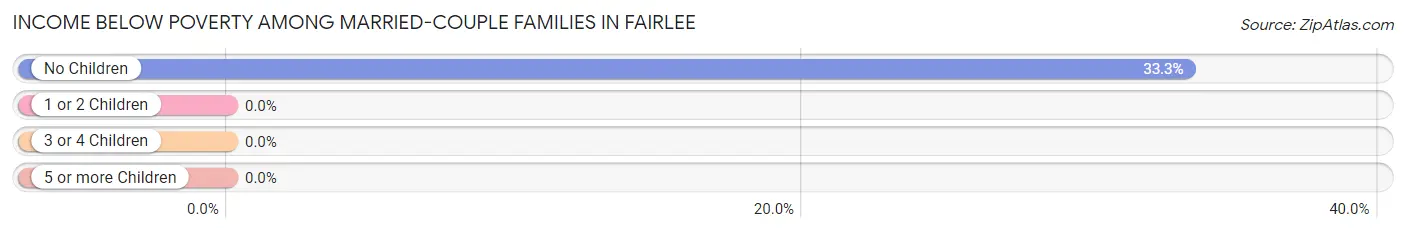
Income Below Poverty Among Married-Couple Families in Fairlee
The poverty statistics for married-couple families in Fairlee show that 28.6% or 6 of the total 21 families live below the poverty line. Families with no children have the highest poverty rate of 33.3%, comprising of 6 families. On the other hand, families with 1 or 2 children have the lowest poverty rate of 0.0%, which includes 0 families.
| Children | Above Poverty | Below Poverty |
| No Children | 12 (66.7%) | 6 (33.3%) |
| 1 or 2 Children | 3 (100.0%) | 0 (0.0%) |
| 3 or 4 Children | 0 (0.0%) | 0 (0.0%) |
| 5 or more Children | 0 (0.0%) | 0 (0.0%) |
| Total | 15 (71.4%) | 6 (28.6%) |
Income Below Poverty Among Single-Parent Households in Fairlee
| Children | Single Father | Single Mother |
| No Children | 0 (0.0%) | 0 (0.0%) |
| 1 or 2 Children | 0 (0.0%) | 0 (0.0%) |
| 3 or 4 Children | 0 (0.0%) | 0 (0.0%) |
| 5 or more Children | 0 (0.0%) | 0 (0.0%) |
| Total | 0 (0.0%) | 0 (0.0%) |
Income Below Poverty Among Married-Couple vs Single-Parent Households in Fairlee
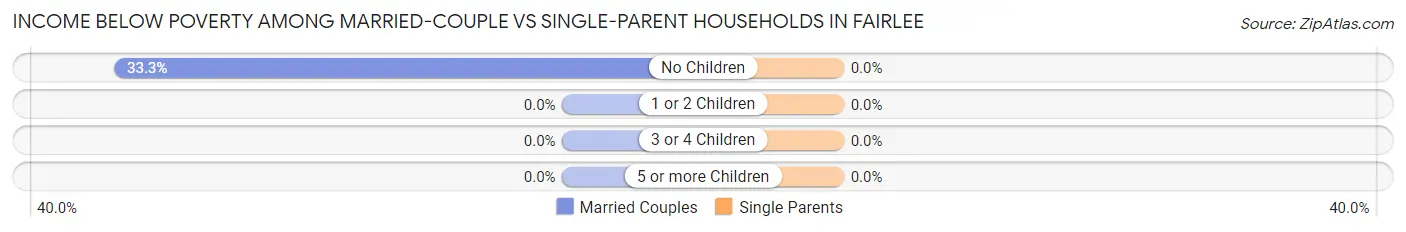
| Children | Married-Couple Families | Single-Parent Households |
| No Children | 6 (33.3%) | 0 (0.0%) |
| 1 or 2 Children | 0 (0.0%) | 0 (0.0%) |
| 3 or 4 Children | 0 (0.0%) | 0 (0.0%) |
| 5 or more Children | 0 (0.0%) | 0 (0.0%) |
| Total | 6 (28.6%) | 0 (0.0%) |
Race in Fairlee
The most populous races in Fairlee are White / Caucasian (115 | 96.6%), and Some other Race (4 | 3.4%).
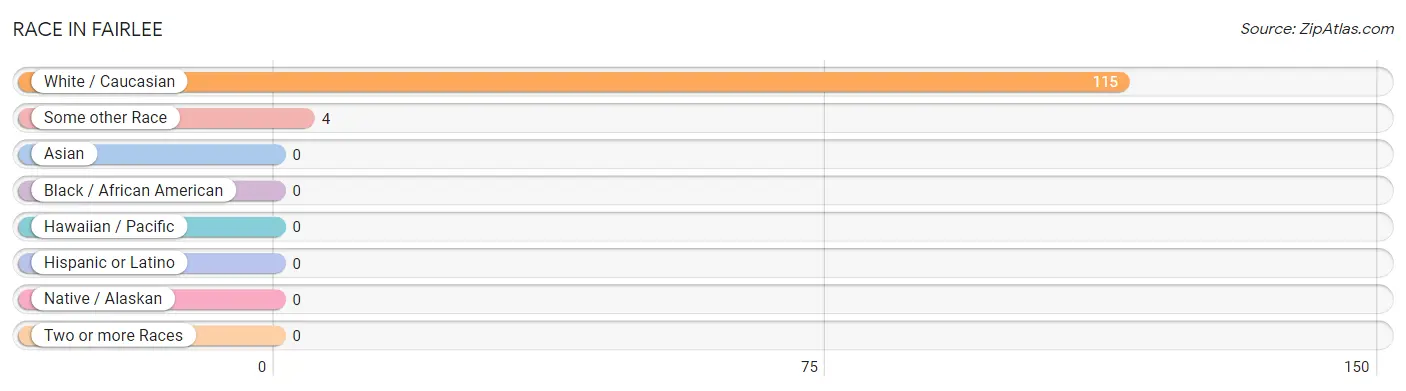
| Race | # Population | % Population |
| Asian | 0 | 0.0% |
| Black / African American | 0 | 0.0% |
| Hawaiian / Pacific | 0 | 0.0% |
| Hispanic or Latino | 0 | 0.0% |
| Native / Alaskan | 0 | 0.0% |
| White / Caucasian | 115 | 96.6% |
| Two or more Races | 0 | 0.0% |
| Some other Race | 4 | 3.4% |
| Total | 119 | 100.0% |
Ancestry in Fairlee
The most populous ancestries reported in Fairlee are American (31 | 26.1%), English (15 | 12.6%), French Canadian (6 | 5.0%), Scottish (6 | 5.0%), and Polish (4 | 3.4%), together accounting for 52.1% of all Fairlee residents.
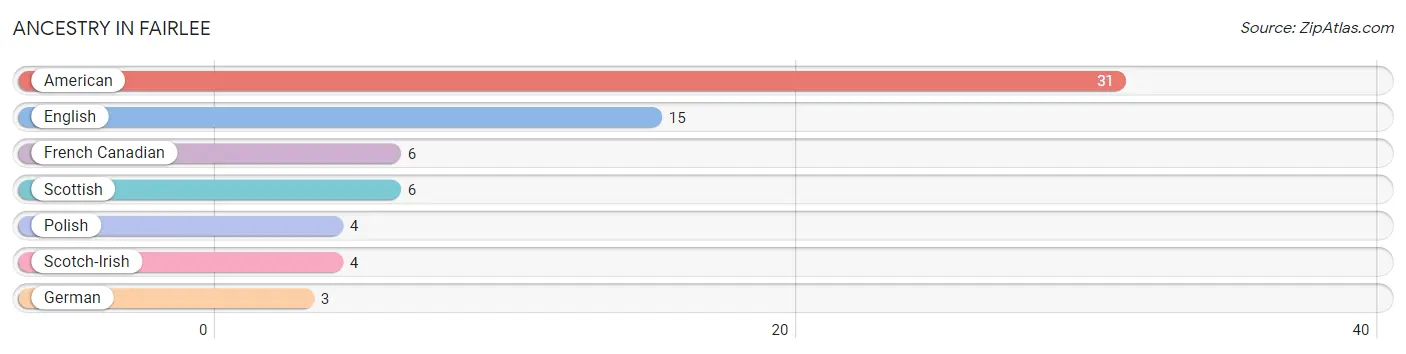
| Ancestry | # Population | % Population |
| American | 31 | 26.1% |
| English | 15 | 12.6% |
| French Canadian | 6 | 5.0% |
| German | 3 | 2.5% |
| Polish | 4 | 3.4% |
| Scotch-Irish | 4 | 3.4% |
| Scottish | 6 | 5.0% | View All 7 Rows |
Immigrants in Fairlee
The most numerous immigrant groups reported in Fairlee came from , and Canada (7 | 5.9%), together accounting for 5.9% of all Fairlee residents.

| Immigration Origin | # Population | % Population |
| Canada | 7 | 5.9% | View All 1 Rows |
Sex and Age in Fairlee
Sex and Age in Fairlee
The most populous age groups in Fairlee are 70 to 74 Years (27 | 40.9%) for men and 45 to 49 Years (16 | 30.2%) for women.
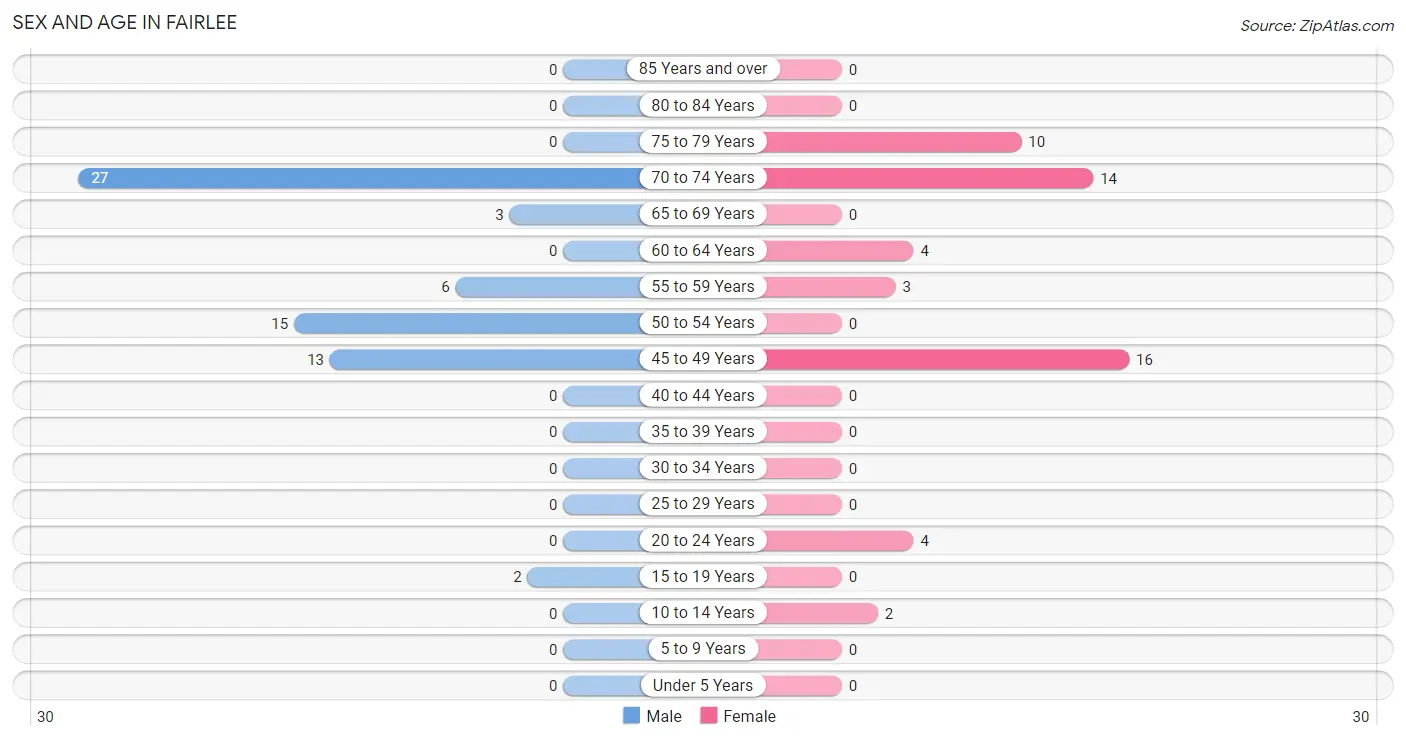
| Age Bracket | Male | Female |
| Under 5 Years | 0 (0.0%) | 0 (0.0%) |
| 5 to 9 Years | 0 (0.0%) | 0 (0.0%) |
| 10 to 14 Years | 0 (0.0%) | 2 (3.8%) |
| 15 to 19 Years | 2 (3.0%) | 0 (0.0%) |
| 20 to 24 Years | 0 (0.0%) | 4 (7.5%) |
| 25 to 29 Years | 0 (0.0%) | 0 (0.0%) |
| 30 to 34 Years | 0 (0.0%) | 0 (0.0%) |
| 35 to 39 Years | 0 (0.0%) | 0 (0.0%) |
| 40 to 44 Years | 0 (0.0%) | 0 (0.0%) |
| 45 to 49 Years | 13 (19.7%) | 16 (30.2%) |
| 50 to 54 Years | 15 (22.7%) | 0 (0.0%) |
| 55 to 59 Years | 6 (9.1%) | 3 (5.7%) |
| 60 to 64 Years | 0 (0.0%) | 4 (7.5%) |
| 65 to 69 Years | 3 (4.5%) | 0 (0.0%) |
| 70 to 74 Years | 27 (40.9%) | 14 (26.4%) |
| 75 to 79 Years | 0 (0.0%) | 10 (18.9%) |
| 80 to 84 Years | 0 (0.0%) | 0 (0.0%) |
| 85 Years and over | 0 (0.0%) | 0 (0.0%) |
| Total | 66 (100.0%) | 53 (100.0%) |
Families and Households in Fairlee
Median Family Size in Fairlee
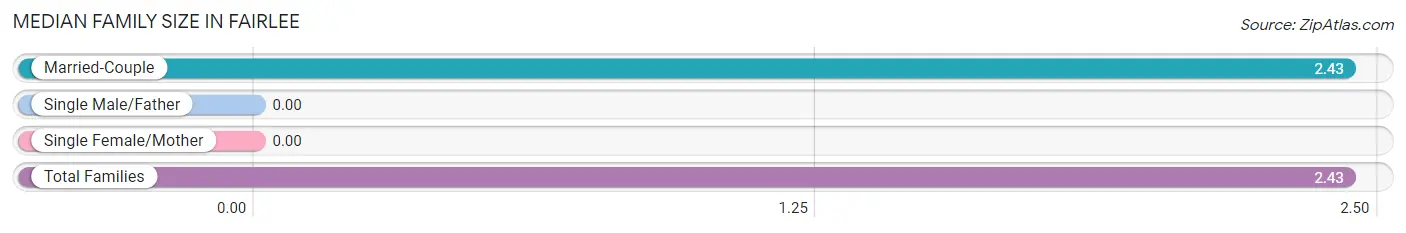
| Family Type | # Families | Family Size |
| Married-Couple | 21 (100.0%) | 2.43 |
| Single Male/Father | 0 (0.0%) | - |
| Single Female/Mother | 0 (0.0%) | - |
| Total Families | 21 (100.0%) | 2.43 |
Median Household Size in Fairlee
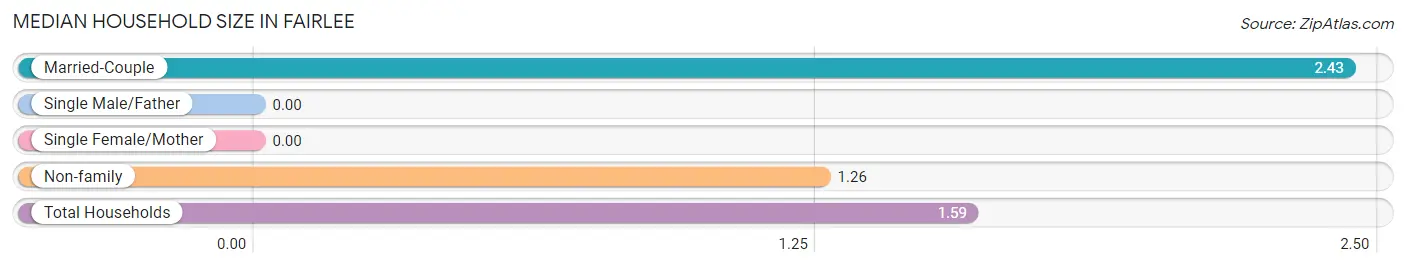
| Household Type | # Households | Household Size |
| Married-Couple | 21 (28.0%) | 2.43 |
| Single Male/Father | 0 (0.0%) | - |
| Single Female/Mother | 0 (0.0%) | - |
| Non-family | 54 (72.0%) | 1.26 |
| Total Households | 75 (100.0%) | 1.59 |
Household Size by Marriage Status in Fairlee
Out of a total of 75 households in Fairlee, 21 (28.0%) are family households, while 54 (72.0%) are nonfamily households. The most numerous type of family households are 2-person households, comprising 15, and the most common type of nonfamily households are 1-person households, comprising 41.
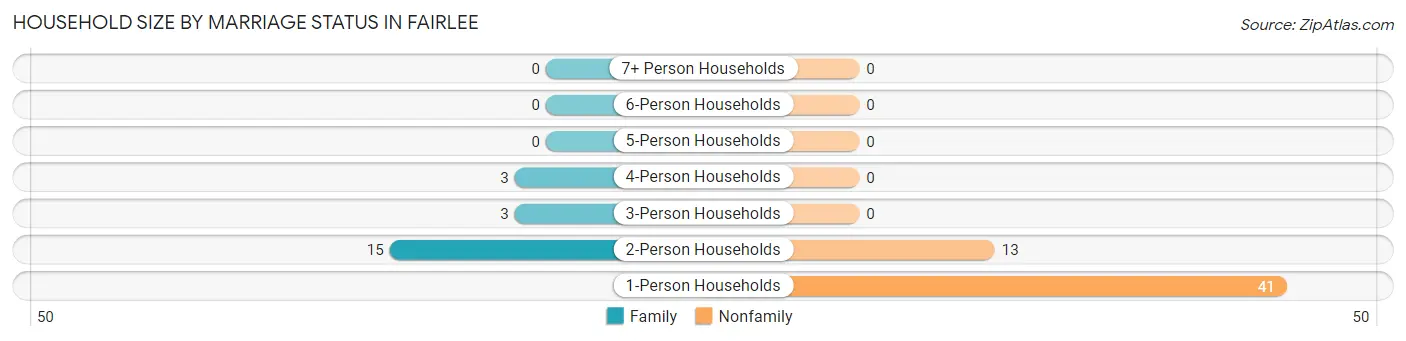
| Household Size | Family Households | Nonfamily Households |
| 1-Person Households | - | 41 (54.7%) |
| 2-Person Households | 15 (20.0%) | 13 (17.3%) |
| 3-Person Households | 3 (4.0%) | 0 (0.0%) |
| 4-Person Households | 3 (4.0%) | 0 (0.0%) |
| 5-Person Households | 0 (0.0%) | 0 (0.0%) |
| 6-Person Households | 0 (0.0%) | 0 (0.0%) |
| 7+ Person Households | 0 (0.0%) | 0 (0.0%) |
| Total | 21 (28.0%) | 54 (72.0%) |
Female Fertility in Fairlee
Fertility by Age in Fairlee
| Age Bracket | Women with Births | Births / 1,000 Women |
| 15 to 19 years | 0 (0.0%) | 0.0 |
| 20 to 34 years | 0 (0.0%) | 0.0 |
| 35 to 50 years | 0 (0.0%) | 0.0 |
| Total | 0 (0.0%) | 0.0 |
Fertility by Age by Marriage Status in Fairlee
| Age Bracket | Married | Unmarried |
| 15 to 19 years | 0 (0.0%) | 0 (0.0%) |
| 20 to 34 years | 0 (0.0%) | 0 (0.0%) |
| 35 to 50 years | 0 (0.0%) | 0 (0.0%) |
| Total | 0 (0.0%) | 0 (0.0%) |
Fertility by Education in Fairlee
| Educational Attainment | Women with Births | Births / 1,000 Women |
| Less than High School | 0 (0.0%) | 0.0 |
| High School Diploma | 0 (0.0%) | 0.0 |
| College or Associate's Degree | 0 (0.0%) | 0.0 |
| Bachelor's Degree | 0 (0.0%) | 0.0 |
| Graduate Degree | 0 (0.0%) | 0.0 |
| Total | 0 (0.0%) | 0.0 |
Fertility by Education by Marriage Status in Fairlee
| Educational Attainment | Married | Unmarried |
| Less than High School | 0 (0.0%) | 0 (0.0%) |
| High School Diploma | 0 (0.0%) | 0 (0.0%) |
| College or Associate's Degree | 0 (0.0%) | 0 (0.0%) |
| Bachelor's Degree | 0 (0.0%) | 0 (0.0%) |
| Graduate Degree | 0 (0.0%) | 0 (0.0%) |
| Total | 0 (0.0%) | 0 (0.0%) |
Employment Characteristics in Fairlee
Employment by Class of Employer in Fairlee
Among the 58 employed individuals in Fairlee, not-for-profit organizations (24 | 41.4%), private company employees (22 | 37.9%), and state government employees (6 | 10.3%) make up the most common classes of employment.
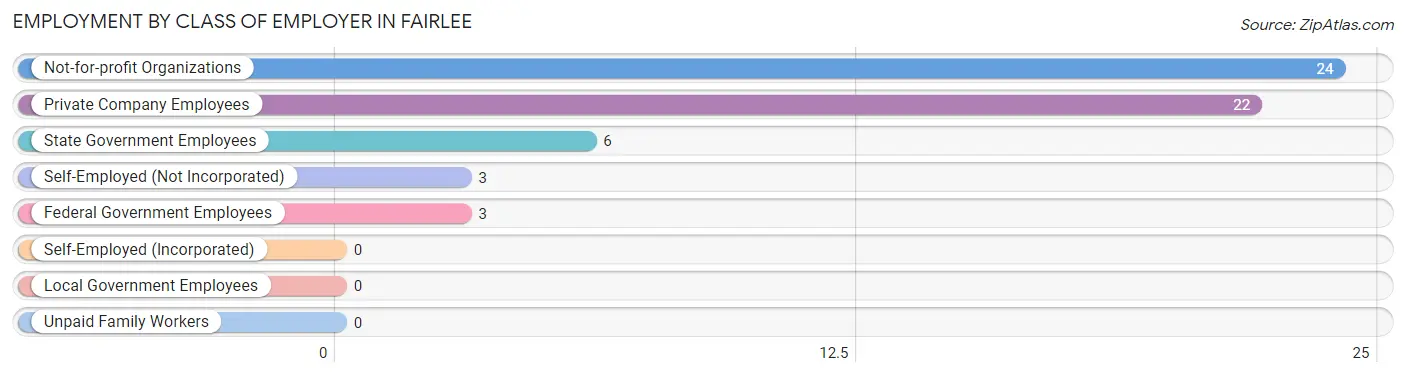
| Employer Class | # Employees | % Employees |
| Private Company Employees | 22 | 37.9% |
| Self-Employed (Incorporated) | 0 | 0.0% |
| Self-Employed (Not Incorporated) | 3 | 5.2% |
| Not-for-profit Organizations | 24 | 41.4% |
| Local Government Employees | 0 | 0.0% |
| State Government Employees | 6 | 10.3% |
| Federal Government Employees | 3 | 5.2% |
| Unpaid Family Workers | 0 | 0.0% |
| Total | 58 | 100.0% |
Employment Status by Age in Fairlee
According to the labor force statistics for Fairlee, out of the total population over 16 years of age (117), 52.1% or 61 individuals are in the labor force, with 4.9% or 3 of them unemployed. The age group with the highest labor force participation rate is 20 to 24 years, with 100.0% or 4 individuals in the labor force. Within the labor force, the 65 to 74 years age range has the highest percentage of unemployed individuals, with 50.0% or 3 of them being unemployed.
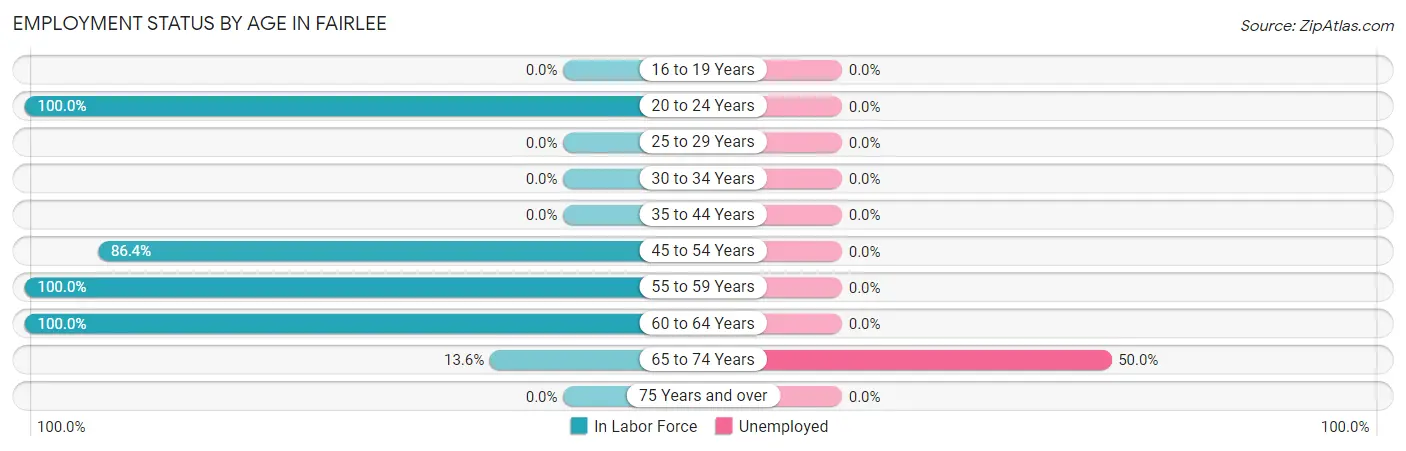
| Age Bracket | In Labor Force | Unemployed |
| 16 to 19 Years | 0 (0.0%) | 0 (0.0%) |
| 20 to 24 Years | 4 (100.0%) | 0 (0.0%) |
| 25 to 29 Years | 0 (0.0%) | 0 (0.0%) |
| 30 to 34 Years | 0 (0.0%) | 0 (0.0%) |
| 35 to 44 Years | 0 (0.0%) | 0 (0.0%) |
| 45 to 54 Years | 38 (86.4%) | 0 (0.0%) |
| 55 to 59 Years | 9 (100.0%) | 0 (0.0%) |
| 60 to 64 Years | 4 (100.0%) | 0 (0.0%) |
| 65 to 74 Years | 6 (13.6%) | 3 (50.0%) |
| 75 Years and over | 0 (0.0%) | 0 (0.0%) |
| Total | 61 (52.1%) | 3 (4.9%) |
Employment Status by Educational Attainment in Fairlee
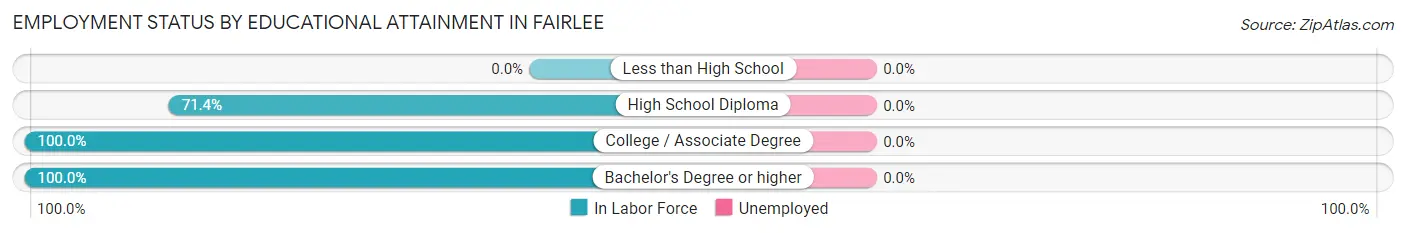
| Educational Attainment | In Labor Force | Unemployed |
| Less than High School | 0 (0.0%) | 0 (0.0%) |
| High School Diploma | 15 (71.4%) | 0 (0.0%) |
| College / Associate Degree | 20 (100.0%) | 0 (0.0%) |
| Bachelor's Degree or higher | 16 (100.0%) | 0 (0.0%) |
| Total | 51 (89.5%) | 0 (0.0%) |
Employment Occupations by Sex in Fairlee
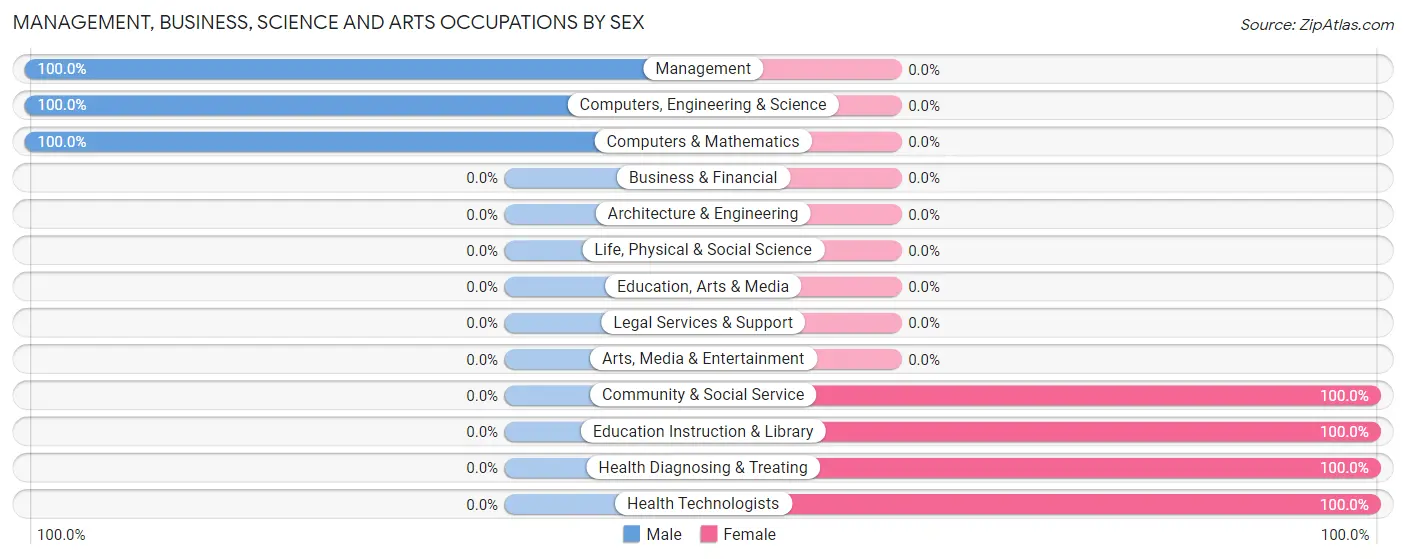
Management, Business, Science and Arts Occupations
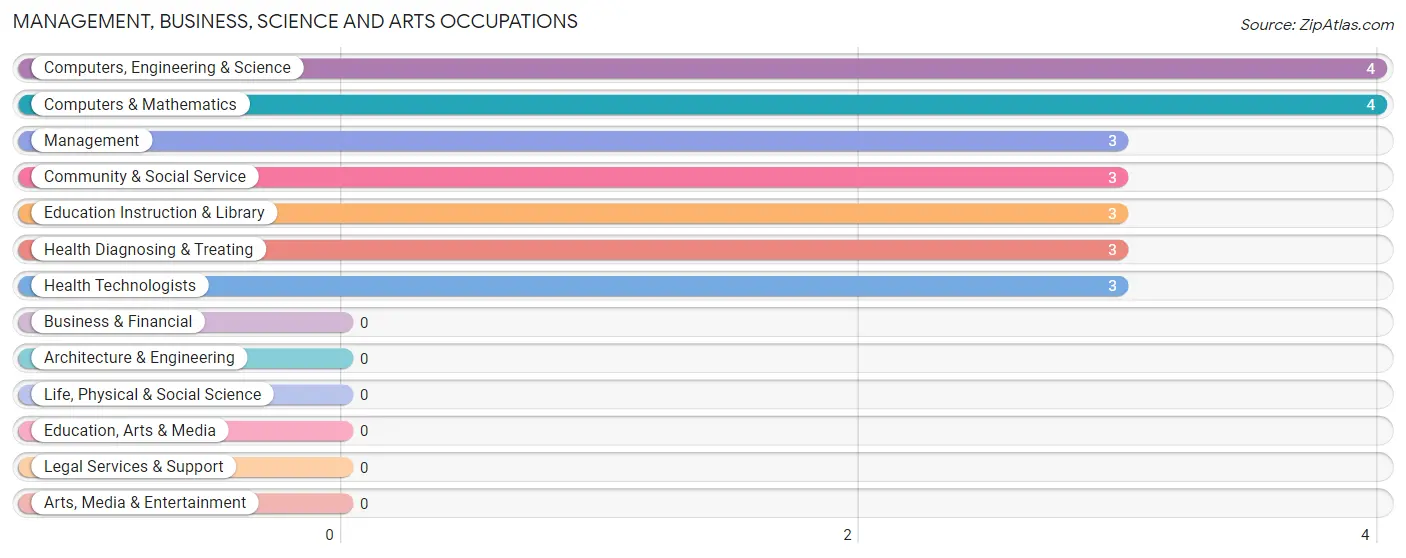
The most common Management, Business, Science and Arts occupations in Fairlee are Computers, Engineering & Science (4 | 6.9%), Computers & Mathematics (4 | 6.9%), Management (3 | 5.2%), Community & Social Service (3 | 5.2%), and Education Instruction & Library (3 | 5.2%).
Management, Business, Science and Arts Occupations by Sex
Within the Management, Business, Science and Arts occupations in Fairlee, the most male-oriented occupations are Management (100.0%), Computers, Engineering & Science (100.0%), and Computers & Mathematics (100.0%), while the most female-oriented occupations are Community & Social Service (100.0%), Education Instruction & Library (100.0%), and Health Diagnosing & Treating (100.0%).
| Occupation | Male | Female |
| Management | 3 (100.0%) | 0 (0.0%) |
| Business & Financial | 0 (0.0%) | 0 (0.0%) |
| Computers, Engineering & Science | 4 (100.0%) | 0 (0.0%) |
| Computers & Mathematics | 4 (100.0%) | 0 (0.0%) |
| Architecture & Engineering | 0 (0.0%) | 0 (0.0%) |
| Life, Physical & Social Science | 0 (0.0%) | 0 (0.0%) |
| Community & Social Service | 0 (0.0%) | 3 (100.0%) |
| Education, Arts & Media | 0 (0.0%) | 0 (0.0%) |
| Legal Services & Support | 0 (0.0%) | 0 (0.0%) |
| Education Instruction & Library | 0 (0.0%) | 3 (100.0%) |
| Arts, Media & Entertainment | 0 (0.0%) | 0 (0.0%) |
| Health Diagnosing & Treating | 0 (0.0%) | 3 (100.0%) |
| Health Technologists | 0 (0.0%) | 3 (100.0%) |
| Total (Category) | 7 (53.8%) | 6 (46.2%) |
| Total (Overall) | 31 (53.4%) | 27 (46.6%) |
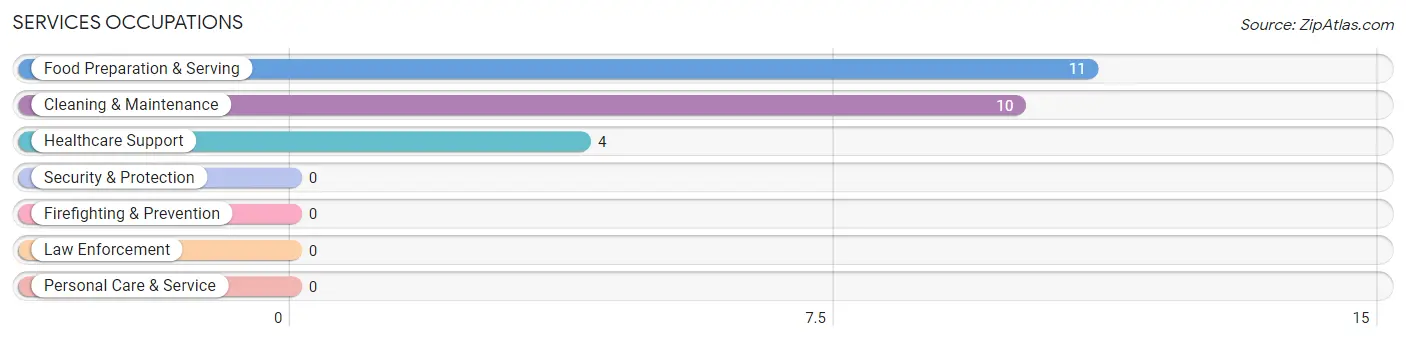
Services Occupations
The most common Services occupations in Fairlee are Food Preparation & Serving (11 | 19.0%), Cleaning & Maintenance (10 | 17.2%), and Healthcare Support (4 | 6.9%).
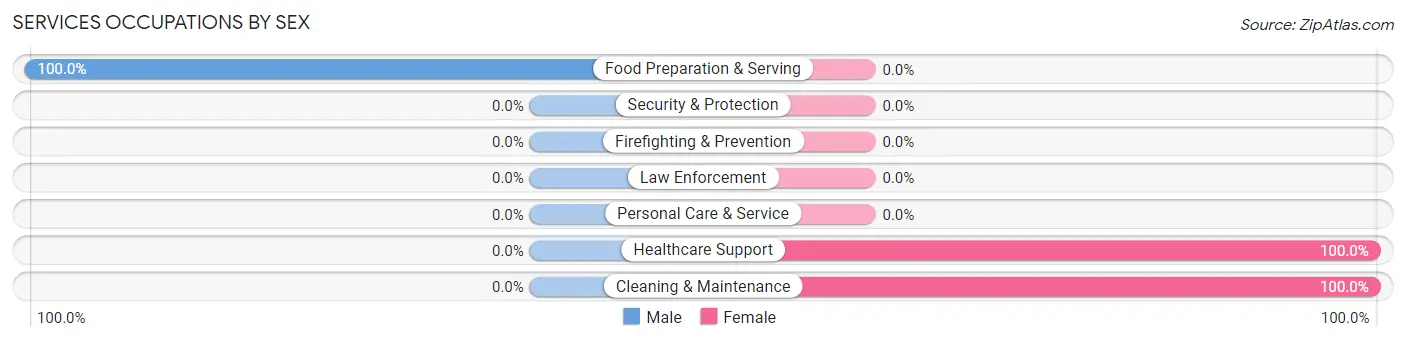
Services Occupations by Sex
| Occupation | Male | Female |
| Healthcare Support | 0 (0.0%) | 4 (100.0%) |
| Security & Protection | 0 (0.0%) | 0 (0.0%) |
| Firefighting & Prevention | 0 (0.0%) | 0 (0.0%) |
| Law Enforcement | 0 (0.0%) | 0 (0.0%) |
| Food Preparation & Serving | 11 (100.0%) | 0 (0.0%) |
| Cleaning & Maintenance | 0 (0.0%) | 10 (100.0%) |
| Personal Care & Service | 0 (0.0%) | 0 (0.0%) |
| Total (Category) | 11 (44.0%) | 14 (56.0%) |
| Total (Overall) | 31 (53.4%) | 27 (46.6%) |
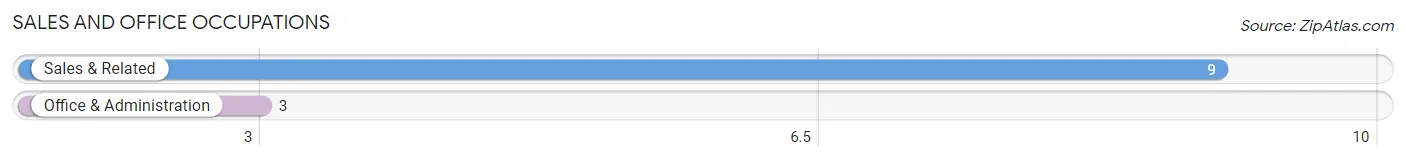
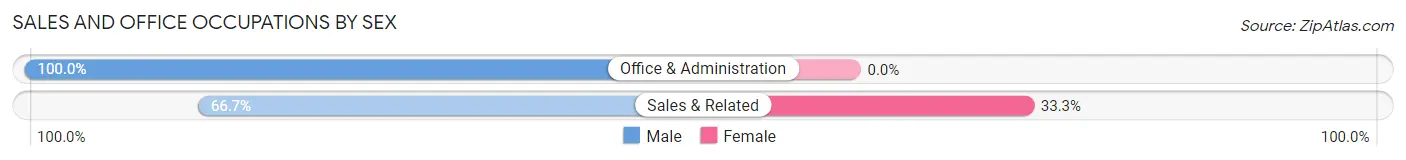
Sales and Office Occupations
The most common Sales and Office occupations in Fairlee are Sales & Related (9 | 15.5%), and Office & Administration (3 | 5.2%).
Sales and Office Occupations by Sex
| Occupation | Male | Female |
| Sales & Related | 6 (66.7%) | 3 (33.3%) |
| Office & Administration | 3 (100.0%) | 0 (0.0%) |
| Total (Category) | 9 (75.0%) | 3 (25.0%) |
| Total (Overall) | 31 (53.4%) | 27 (46.6%) |
Natural Resources, Construction and Maintenance Occupations
The most common Natural Resources, Construction and Maintenance occupations in Fairlee are , and Installation, Maintenance & Repair (4 | 6.9%).
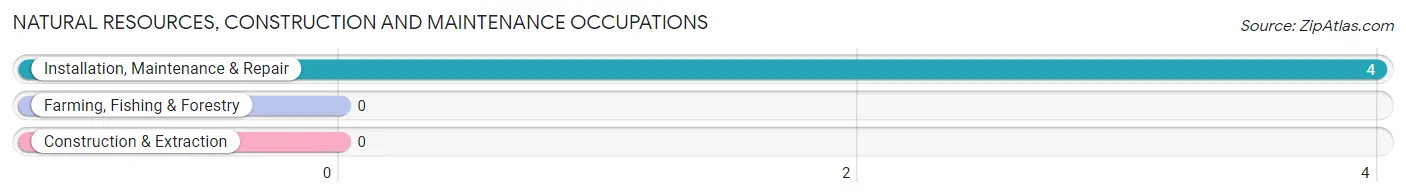
Natural Resources, Construction and Maintenance Occupations by Sex
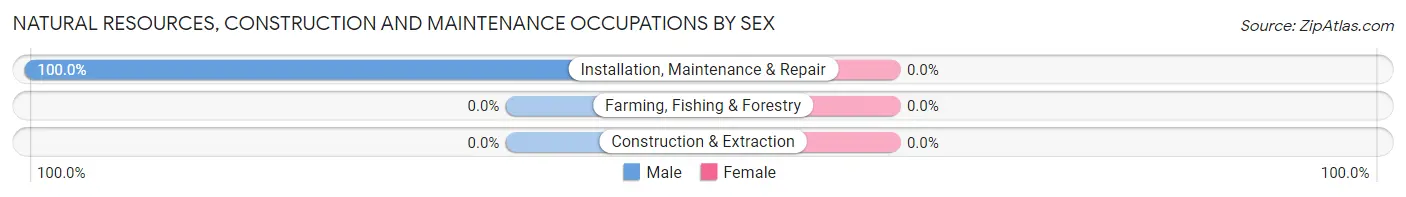
| Occupation | Male | Female |
| Farming, Fishing & Forestry | 0 (0.0%) | 0 (0.0%) |
| Construction & Extraction | 0 (0.0%) | 0 (0.0%) |
| Installation, Maintenance & Repair | 4 (100.0%) | 0 (0.0%) |
| Total (Category) | 4 (100.0%) | 0 (0.0%) |
| Total (Overall) | 31 (53.4%) | 27 (46.6%) |
Production, Transportation and Moving Occupations
The most common Production, Transportation and Moving occupations in Fairlee are , and Production (4 | 6.9%).
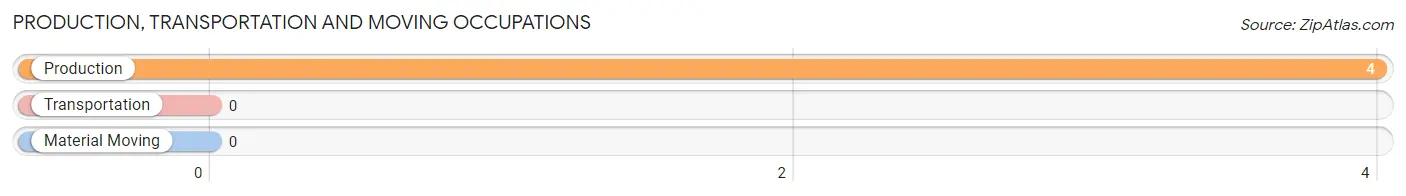
Production, Transportation and Moving Occupations by Sex
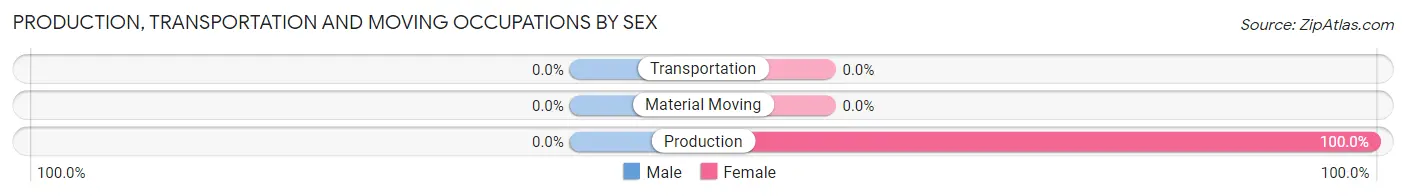
| Occupation | Male | Female |
| Production | 0 (0.0%) | 4 (100.0%) |
| Transportation | 0 (0.0%) | 0 (0.0%) |
| Material Moving | 0 (0.0%) | 0 (0.0%) |
| Total (Category) | 0 (0.0%) | 4 (100.0%) |
| Total (Overall) | 31 (53.4%) | 27 (46.6%) |
Employment Industries by Sex in Fairlee
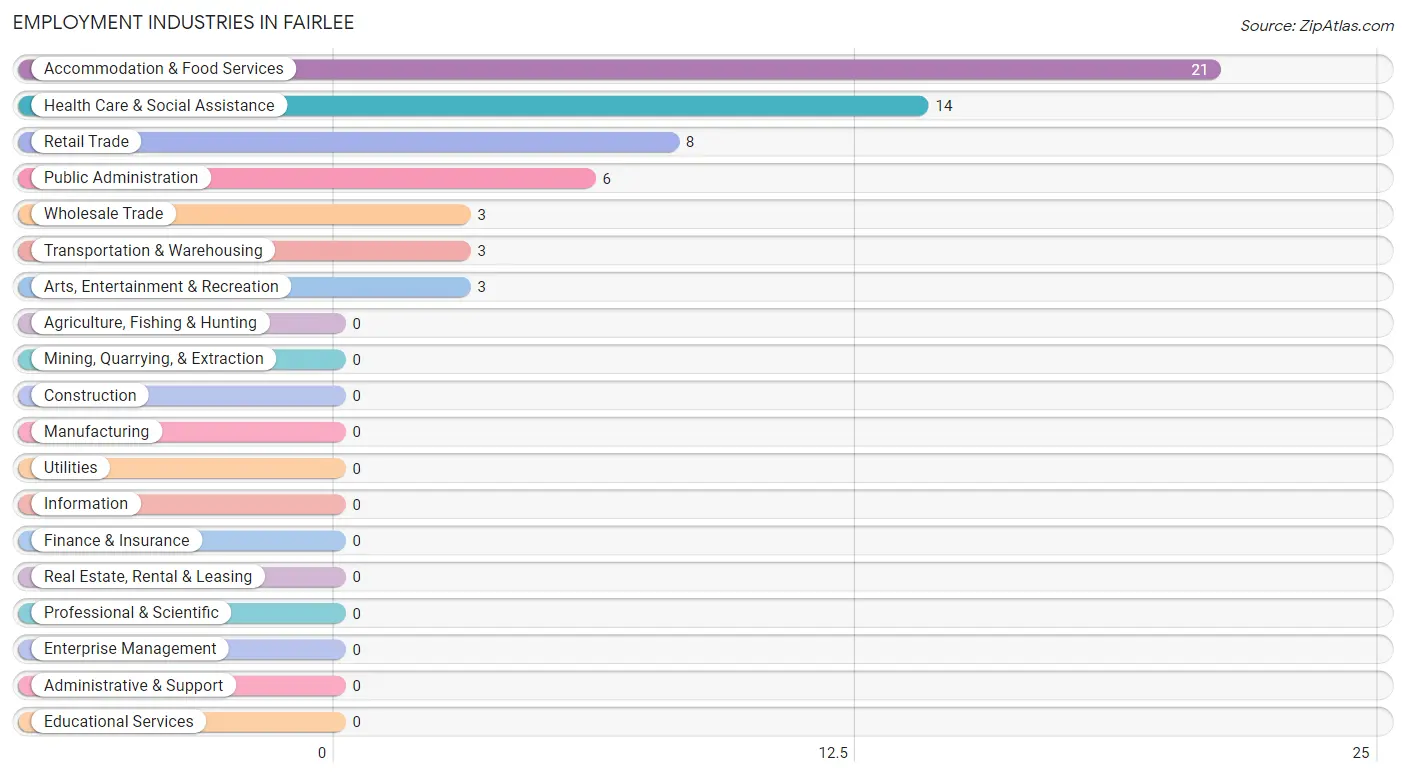
Employment Industries in Fairlee
The major employment industries in Fairlee include Accommodation & Food Services (21 | 36.2%), Health Care & Social Assistance (14 | 24.1%), Retail Trade (8 | 13.8%), Public Administration (6 | 10.3%), and Wholesale Trade (3 | 5.2%).
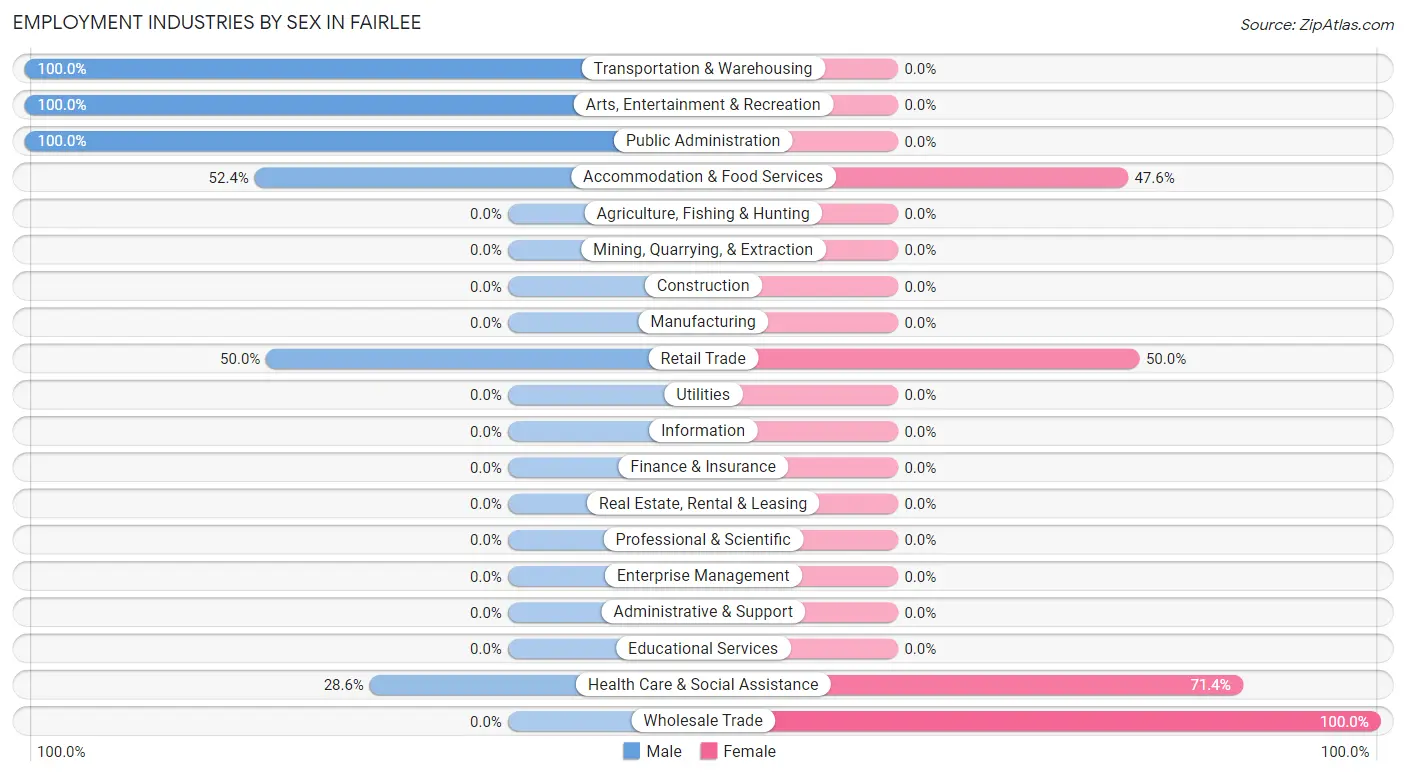
Employment Industries by Sex in Fairlee
The Fairlee industries that see more men than women are Transportation & Warehousing (100.0%), Arts, Entertainment & Recreation (100.0%), and Public Administration (100.0%), whereas the industries that tend to have a higher number of women are Wholesale Trade (100.0%), Health Care & Social Assistance (71.4%), and Retail Trade (50.0%).
| Industry | Male | Female |
| Agriculture, Fishing & Hunting | 0 (0.0%) | 0 (0.0%) |
| Mining, Quarrying, & Extraction | 0 (0.0%) | 0 (0.0%) |
| Construction | 0 (0.0%) | 0 (0.0%) |
| Manufacturing | 0 (0.0%) | 0 (0.0%) |
| Wholesale Trade | 0 (0.0%) | 3 (100.0%) |
| Retail Trade | 4 (50.0%) | 4 (50.0%) |
| Transportation & Warehousing | 3 (100.0%) | 0 (0.0%) |
| Utilities | 0 (0.0%) | 0 (0.0%) |
| Information | 0 (0.0%) | 0 (0.0%) |
| Finance & Insurance | 0 (0.0%) | 0 (0.0%) |
| Real Estate, Rental & Leasing | 0 (0.0%) | 0 (0.0%) |
| Professional & Scientific | 0 (0.0%) | 0 (0.0%) |
| Enterprise Management | 0 (0.0%) | 0 (0.0%) |
| Administrative & Support | 0 (0.0%) | 0 (0.0%) |
| Educational Services | 0 (0.0%) | 0 (0.0%) |
| Health Care & Social Assistance | 4 (28.6%) | 10 (71.4%) |
| Arts, Entertainment & Recreation | 3 (100.0%) | 0 (0.0%) |
| Accommodation & Food Services | 11 (52.4%) | 10 (47.6%) |
| Public Administration | 6 (100.0%) | 0 (0.0%) |
| Total | 31 (53.4%) | 27 (46.6%) |
Education in Fairlee
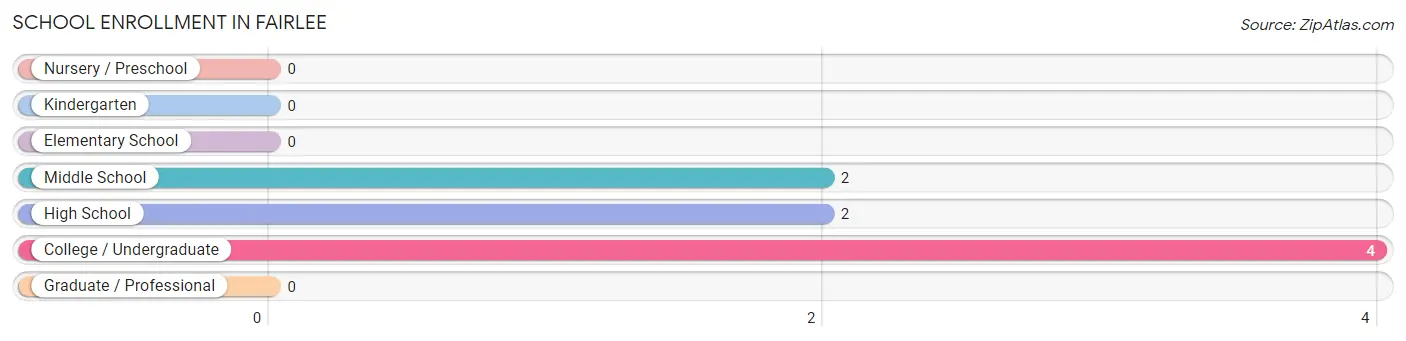
School Enrollment in Fairlee
The most common levels of schooling among the 8 students in Fairlee are college / undergraduate (4 | 50.0%), middle school (2 | 25.0%), and high school (2 | 25.0%).
| School Level | # Students | % Students |
| Nursery / Preschool | 0 | 0.0% |
| Kindergarten | 0 | 0.0% |
| Elementary School | 0 | 0.0% |
| Middle School | 2 | 25.0% |
| High School | 2 | 25.0% |
| College / Undergraduate | 4 | 50.0% |
| Graduate / Professional | 0 | 0.0% |
| Total | 8 | 100.0% |
School Enrollment by Age by Funding Source in Fairlee
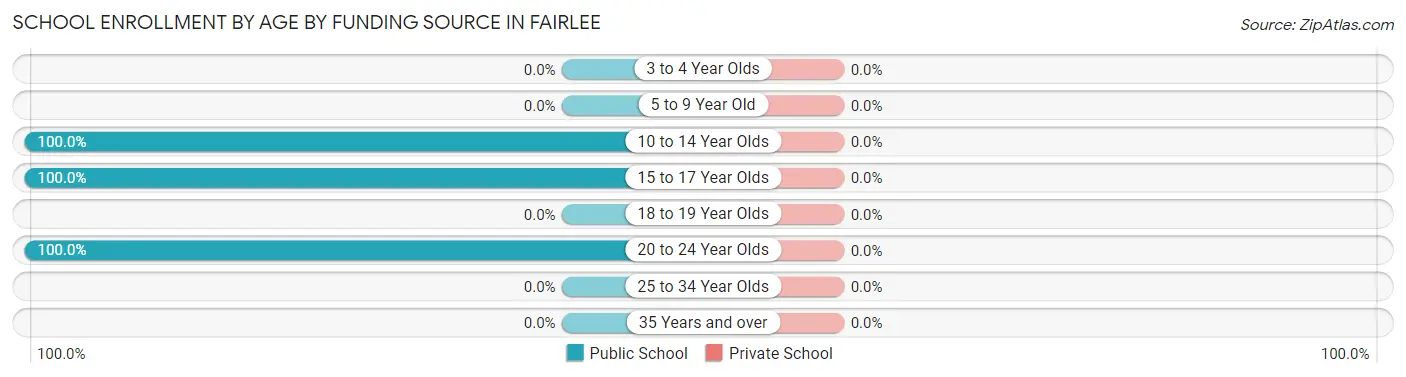
| Age Bracket | Public School | Private School |
| 3 to 4 Year Olds | 0 (0.0%) | 0 (0.0%) |
| 5 to 9 Year Old | 0 (0.0%) | 0 (0.0%) |
| 10 to 14 Year Olds | 2 (100.0%) | 0 (0.0%) |
| 15 to 17 Year Olds | 2 (100.0%) | 0 (0.0%) |
| 18 to 19 Year Olds | 0 (0.0%) | 0 (0.0%) |
| 20 to 24 Year Olds | 4 (100.0%) | 0 (0.0%) |
| 25 to 34 Year Olds | 0 (0.0%) | 0 (0.0%) |
| 35 Years and over | 0 (0.0%) | 0 (0.0%) |
| Total | 8 (100.0%) | 0 (0.0%) |
Educational Attainment by Field of Study in Fairlee
Psychology (10 | 40.0%), arts & humanities (6 | 24.0%), business (3 | 12.0%), education (3 | 12.0%), and liberal arts & history (3 | 12.0%) are the most common fields of study among 25 individuals in Fairlee who have obtained a bachelor's degree or higher.
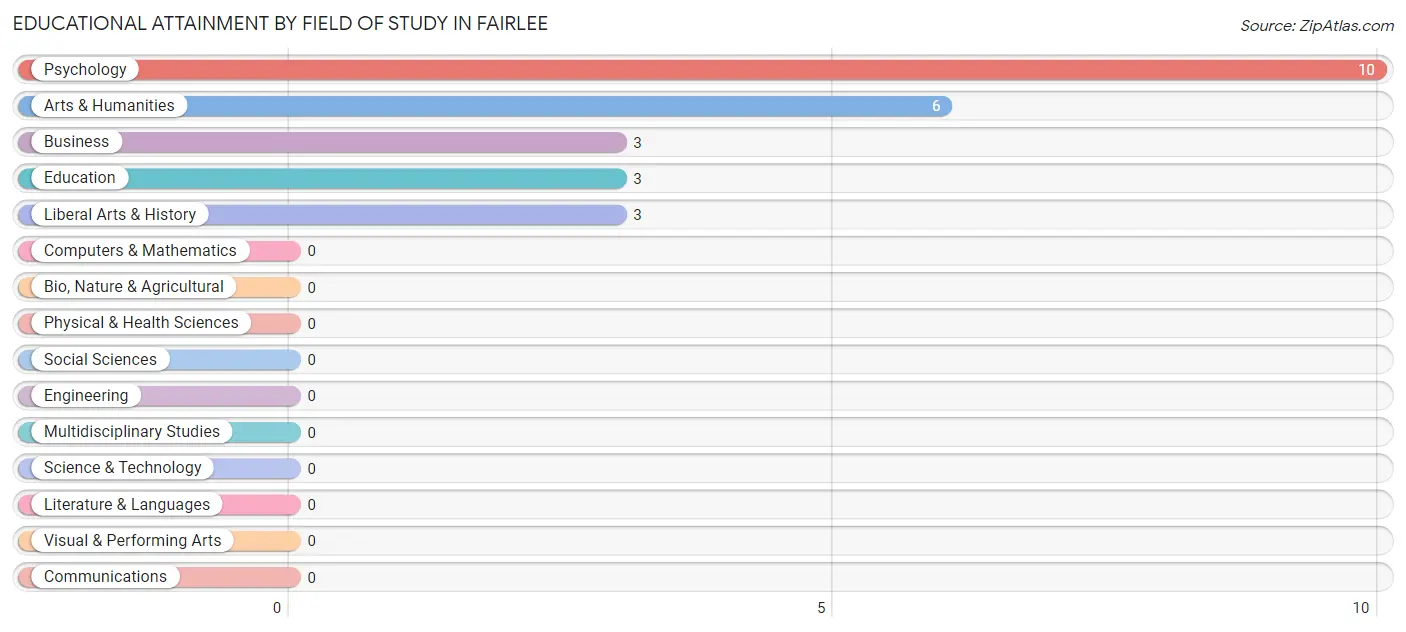
| Field of Study | # Graduates | % Graduates |
| Computers & Mathematics | 0 | 0.0% |
| Bio, Nature & Agricultural | 0 | 0.0% |
| Physical & Health Sciences | 0 | 0.0% |
| Psychology | 10 | 40.0% |
| Social Sciences | 0 | 0.0% |
| Engineering | 0 | 0.0% |
| Multidisciplinary Studies | 0 | 0.0% |
| Science & Technology | 0 | 0.0% |
| Business | 3 | 12.0% |
| Education | 3 | 12.0% |
| Literature & Languages | 0 | 0.0% |
| Liberal Arts & History | 3 | 12.0% |
| Visual & Performing Arts | 0 | 0.0% |
| Communications | 0 | 0.0% |
| Arts & Humanities | 6 | 24.0% |
| Total | 25 | 100.0% |
Transportation & Commute in Fairlee
Vehicle Availability by Sex in Fairlee
The most prevalent vehicle ownership categories in Fairlee are males with 2 vehicles (18, accounting for 58.1%) and females with 2 vehicles (13, making up 66.7%).
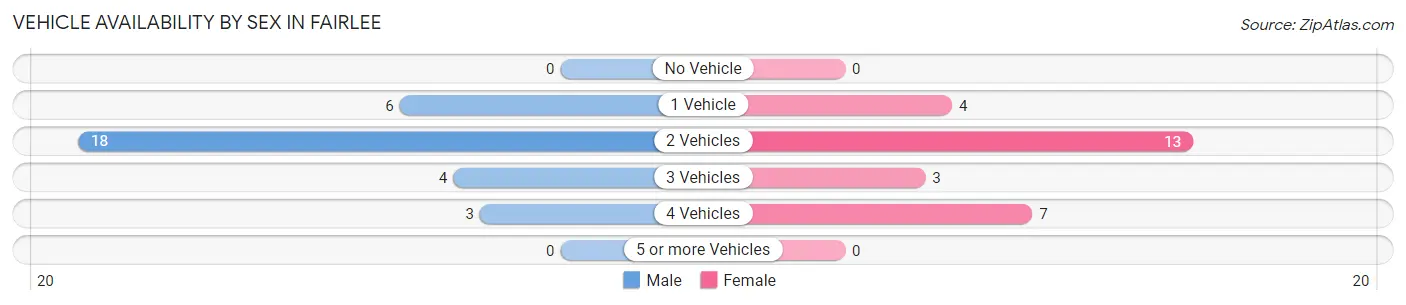
| Vehicles Available | Male | Female |
| No Vehicle | 0 (0.0%) | 0 (0.0%) |
| 1 Vehicle | 6 (19.4%) | 4 (14.8%) |
| 2 Vehicles | 18 (58.1%) | 13 (48.1%) |
| 3 Vehicles | 4 (12.9%) | 3 (11.1%) |
| 4 Vehicles | 3 (9.7%) | 7 (25.9%) |
| 5 or more Vehicles | 0 (0.0%) | 0 (0.0%) |
| Total | 31 (100.0%) | 27 (100.0%) |
Commute Time in Fairlee
The most frequently occuring commute durations in Fairlee are 5 to 9 minutes (24 commuters, 47.1%), 30 to 34 minutes (8 commuters, 15.7%), and 20 to 24 minutes (7 commuters, 13.7%).
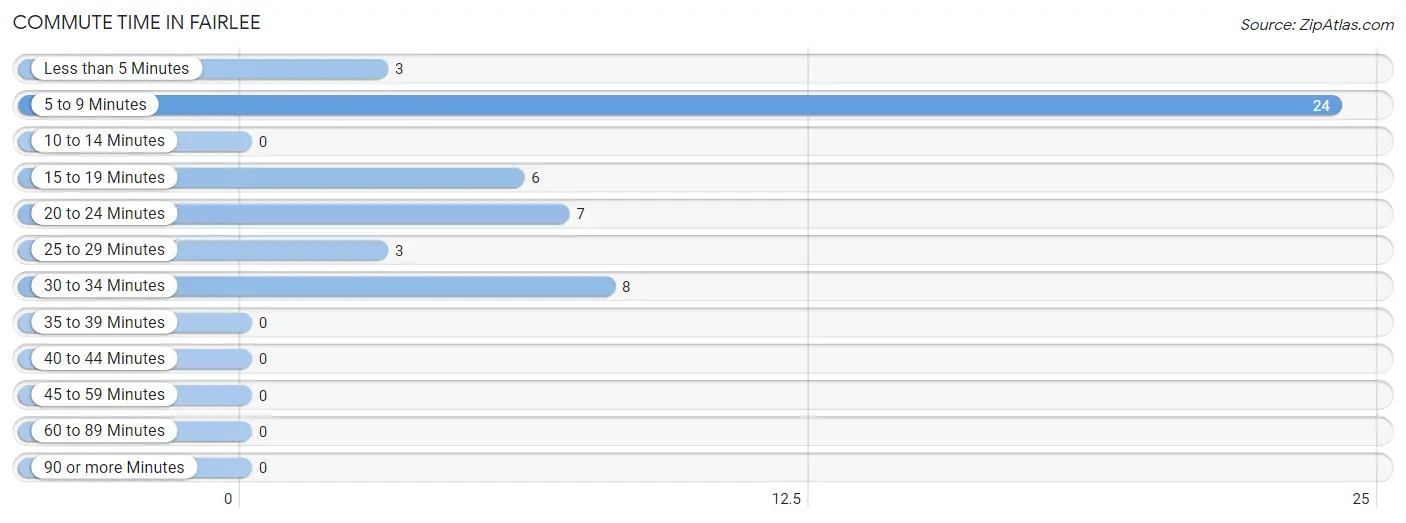
| Commute Time | # Commuters | % Commuters |
| Less than 5 Minutes | 3 | 5.9% |
| 5 to 9 Minutes | 24 | 47.1% |
| 10 to 14 Minutes | 0 | 0.0% |
| 15 to 19 Minutes | 6 | 11.8% |
| 20 to 24 Minutes | 7 | 13.7% |
| 25 to 29 Minutes | 3 | 5.9% |
| 30 to 34 Minutes | 8 | 15.7% |
| 35 to 39 Minutes | 0 | 0.0% |
| 40 to 44 Minutes | 0 | 0.0% |
| 45 to 59 Minutes | 0 | 0.0% |
| 60 to 89 Minutes | 0 | 0.0% |
| 90 or more Minutes | 0 | 0.0% |
Commute Time by Sex in Fairlee
The most common commute times in Fairlee are 5 to 9 minutes (11 commuters, 35.5%) for males and 5 to 9 minutes (13 commuters, 65.0%) for females.
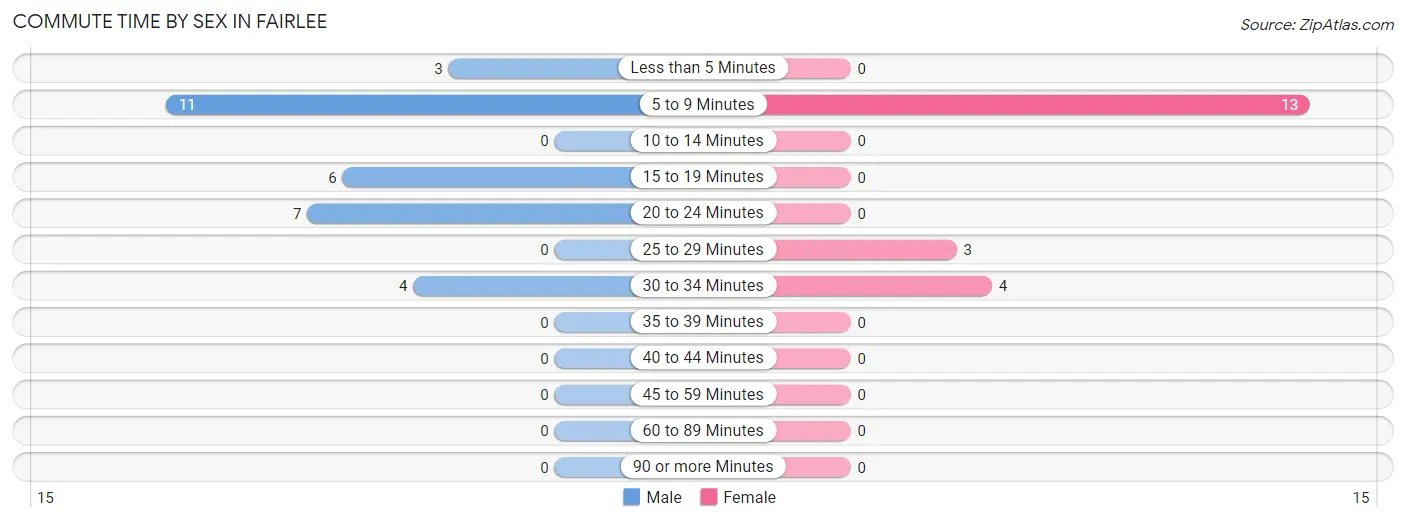
| Commute Time | Male | Female |
| Less than 5 Minutes | 3 (9.7%) | 0 (0.0%) |
| 5 to 9 Minutes | 11 (35.5%) | 13 (65.0%) |
| 10 to 14 Minutes | 0 (0.0%) | 0 (0.0%) |
| 15 to 19 Minutes | 6 (19.4%) | 0 (0.0%) |
| 20 to 24 Minutes | 7 (22.6%) | 0 (0.0%) |
| 25 to 29 Minutes | 0 (0.0%) | 3 (15.0%) |
| 30 to 34 Minutes | 4 (12.9%) | 4 (20.0%) |
| 35 to 39 Minutes | 0 (0.0%) | 0 (0.0%) |
| 40 to 44 Minutes | 0 (0.0%) | 0 (0.0%) |
| 45 to 59 Minutes | 0 (0.0%) | 0 (0.0%) |
| 60 to 89 Minutes | 0 (0.0%) | 0 (0.0%) |
| 90 or more Minutes | 0 (0.0%) | 0 (0.0%) |
Time of Departure to Work by Sex in Fairlee
The most frequent times of departure to work in Fairlee are 6:30 AM to 6:59 AM (18, 58.1%) for males and 7:00 AM to 7:29 AM (14, 70.0%) for females.
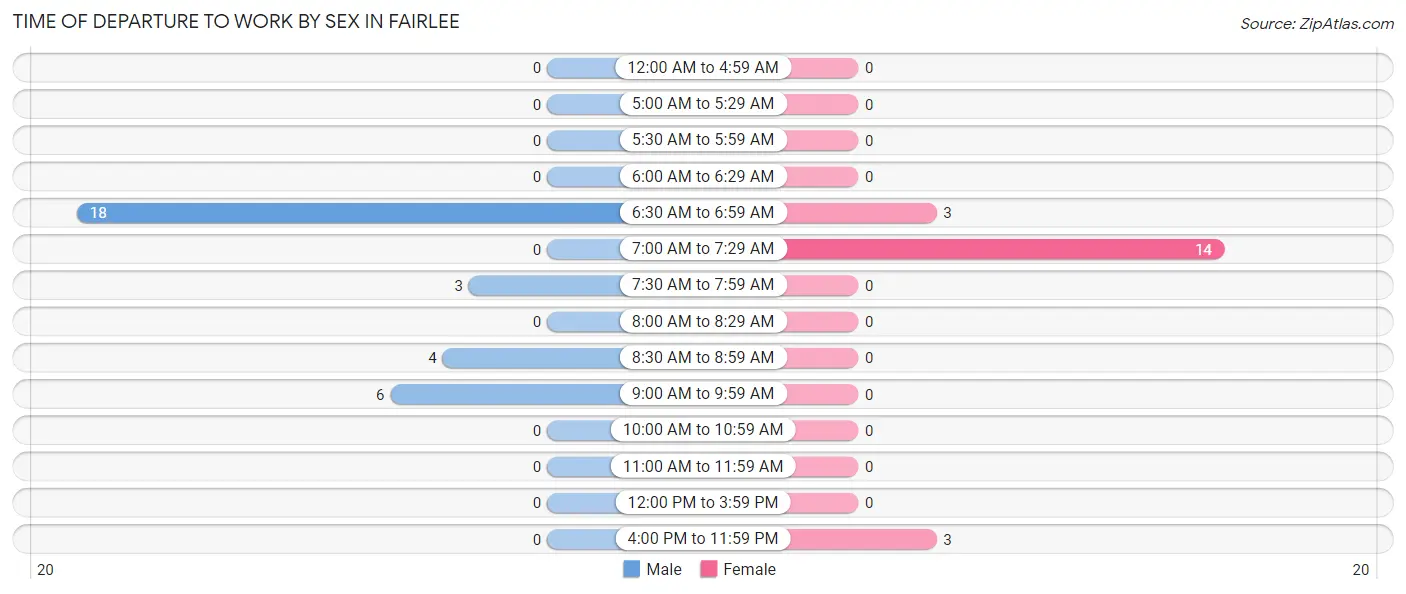
| Time of Departure | Male | Female |
| 12:00 AM to 4:59 AM | 0 (0.0%) | 0 (0.0%) |
| 5:00 AM to 5:29 AM | 0 (0.0%) | 0 (0.0%) |
| 5:30 AM to 5:59 AM | 0 (0.0%) | 0 (0.0%) |
| 6:00 AM to 6:29 AM | 0 (0.0%) | 0 (0.0%) |
| 6:30 AM to 6:59 AM | 18 (58.1%) | 3 (15.0%) |
| 7:00 AM to 7:29 AM | 0 (0.0%) | 14 (70.0%) |
| 7:30 AM to 7:59 AM | 3 (9.7%) | 0 (0.0%) |
| 8:00 AM to 8:29 AM | 0 (0.0%) | 0 (0.0%) |
| 8:30 AM to 8:59 AM | 4 (12.9%) | 0 (0.0%) |
| 9:00 AM to 9:59 AM | 6 (19.4%) | 0 (0.0%) |
| 10:00 AM to 10:59 AM | 0 (0.0%) | 0 (0.0%) |
| 11:00 AM to 11:59 AM | 0 (0.0%) | 0 (0.0%) |
| 12:00 PM to 3:59 PM | 0 (0.0%) | 0 (0.0%) |
| 4:00 PM to 11:59 PM | 0 (0.0%) | 3 (15.0%) |
| Total | 31 (100.0%) | 20 (100.0%) |
Housing Occupancy in Fairlee
Occupancy by Ownership in Fairlee
Of the total 75 dwellings in Fairlee, owner-occupied units account for 38 (50.7%), while renter-occupied units make up 37 (49.3%).
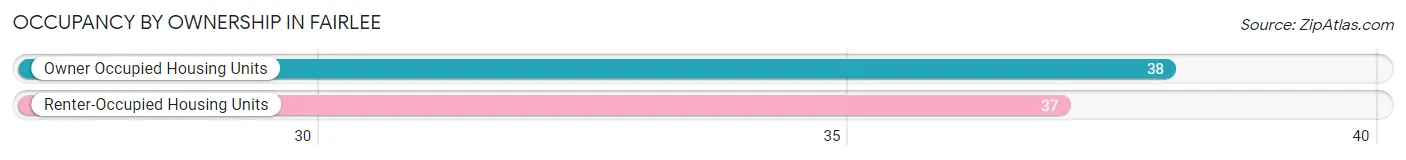
| Occupancy | # Housing Units | % Housing Units |
| Owner Occupied Housing Units | 38 | 50.7% |
| Renter-Occupied Housing Units | 37 | 49.3% |
| Total Occupied Housing Units | 75 | 100.0% |
Occupancy by Household Size in Fairlee
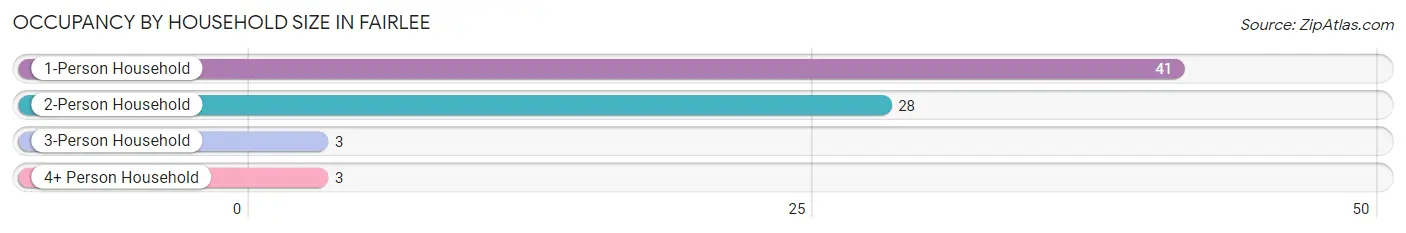
| Household Size | # Housing Units | % Housing Units |
| 1-Person Household | 41 | 54.7% |
| 2-Person Household | 28 | 37.3% |
| 3-Person Household | 3 | 4.0% |
| 4+ Person Household | 3 | 4.0% |
| Total Housing Units | 75 | 100.0% |
Occupancy by Ownership by Household Size in Fairlee
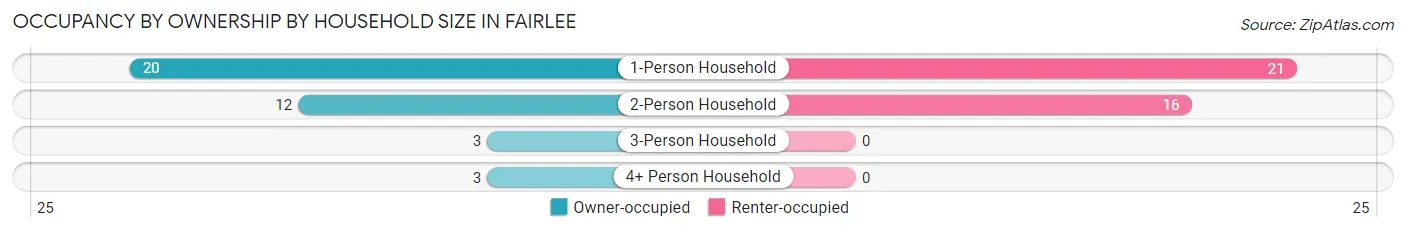
| Household Size | Owner-occupied | Renter-occupied |
| 1-Person Household | 20 (48.8%) | 21 (51.2%) |
| 2-Person Household | 12 (42.9%) | 16 (57.1%) |
| 3-Person Household | 3 (100.0%) | 0 (0.0%) |
| 4+ Person Household | 3 (100.0%) | 0 (0.0%) |
| Total Housing Units | 38 (50.7%) | 37 (49.3%) |
Occupancy by Educational Attainment in Fairlee
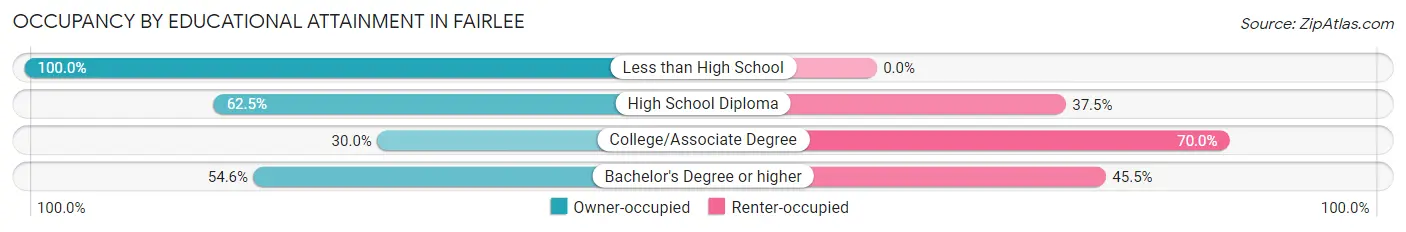
| Household Size | Owner-occupied | Renter-occupied |
| Less than High School | 7 (100.0%) | 0 (0.0%) |
| High School Diploma | 10 (62.5%) | 6 (37.5%) |
| College/Associate Degree | 9 (30.0%) | 21 (70.0%) |
| Bachelor's Degree or higher | 12 (54.5%) | 10 (45.5%) |
Occupancy by Age of Householder in Fairlee
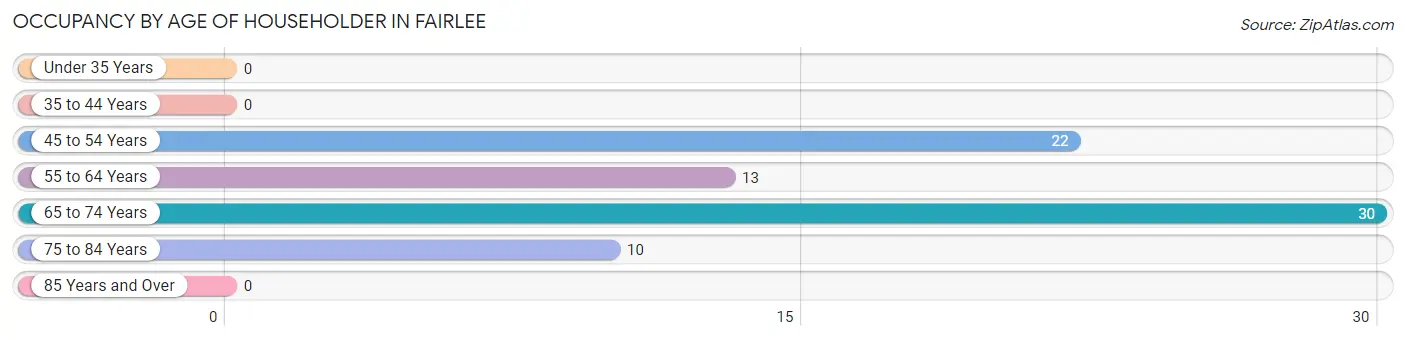
| Age Bracket | # Households | % Households |
| Under 35 Years | 0 | 0.0% |
| 35 to 44 Years | 0 | 0.0% |
| 45 to 54 Years | 22 | 29.3% |
| 55 to 64 Years | 13 | 17.3% |
| 65 to 74 Years | 30 | 40.0% |
| 75 to 84 Years | 10 | 13.3% |
| 85 Years and Over | 0 | 0.0% |
| Total | 75 | 100.0% |
Housing Finances in Fairlee
Median Income by Occupancy in Fairlee
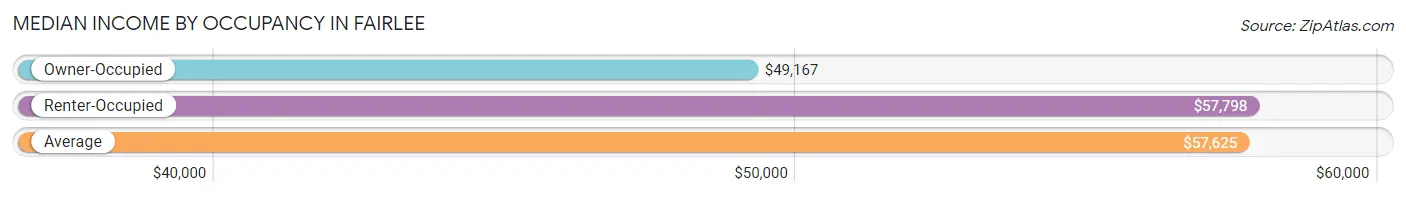
| Occupancy Type | # Households | Median Income |
| Owner-Occupied | 38 (50.7%) | $49,167 |
| Renter-Occupied | 37 (49.3%) | $57,798 |
| Average | 75 (100.0%) | $57,625 |
Occupancy by Householder Income Bracket in Fairlee
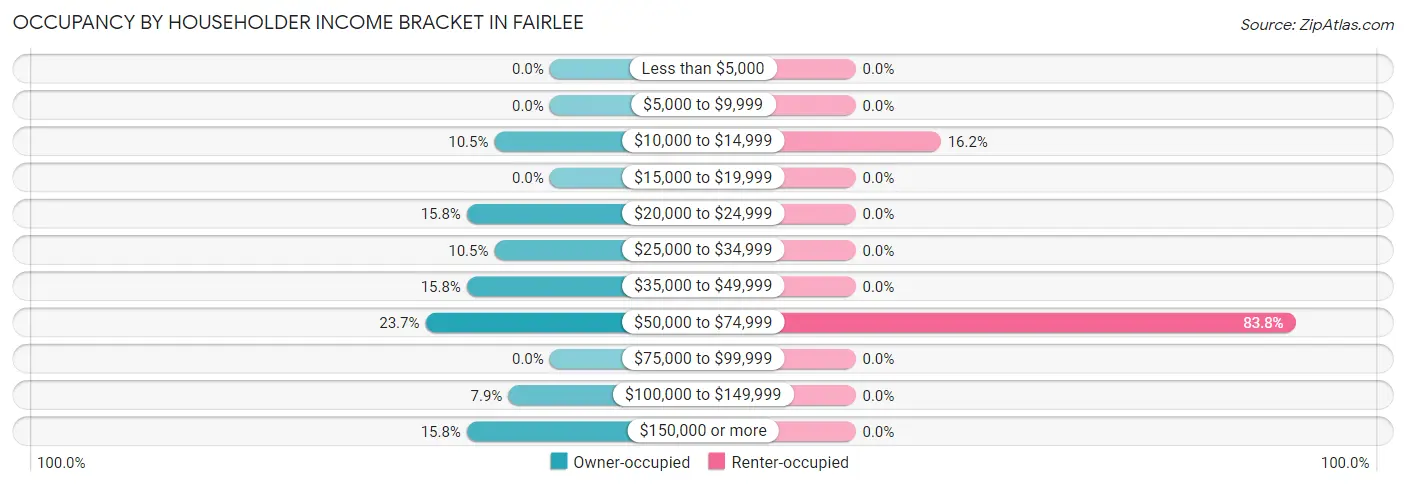
| Income Bracket | Owner-occupied | Renter-occupied |
| Less than $5,000 | 0 (0.0%) | 0 (0.0%) |
| $5,000 to $9,999 | 0 (0.0%) | 0 (0.0%) |
| $10,000 to $14,999 | 4 (10.5%) | 6 (16.2%) |
| $15,000 to $19,999 | 0 (0.0%) | 0 (0.0%) |
| $20,000 to $24,999 | 6 (15.8%) | 0 (0.0%) |
| $25,000 to $34,999 | 4 (10.5%) | 0 (0.0%) |
| $35,000 to $49,999 | 6 (15.8%) | 0 (0.0%) |
| $50,000 to $74,999 | 9 (23.7%) | 31 (83.8%) |
| $75,000 to $99,999 | 0 (0.0%) | 0 (0.0%) |
| $100,000 to $149,999 | 3 (7.9%) | 0 (0.0%) |
| $150,000 or more | 6 (15.8%) | 0 (0.0%) |
| Total | 38 (100.0%) | 37 (100.0%) |
Monthly Housing Cost Tiers in Fairlee
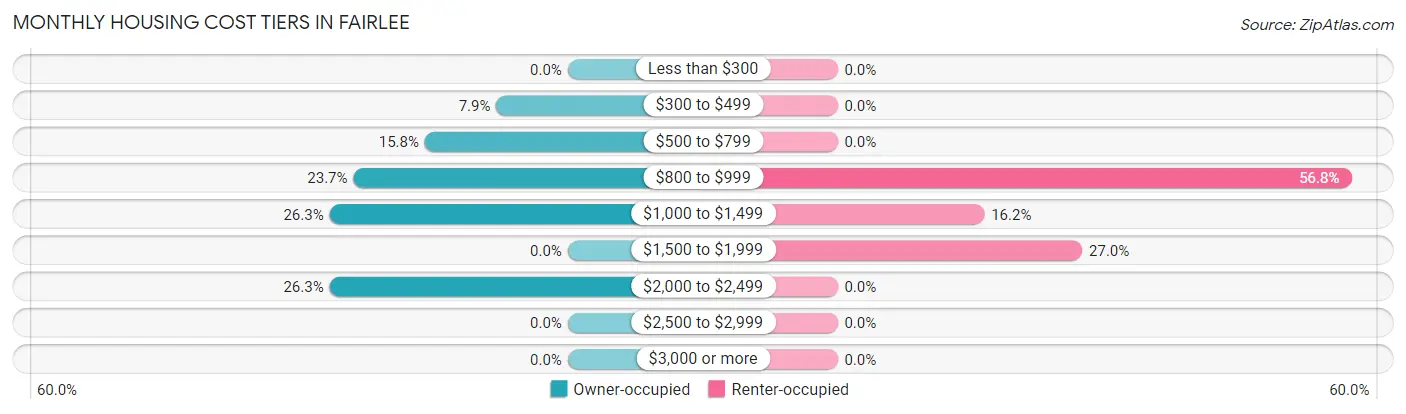
| Monthly Cost | Owner-occupied | Renter-occupied |
| Less than $300 | 0 (0.0%) | 0 (0.0%) |
| $300 to $499 | 3 (7.9%) | 0 (0.0%) |
| $500 to $799 | 6 (15.8%) | 0 (0.0%) |
| $800 to $999 | 9 (23.7%) | 21 (56.8%) |
| $1,000 to $1,499 | 10 (26.3%) | 6 (16.2%) |
| $1,500 to $1,999 | 0 (0.0%) | 10 (27.0%) |
| $2,000 to $2,499 | 10 (26.3%) | 0 (0.0%) |
| $2,500 to $2,999 | 0 (0.0%) | 0 (0.0%) |
| $3,000 or more | 0 (0.0%) | 0 (0.0%) |
| Total | 38 (100.0%) | 37 (100.0%) |
Physical Housing Characteristics in Fairlee
Housing Structures in Fairlee
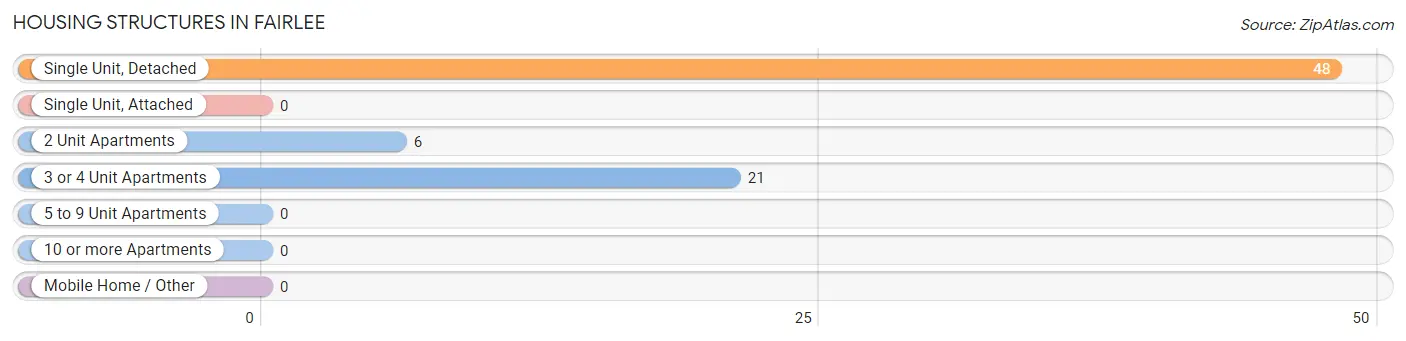
| Structure Type | # Housing Units | % Housing Units |
| Single Unit, Detached | 48 | 64.0% |
| Single Unit, Attached | 0 | 0.0% |
| 2 Unit Apartments | 6 | 8.0% |
| 3 or 4 Unit Apartments | 21 | 28.0% |
| 5 to 9 Unit Apartments | 0 | 0.0% |
| 10 or more Apartments | 0 | 0.0% |
| Mobile Home / Other | 0 | 0.0% |
| Total | 75 | 100.0% |
Housing Structures by Occupancy in Fairlee
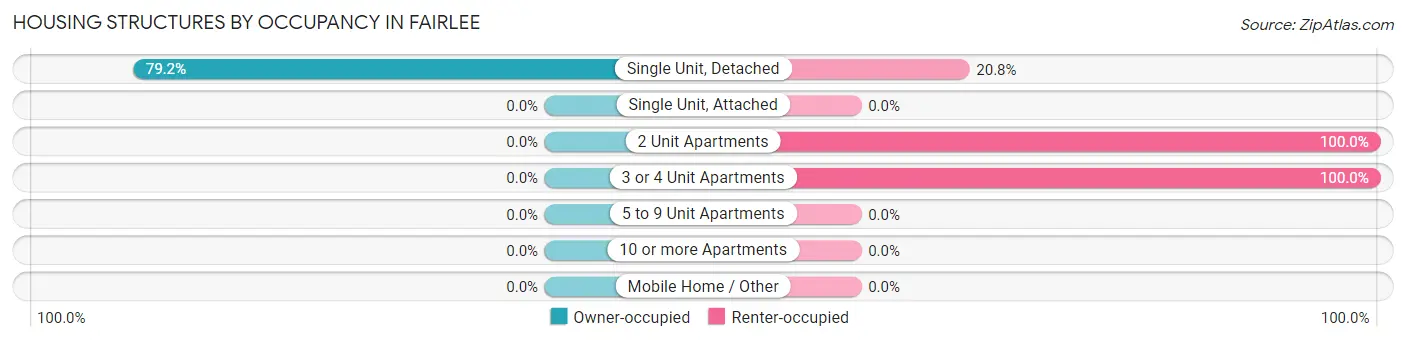
| Structure Type | Owner-occupied | Renter-occupied |
| Single Unit, Detached | 38 (79.2%) | 10 (20.8%) |
| Single Unit, Attached | 0 (0.0%) | 0 (0.0%) |
| 2 Unit Apartments | 0 (0.0%) | 6 (100.0%) |
| 3 or 4 Unit Apartments | 0 (0.0%) | 21 (100.0%) |
| 5 to 9 Unit Apartments | 0 (0.0%) | 0 (0.0%) |
| 10 or more Apartments | 0 (0.0%) | 0 (0.0%) |
| Mobile Home / Other | 0 (0.0%) | 0 (0.0%) |
| Total | 38 (50.7%) | 37 (49.3%) |
Housing Structures by Number of Rooms in Fairlee
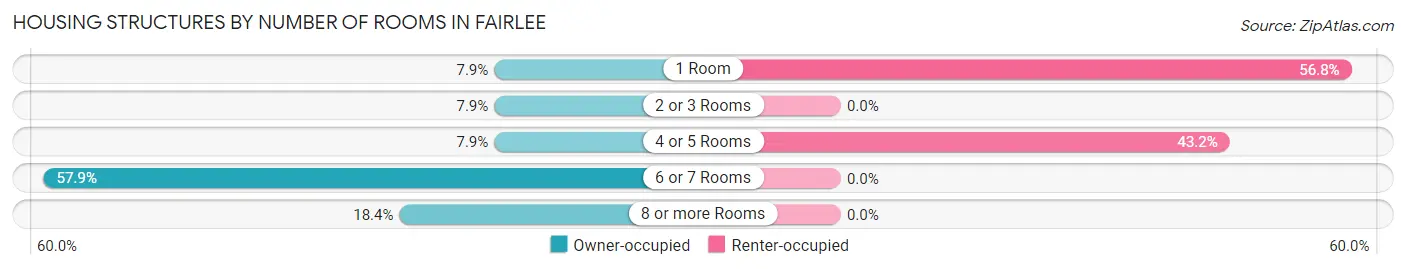
| Number of Rooms | Owner-occupied | Renter-occupied |
| 1 Room | 3 (7.9%) | 21 (56.8%) |
| 2 or 3 Rooms | 3 (7.9%) | 0 (0.0%) |
| 4 or 5 Rooms | 3 (7.9%) | 16 (43.2%) |
| 6 or 7 Rooms | 22 (57.9%) | 0 (0.0%) |
| 8 or more Rooms | 7 (18.4%) | 0 (0.0%) |
| Total | 38 (100.0%) | 37 (100.0%) |
Housing Structure by Heating Type in Fairlee
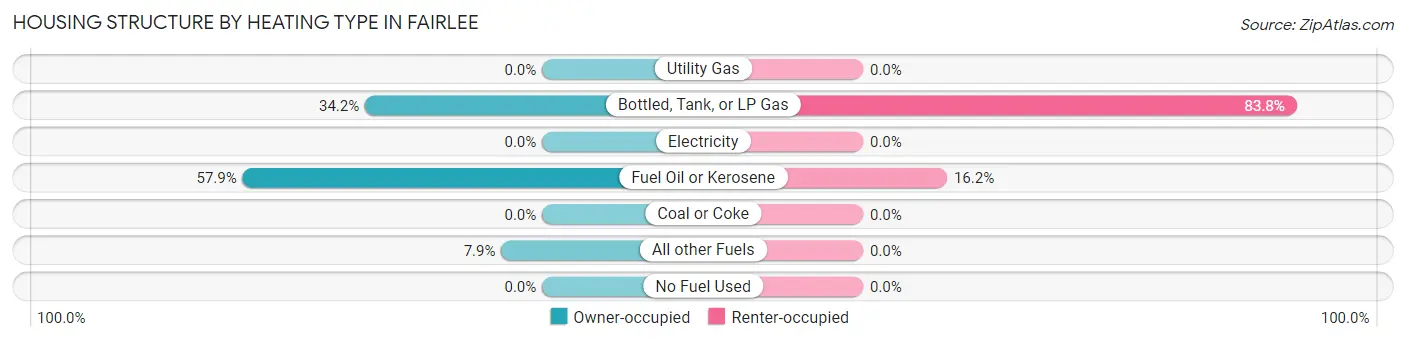
| Heating Type | Owner-occupied | Renter-occupied |
| Utility Gas | 0 (0.0%) | 0 (0.0%) |
| Bottled, Tank, or LP Gas | 13 (34.2%) | 31 (83.8%) |
| Electricity | 0 (0.0%) | 0 (0.0%) |
| Fuel Oil or Kerosene | 22 (57.9%) | 6 (16.2%) |
| Coal or Coke | 0 (0.0%) | 0 (0.0%) |
| All other Fuels | 3 (7.9%) | 0 (0.0%) |
| No Fuel Used | 0 (0.0%) | 0 (0.0%) |
| Total | 38 (100.0%) | 37 (100.0%) |
Household Vehicle Usage in Fairlee
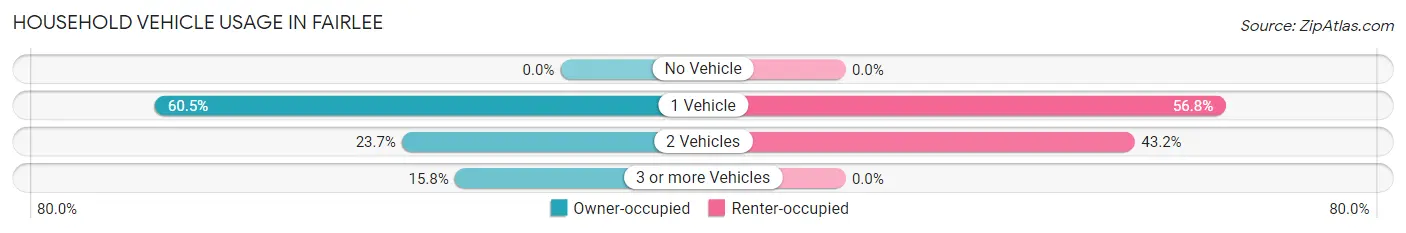
| Vehicles per Household | Owner-occupied | Renter-occupied |
| No Vehicle | 0 (0.0%) | 0 (0.0%) |
| 1 Vehicle | 23 (60.5%) | 21 (56.8%) |
| 2 Vehicles | 9 (23.7%) | 16 (43.2%) |
| 3 or more Vehicles | 6 (15.8%) | 0 (0.0%) |
| Total | 38 (100.0%) | 37 (100.0%) |
Real Estate & Mortgages in Fairlee
Real Estate and Mortgage Overview in Fairlee
| Characteristic | Without Mortgage | With Mortgage |
| Housing Units | 19 | 19 |
| Median Property Value | $247,500 | $277,100 |
| Median Household Income | $39,583 | $6 |
| Monthly Housing Costs | $808 | $0 |
| Real Estate Taxes | $5,673 | $0 |
Property Value by Mortgage Status in Fairlee
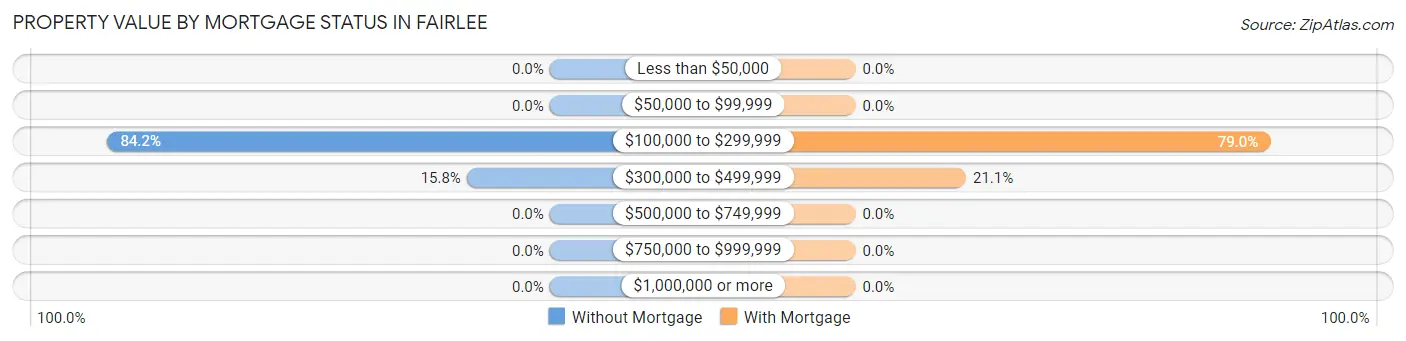
| Property Value | Without Mortgage | With Mortgage |
| Less than $50,000 | 0 (0.0%) | 0 (0.0%) |
| $50,000 to $99,999 | 0 (0.0%) | 0 (0.0%) |
| $100,000 to $299,999 | 16 (84.2%) | 15 (78.9%) |
| $300,000 to $499,999 | 3 (15.8%) | 4 (21.0%) |
| $500,000 to $749,999 | 0 (0.0%) | 0 (0.0%) |
| $750,000 to $999,999 | 0 (0.0%) | 0 (0.0%) |
| $1,000,000 or more | 0 (0.0%) | 0 (0.0%) |
| Total | 19 (100.0%) | 19 (100.0%) |
Household Income by Mortgage Status in Fairlee
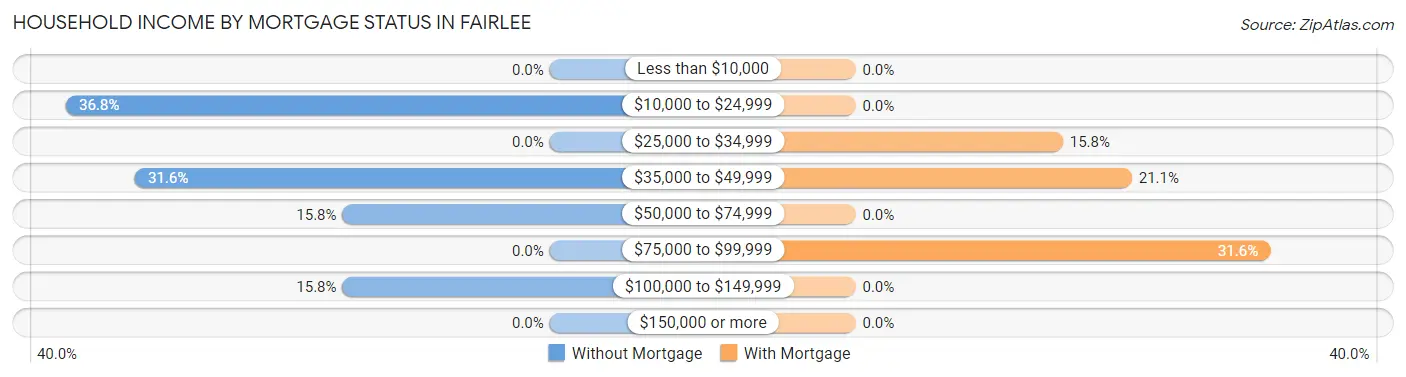
| Household Income | Without Mortgage | With Mortgage |
| Less than $10,000 | 0 (0.0%) | 0 (0.0%) |
| $10,000 to $24,999 | 7 (36.8%) | 0 (0.0%) |
| $25,000 to $34,999 | 0 (0.0%) | 3 (15.8%) |
| $35,000 to $49,999 | 6 (31.6%) | 4 (21.0%) |
| $50,000 to $74,999 | 3 (15.8%) | 0 (0.0%) |
| $75,000 to $99,999 | 0 (0.0%) | 6 (31.6%) |
| $100,000 to $149,999 | 3 (15.8%) | 0 (0.0%) |
| $150,000 or more | 0 (0.0%) | 0 (0.0%) |
| Total | 19 (100.0%) | 19 (100.0%) |
Property Value to Household Income Ratio in Fairlee
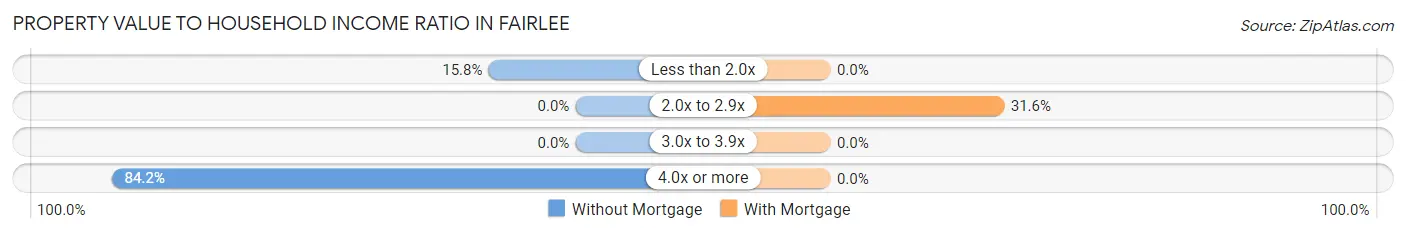
| Value-to-Income Ratio | Without Mortgage | With Mortgage |
| Less than 2.0x | 3 (15.8%) | 0 (0.0%) |
| 2.0x to 2.9x | 0 (0.0%) | 6 (31.6%) |
| 3.0x to 3.9x | 0 (0.0%) | 0 (0.0%) |
| 4.0x or more | 16 (84.2%) | 0 (0.0%) |
| Total | 19 (100.0%) | 19 (100.0%) |
Real Estate Taxes by Mortgage Status in Fairlee
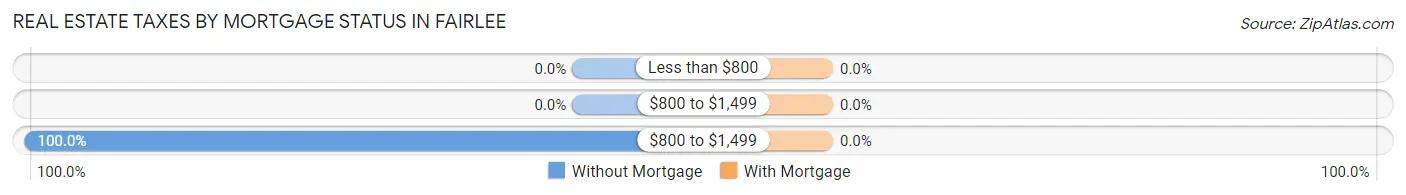
| Property Taxes | Without Mortgage | With Mortgage |
| Less than $800 | 0 (0.0%) | 0 (0.0%) |
| $800 to $1,499 | 0 (0.0%) | 0 (0.0%) |
| $800 to $1,499 | 19 (100.0%) | 0 (0.0%) |
| Total | 19 (100.0%) | 19 (100.0%) |
Health & Disability in Fairlee
Health Insurance Coverage by Age in Fairlee
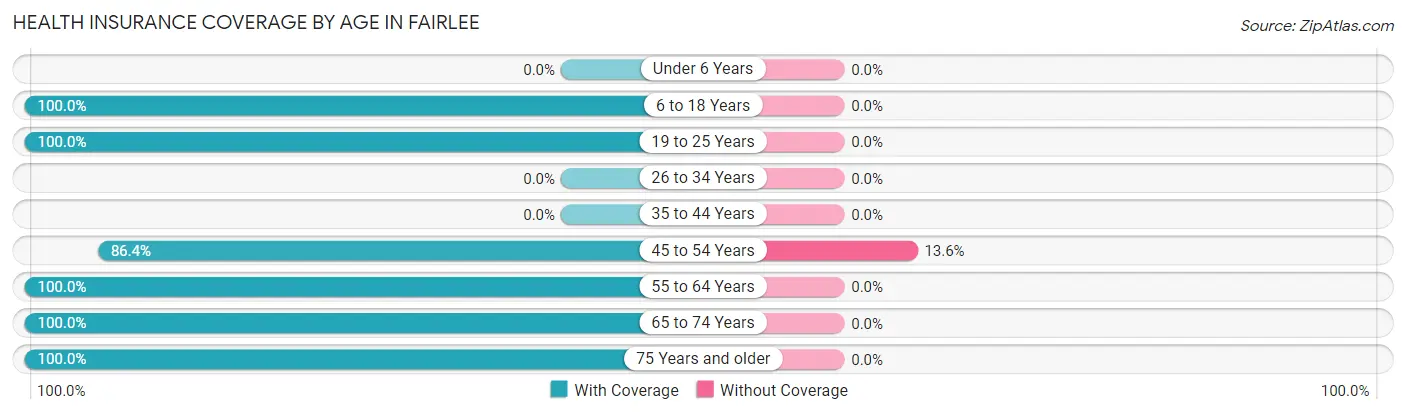
| Age Bracket | With Coverage | Without Coverage |
| Under 6 Years | 0 (0.0%) | 0 (0.0%) |
| 6 to 18 Years | 4 (100.0%) | 0 (0.0%) |
| 19 to 25 Years | 4 (100.0%) | 0 (0.0%) |
| 26 to 34 Years | 0 (0.0%) | 0 (0.0%) |
| 35 to 44 Years | 0 (0.0%) | 0 (0.0%) |
| 45 to 54 Years | 38 (86.4%) | 6 (13.6%) |
| 55 to 64 Years | 13 (100.0%) | 0 (0.0%) |
| 65 to 74 Years | 44 (100.0%) | 0 (0.0%) |
| 75 Years and older | 10 (100.0%) | 0 (0.0%) |
| Total | 113 (95.0%) | 6 (5.0%) |
Health Insurance Coverage by Citizenship Status in Fairlee
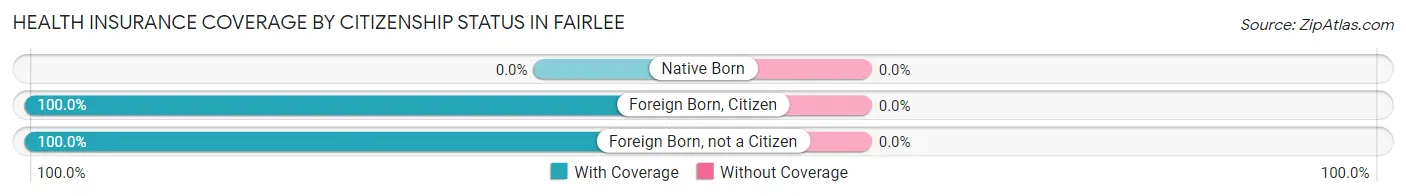
| Citizenship Status | With Coverage | Without Coverage |
| Native Born | 0 (0.0%) | 0 (0.0%) |
| Foreign Born, Citizen | 4 (100.0%) | 0 (0.0%) |
| Foreign Born, not a Citizen | 4 (100.0%) | 0 (0.0%) |
Health Insurance Coverage by Household Income in Fairlee
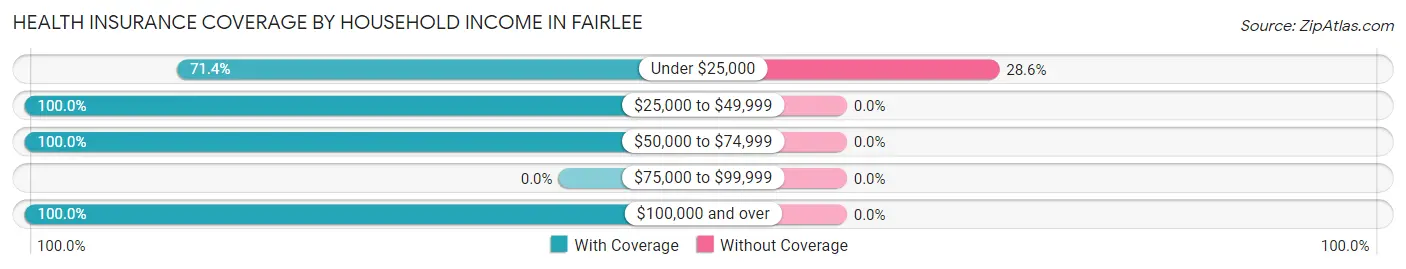
| Household Income | With Coverage | Without Coverage |
| Under $25,000 | 15 (71.4%) | 6 (28.6%) |
| $25,000 to $49,999 | 16 (100.0%) | 0 (0.0%) |
| $50,000 to $74,999 | 54 (100.0%) | 0 (0.0%) |
| $75,000 to $99,999 | 0 (0.0%) | 0 (0.0%) |
| $100,000 and over | 28 (100.0%) | 0 (0.0%) |
Public vs Private Health Insurance Coverage by Age in Fairlee
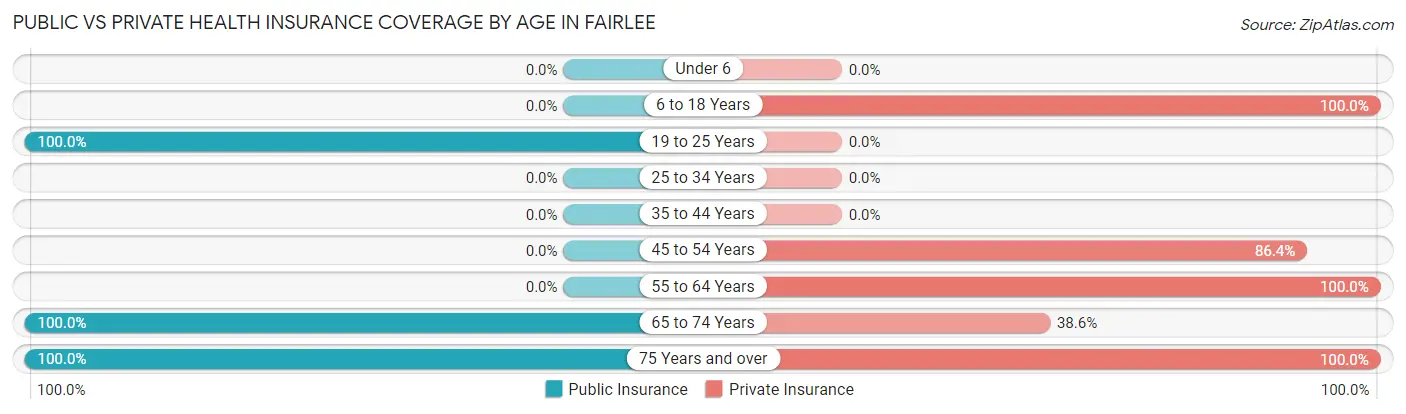
| Age Bracket | Public Insurance | Private Insurance |
| Under 6 | 0 (0.0%) | 0 (0.0%) |
| 6 to 18 Years | 0 (0.0%) | 4 (100.0%) |
| 19 to 25 Years | 4 (100.0%) | 0 (0.0%) |
| 25 to 34 Years | 0 (0.0%) | 0 (0.0%) |
| 35 to 44 Years | 0 (0.0%) | 0 (0.0%) |
| 45 to 54 Years | 0 (0.0%) | 38 (86.4%) |
| 55 to 64 Years | 0 (0.0%) | 13 (100.0%) |
| 65 to 74 Years | 44 (100.0%) | 17 (38.6%) |
| 75 Years and over | 10 (100.0%) | 10 (100.0%) |
| Total | 58 (48.7%) | 82 (68.9%) |
Disability Status by Sex by Age in Fairlee
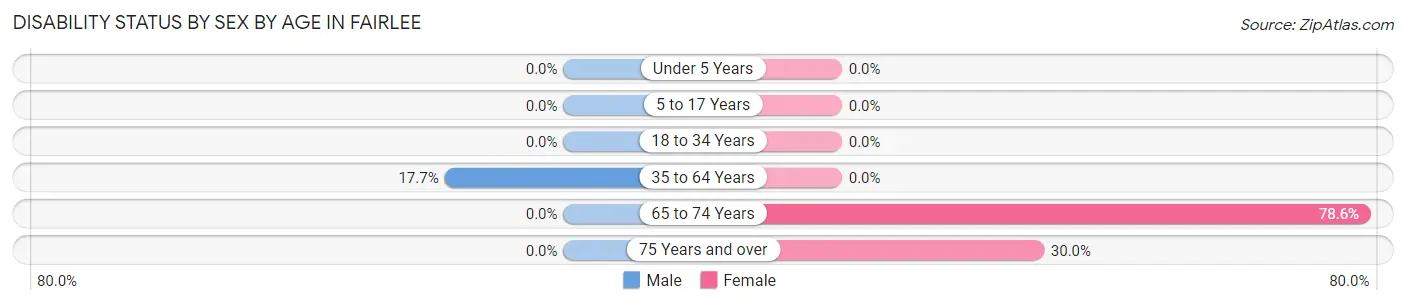
| Age Bracket | Male | Female |
| Under 5 Years | 0 (0.0%) | 0 (0.0%) |
| 5 to 17 Years | 0 (0.0%) | 0 (0.0%) |
| 18 to 34 Years | 0 (0.0%) | 0 (0.0%) |
| 35 to 64 Years | 6 (17.6%) | 0 (0.0%) |
| 65 to 74 Years | 0 (0.0%) | 11 (78.6%) |
| 75 Years and over | 0 (0.0%) | 3 (30.0%) |
Disability Class by Sex by Age in Fairlee
Disability Class: Hearing Difficulty
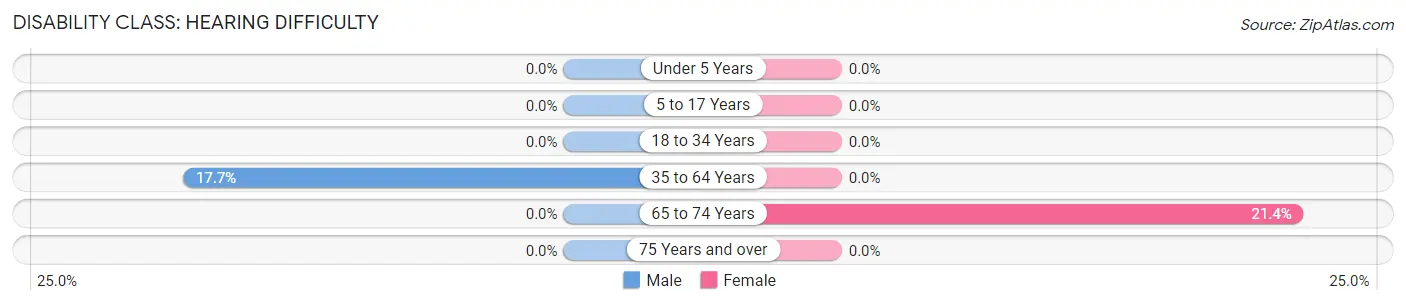
| Age Bracket | Male | Female |
| Under 5 Years | 0 (0.0%) | 0 (0.0%) |
| 5 to 17 Years | 0 (0.0%) | 0 (0.0%) |
| 18 to 34 Years | 0 (0.0%) | 0 (0.0%) |
| 35 to 64 Years | 6 (17.6%) | 0 (0.0%) |
| 65 to 74 Years | 0 (0.0%) | 3 (21.4%) |
| 75 Years and over | 0 (0.0%) | 0 (0.0%) |
Disability Class: Vision Difficulty
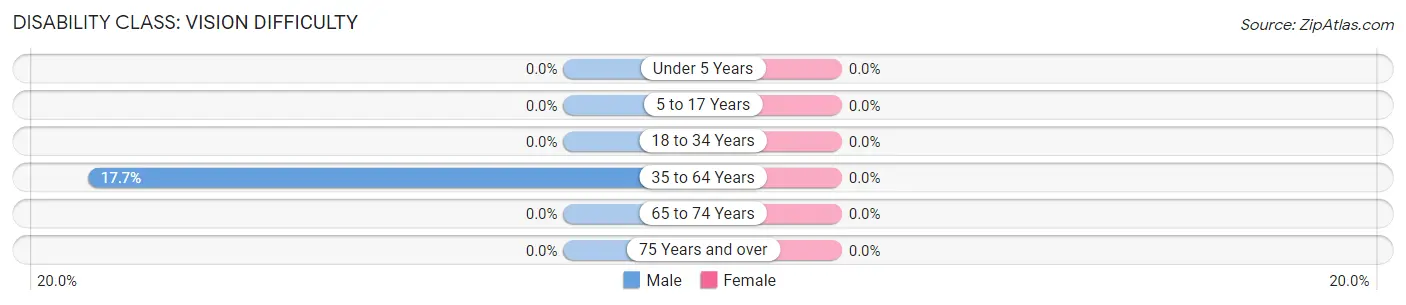
| Age Bracket | Male | Female |
| Under 5 Years | 0 (0.0%) | 0 (0.0%) |
| 5 to 17 Years | 0 (0.0%) | 0 (0.0%) |
| 18 to 34 Years | 0 (0.0%) | 0 (0.0%) |
| 35 to 64 Years | 6 (17.6%) | 0 (0.0%) |
| 65 to 74 Years | 0 (0.0%) | 0 (0.0%) |
| 75 Years and over | 0 (0.0%) | 0 (0.0%) |
Disability Class: Cognitive Difficulty
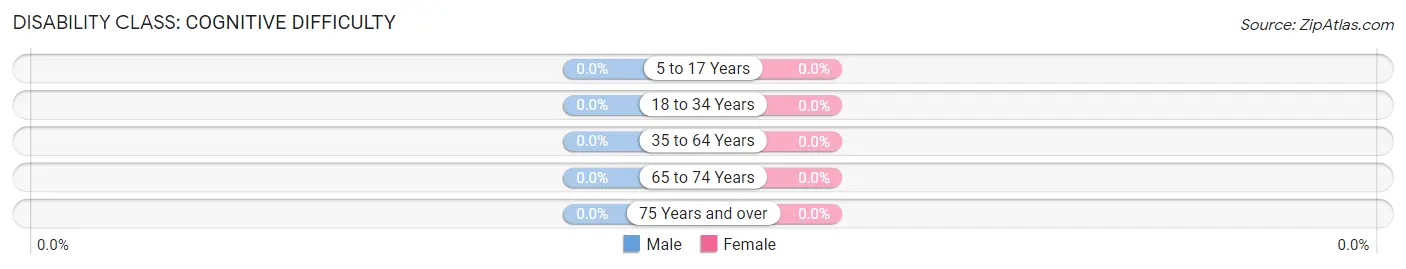
| Age Bracket | Male | Female |
| 5 to 17 Years | 0 (0.0%) | 0 (0.0%) |
| 18 to 34 Years | 0 (0.0%) | 0 (0.0%) |
| 35 to 64 Years | 0 (0.0%) | 0 (0.0%) |
| 65 to 74 Years | 0 (0.0%) | 0 (0.0%) |
| 75 Years and over | 0 (0.0%) | 0 (0.0%) |
Disability Class: Ambulatory Difficulty
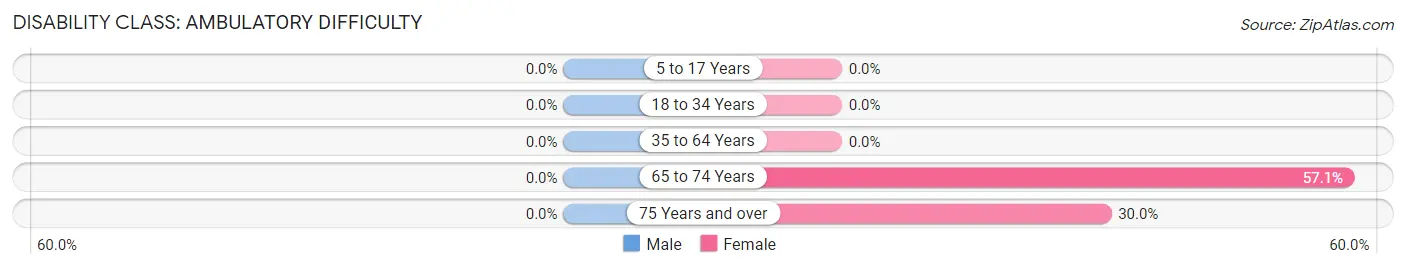
| Age Bracket | Male | Female |
| 5 to 17 Years | 0 (0.0%) | 0 (0.0%) |
| 18 to 34 Years | 0 (0.0%) | 0 (0.0%) |
| 35 to 64 Years | 0 (0.0%) | 0 (0.0%) |
| 65 to 74 Years | 0 (0.0%) | 8 (57.1%) |
| 75 Years and over | 0 (0.0%) | 3 (30.0%) |
Disability Class: Self-Care Difficulty
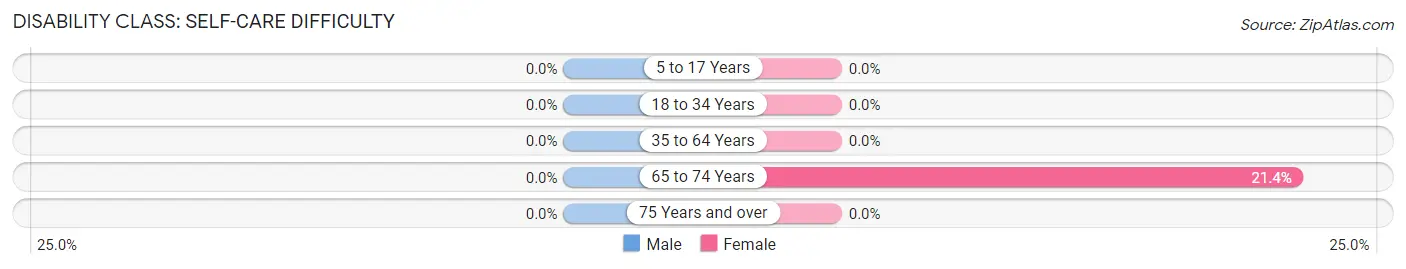
| Age Bracket | Male | Female |
| 5 to 17 Years | 0 (0.0%) | 0 (0.0%) |
| 18 to 34 Years | 0 (0.0%) | 0 (0.0%) |
| 35 to 64 Years | 0 (0.0%) | 0 (0.0%) |
| 65 to 74 Years | 0 (0.0%) | 3 (21.4%) |
| 75 Years and over | 0 (0.0%) | 0 (0.0%) |
Technology Access in Fairlee
Computing Device Access in Fairlee
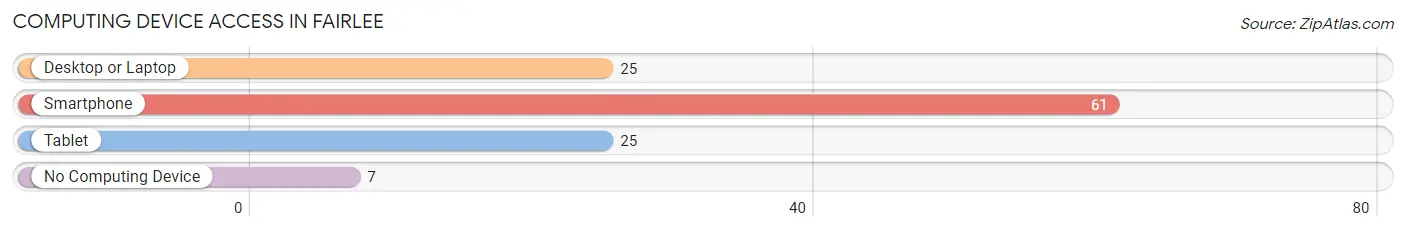
| Device Type | # Households | % Households |
| Desktop or Laptop | 25 | 33.3% |
| Smartphone | 61 | 81.3% |
| Tablet | 25 | 33.3% |
| No Computing Device | 7 | 9.3% |
| Total | 75 | 100.0% |
Internet Access in Fairlee
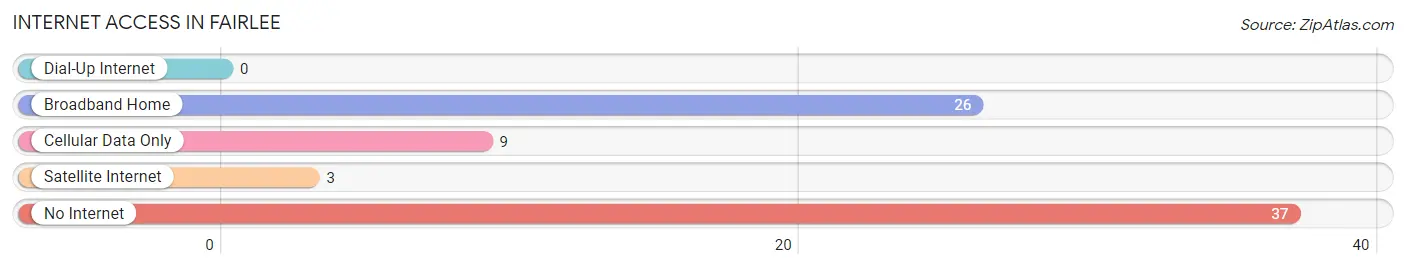
| Internet Type | # Households | % Households |
| Dial-Up Internet | 0 | 0.0% |
| Broadband Home | 26 | 34.7% |
| Cellular Data Only | 9 | 12.0% |
| Satellite Internet | 3 | 4.0% |
| No Internet | 37 | 49.3% |
| Total | 75 | 100.0% |
Fairlee Summary
Fairlee is a town located in Orange County, Vermont, United States. The population was 1,717 at the 2010 census. It is part of the Upper Valley region of Vermont and New Hampshire.
History
The area that is now Fairlee was first settled in 1781 by a group of settlers from Massachusetts. The town was originally called "Newbury Gore" after the town of Newbury, Massachusetts. In 1797, the town was renamed Fairlee after the Earl of Fairlee, a British nobleman.
The town was an agricultural community for much of its history, with dairy farming being the primary industry. In the late 19th century, the town became a popular summer resort destination, with several large hotels being built in the area.
Geography
Fairlee is located in the Upper Valley region of Vermont and New Hampshire. It is bordered by the towns of Bradford to the north, Vershire to the east, Thetford to the south, and West Fairlee to the west.
The town is situated on the eastern shore of Lake Fairlee, a large lake that is part of the Connecticut River watershed. The town is also home to several smaller bodies of water, including the Fairlee Brook, the North Branch of the Ompompanoosuc River, and the South Branch of the Ompompanoosuc River.
The town is located in the Green Mountains, with several peaks rising above 2,000 feet. The highest point in the town is the summit of Mount Moosilauke, which has an elevation of 4,802 feet.
Economy
The economy of Fairlee is largely based on tourism and recreation. The town is home to several popular summer resorts, including the Fairlee Motel and the Fairlee Inn. The town is also home to several campgrounds, including the Fairlee Campground and the Fairlee Beach Campground.
The town is also home to several small businesses, including a general store, a hardware store, and a gas station. The town is also home to several farms, including the Fairlee Farm and the Fairlee Dairy Farm.
Demographics
As of the 2010 census, there were 1,717 people, 745 households, and 463 families residing in the town. The population density was 57.2 people per square mile (22.1/km2). There were 845 housing units at an average density of 28.2 per square mile (10.9/km2). The racial makeup of the town was 97.2% White, 0.5% African American, 0.2% Native American, 0.2% Asian, 0.1% Pacific Islander, 0.4% from other races, and 1.4% from two or more races. Hispanic or Latino of any race were 1.2% of the population.
There were 745 households, out of which 28.2% had children under the age of 18 living with them, 48.2% were married couples living together, 9.7% had a female householder with no husband present, and 37.2% were non-families. 30.2% of all households were made up of individuals, and 11.2% had someone living alone who was 65 years of age or older. The average household size was 2.30 and the average family size was 2.86.
In the town, the population was spread out, with 23.2% under the age of 18, 6.2% from 18 to 24, 28.2% from 25 to 44, 28.2% from 45 to 64, and 14.2% who were 65 years of age or older. The median age was 40 years. For every 100 females, there were 97.2 males. For every 100 females age 18 and over, there were 94.2 males.
The median income for a household in the town was $41,250, and the median income for a family was $50,000. Males had a median income of $35,000 versus $25,000 for females. The per capita income for the town was $20,945. About 5.2% of families and 8.2% of the population were below the poverty line, including 8.2% of those under age 18 and 8.2% of those age 65 or over.
Common Questions
What is Per Capita Income in Fairlee?
Per Capita income in Fairlee is $38,083.
What is the Median Household income in Fairlee?
Median Household Income in Fairlee is $57,625.
What is Income or Wage Gap in Fairlee?
Income or Wage Gap in Fairlee is 30.3%.
Women in Fairlee earn 69.7 cents for every dollar earned by a man.
What is Inequality or Gini Index in Fairlee?
Inequality or Gini Index in Fairlee is 0.33.
What is the Total Population of Fairlee?
Total Population of Fairlee is 119.
What is the Total Male Population of Fairlee?
Total Male Population of Fairlee is 66.
What is the Total Female Population of Fairlee?
Total Female Population of Fairlee is 53.
What is the Ratio of Males per 100 Females in Fairlee?
There are 124.53 Males per 100 Females in Fairlee.
What is the Ratio of Females per 100 Males in Fairlee?
There are 80.30 Females per 100 Males in Fairlee.
What is the Median Population Age in Fairlee?
Median Population Age in Fairlee is 59.5 Years.
What is the Average Family Size in Fairlee
Average Family Size in Fairlee is 2.4 People.
What is the Average Household Size in Fairlee
Average Household Size in Fairlee is 1.6 People.
How Large is the Labor Force in Fairlee?
There are 61 People in the Labor Forcein in Fairlee.
What is the Percentage of People in the Labor Force in Fairlee?
52.1% of People are in the Labor Force in Fairlee.
What is the Unemployment Rate in Fairlee?
Unemployment Rate in Fairlee is 4.9%.