St Albans, VT Map & Demographics
St Albans Map
St Albans Overview
$27,640
PER CAPITA INCOME
$65,714
AVG FAMILY INCOME
$49,736
AVG HOUSEHOLD INCOME
21.9%
WAGE / INCOME GAP [ % ]
78.1¢/ $1
WAGE / INCOME GAP [ $ ]
$15,362
FAMILY INCOME DEFICIT
0.42
INEQUALITY / GINI INDEX
6,891
TOTAL POPULATION
3,206
MALE POPULATION
3,685
FEMALE POPULATION
87.00
MALES / 100 FEMALES
114.94
FEMALES / 100 MALES
36.8
MEDIAN AGE
3.1
AVG FAMILY SIZE
2.4
AVG HOUSEHOLD SIZE
3,375
LABOR FORCE [ PEOPLE ]
59.7%
PERCENT IN LABOR FORCE
2.2%
UNEMPLOYMENT RATE
Income in St Albans
Income Overview in St Albans
Per Capita Income in St Albans is $27,640, while median incomes of families and households are $65,714 and $49,736 respectively.
| Characteristic | Number | Measure |
| Per Capita Income | 6,891 | $27,640 |
| Median Family Income | 1,680 | $65,714 |
| Mean Family Income | 1,680 | $73,010 |
| Median Household Income | 2,862 | $49,736 |
| Mean Household Income | 2,862 | $62,672 |
| Income Deficit | 1,680 | $15,362 |
| Wage / Income Gap (%) | 6,891 | 21.90% |
| Wage / Income Gap ($) | 6,891 | 78.10¢ per $1 |
| Gini / Inequality Index | 6,891 | 0.42 |
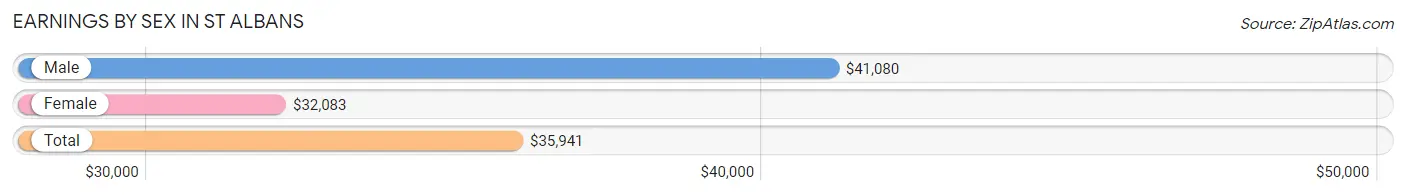
Earnings by Sex in St Albans
Average Earnings in St Albans are $35,941, $41,080 for men and $32,083 for women, a difference of 21.9%.
| Sex | Number | Average Earnings |
| Male | 1,868 (50.7%) | $41,080 |
| Female | 1,814 (49.3%) | $32,083 |
| Total | 3,682 (100.0%) | $35,941 |
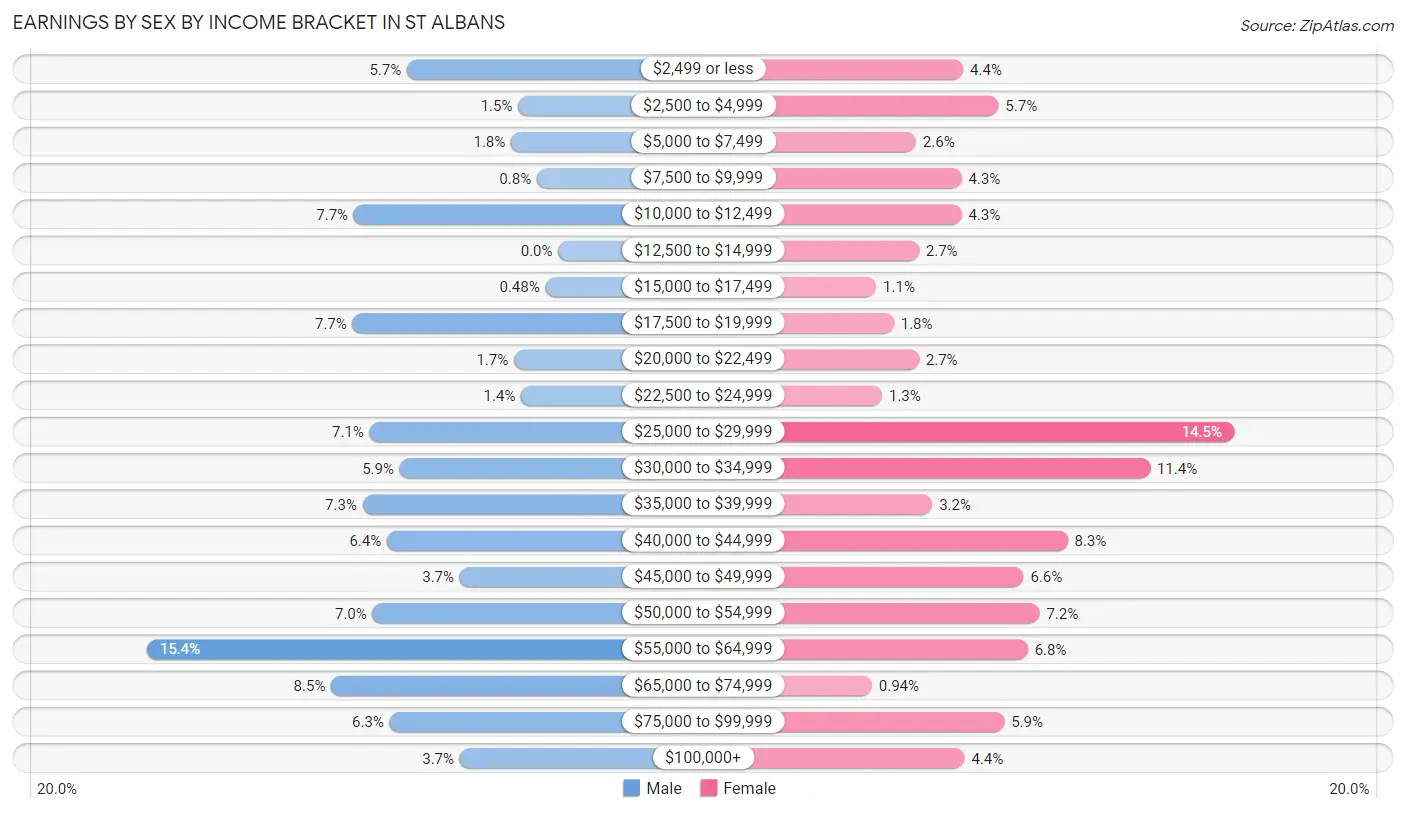
Earnings by Sex by Income Bracket in St Albans
The most common earnings brackets in St Albans are $55,000 to $64,999 for men (288 | 15.4%) and $25,000 to $29,999 for women (263 | 14.5%).
| Income | Male | Female |
| $2,499 or less | 106 (5.7%) | 79 (4.4%) |
| $2,500 to $4,999 | 28 (1.5%) | 103 (5.7%) |
| $5,000 to $7,499 | 33 (1.8%) | 47 (2.6%) |
| $7,500 to $9,999 | 15 (0.8%) | 78 (4.3%) |
| $10,000 to $12,499 | 143 (7.7%) | 78 (4.3%) |
| $12,500 to $14,999 | 0 (0.0%) | 49 (2.7%) |
| $15,000 to $17,499 | 9 (0.5%) | 20 (1.1%) |
| $17,500 to $19,999 | 144 (7.7%) | 32 (1.8%) |
| $20,000 to $22,499 | 31 (1.7%) | 49 (2.7%) |
| $22,500 to $24,999 | 26 (1.4%) | 24 (1.3%) |
| $25,000 to $29,999 | 132 (7.1%) | 263 (14.5%) |
| $30,000 to $34,999 | 111 (5.9%) | 206 (11.4%) |
| $35,000 to $39,999 | 137 (7.3%) | 58 (3.2%) |
| $40,000 to $44,999 | 120 (6.4%) | 150 (8.3%) |
| $45,000 to $49,999 | 69 (3.7%) | 120 (6.6%) |
| $50,000 to $54,999 | 130 (7.0%) | 131 (7.2%) |
| $55,000 to $64,999 | 288 (15.4%) | 123 (6.8%) |
| $65,000 to $74,999 | 159 (8.5%) | 17 (0.9%) |
| $75,000 to $99,999 | 118 (6.3%) | 107 (5.9%) |
| $100,000+ | 69 (3.7%) | 80 (4.4%) |
| Total | 1,868 (100.0%) | 1,814 (100.0%) |
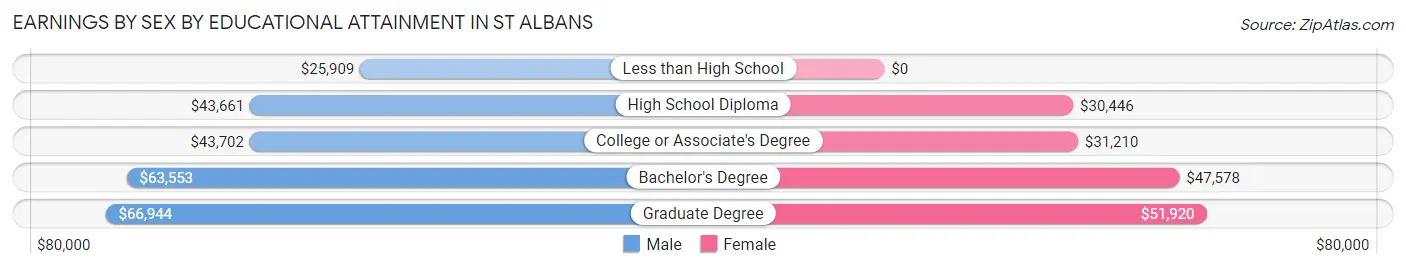
Earnings by Sex by Educational Attainment in St Albans
Average earnings in St Albans are $47,422 for men and $35,025 for women, a difference of 26.1%. Men with an educational attainment of graduate degree enjoy the highest average annual earnings of $66,944, while those with less than high school education earn the least with $25,909. Women with an educational attainment of graduate degree earn the most with the average annual earnings of $51,920, while those with high school diploma education have the smallest earnings of $30,446.
| Educational Attainment | Male Income | Female Income |
| Less than High School | $25,909 | $0 |
| High School Diploma | $43,661 | $30,446 |
| College or Associate's Degree | $43,702 | $31,210 |
| Bachelor's Degree | $63,553 | $47,578 |
| Graduate Degree | $66,944 | $51,920 |
| Total | $47,422 | $35,025 |
Family Income in St Albans
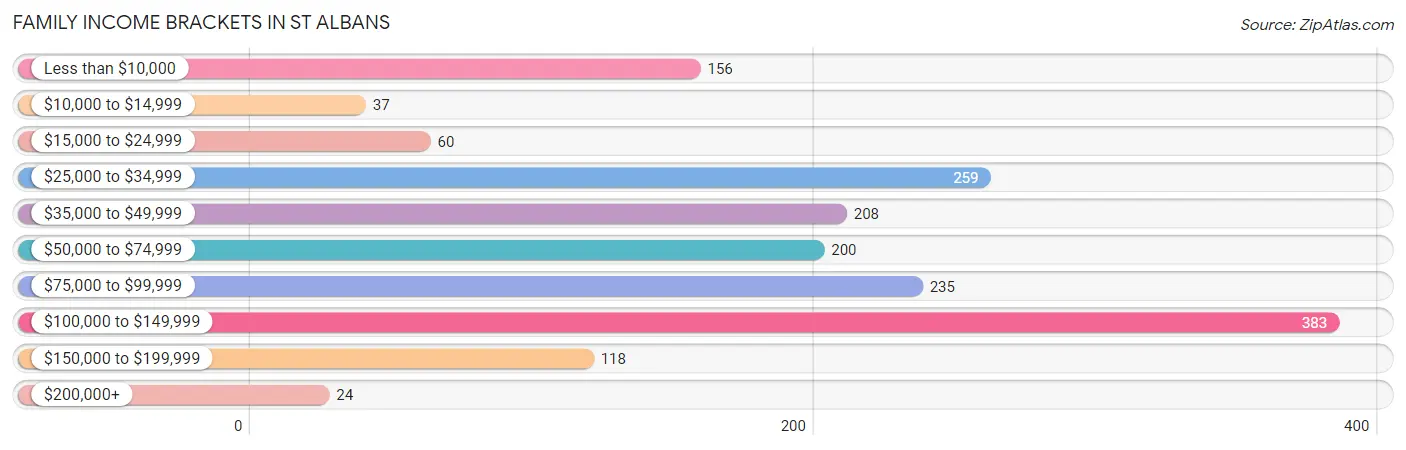
Family Income Brackets in St Albans
According to the St Albans family income data, there are 383 families falling into the $100,000 to $149,999 income range, which is the most common income bracket and makes up 22.8% of all families. Conversely, the $200,000+ income bracket is the least frequent group with only 24 families (1.4%) belonging to this category.
| Income Bracket | # Families | % Families |
| Less than $10,000 | 156 | 9.3% |
| $10,000 to $14,999 | 37 | 2.2% |
| $15,000 to $24,999 | 60 | 3.6% |
| $25,000 to $34,999 | 259 | 15.4% |
| $35,000 to $49,999 | 208 | 12.4% |
| $50,000 to $74,999 | 200 | 11.9% |
| $75,000 to $99,999 | 235 | 14.0% |
| $100,000 to $149,999 | 383 | 22.8% |
| $150,000 to $199,999 | 118 | 7.0% |
| $200,000+ | 24 | 1.4% |
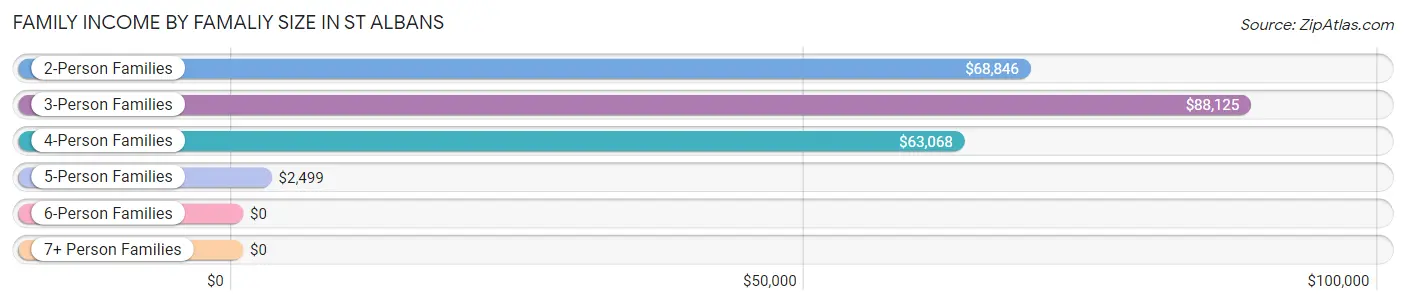
Family Income by Famaliy Size in St Albans
3-person families (467 | 27.8%) account for the highest median family income in St Albans with $88,125 per family, while 2-person families (910 | 54.2%) have the highest median income of $34,423 per family member.
| Income Bracket | # Families | Median Income |
| 2-Person Families | 910 (54.2%) | $68,846 |
| 3-Person Families | 467 (27.8%) | $88,125 |
| 4-Person Families | 151 (9.0%) | $63,068 |
| 5-Person Families | 101 (6.0%) | $2,499 |
| 6-Person Families | 28 (1.7%) | $0 |
| 7+ Person Families | 23 (1.4%) | $0 |
| Total | 1,680 (100.0%) | $65,714 |
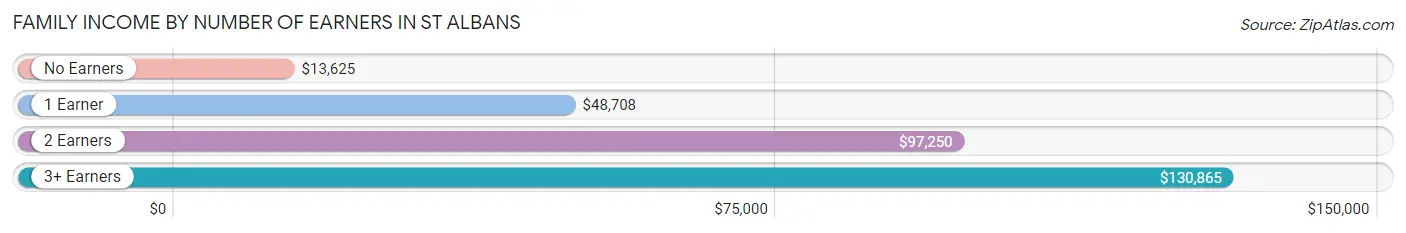
Family Income by Number of Earners in St Albans
The median family income in St Albans is $65,714, with families comprising 3+ earners (198) having the highest median family income of $130,865, while families with no earners (375) have the lowest median family income of $13,625, accounting for 11.8% and 22.3% of families, respectively.
| Number of Earners | # Families | Median Income |
| No Earners | 375 (22.3%) | $13,625 |
| 1 Earner | 529 (31.5%) | $48,708 |
| 2 Earners | 578 (34.4%) | $97,250 |
| 3+ Earners | 198 (11.8%) | $130,865 |
| Total | 1,680 (100.0%) | $65,714 |
Household Income in St Albans
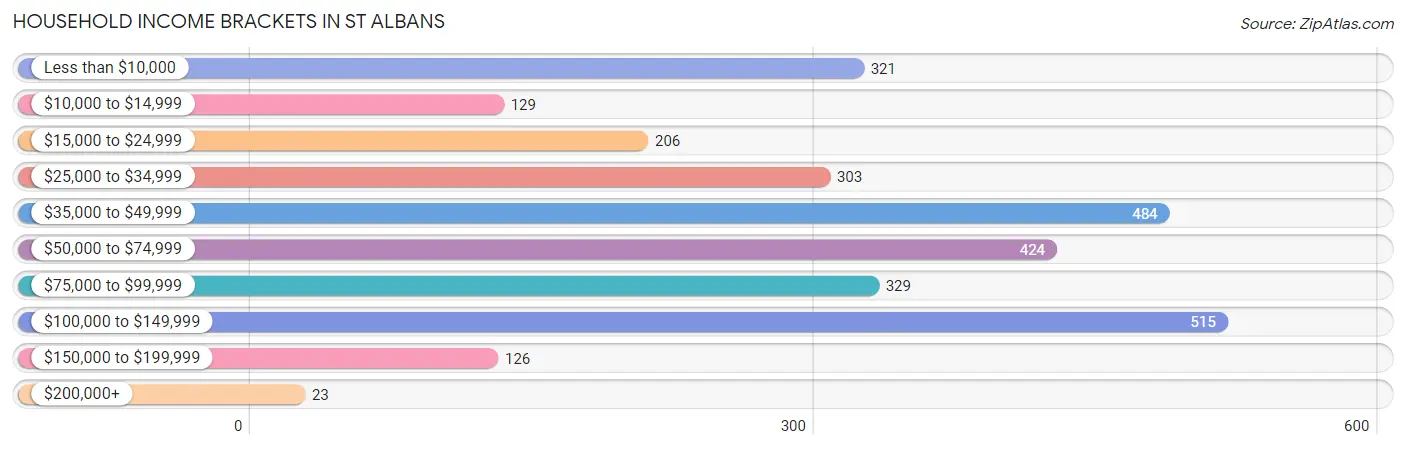
Household Income Brackets in St Albans
With 515 households falling in the category, the $100,000 to $149,999 income range is the most frequent in St Albans, accounting for 18.0% of all households. In contrast, only 23 households (0.8%) fall into the $200,000+ income bracket, making it the least populous group.
| Income Bracket | # Households | % Households |
| Less than $10,000 | 321 | 11.2% |
| $10,000 to $14,999 | 129 | 4.5% |
| $15,000 to $24,999 | 206 | 7.2% |
| $25,000 to $34,999 | 303 | 10.6% |
| $35,000 to $49,999 | 484 | 16.9% |
| $50,000 to $74,999 | 424 | 14.8% |
| $75,000 to $99,999 | 329 | 11.5% |
| $100,000 to $149,999 | 515 | 18.0% |
| $150,000 to $199,999 | 126 | 4.4% |
| $200,000+ | 23 | 0.8% |
Household Income by Householder Age in St Albans
The median household income in St Albans is $49,736, with the highest median household income of $58,852 found in the 45 to 64 years age bracket for the primary householder. A total of 952 households (33.3%) fall into this category. Meanwhile, the 15 to 24 years age bracket for the primary householder has the lowest median household income of $0, with 65 households (2.3%) in this group.
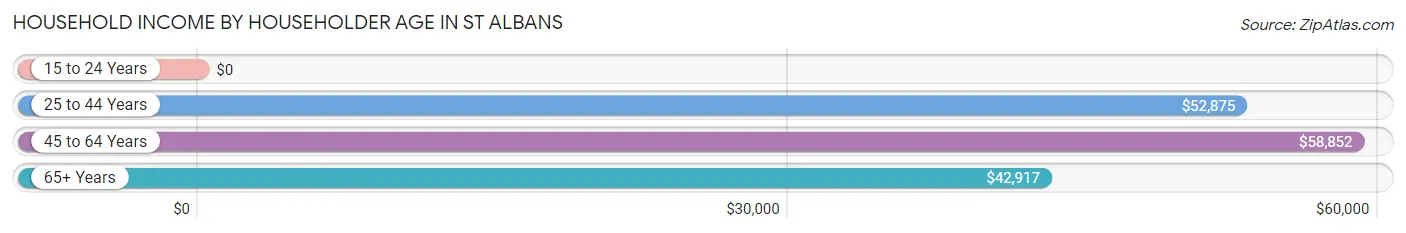
| Income Bracket | # Households | Median Income |
| 15 to 24 Years | 65 (2.3%) | $0 |
| 25 to 44 Years | 1,109 (38.8%) | $52,875 |
| 45 to 64 Years | 952 (33.3%) | $58,852 |
| 65+ Years | 736 (25.7%) | $42,917 |
| Total | 2,862 (100.0%) | $49,736 |
Poverty in St Albans
Income Below Poverty by Sex and Age in St Albans
With 18.0% poverty level for males and 21.1% for females among the residents of St Albans, 6 to 11 year old males and 18 to 24 year old females are the most vulnerable to poverty, with 170 males (65.4%) and 189 females (47.7%) in their respective age groups living below the poverty level.
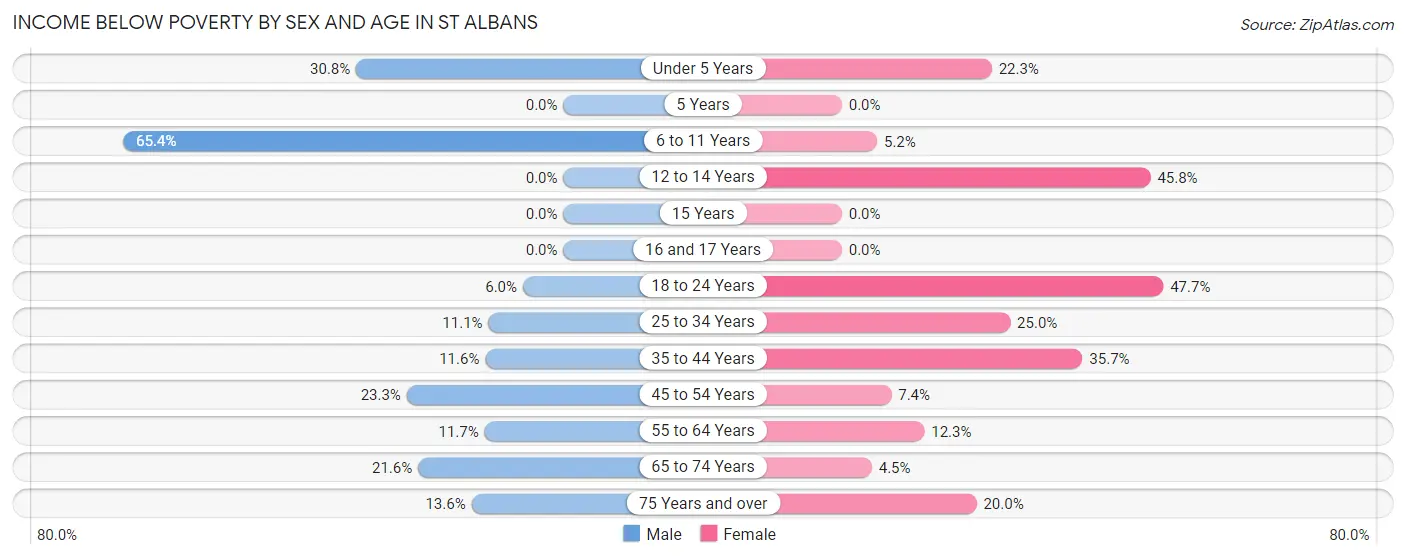
| Age Bracket | Male | Female |
| Under 5 Years | 52 (30.8%) | 67 (22.3%) |
| 5 Years | 0 (0.0%) | 0 (0.0%) |
| 6 to 11 Years | 170 (65.4%) | 9 (5.2%) |
| 12 to 14 Years | 0 (0.0%) | 33 (45.8%) |
| 15 Years | 0 (0.0%) | 0 (0.0%) |
| 16 and 17 Years | 0 (0.0%) | 0 (0.0%) |
| 18 to 24 Years | 20 (6.0%) | 189 (47.7%) |
| 25 to 34 Years | 70 (11.1%) | 135 (25.0%) |
| 35 to 44 Years | 37 (11.6%) | 209 (35.7%) |
| 45 to 54 Years | 110 (23.3%) | 23 (7.3%) |
| 55 to 64 Years | 46 (11.7%) | 56 (12.2%) |
| 65 to 74 Years | 52 (21.6%) | 22 (4.4%) |
| 75 Years and over | 15 (13.6%) | 31 (20.0%) |
| Total | 572 (18.0%) | 774 (21.1%) |
Income Above Poverty by Sex and Age in St Albans
According to the poverty statistics in St Albans, males aged 5 years and females aged 5 years are the age groups that are most secure financially, with 100.0% of males and 100.0% of females in these age groups living above the poverty line.
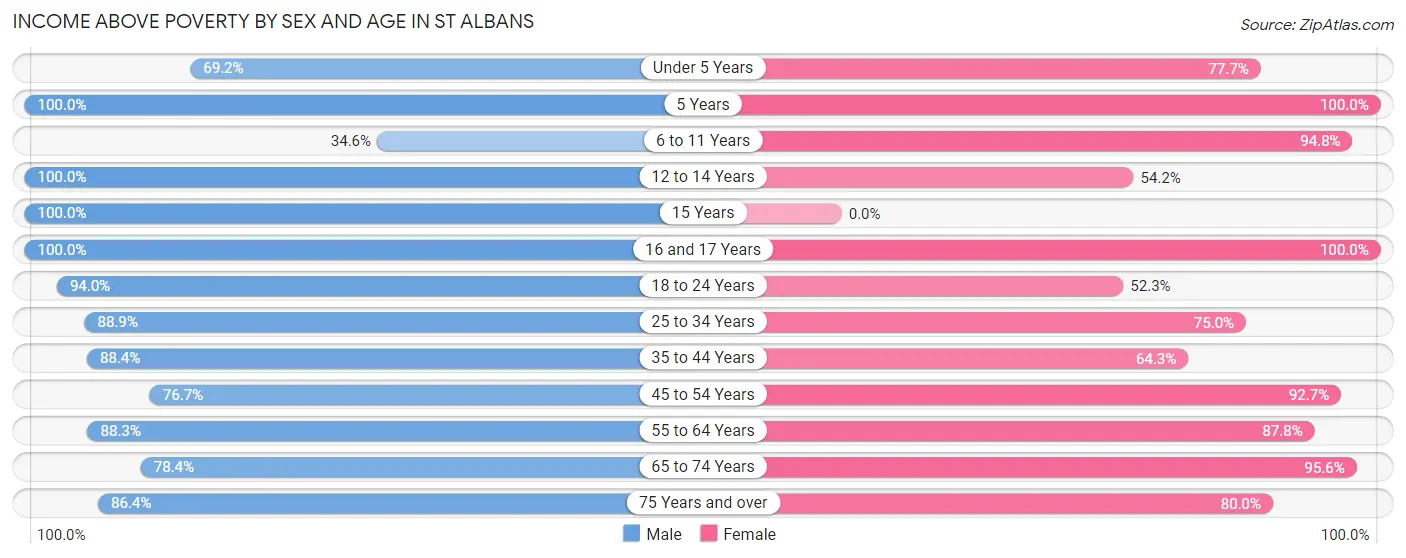
| Age Bracket | Male | Female |
| Under 5 Years | 117 (69.2%) | 234 (77.7%) |
| 5 Years | 17 (100.0%) | 44 (100.0%) |
| 6 to 11 Years | 90 (34.6%) | 163 (94.8%) |
| 12 to 14 Years | 142 (100.0%) | 39 (54.2%) |
| 15 Years | 40 (100.0%) | 0 (0.0%) |
| 16 and 17 Years | 52 (100.0%) | 133 (100.0%) |
| 18 to 24 Years | 313 (94.0%) | 207 (52.3%) |
| 25 to 34 Years | 559 (88.9%) | 405 (75.0%) |
| 35 to 44 Years | 282 (88.4%) | 376 (64.3%) |
| 45 to 54 Years | 363 (76.7%) | 290 (92.6%) |
| 55 to 64 Years | 347 (88.3%) | 401 (87.7%) |
| 65 to 74 Years | 189 (78.4%) | 472 (95.6%) |
| 75 Years and over | 95 (86.4%) | 124 (80.0%) |
| Total | 2,606 (82.0%) | 2,888 (78.9%) |
Income Below Poverty Among Married-Couple Families in St Albans
The poverty statistics for married-couple families in St Albans show that 6.4% or 69 of the total 1,085 families live below the poverty line. Families with no children have the highest poverty rate of 8.4%, comprising of 69 families. On the other hand, families with 1 or 2 children have the lowest poverty rate of 0.0%, which includes 0 families.
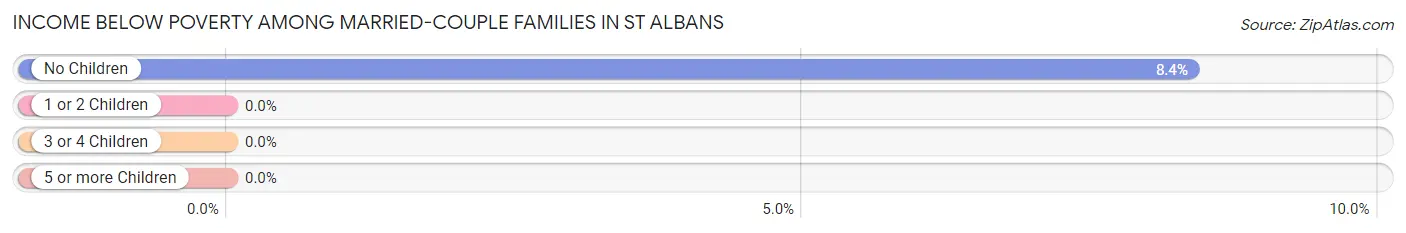
| Children | Above Poverty | Below Poverty |
| No Children | 755 (91.6%) | 69 (8.4%) |
| 1 or 2 Children | 231 (100.0%) | 0 (0.0%) |
| 3 or 4 Children | 30 (100.0%) | 0 (0.0%) |
| 5 or more Children | 0 (0.0%) | 0 (0.0%) |
| Total | 1,016 (93.6%) | 69 (6.4%) |
Income Below Poverty Among Single-Parent Households in St Albans
According to the poverty data in St Albans, 24.0% or 30 single-father households and 33.0% or 155 single-mother households are living below the poverty line. Among single-father households, those with 3 or 4 children have the highest poverty rate, with 7 households (100.0%) experiencing poverty. Likewise, among single-mother households, those with 3 or 4 children have the highest poverty rate, with 31 households (52.5%) falling below the poverty line.
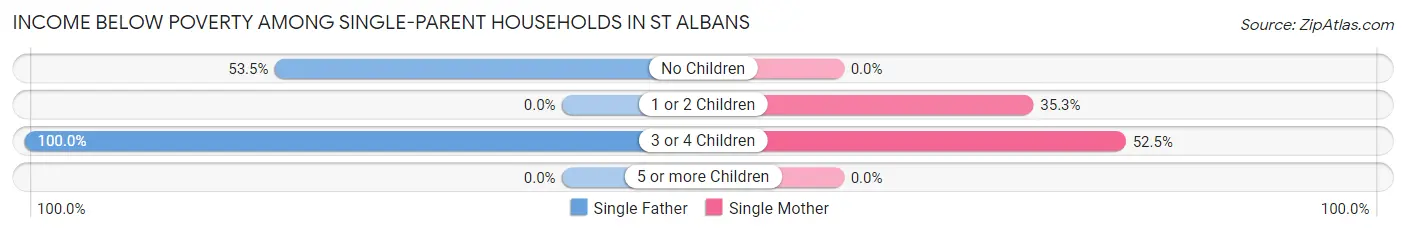
| Children | Single Father | Single Mother |
| No Children | 23 (53.5%) | 0 (0.0%) |
| 1 or 2 Children | 0 (0.0%) | 124 (35.3%) |
| 3 or 4 Children | 7 (100.0%) | 31 (52.5%) |
| 5 or more Children | 0 (0.0%) | 0 (0.0%) |
| Total | 30 (24.0%) | 155 (33.0%) |
Income Below Poverty Among Married-Couple vs Single-Parent Households in St Albans
The poverty data for St Albans shows that 69 of the married-couple family households (6.4%) and 185 of the single-parent households (31.1%) are living below the poverty level. Within the married-couple family households, those with no children have the highest poverty rate, with 69 households (8.4%) falling below the poverty line. Among the single-parent households, those with 3 or 4 children have the highest poverty rate, with 38 household (57.6%) living below poverty.
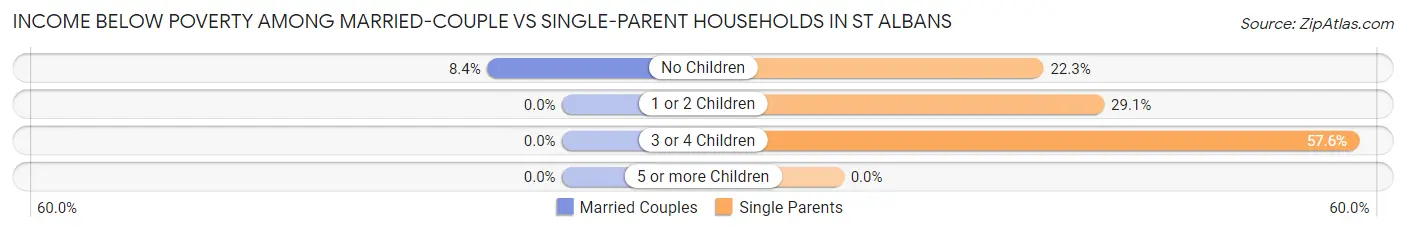
| Children | Married-Couple Families | Single-Parent Households |
| No Children | 69 (8.4%) | 23 (22.3%) |
| 1 or 2 Children | 0 (0.0%) | 124 (29.1%) |
| 3 or 4 Children | 0 (0.0%) | 38 (57.6%) |
| 5 or more Children | 0 (0.0%) | 0 (0.0%) |
| Total | 69 (6.4%) | 185 (31.1%) |
Race in St Albans
The most populous races in St Albans are White / Caucasian (6,211 | 90.1%), Two or more Races (444 | 6.4%), and Native / Alaskan (111 | 1.6%).
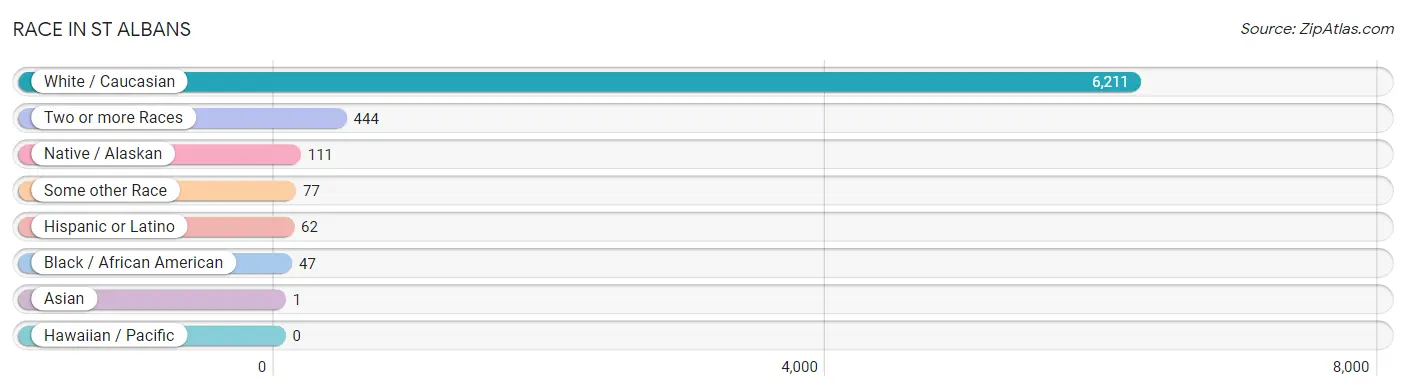
| Race | # Population | % Population |
| Asian | 1 | 0.0% |
| Black / African American | 47 | 0.7% |
| Hawaiian / Pacific | 0 | 0.0% |
| Hispanic or Latino | 62 | 0.9% |
| Native / Alaskan | 111 | 1.6% |
| White / Caucasian | 6,211 | 90.1% |
| Two or more Races | 444 | 6.4% |
| Some other Race | 77 | 1.1% |
| Total | 6,891 | 100.0% |
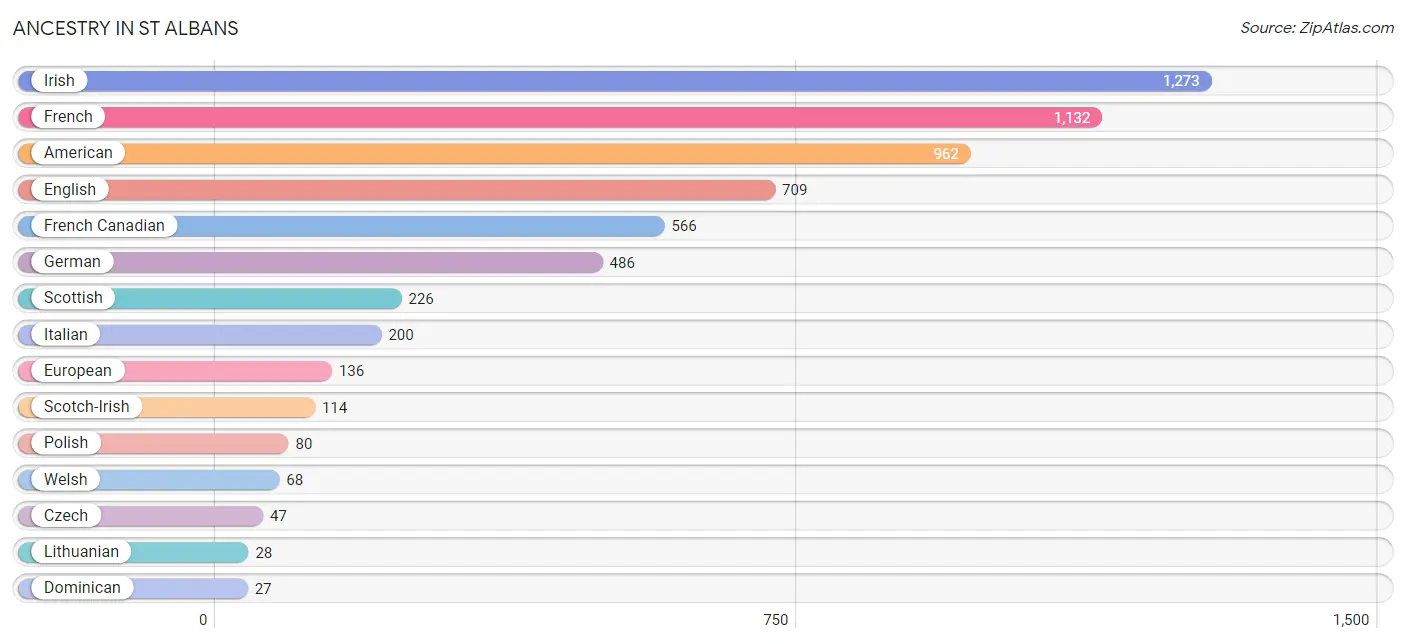
Ancestry in St Albans
The most populous ancestries reported in St Albans are Irish (1,273 | 18.5%), French (1,132 | 16.4%), American (962 | 14.0%), English (709 | 10.3%), and French Canadian (566 | 8.2%), together accounting for 67.4% of all St Albans residents.
| Ancestry | # Population | % Population |
| American | 962 | 14.0% |
| Arab | 22 | 0.3% |
| British | 11 | 0.2% |
| Canadian | 26 | 0.4% |
| Czech | 47 | 0.7% |
| Dominican | 27 | 0.4% |
| Eastern European | 12 | 0.2% |
| English | 709 | 10.3% |
| European | 136 | 2.0% |
| French | 1,132 | 16.4% |
| French American Indian | 9 | 0.1% |
| French Canadian | 566 | 8.2% |
| German | 486 | 7.0% |
| Greek | 10 | 0.2% |
| Guyanese | 7 | 0.1% |
| Hungarian | 13 | 0.2% |
| Irish | 1,273 | 18.5% |
| Italian | 200 | 2.9% |
| Jamaican | 21 | 0.3% |
| Laotian | 13 | 0.2% |
| Lebanese | 22 | 0.3% |
| Lithuanian | 28 | 0.4% |
| Mexican | 11 | 0.2% |
| Native Hawaiian | 17 | 0.3% |
| Northern European | 8 | 0.1% |
| Norwegian | 11 | 0.2% |
| Peruvian | 24 | 0.4% |
| Polish | 80 | 1.2% |
| Scandinavian | 26 | 0.4% |
| Scotch-Irish | 114 | 1.7% |
| Scottish | 226 | 3.3% |
| Serbian | 14 | 0.2% |
| South American | 24 | 0.4% |
| Swedish | 22 | 0.3% |
| Thai | 1 | 0.0% |
| Ukrainian | 12 | 0.2% |
| Welsh | 68 | 1.0% |
| Yugoslavian | 17 | 0.3% | View All 38 Rows |
Immigrants in St Albans
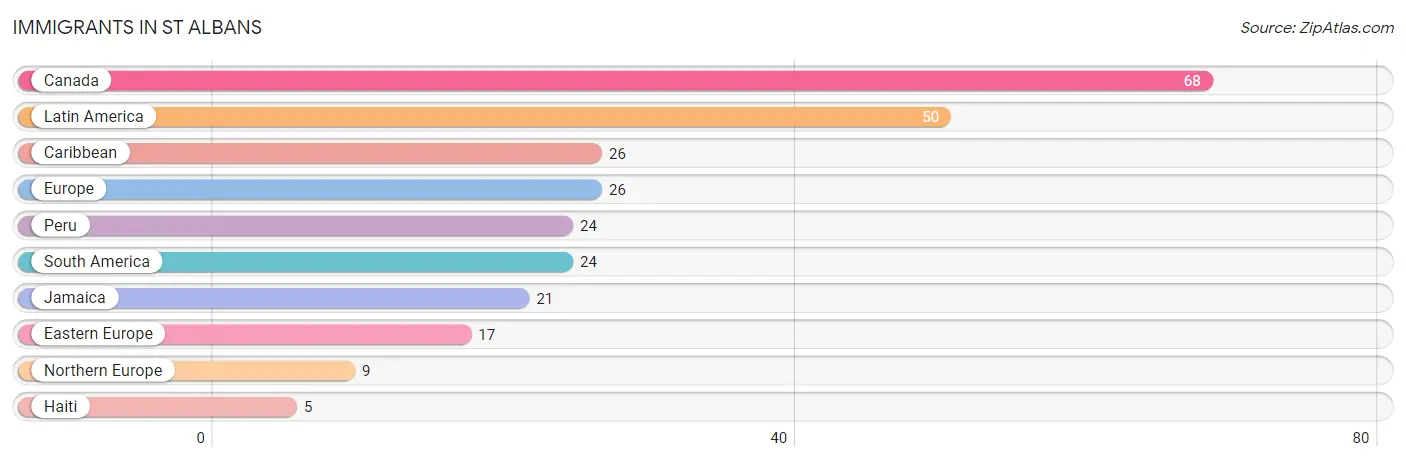
The most numerous immigrant groups reported in St Albans came from Canada (68 | 1.0%), Latin America (50 | 0.7%), Caribbean (26 | 0.4%), Europe (26 | 0.4%), and Peru (24 | 0.4%), together accounting for 2.8% of all St Albans residents.
| Immigration Origin | # Population | % Population |
| Canada | 68 | 1.0% |
| Caribbean | 26 | 0.4% |
| Eastern Europe | 17 | 0.3% |
| Europe | 26 | 0.4% |
| Haiti | 5 | 0.1% |
| Jamaica | 21 | 0.3% |
| Latin America | 50 | 0.7% |
| Northern Europe | 9 | 0.1% |
| Peru | 24 | 0.4% |
| South America | 24 | 0.4% | View All 10 Rows |
Sex and Age in St Albans
Sex and Age in St Albans
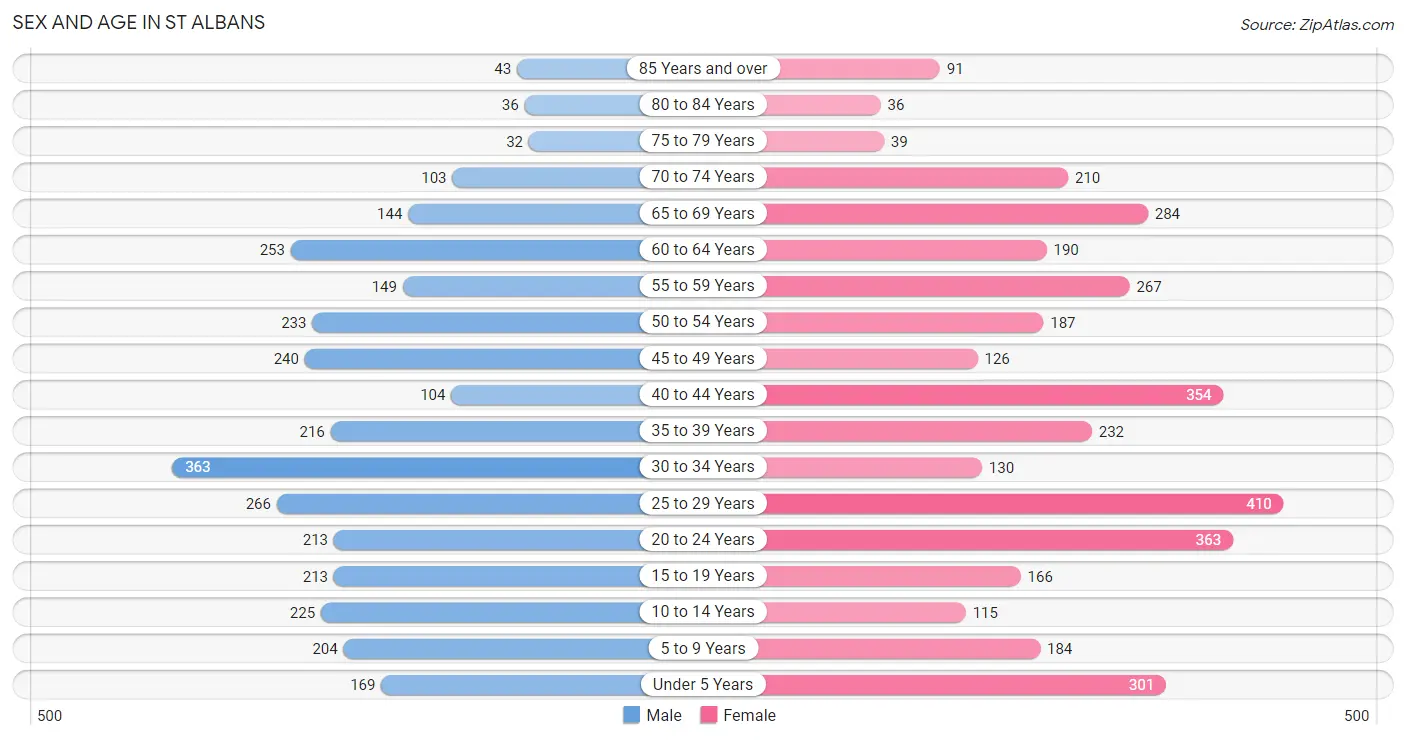
The most populous age groups in St Albans are 30 to 34 Years (363 | 11.3%) for men and 25 to 29 Years (410 | 11.1%) for women.
| Age Bracket | Male | Female |
| Under 5 Years | 169 (5.3%) | 301 (8.2%) |
| 5 to 9 Years | 204 (6.4%) | 184 (5.0%) |
| 10 to 14 Years | 225 (7.0%) | 115 (3.1%) |
| 15 to 19 Years | 213 (6.6%) | 166 (4.5%) |
| 20 to 24 Years | 213 (6.6%) | 363 (9.9%) |
| 25 to 29 Years | 266 (8.3%) | 410 (11.1%) |
| 30 to 34 Years | 363 (11.3%) | 130 (3.5%) |
| 35 to 39 Years | 216 (6.7%) | 232 (6.3%) |
| 40 to 44 Years | 104 (3.2%) | 354 (9.6%) |
| 45 to 49 Years | 240 (7.5%) | 126 (3.4%) |
| 50 to 54 Years | 233 (7.3%) | 187 (5.1%) |
| 55 to 59 Years | 149 (4.6%) | 267 (7.2%) |
| 60 to 64 Years | 253 (7.9%) | 190 (5.2%) |
| 65 to 69 Years | 144 (4.5%) | 284 (7.7%) |
| 70 to 74 Years | 103 (3.2%) | 210 (5.7%) |
| 75 to 79 Years | 32 (1.0%) | 39 (1.1%) |
| 80 to 84 Years | 36 (1.1%) | 36 (1.0%) |
| 85 Years and over | 43 (1.3%) | 91 (2.5%) |
| Total | 3,206 (100.0%) | 3,685 (100.0%) |
Families and Households in St Albans
Median Family Size in St Albans
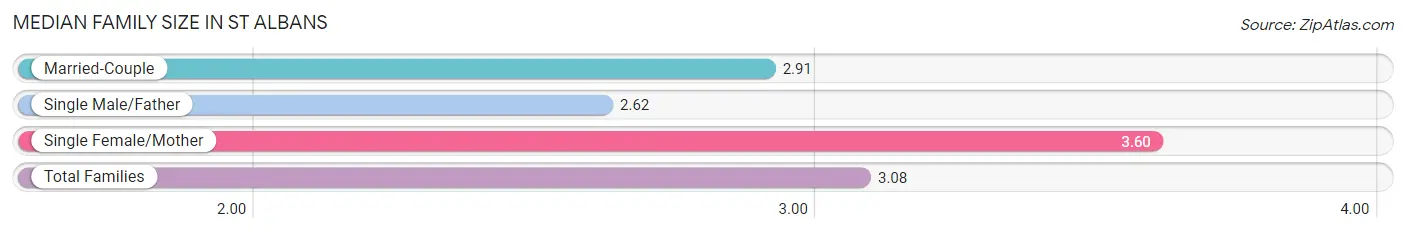
The median family size in St Albans is 3.08 persons per family, with single female/mother families (470 | 28.0%) accounting for the largest median family size of 3.6 persons per family. On the other hand, single male/father families (125 | 7.4%) represent the smallest median family size with 2.62 persons per family.
| Family Type | # Families | Family Size |
| Married-Couple | 1,085 (64.6%) | 2.91 |
| Single Male/Father | 125 (7.4%) | 2.62 |
| Single Female/Mother | 470 (28.0%) | 3.60 |
| Total Families | 1,680 (100.0%) | 3.08 |
Median Household Size in St Albans
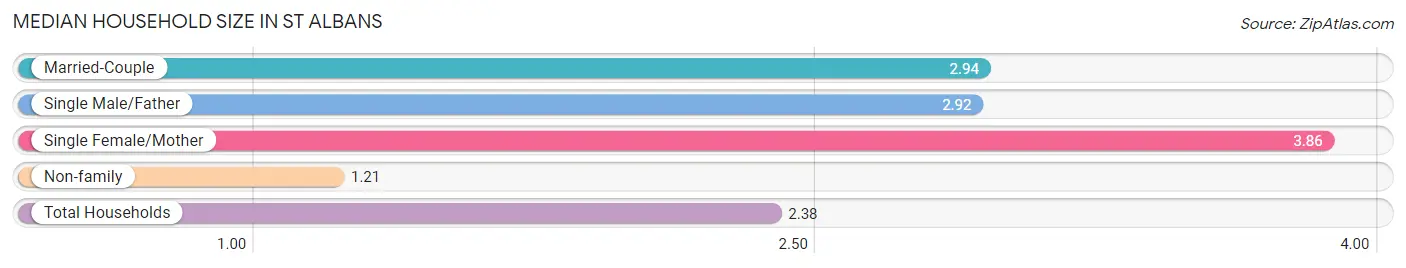
The median household size in St Albans is 2.38 persons per household, with single female/mother households (470 | 16.4%) accounting for the largest median household size of 3.86 persons per household. non-family households (1,182 | 41.3%) represent the smallest median household size with 1.21 persons per household.
| Household Type | # Households | Household Size |
| Married-Couple | 1,085 (37.9%) | 2.94 |
| Single Male/Father | 125 (4.4%) | 2.92 |
| Single Female/Mother | 470 (16.4%) | 3.86 |
| Non-family | 1,182 (41.3%) | 1.21 |
| Total Households | 2,862 (100.0%) | 2.38 |
Household Size by Marriage Status in St Albans
Out of a total of 2,862 households in St Albans, 1,680 (58.7%) are family households, while 1,182 (41.3%) are nonfamily households. The most numerous type of family households are 2-person households, comprising 847, and the most common type of nonfamily households are 1-person households, comprising 990.
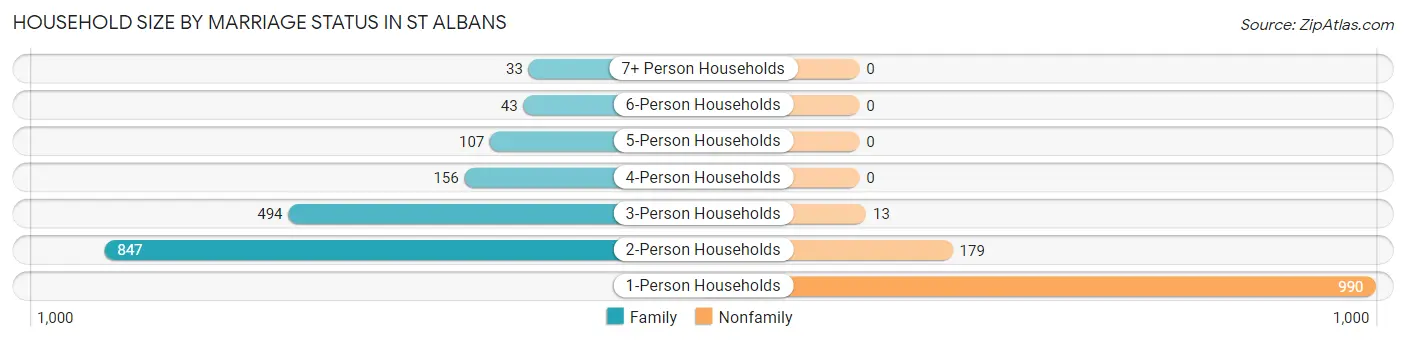
| Household Size | Family Households | Nonfamily Households |
| 1-Person Households | - | 990 (34.6%) |
| 2-Person Households | 847 (29.6%) | 179 (6.2%) |
| 3-Person Households | 494 (17.3%) | 13 (0.4%) |
| 4-Person Households | 156 (5.4%) | 0 (0.0%) |
| 5-Person Households | 107 (3.7%) | 0 (0.0%) |
| 6-Person Households | 43 (1.5%) | 0 (0.0%) |
| 7+ Person Households | 33 (1.1%) | 0 (0.0%) |
| Total | 1,680 (58.7%) | 1,182 (41.3%) |
Female Fertility in St Albans
Fertility by Age in St Albans
Average fertility rate in St Albans is 60.0 births per 1,000 women. Women in the age bracket of 20 to 34 years have the highest fertility rate with 69.0 births per 1,000 women. Women in the age bracket of 20 to 34 years acount for 56.9% of all women with births.
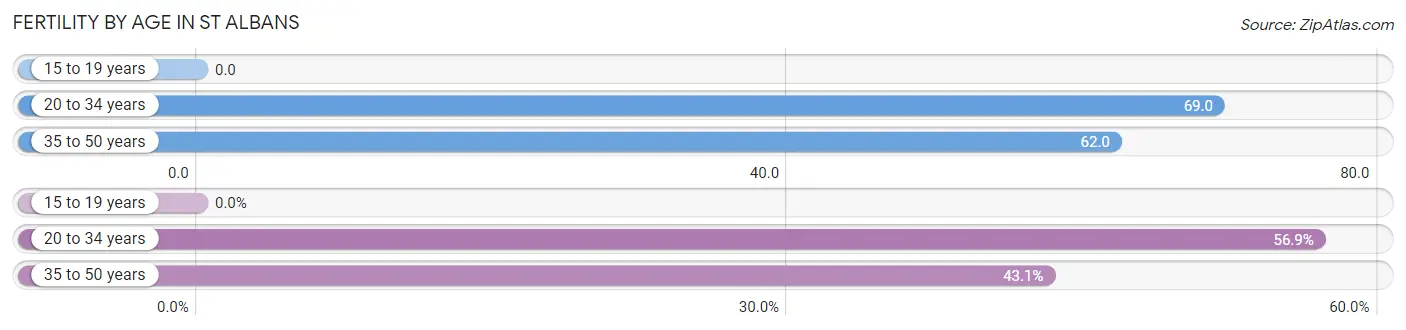
| Age Bracket | Women with Births | Births / 1,000 Women |
| 15 to 19 years | 0 (0.0%) | 0.0 |
| 20 to 34 years | 62 (56.9%) | 69.0 |
| 35 to 50 years | 47 (43.1%) | 62.0 |
| Total | 109 (100.0%) | 60.0 |
Fertility by Age by Marriage Status in St Albans
53.2% of women with births (109) in St Albans are married. The highest percentage of unmarried women with births falls into 35 to 50 years age bracket with 100.0% of them unmarried at the time of birth, while the lowest percentage of unmarried women with births belong to 20 to 34 years age bracket with 6.5% of them unmarried.
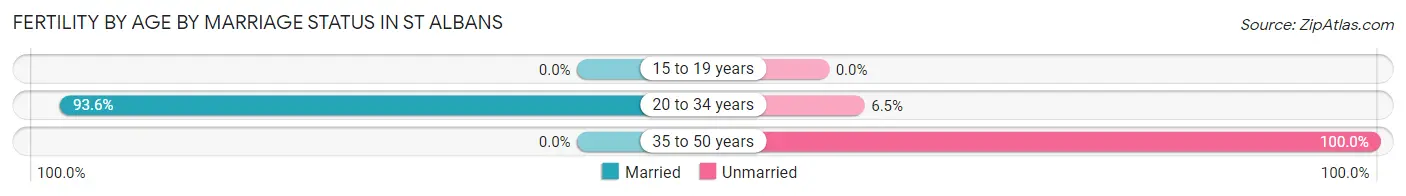
| Age Bracket | Married | Unmarried |
| 15 to 19 years | 0 (0.0%) | 0 (0.0%) |
| 20 to 34 years | 58 (93.5%) | 4 (6.5%) |
| 35 to 50 years | 0 (0.0%) | 47 (100.0%) |
| Total | 58 (53.2%) | 51 (46.8%) |
Fertility by Education in St Albans
Average fertility rate in St Albans is 60.0 births per 1,000 women. Women with the education attainment of college or associate's degree have the highest fertility rate of 106.0 births per 1,000 women, while women with the education attainment of less than high school have the lowest fertility at 12.0 births per 1,000 women. Women with the education attainment of college or associate's degree represent 43.1% of all women with births.
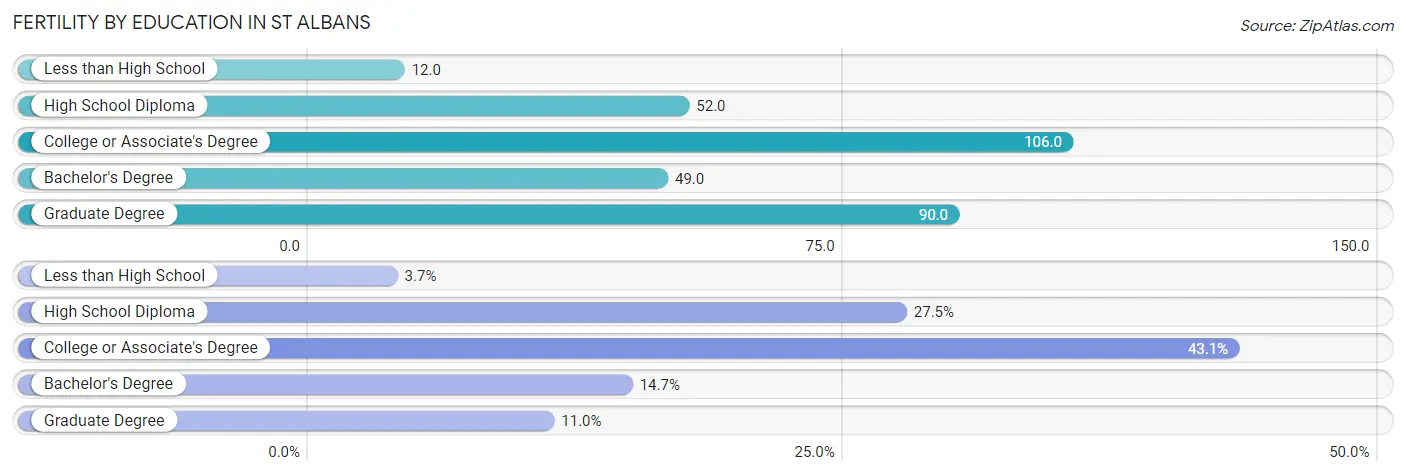
| Educational Attainment | Women with Births | Births / 1,000 Women |
| Less than High School | 4 (3.7%) | 12.0 |
| High School Diploma | 30 (27.5%) | 52.0 |
| College or Associate's Degree | 47 (43.1%) | 106.0 |
| Bachelor's Degree | 16 (14.7%) | 49.0 |
| Graduate Degree | 12 (11.0%) | 90.0 |
| Total | 109 (100.0%) | 60.0 |
Fertility by Education by Marriage Status in St Albans
46.8% of women with births in St Albans are unmarried. Women with the educational attainment of bachelor's degree are most likely to be married with 100.0% of them married at childbirth, while women with the educational attainment of less than high school are least likely to be married with 100.0% of them unmarried at childbirth.
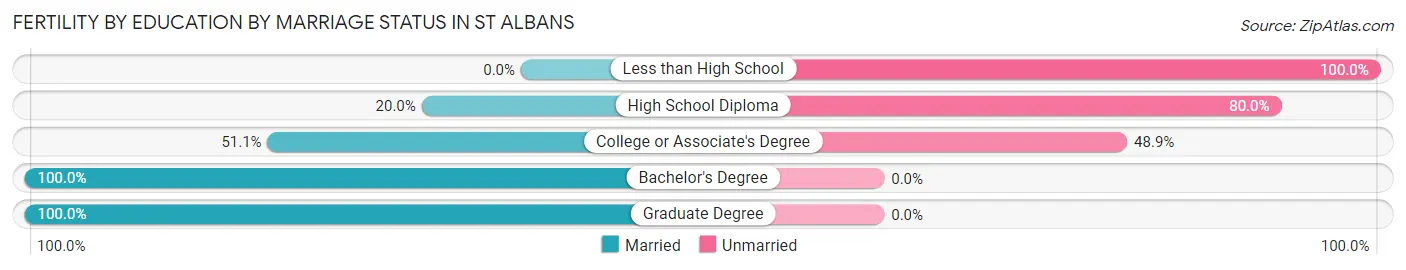
| Educational Attainment | Married | Unmarried |
| Less than High School | 0 (0.0%) | 4 (100.0%) |
| High School Diploma | 6 (20.0%) | 24 (80.0%) |
| College or Associate's Degree | 24 (51.1%) | 23 (48.9%) |
| Bachelor's Degree | 16 (100.0%) | 0 (0.0%) |
| Graduate Degree | 12 (100.0%) | 0 (0.0%) |
| Total | 58 (53.2%) | 51 (46.8%) |
Employment Characteristics in St Albans
Employment by Class of Employer in St Albans
Among the 3,164 employed individuals in St Albans, private company employees (2,134 | 67.4%), local government employees (338 | 10.7%), and not-for-profit organizations (320 | 10.1%) make up the most common classes of employment.
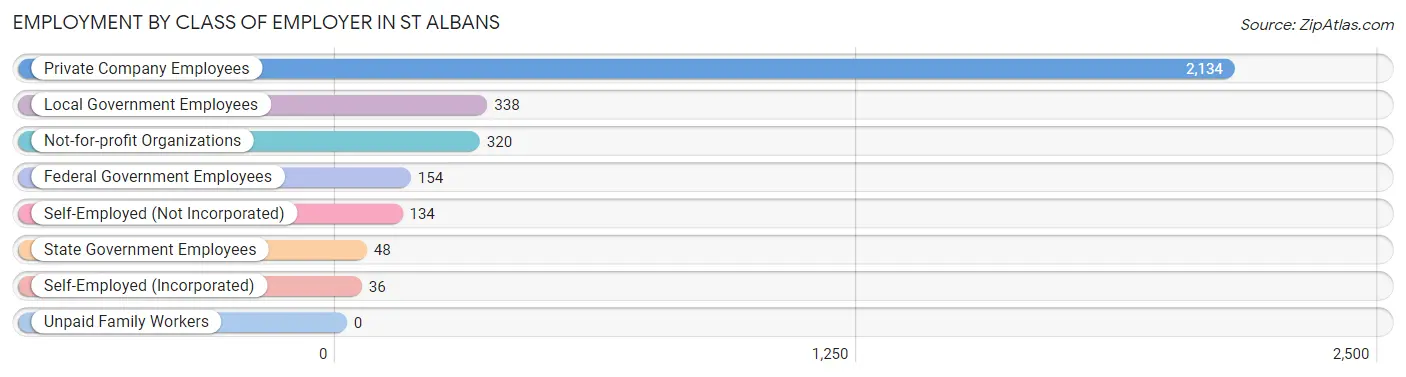
| Employer Class | # Employees | % Employees |
| Private Company Employees | 2,134 | 67.4% |
| Self-Employed (Incorporated) | 36 | 1.1% |
| Self-Employed (Not Incorporated) | 134 | 4.2% |
| Not-for-profit Organizations | 320 | 10.1% |
| Local Government Employees | 338 | 10.7% |
| State Government Employees | 48 | 1.5% |
| Federal Government Employees | 154 | 4.9% |
| Unpaid Family Workers | 0 | 0.0% |
| Total | 3,164 | 100.0% |
Employment Status by Age in St Albans
According to the labor force statistics for St Albans, out of the total population over 16 years of age (5,653), 59.7% or 3,375 individuals are in the labor force, with 2.2% or 74 of them unemployed. The age group with the highest labor force participation rate is 30 to 34 years, with 81.9% or 404 individuals in the labor force. Within the labor force, the 75 years and over age range has the highest percentage of unemployed individuals, with 37.5% or 6 of them being unemployed.
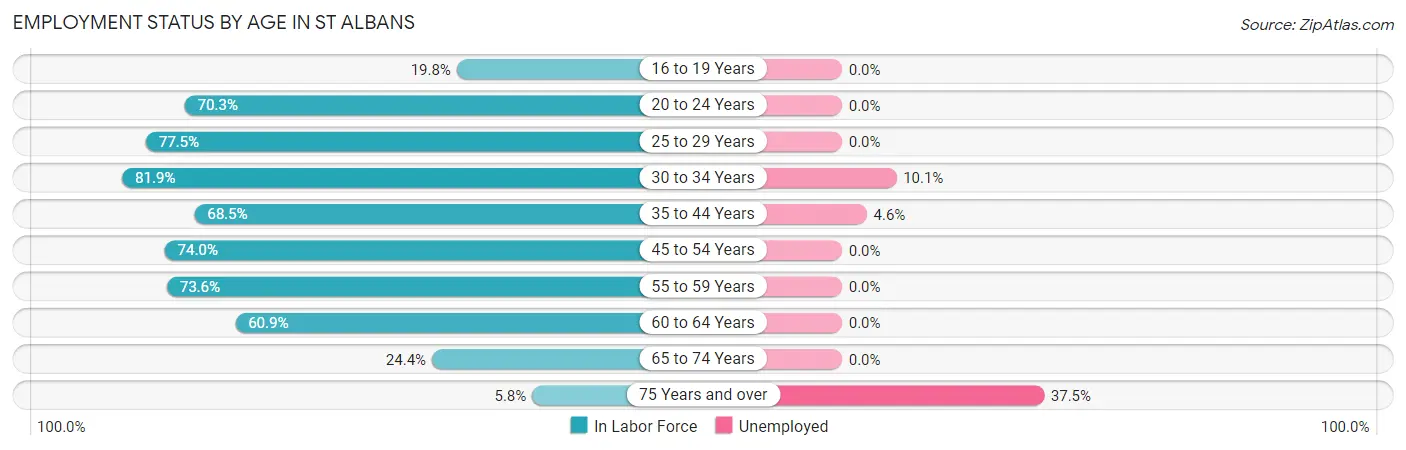
| Age Bracket | In Labor Force | Unemployed |
| 16 to 19 Years | 67 (19.8%) | 0 (0.0%) |
| 20 to 24 Years | 405 (70.3%) | 0 (0.0%) |
| 25 to 29 Years | 524 (77.5%) | 0 (0.0%) |
| 30 to 34 Years | 404 (81.9%) | 41 (10.1%) |
| 35 to 44 Years | 621 (68.5%) | 29 (4.6%) |
| 45 to 54 Years | 582 (74.0%) | 0 (0.0%) |
| 55 to 59 Years | 306 (73.6%) | 0 (0.0%) |
| 60 to 64 Years | 270 (60.9%) | 0 (0.0%) |
| 65 to 74 Years | 181 (24.4%) | 0 (0.0%) |
| 75 Years and over | 16 (5.8%) | 6 (37.5%) |
| Total | 3,375 (59.7%) | 74 (2.2%) |
Employment Status by Educational Attainment in St Albans
According to labor force statistics for St Albans, 72.8% of individuals (2,708) out of the total population between 25 and 64 years of age (3,720) are in the labor force, with 2.5% or 68 of them being unemployed. The group with the highest labor force participation rate are those with the educational attainment of bachelor's degree or higher, with 88.3% or 857 individuals in the labor force. Within the labor force, individuals with less than high school education have the highest percentage of unemployment, with 27.5% or 22 of them being unemployed.
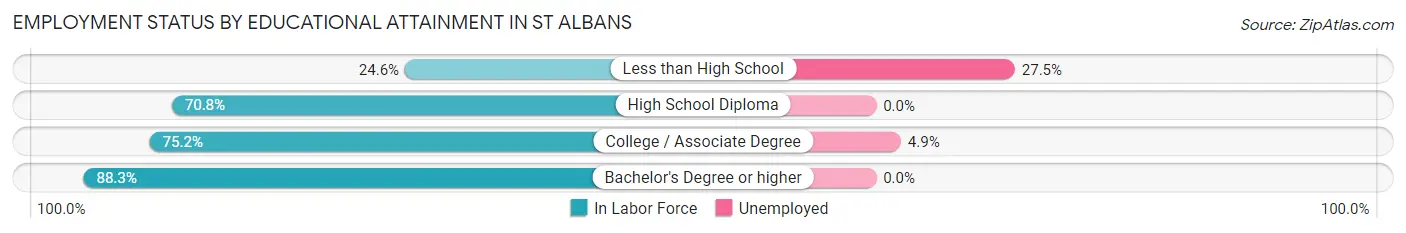
| Educational Attainment | In Labor Force | Unemployed |
| Less than High School | 80 (24.6%) | 89 (27.5%) |
| High School Diploma | 856 (70.8%) | 0 (0.0%) |
| College / Associate Degree | 914 (75.2%) | 60 (4.9%) |
| Bachelor's Degree or higher | 857 (88.3%) | 0 (0.0%) |
| Total | 2,708 (72.8%) | 93 (2.5%) |
Employment Occupations by Sex in St Albans
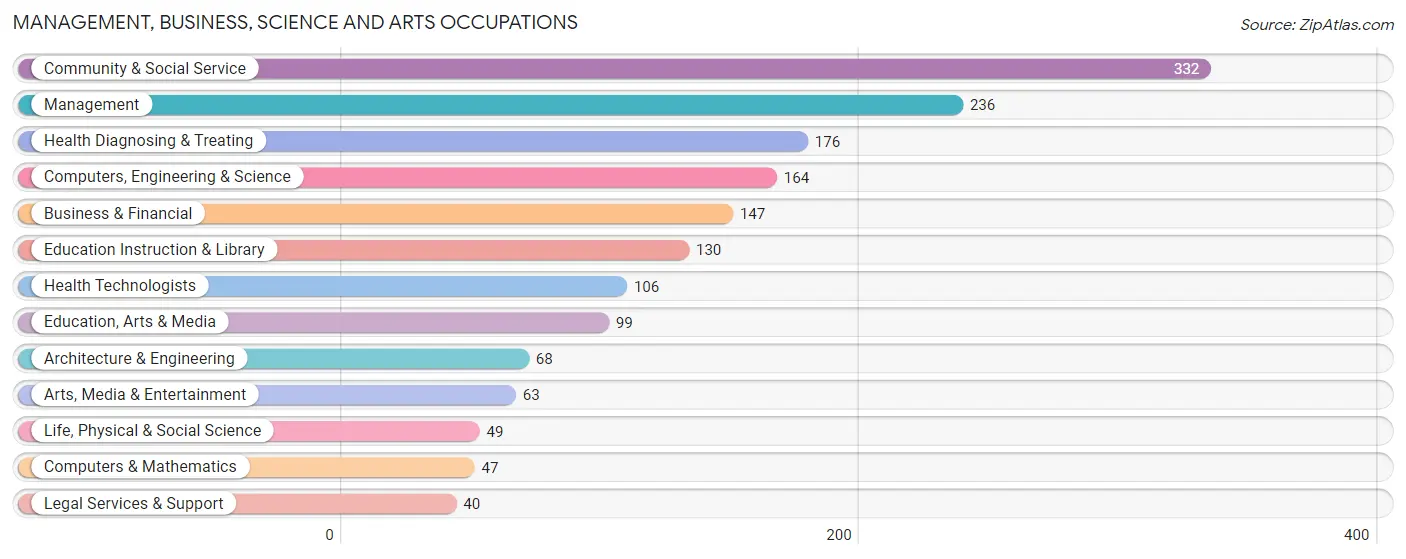
Management, Business, Science and Arts Occupations
The most common Management, Business, Science and Arts occupations in St Albans are Community & Social Service (332 | 10.2%), Management (236 | 7.3%), Health Diagnosing & Treating (176 | 5.4%), Computers, Engineering & Science (164 | 5.1%), and Business & Financial (147 | 4.5%).
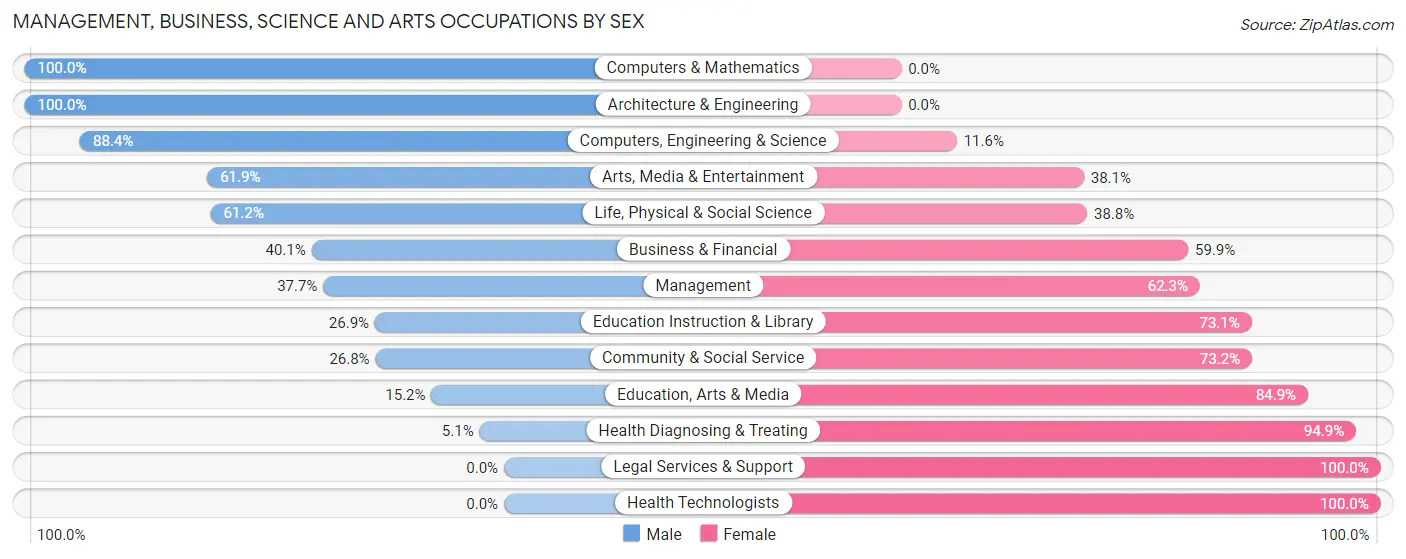
Management, Business, Science and Arts Occupations by Sex
Within the Management, Business, Science and Arts occupations in St Albans, the most male-oriented occupations are Computers & Mathematics (100.0%), Architecture & Engineering (100.0%), and Computers, Engineering & Science (88.4%), while the most female-oriented occupations are Legal Services & Support (100.0%), Health Technologists (100.0%), and Health Diagnosing & Treating (94.9%).
| Occupation | Male | Female |
| Management | 89 (37.7%) | 147 (62.3%) |
| Business & Financial | 59 (40.1%) | 88 (59.9%) |
| Computers, Engineering & Science | 145 (88.4%) | 19 (11.6%) |
| Computers & Mathematics | 47 (100.0%) | 0 (0.0%) |
| Architecture & Engineering | 68 (100.0%) | 0 (0.0%) |
| Life, Physical & Social Science | 30 (61.2%) | 19 (38.8%) |
| Community & Social Service | 89 (26.8%) | 243 (73.2%) |
| Education, Arts & Media | 15 (15.1%) | 84 (84.9%) |
| Legal Services & Support | 0 (0.0%) | 40 (100.0%) |
| Education Instruction & Library | 35 (26.9%) | 95 (73.1%) |
| Arts, Media & Entertainment | 39 (61.9%) | 24 (38.1%) |
| Health Diagnosing & Treating | 9 (5.1%) | 167 (94.9%) |
| Health Technologists | 0 (0.0%) | 106 (100.0%) |
| Total (Category) | 391 (37.1%) | 664 (62.9%) |
| Total (Overall) | 1,621 (49.9%) | 1,624 (50.0%) |
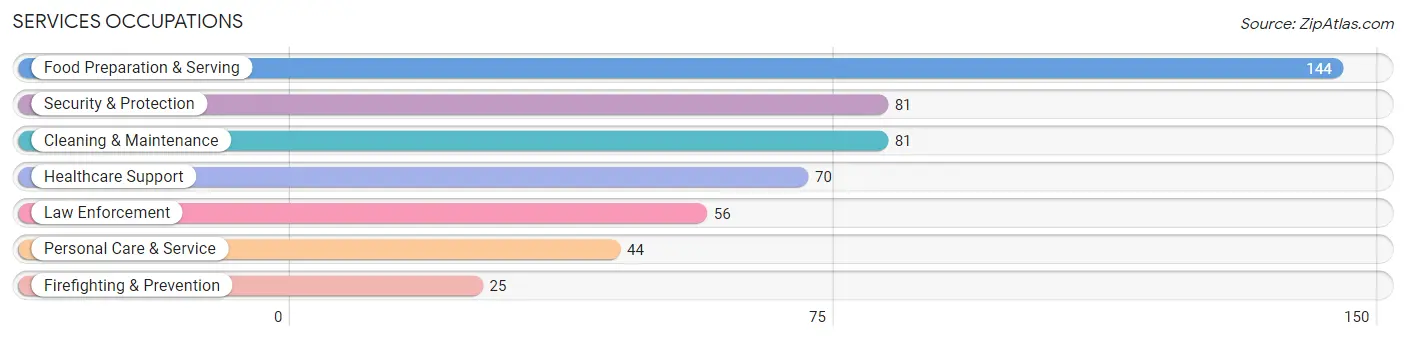
Services Occupations
The most common Services occupations in St Albans are Food Preparation & Serving (144 | 4.4%), Security & Protection (81 | 2.5%), Cleaning & Maintenance (81 | 2.5%), Healthcare Support (70 | 2.2%), and Law Enforcement (56 | 1.7%).
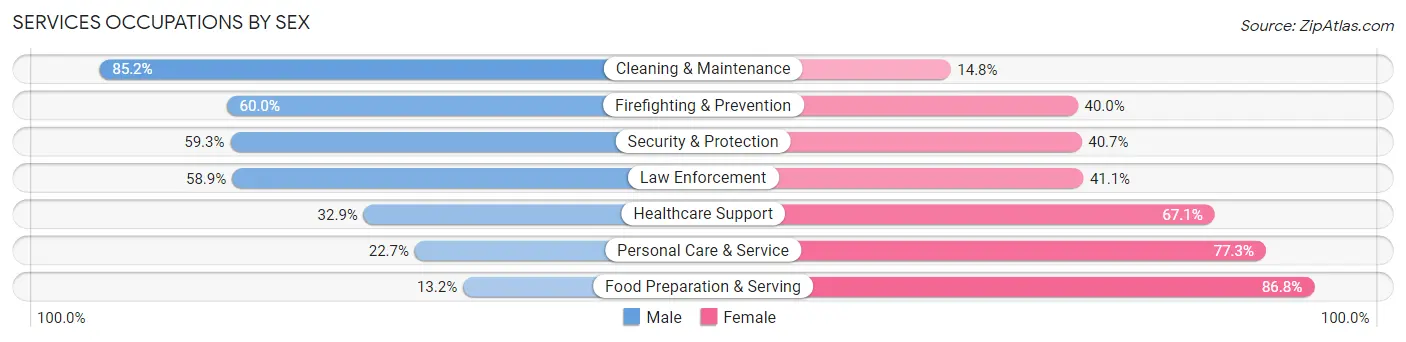
Services Occupations by Sex
Within the Services occupations in St Albans, the most male-oriented occupations are Cleaning & Maintenance (85.2%), Firefighting & Prevention (60.0%), and Security & Protection (59.3%), while the most female-oriented occupations are Food Preparation & Serving (86.8%), Personal Care & Service (77.3%), and Healthcare Support (67.1%).
| Occupation | Male | Female |
| Healthcare Support | 23 (32.9%) | 47 (67.1%) |
| Security & Protection | 48 (59.3%) | 33 (40.7%) |
| Firefighting & Prevention | 15 (60.0%) | 10 (40.0%) |
| Law Enforcement | 33 (58.9%) | 23 (41.1%) |
| Food Preparation & Serving | 19 (13.2%) | 125 (86.8%) |
| Cleaning & Maintenance | 69 (85.2%) | 12 (14.8%) |
| Personal Care & Service | 10 (22.7%) | 34 (77.3%) |
| Total (Category) | 169 (40.2%) | 251 (59.8%) |
| Total (Overall) | 1,621 (49.9%) | 1,624 (50.0%) |
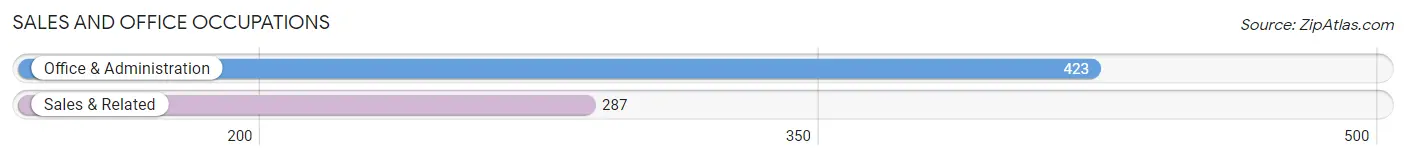
Sales and Office Occupations
The most common Sales and Office occupations in St Albans are Office & Administration (423 | 13.0%), and Sales & Related (287 | 8.8%).
Sales and Office Occupations by Sex
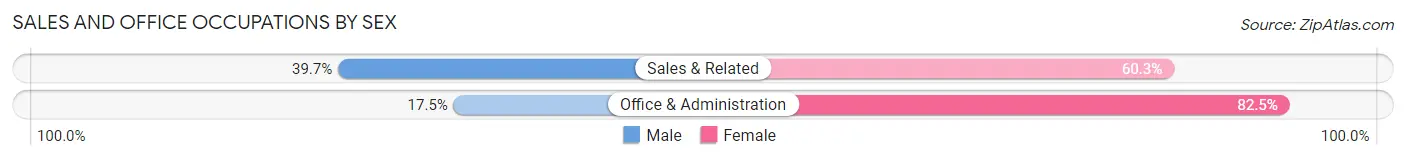
| Occupation | Male | Female |
| Sales & Related | 114 (39.7%) | 173 (60.3%) |
| Office & Administration | 74 (17.5%) | 349 (82.5%) |
| Total (Category) | 188 (26.5%) | 522 (73.5%) |
| Total (Overall) | 1,621 (49.9%) | 1,624 (50.0%) |
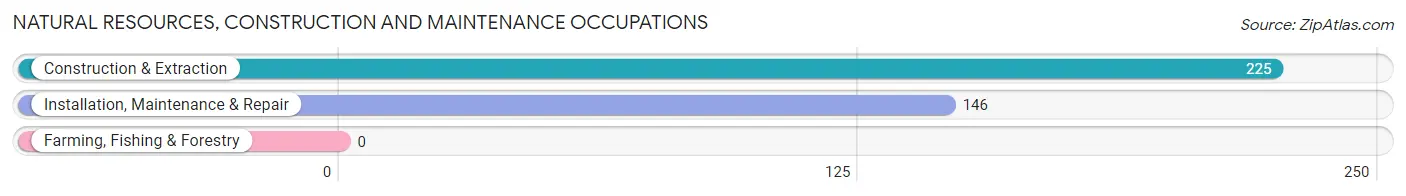
Natural Resources, Construction and Maintenance Occupations
The most common Natural Resources, Construction and Maintenance occupations in St Albans are Construction & Extraction (225 | 6.9%), and Installation, Maintenance & Repair (146 | 4.5%).
Natural Resources, Construction and Maintenance Occupations by Sex
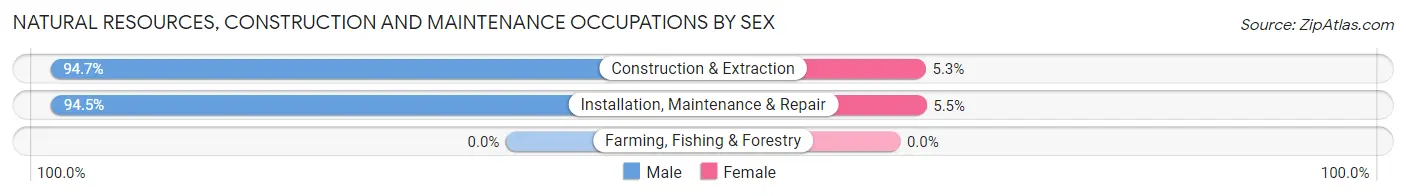
| Occupation | Male | Female |
| Farming, Fishing & Forestry | 0 (0.0%) | 0 (0.0%) |
| Construction & Extraction | 213 (94.7%) | 12 (5.3%) |
| Installation, Maintenance & Repair | 138 (94.5%) | 8 (5.5%) |
| Total (Category) | 351 (94.6%) | 20 (5.4%) |
| Total (Overall) | 1,621 (49.9%) | 1,624 (50.0%) |
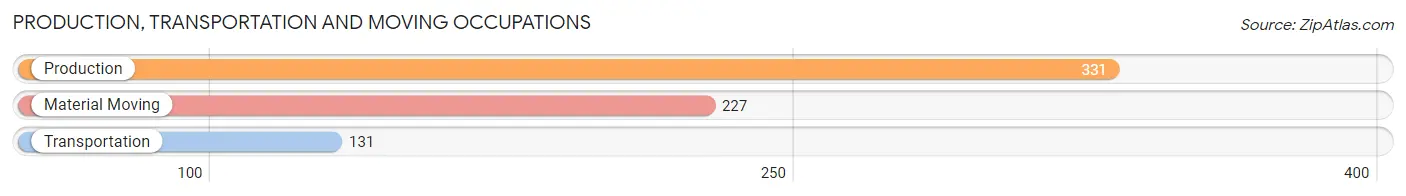
Production, Transportation and Moving Occupations
The most common Production, Transportation and Moving occupations in St Albans are Production (331 | 10.2%), Material Moving (227 | 7.0%), and Transportation (131 | 4.0%).
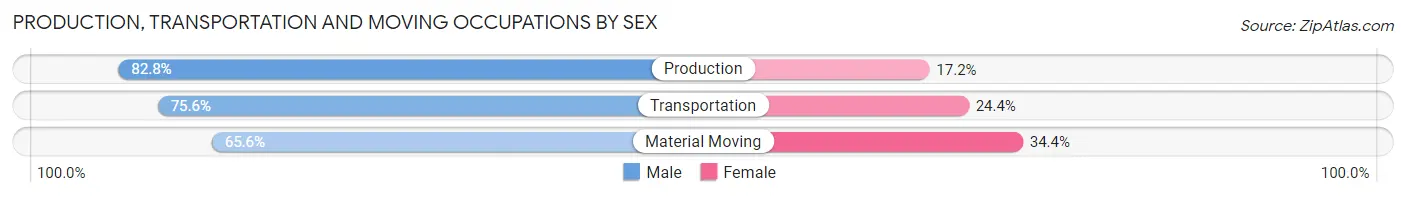
Production, Transportation and Moving Occupations by Sex
| Occupation | Male | Female |
| Production | 274 (82.8%) | 57 (17.2%) |
| Transportation | 99 (75.6%) | 32 (24.4%) |
| Material Moving | 149 (65.6%) | 78 (34.4%) |
| Total (Category) | 522 (75.8%) | 167 (24.2%) |
| Total (Overall) | 1,621 (49.9%) | 1,624 (50.0%) |
Employment Industries by Sex in St Albans
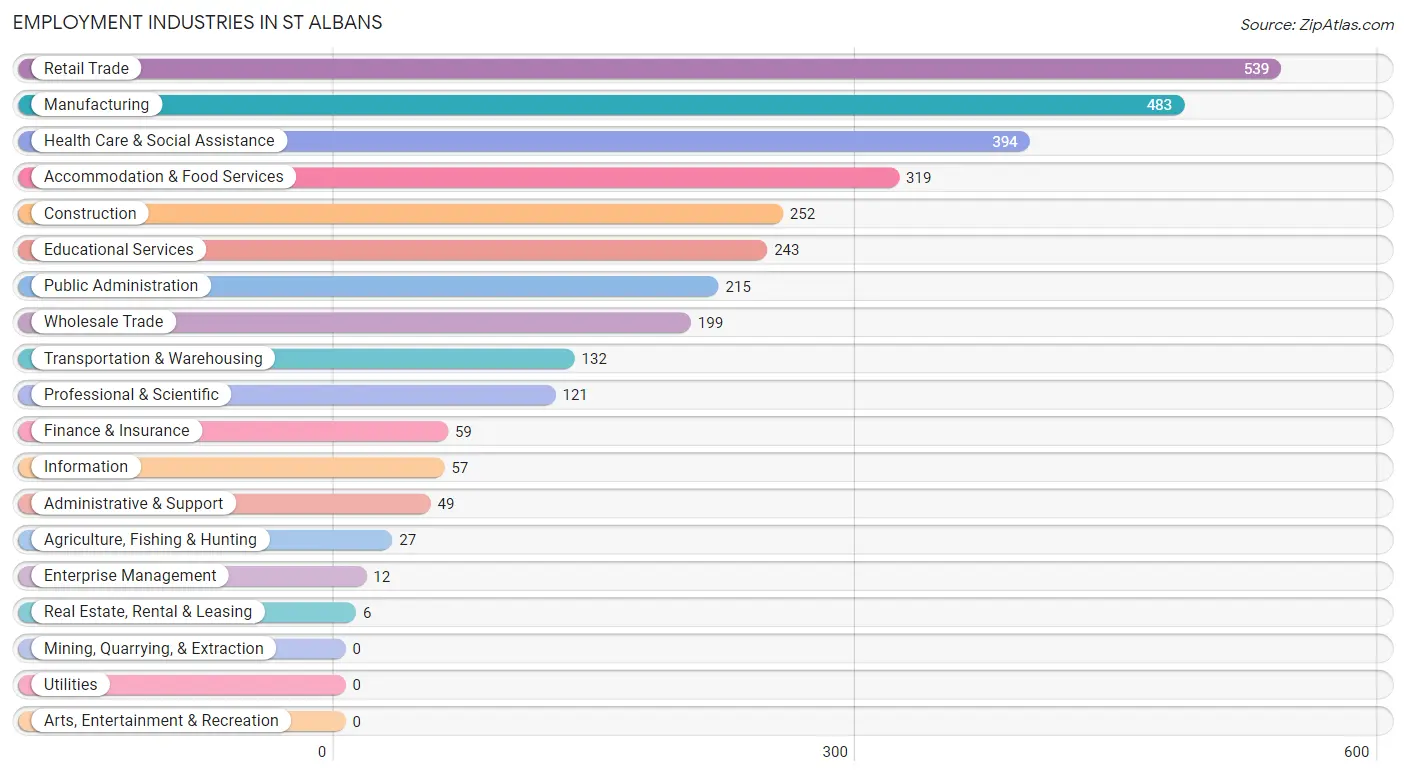
Employment Industries in St Albans
The major employment industries in St Albans include Retail Trade (539 | 16.6%), Manufacturing (483 | 14.9%), Health Care & Social Assistance (394 | 12.1%), Accommodation & Food Services (319 | 9.8%), and Construction (252 | 7.8%).
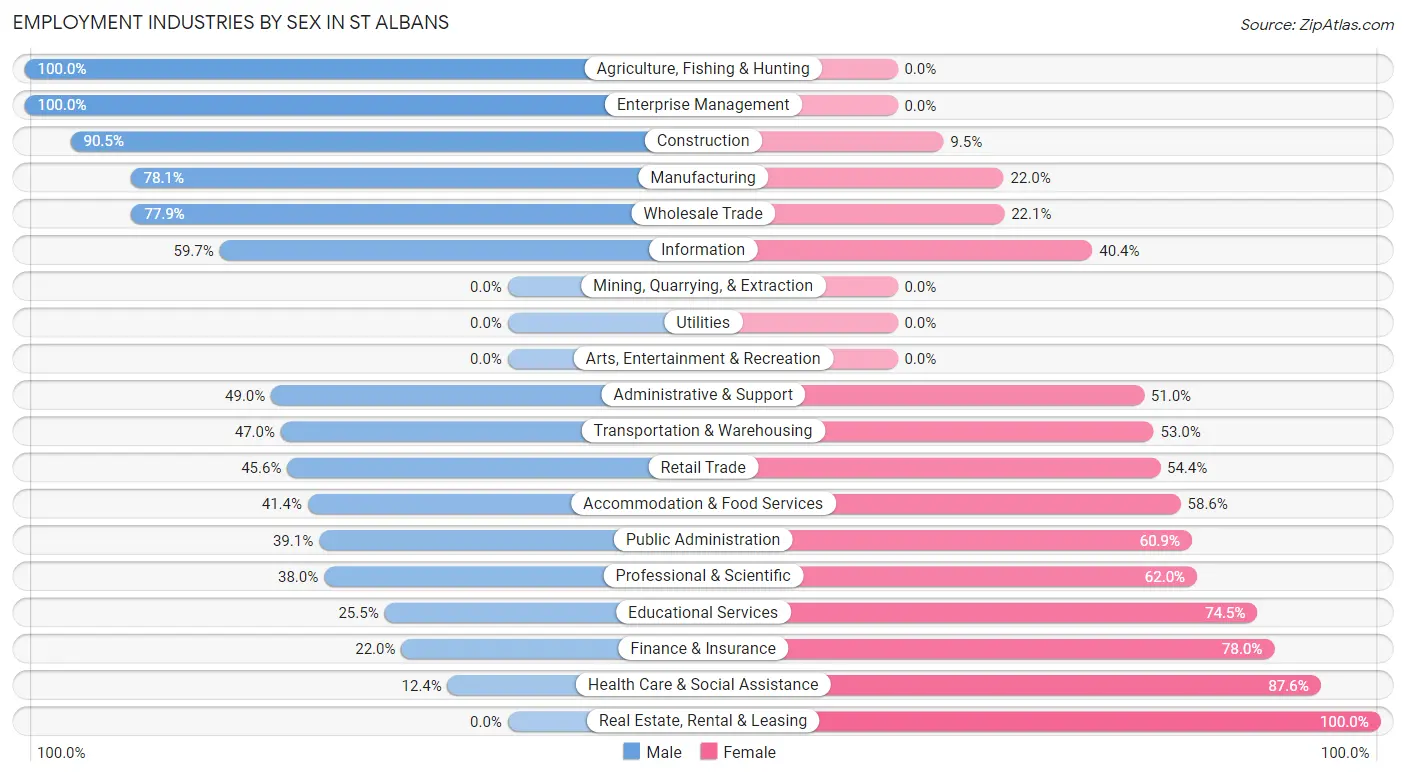
Employment Industries by Sex in St Albans
The St Albans industries that see more men than women are Agriculture, Fishing & Hunting (100.0%), Enterprise Management (100.0%), and Construction (90.5%), whereas the industries that tend to have a higher number of women are Real Estate, Rental & Leasing (100.0%), Health Care & Social Assistance (87.6%), and Finance & Insurance (78.0%).
| Industry | Male | Female |
| Agriculture, Fishing & Hunting | 27 (100.0%) | 0 (0.0%) |
| Mining, Quarrying, & Extraction | 0 (0.0%) | 0 (0.0%) |
| Construction | 228 (90.5%) | 24 (9.5%) |
| Manufacturing | 377 (78.0%) | 106 (22.0%) |
| Wholesale Trade | 155 (77.9%) | 44 (22.1%) |
| Retail Trade | 246 (45.6%) | 293 (54.4%) |
| Transportation & Warehousing | 62 (47.0%) | 70 (53.0%) |
| Utilities | 0 (0.0%) | 0 (0.0%) |
| Information | 34 (59.7%) | 23 (40.4%) |
| Finance & Insurance | 13 (22.0%) | 46 (78.0%) |
| Real Estate, Rental & Leasing | 0 (0.0%) | 6 (100.0%) |
| Professional & Scientific | 46 (38.0%) | 75 (62.0%) |
| Enterprise Management | 12 (100.0%) | 0 (0.0%) |
| Administrative & Support | 24 (49.0%) | 25 (51.0%) |
| Educational Services | 62 (25.5%) | 181 (74.5%) |
| Health Care & Social Assistance | 49 (12.4%) | 345 (87.6%) |
| Arts, Entertainment & Recreation | 0 (0.0%) | 0 (0.0%) |
| Accommodation & Food Services | 132 (41.4%) | 187 (58.6%) |
| Public Administration | 84 (39.1%) | 131 (60.9%) |
| Total | 1,621 (49.9%) | 1,624 (50.0%) |
Education in St Albans
School Enrollment in St Albans
The most common levels of schooling among the 1,333 students in St Albans are high school (407 | 30.5%), middle school (318 | 23.9%), and elementary school (254 | 19.1%).
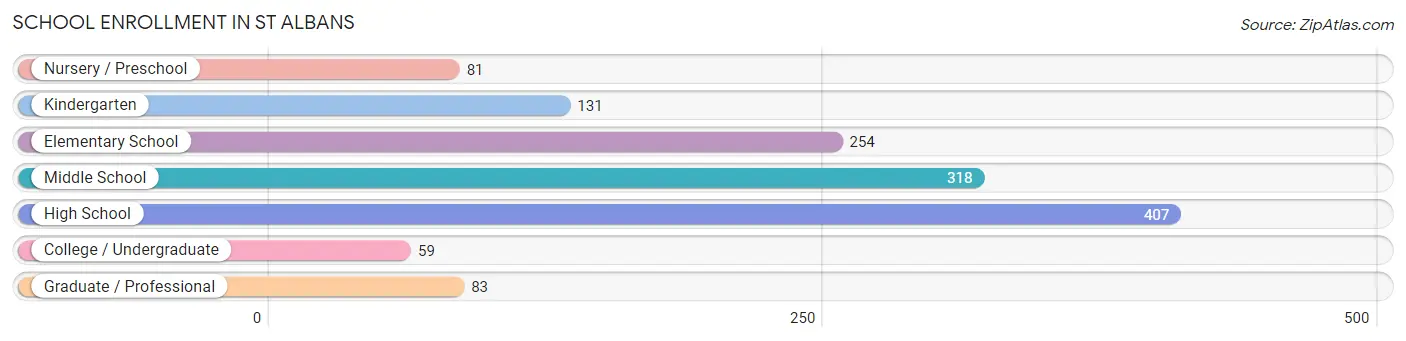
| School Level | # Students | % Students |
| Nursery / Preschool | 81 | 6.1% |
| Kindergarten | 131 | 9.8% |
| Elementary School | 254 | 19.1% |
| Middle School | 318 | 23.9% |
| High School | 407 | 30.5% |
| College / Undergraduate | 59 | 4.4% |
| Graduate / Professional | 83 | 6.2% |
| Total | 1,333 | 100.0% |
School Enrollment by Age by Funding Source in St Albans
Out of a total of 1,333 students who are enrolled in schools in St Albans, 172 (12.9%) attend a private institution, while the remaining 1,161 (87.1%) are enrolled in public schools. The age group of 25 to 34 year olds has the highest likelihood of being enrolled in private schools, with 53 (72.6% in the age bracket) enrolled. Conversely, the age group of 20 to 24 year olds has the lowest likelihood of being enrolled in a private school, with 22 (100.0% in the age bracket) attending a public institution.
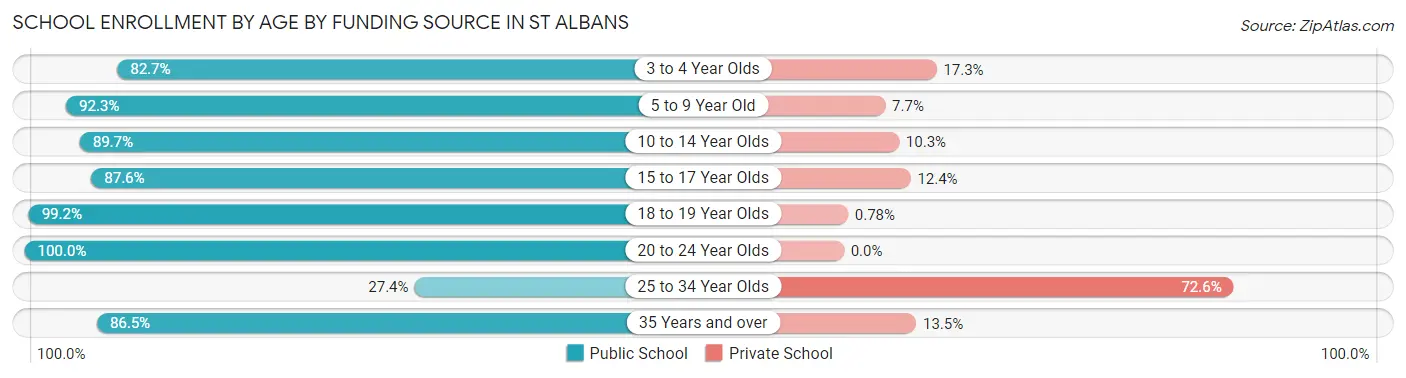
| Age Bracket | Public School | Private School |
| 3 to 4 Year Olds | 67 (82.7%) | 14 (17.3%) |
| 5 to 9 Year Old | 346 (92.3%) | 29 (7.7%) |
| 10 to 14 Year Olds | 305 (89.7%) | 35 (10.3%) |
| 15 to 17 Year Olds | 197 (87.6%) | 28 (12.4%) |
| 18 to 19 Year Olds | 127 (99.2%) | 1 (0.8%) |
| 20 to 24 Year Olds | 22 (100.0%) | 0 (0.0%) |
| 25 to 34 Year Olds | 20 (27.4%) | 53 (72.6%) |
| 35 Years and over | 77 (86.5%) | 12 (13.5%) |
| Total | 1,161 (87.1%) | 172 (12.9%) |
Educational Attainment by Field of Study in St Albans
Psychology (169 | 12.7%), science & technology (167 | 12.6%), business (155 | 11.7%), bio, nature & agricultural (126 | 9.5%), and liberal arts & history (119 | 8.9%) are the most common fields of study among 1,331 individuals in St Albans who have obtained a bachelor's degree or higher.
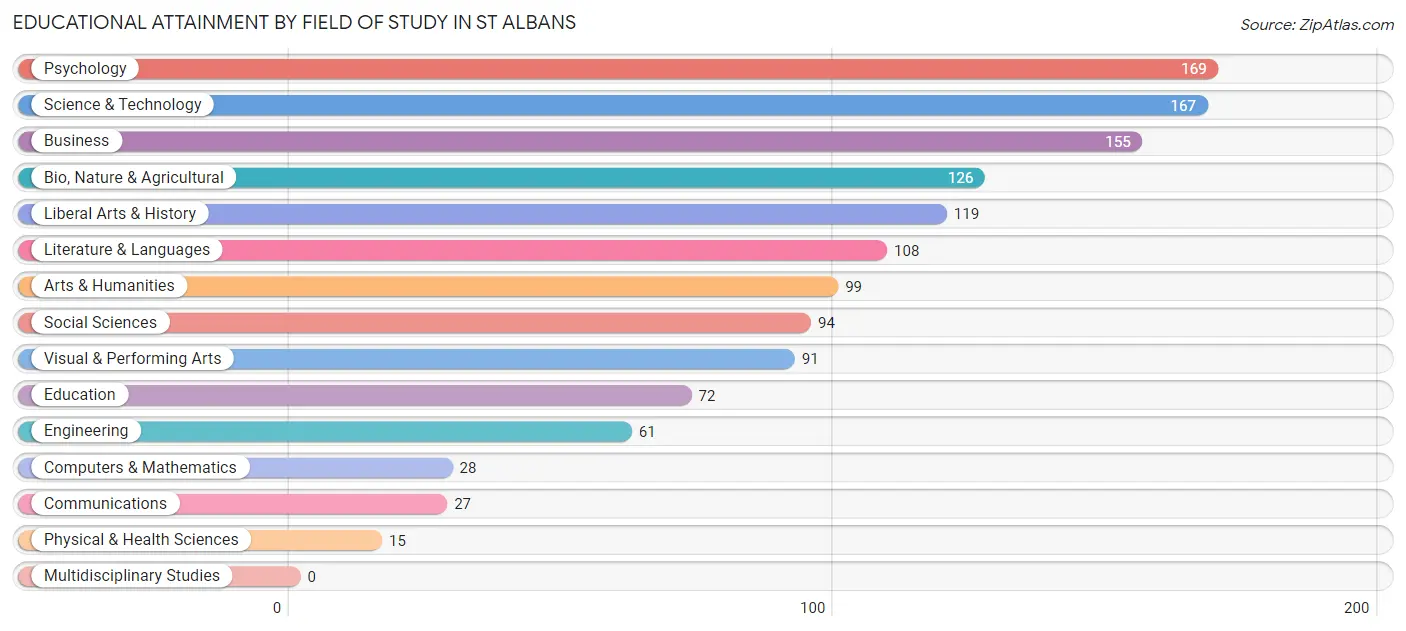
| Field of Study | # Graduates | % Graduates |
| Computers & Mathematics | 28 | 2.1% |
| Bio, Nature & Agricultural | 126 | 9.5% |
| Physical & Health Sciences | 15 | 1.1% |
| Psychology | 169 | 12.7% |
| Social Sciences | 94 | 7.1% |
| Engineering | 61 | 4.6% |
| Multidisciplinary Studies | 0 | 0.0% |
| Science & Technology | 167 | 12.6% |
| Business | 155 | 11.7% |
| Education | 72 | 5.4% |
| Literature & Languages | 108 | 8.1% |
| Liberal Arts & History | 119 | 8.9% |
| Visual & Performing Arts | 91 | 6.8% |
| Communications | 27 | 2.0% |
| Arts & Humanities | 99 | 7.4% |
| Total | 1,331 | 100.0% |
Transportation & Commute in St Albans
Vehicle Availability by Sex in St Albans
The most prevalent vehicle ownership categories in St Albans are males with 2 vehicles (699, accounting for 43.6%) and females with 2 vehicles (572, making up 44.8%).
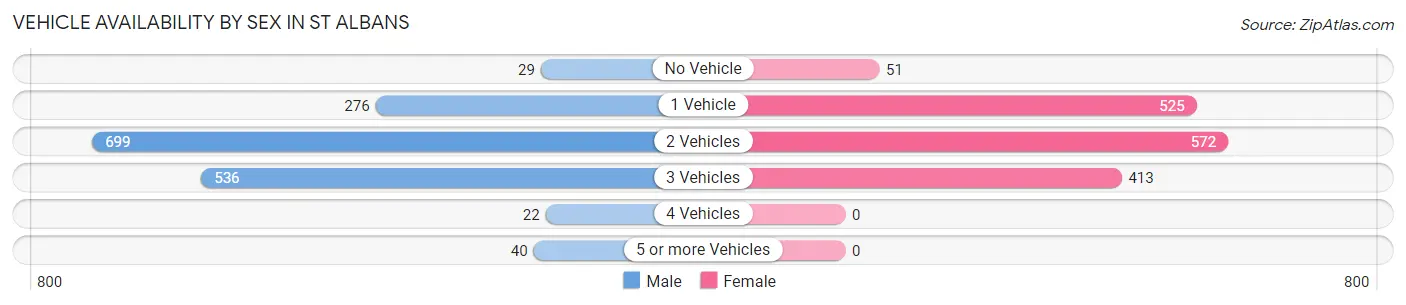
| Vehicles Available | Male | Female |
| No Vehicle | 29 (1.8%) | 51 (3.3%) |
| 1 Vehicle | 276 (17.2%) | 525 (33.6%) |
| 2 Vehicles | 699 (43.6%) | 572 (36.6%) |
| 3 Vehicles | 536 (33.5%) | 413 (26.5%) |
| 4 Vehicles | 22 (1.4%) | 0 (0.0%) |
| 5 or more Vehicles | 40 (2.5%) | 0 (0.0%) |
| Total | 1,602 (100.0%) | 1,561 (100.0%) |
Commute Time in St Albans
The most frequently occuring commute durations in St Albans are 5 to 9 minutes (457 commuters, 15.6%), 10 to 14 minutes (452 commuters, 15.4%), and 30 to 34 minutes (394 commuters, 13.4%).
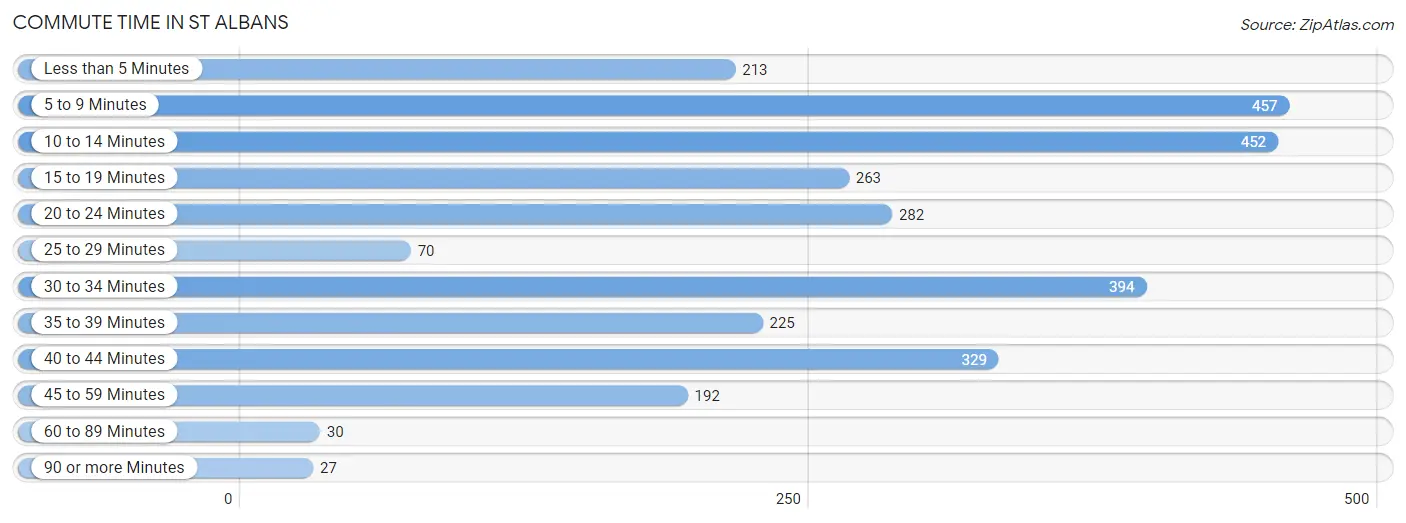
| Commute Time | # Commuters | % Commuters |
| Less than 5 Minutes | 213 | 7.3% |
| 5 to 9 Minutes | 457 | 15.6% |
| 10 to 14 Minutes | 452 | 15.4% |
| 15 to 19 Minutes | 263 | 9.0% |
| 20 to 24 Minutes | 282 | 9.6% |
| 25 to 29 Minutes | 70 | 2.4% |
| 30 to 34 Minutes | 394 | 13.4% |
| 35 to 39 Minutes | 225 | 7.7% |
| 40 to 44 Minutes | 329 | 11.2% |
| 45 to 59 Minutes | 192 | 6.5% |
| 60 to 89 Minutes | 30 | 1.0% |
| 90 or more Minutes | 27 | 0.9% |
Commute Time by Sex in St Albans
The most common commute times in St Albans are 10 to 14 minutes (306 commuters, 20.0%) for males and 5 to 9 minutes (263 commuters, 18.8%) for females.
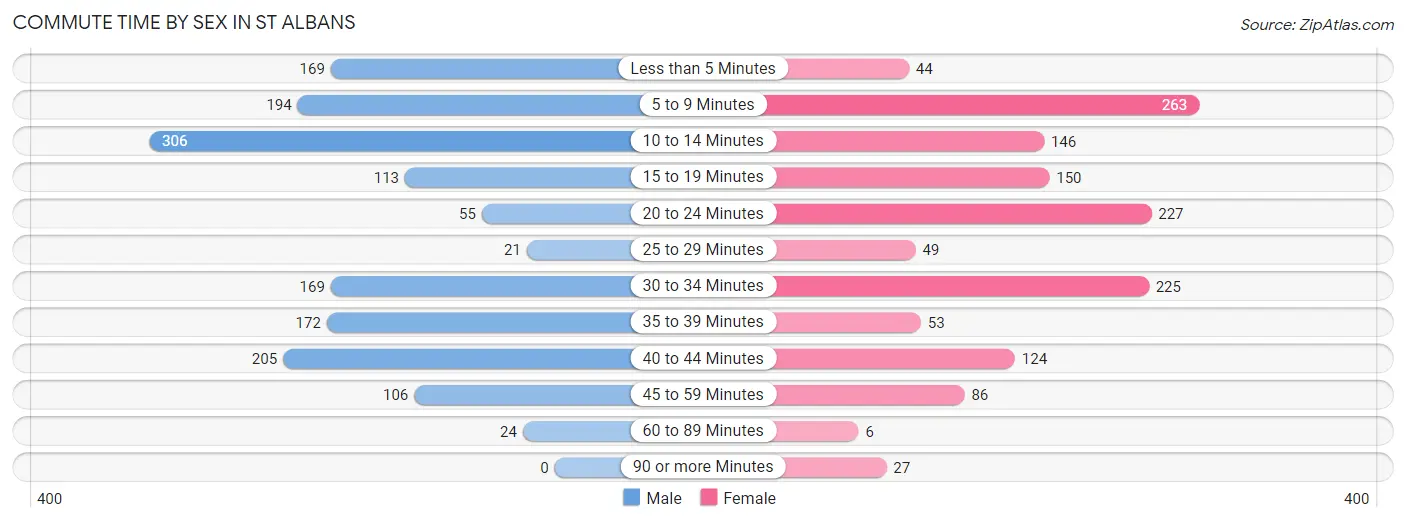
| Commute Time | Male | Female |
| Less than 5 Minutes | 169 (11.0%) | 44 (3.1%) |
| 5 to 9 Minutes | 194 (12.7%) | 263 (18.8%) |
| 10 to 14 Minutes | 306 (20.0%) | 146 (10.4%) |
| 15 to 19 Minutes | 113 (7.4%) | 150 (10.7%) |
| 20 to 24 Minutes | 55 (3.6%) | 227 (16.2%) |
| 25 to 29 Minutes | 21 (1.4%) | 49 (3.5%) |
| 30 to 34 Minutes | 169 (11.0%) | 225 (16.1%) |
| 35 to 39 Minutes | 172 (11.2%) | 53 (3.8%) |
| 40 to 44 Minutes | 205 (13.4%) | 124 (8.9%) |
| 45 to 59 Minutes | 106 (6.9%) | 86 (6.1%) |
| 60 to 89 Minutes | 24 (1.6%) | 6 (0.4%) |
| 90 or more Minutes | 0 (0.0%) | 27 (1.9%) |
Time of Departure to Work by Sex in St Albans
The most frequent times of departure to work in St Albans are 6:30 AM to 6:59 AM (255, 16.6%) for males and 7:00 AM to 7:29 AM (303, 21.6%) for females.
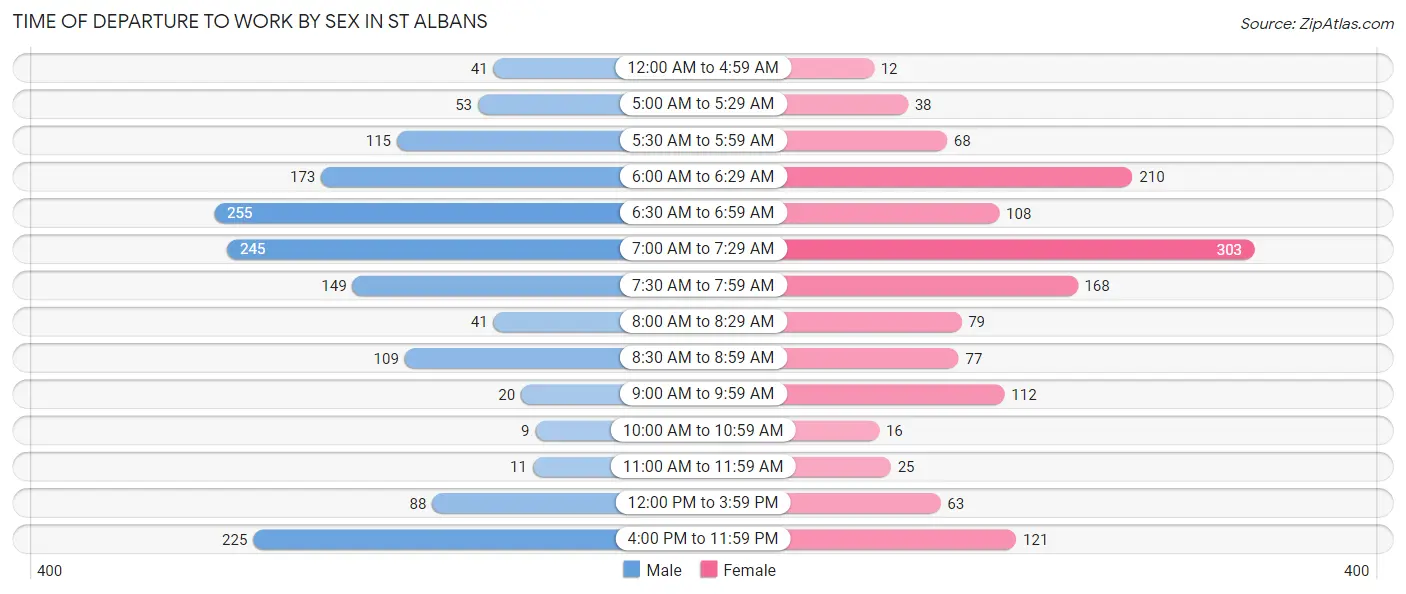
| Time of Departure | Male | Female |
| 12:00 AM to 4:59 AM | 41 (2.7%) | 12 (0.9%) |
| 5:00 AM to 5:29 AM | 53 (3.5%) | 38 (2.7%) |
| 5:30 AM to 5:59 AM | 115 (7.5%) | 68 (4.9%) |
| 6:00 AM to 6:29 AM | 173 (11.3%) | 210 (15.0%) |
| 6:30 AM to 6:59 AM | 255 (16.6%) | 108 (7.7%) |
| 7:00 AM to 7:29 AM | 245 (16.0%) | 303 (21.6%) |
| 7:30 AM to 7:59 AM | 149 (9.7%) | 168 (12.0%) |
| 8:00 AM to 8:29 AM | 41 (2.7%) | 79 (5.6%) |
| 8:30 AM to 8:59 AM | 109 (7.1%) | 77 (5.5%) |
| 9:00 AM to 9:59 AM | 20 (1.3%) | 112 (8.0%) |
| 10:00 AM to 10:59 AM | 9 (0.6%) | 16 (1.1%) |
| 11:00 AM to 11:59 AM | 11 (0.7%) | 25 (1.8%) |
| 12:00 PM to 3:59 PM | 88 (5.7%) | 63 (4.5%) |
| 4:00 PM to 11:59 PM | 225 (14.7%) | 121 (8.6%) |
| Total | 1,534 (100.0%) | 1,400 (100.0%) |
Housing Occupancy in St Albans
Occupancy by Ownership in St Albans
Of the total 2,862 dwellings in St Albans, owner-occupied units account for 1,478 (51.6%), while renter-occupied units make up 1,384 (48.4%).
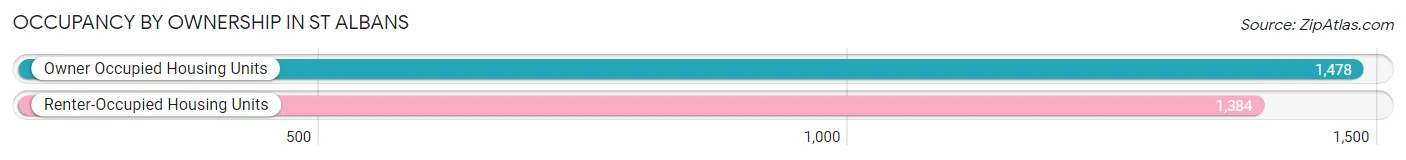
| Occupancy | # Housing Units | % Housing Units |
| Owner Occupied Housing Units | 1,478 | 51.6% |
| Renter-Occupied Housing Units | 1,384 | 48.4% |
| Total Occupied Housing Units | 2,862 | 100.0% |
Occupancy by Household Size in St Albans
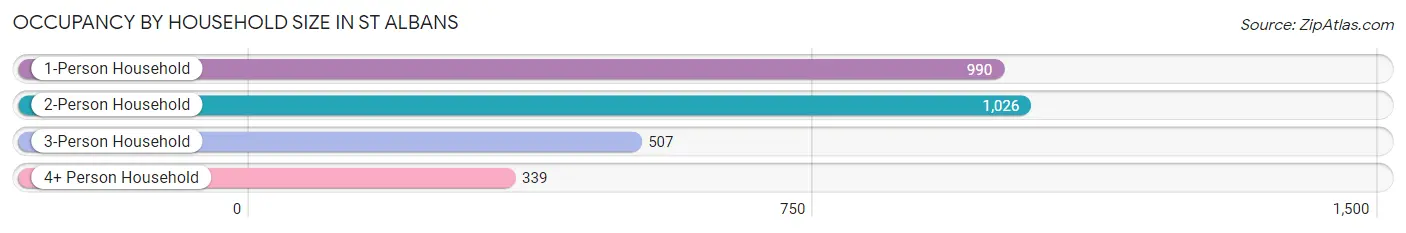
| Household Size | # Housing Units | % Housing Units |
| 1-Person Household | 990 | 34.6% |
| 2-Person Household | 1,026 | 35.8% |
| 3-Person Household | 507 | 17.7% |
| 4+ Person Household | 339 | 11.8% |
| Total Housing Units | 2,862 | 100.0% |
Occupancy by Ownership by Household Size in St Albans
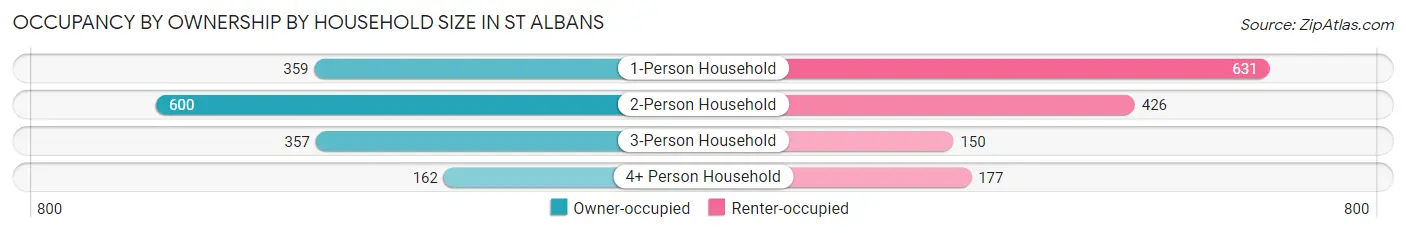
| Household Size | Owner-occupied | Renter-occupied |
| 1-Person Household | 359 (36.3%) | 631 (63.7%) |
| 2-Person Household | 600 (58.5%) | 426 (41.5%) |
| 3-Person Household | 357 (70.4%) | 150 (29.6%) |
| 4+ Person Household | 162 (47.8%) | 177 (52.2%) |
| Total Housing Units | 1,478 (51.6%) | 1,384 (48.4%) |
Occupancy by Educational Attainment in St Albans
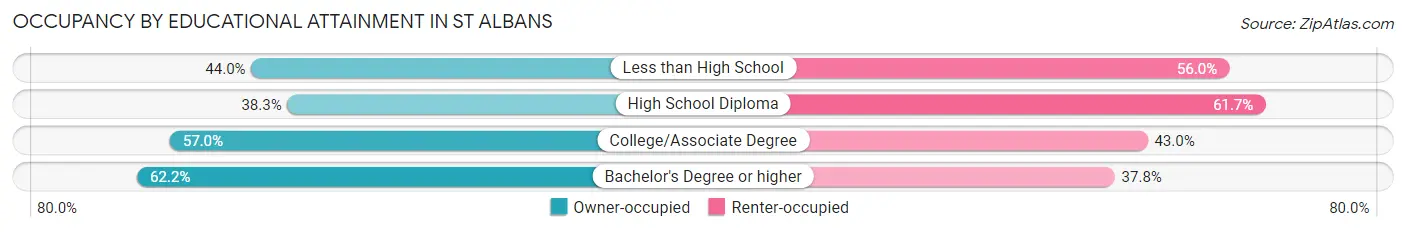
| Household Size | Owner-occupied | Renter-occupied |
| Less than High School | 107 (44.0%) | 136 (56.0%) |
| High School Diploma | 324 (38.3%) | 522 (61.7%) |
| College/Associate Degree | 605 (57.0%) | 457 (43.0%) |
| Bachelor's Degree or higher | 442 (62.2%) | 269 (37.8%) |
Occupancy by Age of Householder in St Albans
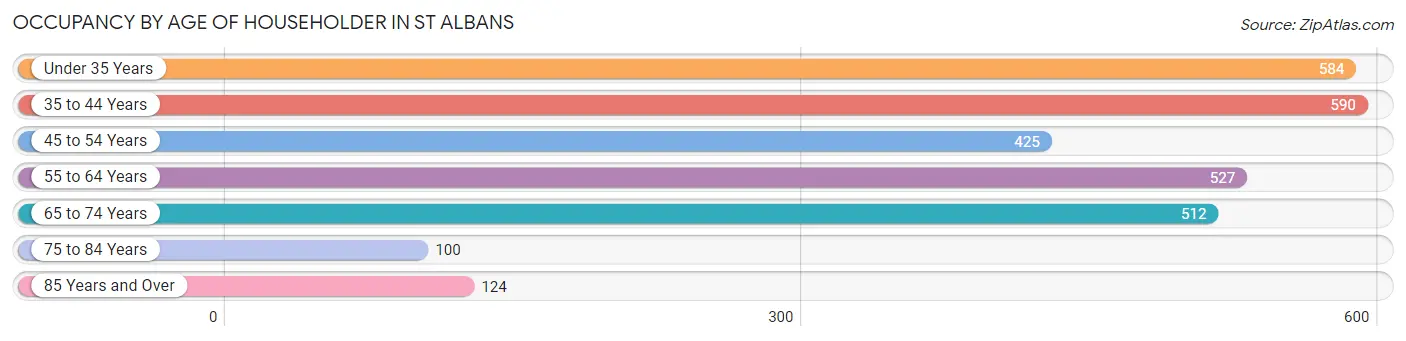
| Age Bracket | # Households | % Households |
| Under 35 Years | 584 | 20.4% |
| 35 to 44 Years | 590 | 20.6% |
| 45 to 54 Years | 425 | 14.8% |
| 55 to 64 Years | 527 | 18.4% |
| 65 to 74 Years | 512 | 17.9% |
| 75 to 84 Years | 100 | 3.5% |
| 85 Years and Over | 124 | 4.3% |
| Total | 2,862 | 100.0% |
Housing Finances in St Albans
Median Income by Occupancy in St Albans
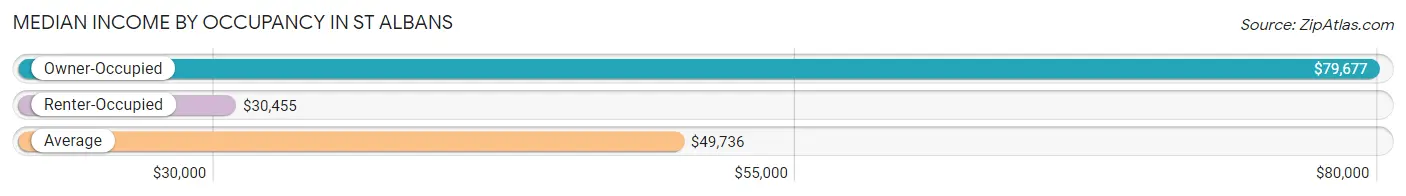
| Occupancy Type | # Households | Median Income |
| Owner-Occupied | 1,478 (51.6%) | $79,677 |
| Renter-Occupied | 1,384 (48.4%) | $30,455 |
| Average | 2,862 (100.0%) | $49,736 |
Occupancy by Householder Income Bracket in St Albans
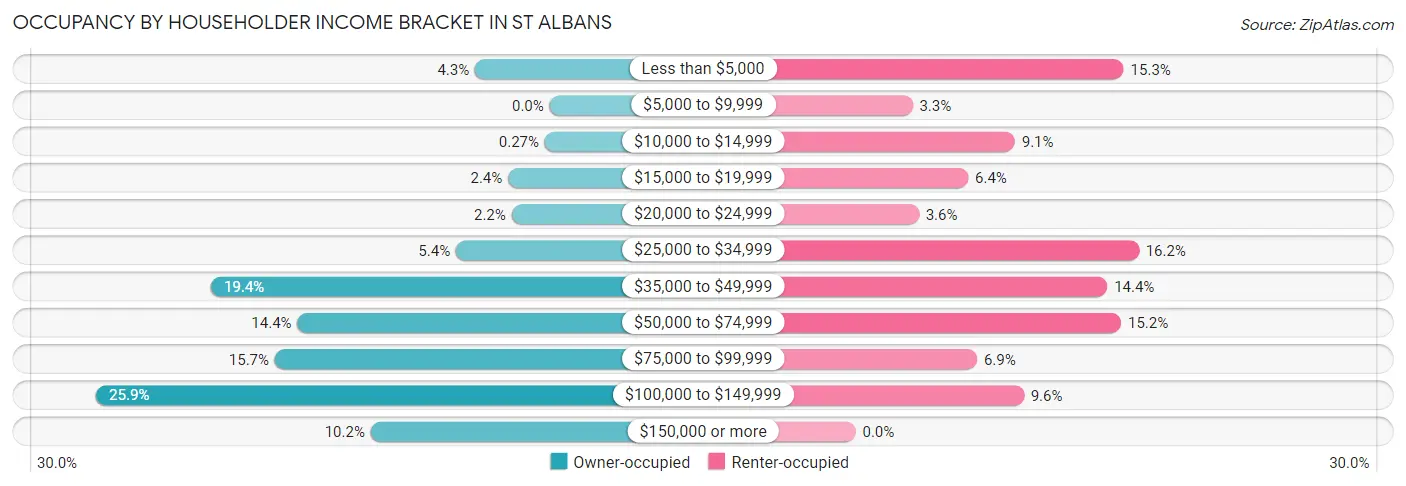
| Income Bracket | Owner-occupied | Renter-occupied |
| Less than $5,000 | 63 (4.3%) | 212 (15.3%) |
| $5,000 to $9,999 | 0 (0.0%) | 45 (3.3%) |
| $10,000 to $14,999 | 4 (0.3%) | 126 (9.1%) |
| $15,000 to $19,999 | 35 (2.4%) | 89 (6.4%) |
| $20,000 to $24,999 | 32 (2.2%) | 50 (3.6%) |
| $25,000 to $34,999 | 79 (5.3%) | 224 (16.2%) |
| $35,000 to $49,999 | 286 (19.4%) | 199 (14.4%) |
| $50,000 to $74,999 | 213 (14.4%) | 210 (15.2%) |
| $75,000 to $99,999 | 232 (15.7%) | 96 (6.9%) |
| $100,000 to $149,999 | 383 (25.9%) | 133 (9.6%) |
| $150,000 or more | 151 (10.2%) | 0 (0.0%) |
| Total | 1,478 (100.0%) | 1,384 (100.0%) |
Monthly Housing Cost Tiers in St Albans
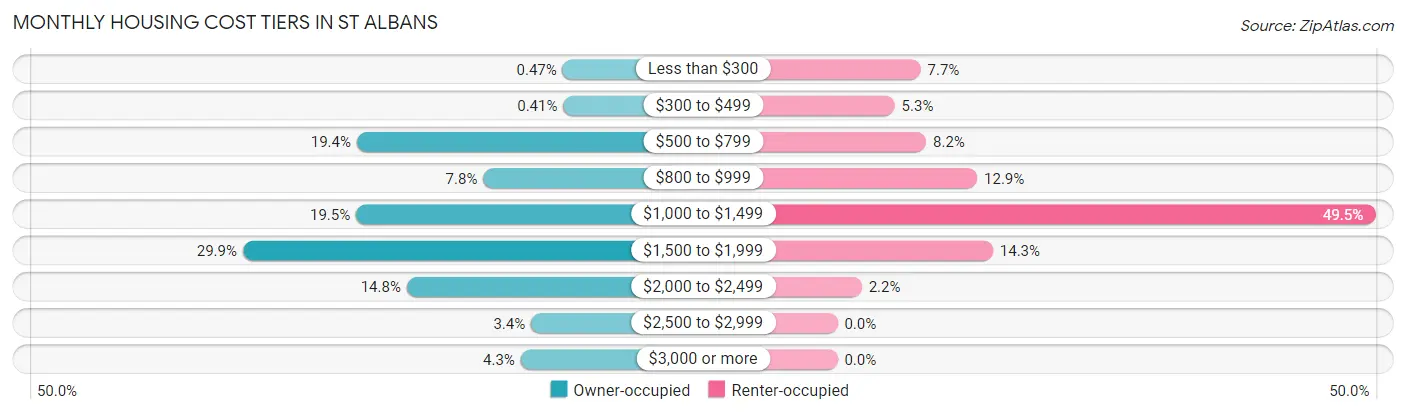
| Monthly Cost | Owner-occupied | Renter-occupied |
| Less than $300 | 7 (0.5%) | 106 (7.7%) |
| $300 to $499 | 6 (0.4%) | 73 (5.3%) |
| $500 to $799 | 287 (19.4%) | 113 (8.2%) |
| $800 to $999 | 115 (7.8%) | 178 (12.9%) |
| $1,000 to $1,499 | 288 (19.5%) | 685 (49.5%) |
| $1,500 to $1,999 | 442 (29.9%) | 198 (14.3%) |
| $2,000 to $2,499 | 219 (14.8%) | 31 (2.2%) |
| $2,500 to $2,999 | 50 (3.4%) | 0 (0.0%) |
| $3,000 or more | 64 (4.3%) | 0 (0.0%) |
| Total | 1,478 (100.0%) | 1,384 (100.0%) |
Physical Housing Characteristics in St Albans
Housing Structures in St Albans
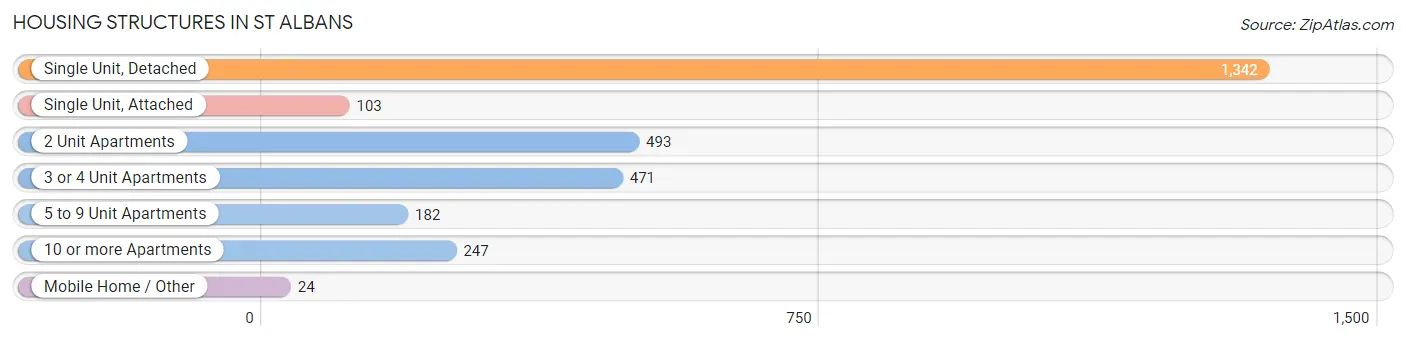
| Structure Type | # Housing Units | % Housing Units |
| Single Unit, Detached | 1,342 | 46.9% |
| Single Unit, Attached | 103 | 3.6% |
| 2 Unit Apartments | 493 | 17.2% |
| 3 or 4 Unit Apartments | 471 | 16.5% |
| 5 to 9 Unit Apartments | 182 | 6.4% |
| 10 or more Apartments | 247 | 8.6% |
| Mobile Home / Other | 24 | 0.8% |
| Total | 2,862 | 100.0% |
Housing Structures by Occupancy in St Albans
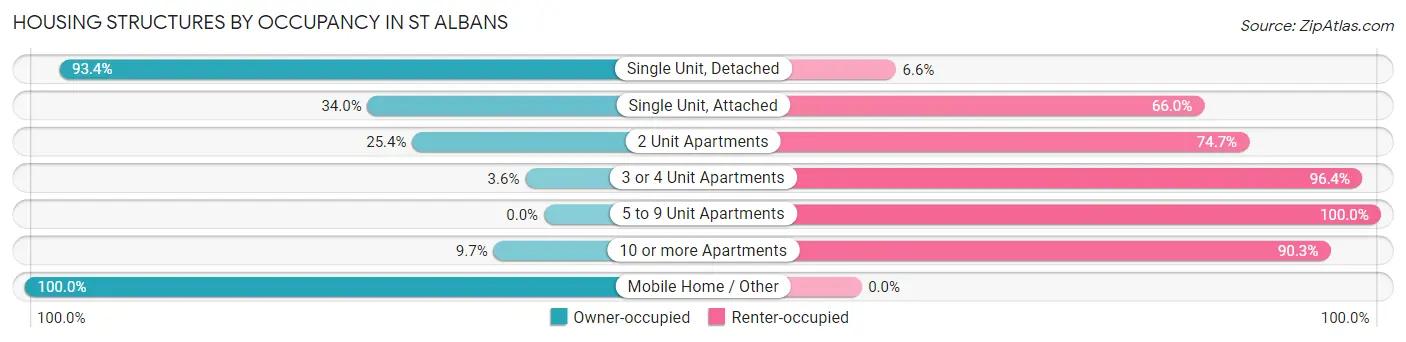
| Structure Type | Owner-occupied | Renter-occupied |
| Single Unit, Detached | 1,253 (93.4%) | 89 (6.6%) |
| Single Unit, Attached | 35 (34.0%) | 68 (66.0%) |
| 2 Unit Apartments | 125 (25.4%) | 368 (74.7%) |
| 3 or 4 Unit Apartments | 17 (3.6%) | 454 (96.4%) |
| 5 to 9 Unit Apartments | 0 (0.0%) | 182 (100.0%) |
| 10 or more Apartments | 24 (9.7%) | 223 (90.3%) |
| Mobile Home / Other | 24 (100.0%) | 0 (0.0%) |
| Total | 1,478 (51.6%) | 1,384 (48.4%) |
Housing Structures by Number of Rooms in St Albans
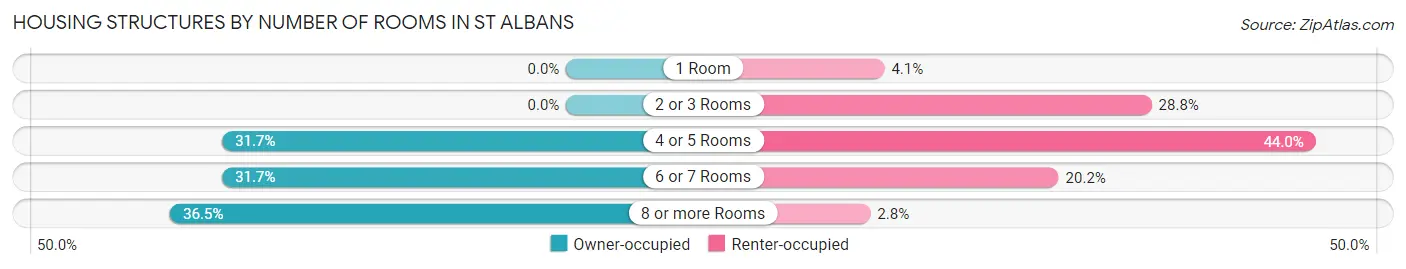
| Number of Rooms | Owner-occupied | Renter-occupied |
| 1 Room | 0 (0.0%) | 57 (4.1%) |
| 2 or 3 Rooms | 0 (0.0%) | 399 (28.8%) |
| 4 or 5 Rooms | 469 (31.7%) | 609 (44.0%) |
| 6 or 7 Rooms | 469 (31.7%) | 280 (20.2%) |
| 8 or more Rooms | 540 (36.5%) | 39 (2.8%) |
| Total | 1,478 (100.0%) | 1,384 (100.0%) |
Housing Structure by Heating Type in St Albans
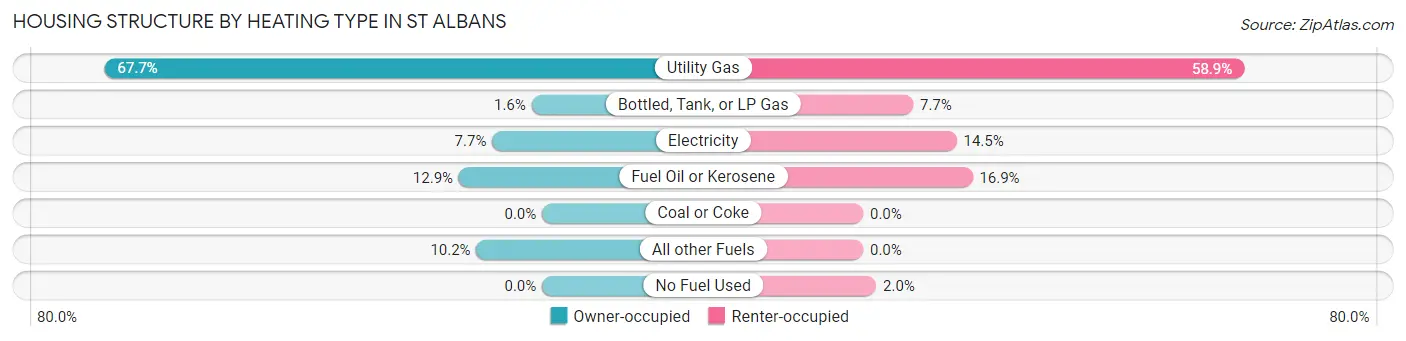
| Heating Type | Owner-occupied | Renter-occupied |
| Utility Gas | 1,000 (67.7%) | 815 (58.9%) |
| Bottled, Tank, or LP Gas | 24 (1.6%) | 107 (7.7%) |
| Electricity | 114 (7.7%) | 200 (14.4%) |
| Fuel Oil or Kerosene | 190 (12.9%) | 234 (16.9%) |
| Coal or Coke | 0 (0.0%) | 0 (0.0%) |
| All other Fuels | 150 (10.2%) | 0 (0.0%) |
| No Fuel Used | 0 (0.0%) | 28 (2.0%) |
| Total | 1,478 (100.0%) | 1,384 (100.0%) |
Household Vehicle Usage in St Albans
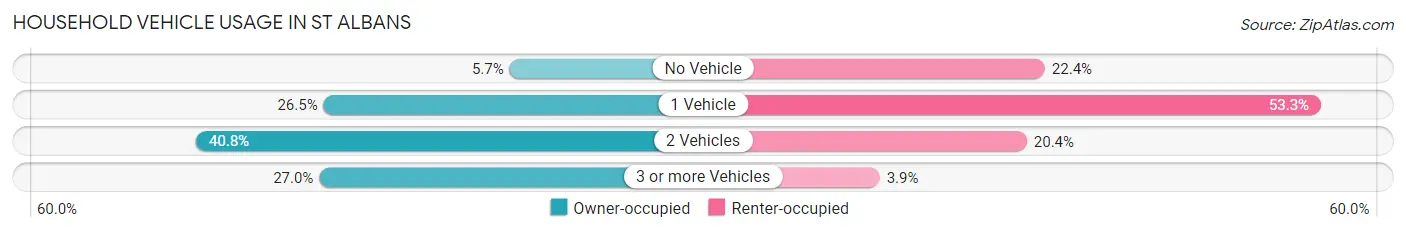
| Vehicles per Household | Owner-occupied | Renter-occupied |
| No Vehicle | 84 (5.7%) | 310 (22.4%) |
| 1 Vehicle | 392 (26.5%) | 738 (53.3%) |
| 2 Vehicles | 603 (40.8%) | 282 (20.4%) |
| 3 or more Vehicles | 399 (27.0%) | 54 (3.9%) |
| Total | 1,478 (100.0%) | 1,384 (100.0%) |
Real Estate & Mortgages in St Albans
Real Estate and Mortgage Overview in St Albans
| Characteristic | Without Mortgage | With Mortgage |
| Housing Units | 456 | 1,022 |
| Median Property Value | $229,500 | $222,300 |
| Median Household Income | $56,333 | $129 |
| Monthly Housing Costs | $765 | $64 |
| Real Estate Taxes | $4,376 | $49 |
Property Value by Mortgage Status in St Albans
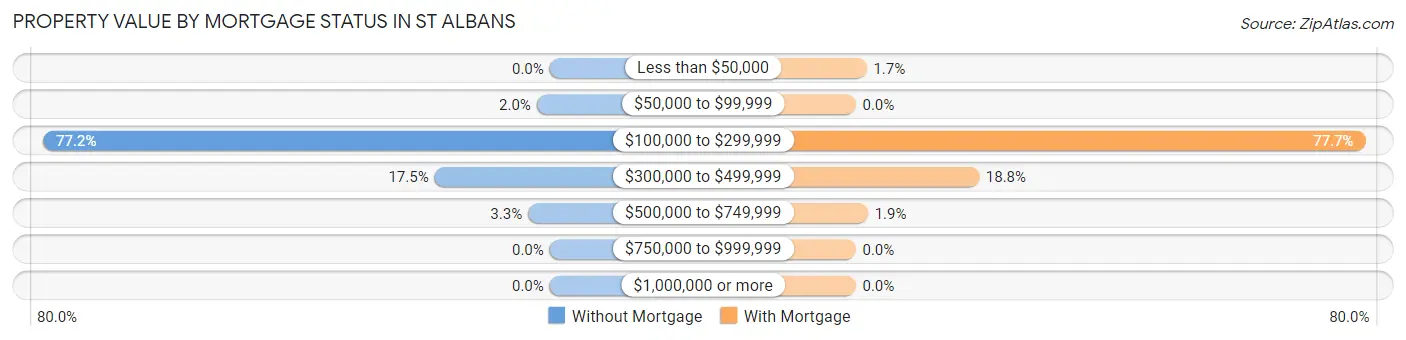
| Property Value | Without Mortgage | With Mortgage |
| Less than $50,000 | 0 (0.0%) | 17 (1.7%) |
| $50,000 to $99,999 | 9 (2.0%) | 0 (0.0%) |
| $100,000 to $299,999 | 352 (77.2%) | 794 (77.7%) |
| $300,000 to $499,999 | 80 (17.5%) | 192 (18.8%) |
| $500,000 to $749,999 | 15 (3.3%) | 19 (1.9%) |
| $750,000 to $999,999 | 0 (0.0%) | 0 (0.0%) |
| $1,000,000 or more | 0 (0.0%) | 0 (0.0%) |
| Total | 456 (100.0%) | 1,022 (100.0%) |
Household Income by Mortgage Status in St Albans
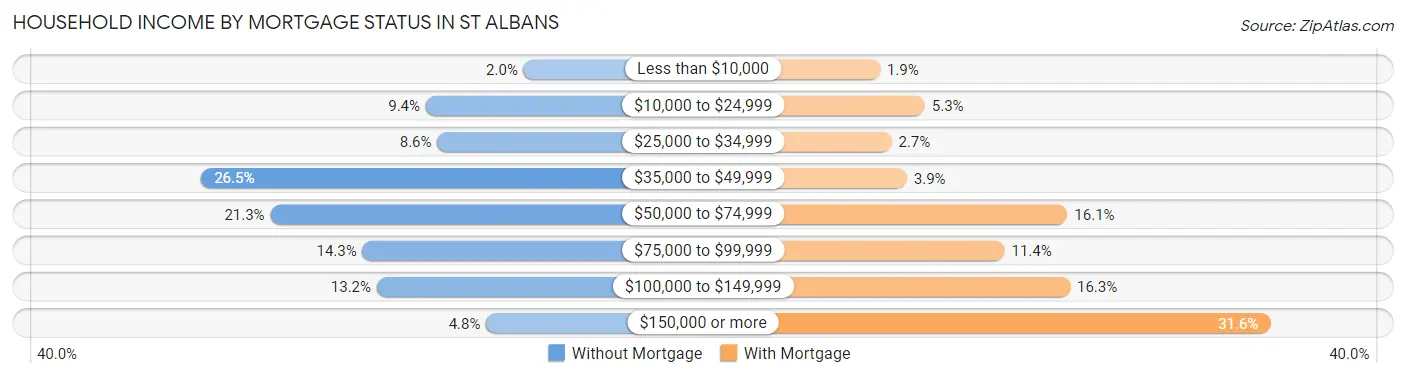
| Household Income | Without Mortgage | With Mortgage |
| Less than $10,000 | 9 (2.0%) | 19 (1.9%) |
| $10,000 to $24,999 | 43 (9.4%) | 54 (5.3%) |
| $25,000 to $34,999 | 39 (8.6%) | 28 (2.7%) |
| $35,000 to $49,999 | 121 (26.5%) | 40 (3.9%) |
| $50,000 to $74,999 | 97 (21.3%) | 165 (16.1%) |
| $75,000 to $99,999 | 65 (14.2%) | 116 (11.4%) |
| $100,000 to $149,999 | 60 (13.2%) | 167 (16.3%) |
| $150,000 or more | 22 (4.8%) | 323 (31.6%) |
| Total | 456 (100.0%) | 1,022 (100.0%) |
Property Value to Household Income Ratio in St Albans
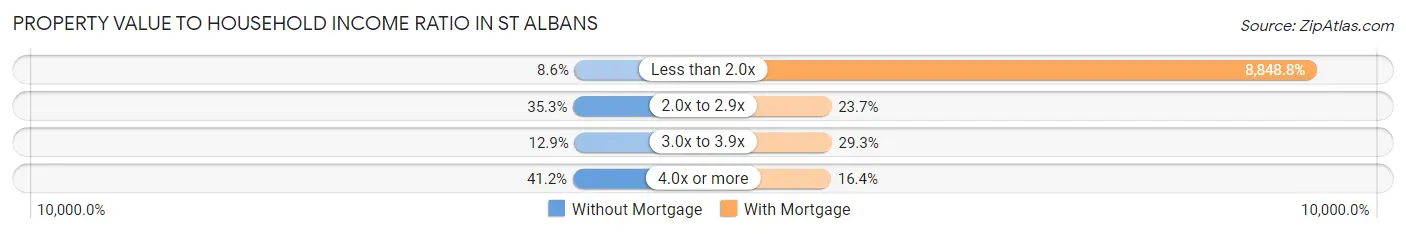
| Value-to-Income Ratio | Without Mortgage | With Mortgage |
| Less than 2.0x | 39 (8.6%) | 90,435 (8,848.8%) |
| 2.0x to 2.9x | 161 (35.3%) | 242 (23.7%) |
| 3.0x to 3.9x | 59 (12.9%) | 299 (29.3%) |
| 4.0x or more | 188 (41.2%) | 168 (16.4%) |
| Total | 456 (100.0%) | 1,022 (100.0%) |
Real Estate Taxes by Mortgage Status in St Albans
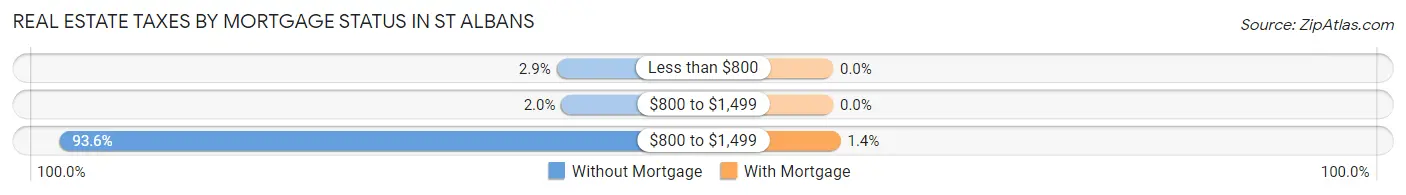
| Property Taxes | Without Mortgage | With Mortgage |
| Less than $800 | 13 (2.9%) | 0 (0.0%) |
| $800 to $1,499 | 9 (2.0%) | 0 (0.0%) |
| $800 to $1,499 | 427 (93.6%) | 14 (1.4%) |
| Total | 456 (100.0%) | 1,022 (100.0%) |
Health & Disability in St Albans
Health Insurance Coverage by Age in St Albans
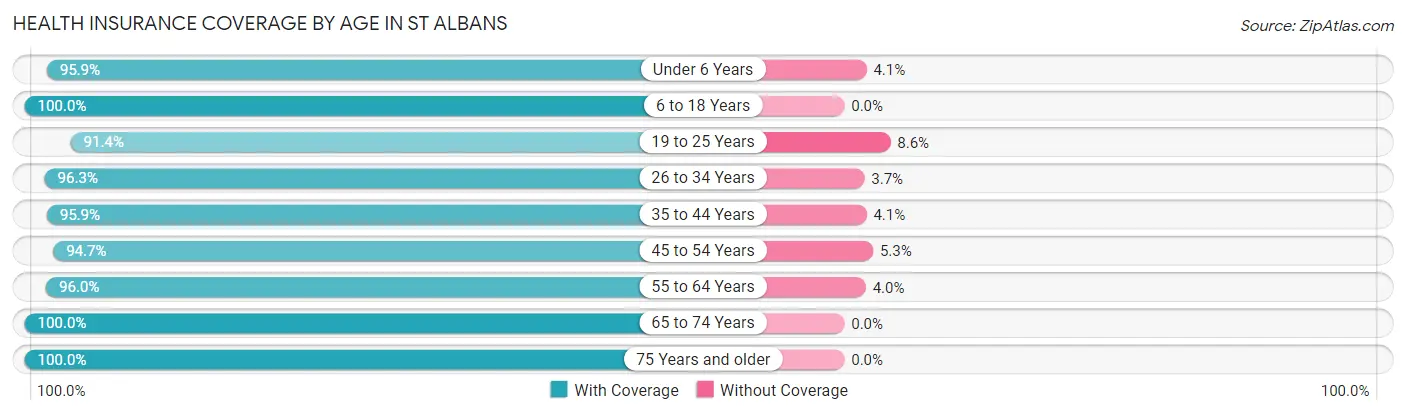
| Age Bracket | With Coverage | Without Coverage |
| Under 6 Years | 509 (95.9%) | 22 (4.1%) |
| 6 to 18 Years | 1,020 (100.0%) | 0 (0.0%) |
| 19 to 25 Years | 617 (91.4%) | 58 (8.6%) |
| 26 to 34 Years | 1,054 (96.3%) | 41 (3.7%) |
| 35 to 44 Years | 811 (95.9%) | 35 (4.1%) |
| 45 to 54 Years | 744 (94.7%) | 42 (5.3%) |
| 55 to 64 Years | 816 (96.0%) | 34 (4.0%) |
| 65 to 74 Years | 735 (100.0%) | 0 (0.0%) |
| 75 Years and older | 265 (100.0%) | 0 (0.0%) |
| Total | 6,571 (96.6%) | 232 (3.4%) |
Health Insurance Coverage by Citizenship Status in St Albans
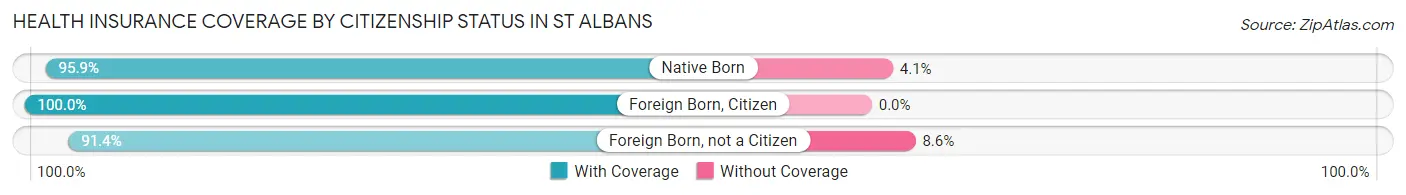
| Citizenship Status | With Coverage | Without Coverage |
| Native Born | 509 (95.9%) | 22 (4.1%) |
| Foreign Born, Citizen | 1,020 (100.0%) | 0 (0.0%) |
| Foreign Born, not a Citizen | 617 (91.4%) | 58 (8.6%) |
Health Insurance Coverage by Household Income in St Albans
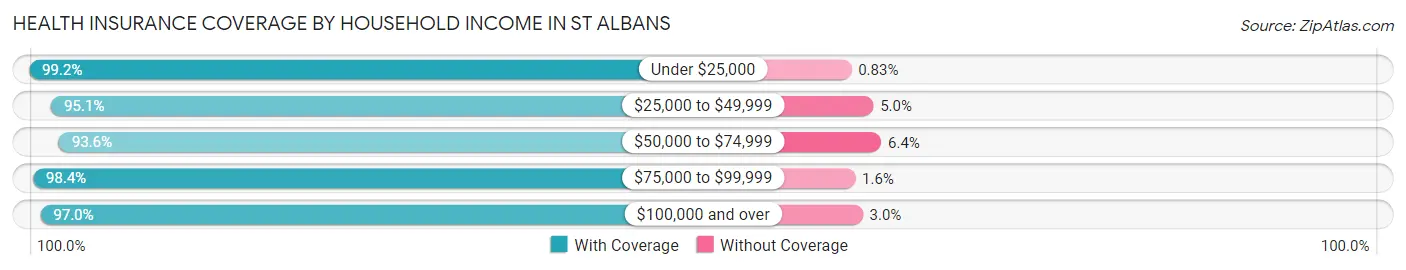
| Household Income | With Coverage | Without Coverage |
| Under $25,000 | 1,312 (99.2%) | 11 (0.8%) |
| $25,000 to $49,999 | 1,633 (95.1%) | 85 (5.0%) |
| $50,000 to $74,999 | 918 (93.6%) | 63 (6.4%) |
| $75,000 to $99,999 | 821 (98.4%) | 13 (1.6%) |
| $100,000 and over | 1,834 (97.0%) | 56 (3.0%) |
Public vs Private Health Insurance Coverage by Age in St Albans
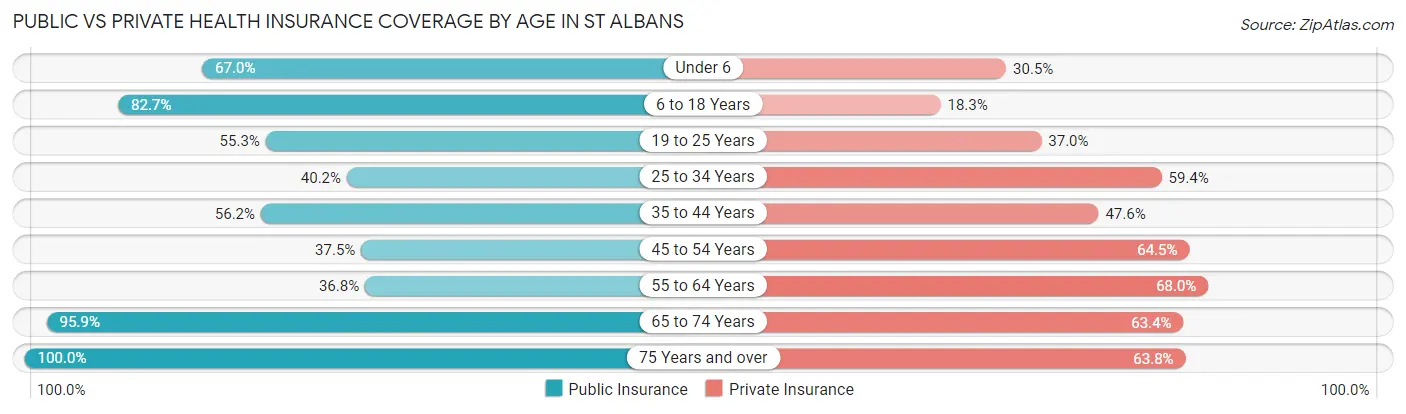
| Age Bracket | Public Insurance | Private Insurance |
| Under 6 | 356 (67.0%) | 162 (30.5%) |
| 6 to 18 Years | 843 (82.7%) | 187 (18.3%) |
| 19 to 25 Years | 373 (55.3%) | 250 (37.0%) |
| 25 to 34 Years | 440 (40.2%) | 650 (59.4%) |
| 35 to 44 Years | 475 (56.1%) | 403 (47.6%) |
| 45 to 54 Years | 295 (37.5%) | 507 (64.5%) |
| 55 to 64 Years | 313 (36.8%) | 578 (68.0%) |
| 65 to 74 Years | 705 (95.9%) | 466 (63.4%) |
| 75 Years and over | 265 (100.0%) | 169 (63.8%) |
| Total | 4,065 (59.8%) | 3,372 (49.6%) |
Disability Status by Sex by Age in St Albans
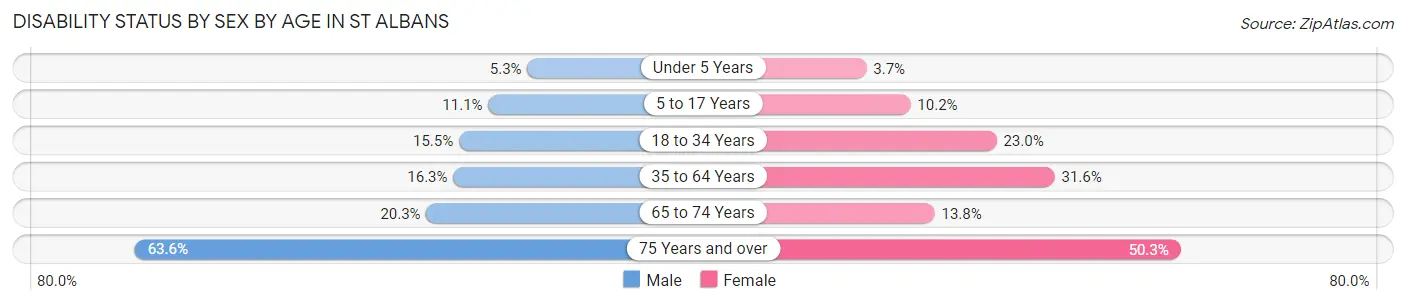
| Age Bracket | Male | Female |
| Under 5 Years | 9 (5.3%) | 11 (3.6%) |
| 5 to 17 Years | 58 (11.1%) | 44 (10.2%) |
| 18 to 34 Years | 149 (15.5%) | 215 (23.0%) |
| 35 to 64 Years | 184 (16.3%) | 428 (31.6%) |
| 65 to 74 Years | 49 (20.3%) | 68 (13.8%) |
| 75 Years and over | 70 (63.6%) | 78 (50.3%) |
Disability Class by Sex by Age in St Albans
Disability Class: Hearing Difficulty
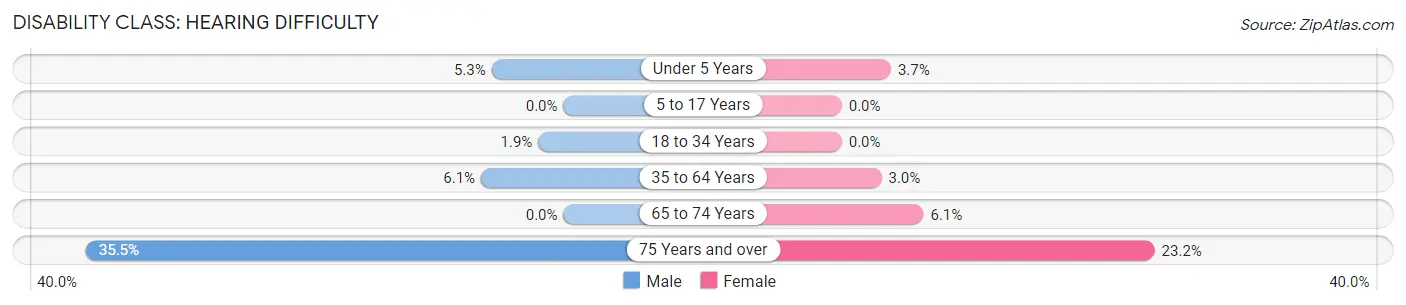
| Age Bracket | Male | Female |
| Under 5 Years | 9 (5.3%) | 11 (3.6%) |
| 5 to 17 Years | 0 (0.0%) | 0 (0.0%) |
| 18 to 34 Years | 18 (1.9%) | 0 (0.0%) |
| 35 to 64 Years | 69 (6.1%) | 40 (2.9%) |
| 65 to 74 Years | 0 (0.0%) | 30 (6.1%) |
| 75 Years and over | 39 (35.4%) | 36 (23.2%) |
Disability Class: Vision Difficulty
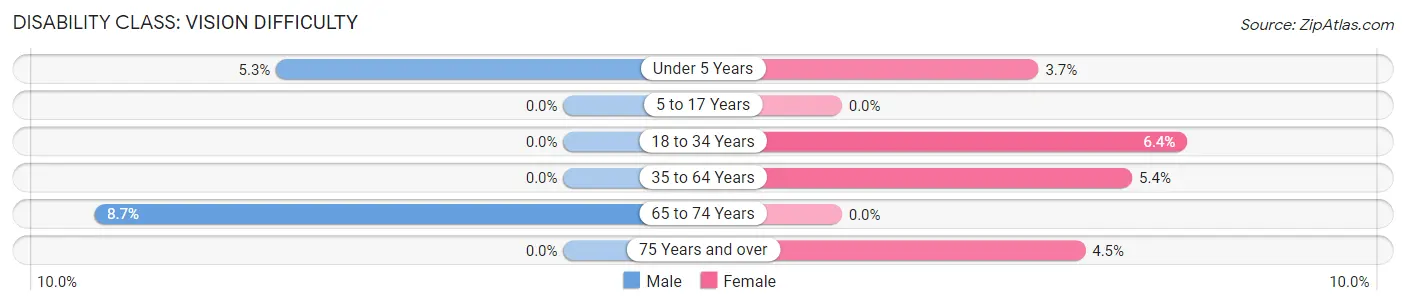
| Age Bracket | Male | Female |
| Under 5 Years | 9 (5.3%) | 11 (3.6%) |
| 5 to 17 Years | 0 (0.0%) | 0 (0.0%) |
| 18 to 34 Years | 0 (0.0%) | 60 (6.4%) |
| 35 to 64 Years | 0 (0.0%) | 73 (5.4%) |
| 65 to 74 Years | 21 (8.7%) | 0 (0.0%) |
| 75 Years and over | 0 (0.0%) | 7 (4.5%) |
Disability Class: Cognitive Difficulty
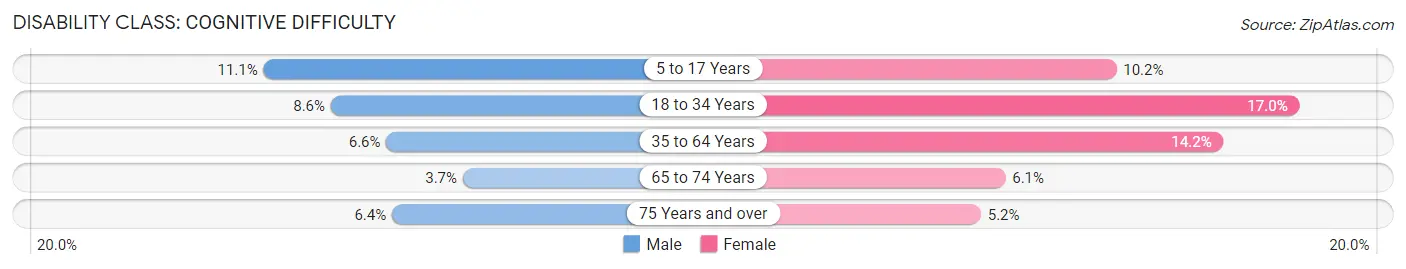
| Age Bracket | Male | Female |
| 5 to 17 Years | 58 (11.1%) | 44 (10.2%) |
| 18 to 34 Years | 83 (8.6%) | 159 (17.0%) |
| 35 to 64 Years | 74 (6.6%) | 192 (14.2%) |
| 65 to 74 Years | 9 (3.7%) | 30 (6.1%) |
| 75 Years and over | 7 (6.4%) | 8 (5.2%) |
Disability Class: Ambulatory Difficulty
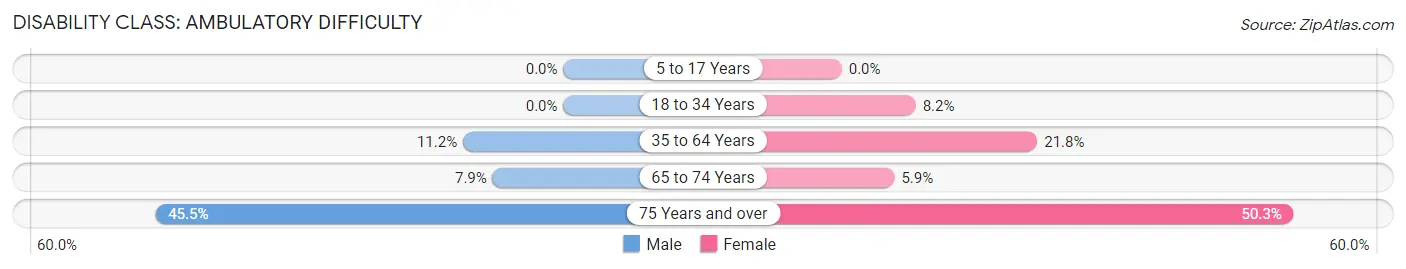
| Age Bracket | Male | Female |
| 5 to 17 Years | 0 (0.0%) | 0 (0.0%) |
| 18 to 34 Years | 0 (0.0%) | 77 (8.2%) |
| 35 to 64 Years | 126 (11.2%) | 295 (21.8%) |
| 65 to 74 Years | 19 (7.9%) | 29 (5.9%) |
| 75 Years and over | 50 (45.5%) | 78 (50.3%) |
Disability Class: Self-Care Difficulty
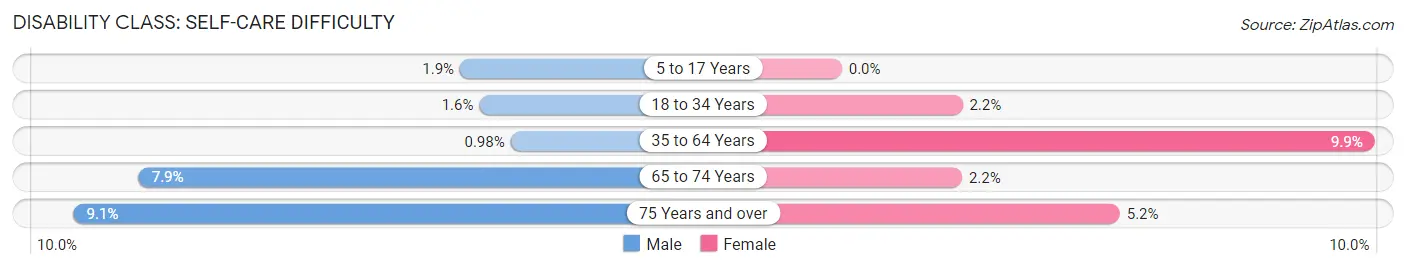
| Age Bracket | Male | Female |
| 5 to 17 Years | 10 (1.9%) | 0 (0.0%) |
| 18 to 34 Years | 15 (1.6%) | 21 (2.2%) |
| 35 to 64 Years | 11 (1.0%) | 134 (9.9%) |
| 65 to 74 Years | 19 (7.9%) | 11 (2.2%) |
| 75 Years and over | 10 (9.1%) | 8 (5.2%) |
Technology Access in St Albans
Computing Device Access in St Albans
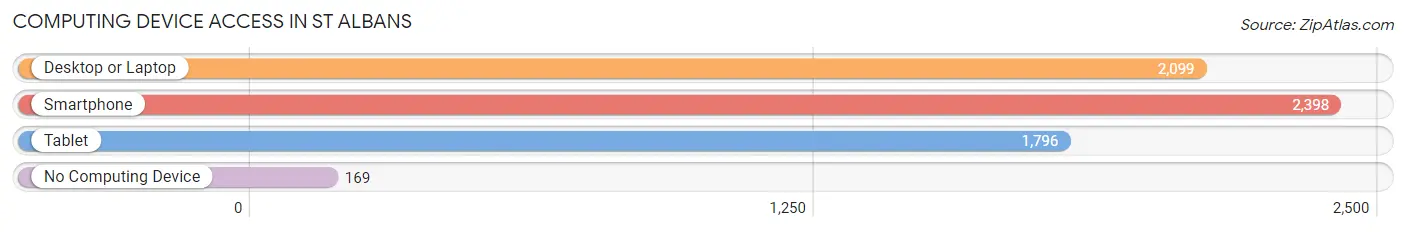
| Device Type | # Households | % Households |
| Desktop or Laptop | 2,099 | 73.3% |
| Smartphone | 2,398 | 83.8% |
| Tablet | 1,796 | 62.7% |
| No Computing Device | 169 | 5.9% |
| Total | 2,862 | 100.0% |
Internet Access in St Albans
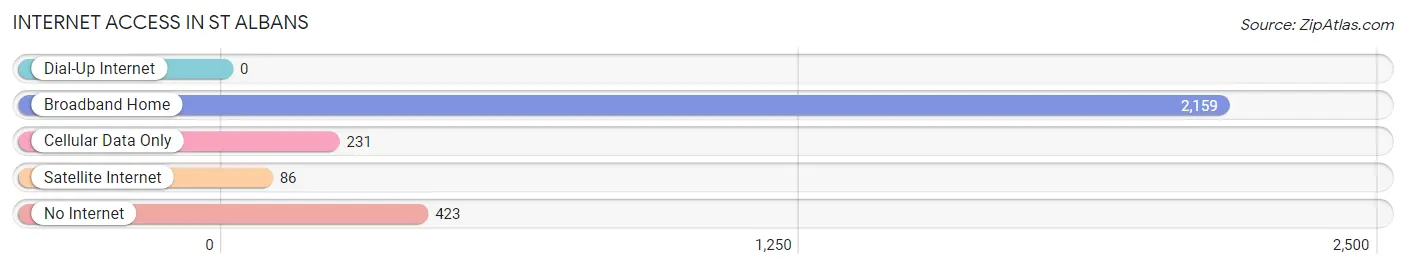
| Internet Type | # Households | % Households |
| Dial-Up Internet | 0 | 0.0% |
| Broadband Home | 2,159 | 75.4% |
| Cellular Data Only | 231 | 8.1% |
| Satellite Internet | 86 | 3.0% |
| No Internet | 423 | 14.8% |
| Total | 2,862 | 100.0% |
St Albans Summary
St Albans is a city located in northwestern Vermont, United States. It is the county seat of Franklin County and the shire town of the town of St Albans. The city is situated on the shore of Lake Champlain, near the Canada–US border. As of the 2010 census, the city had a population of 6,918.
History
The area that is now St Albans was originally inhabited by the Abenaki people. The first European settlers arrived in the area in 1763, when the land was granted to Ira Allen and his brothers. The town was named after St Albans, England, and was incorporated in 1787.
In the early 19th century, St Albans was a major port on Lake Champlain, and was a major stop on the Underground Railroad. During the War of 1812, the Battle of Plattsburgh was fought nearby.
In the late 19th century, St Albans became a major railroad hub, with the Central Vermont Railway and the Rutland Railroad both having major depots in the city. The city was also home to several major industries, including a woolen mill, a paper mill, and a foundry.
Geography
St Albans is located in northwestern Vermont, at the northern end of Lake Champlain. The city is situated at the confluence of the Missisquoi River and the Winooski River. The city is bordered to the north by the town of Swanton, to the east by the town of Fairfield, to the south by the town of St. Albans Town, and to the west by the town of Highgate.
The city has a total area of 4.2 square miles, of which 4.1 square miles is land and 0.1 square miles is water.
Economy
St Albans is the economic center of Franklin County. The city is home to several major employers, including the St. Albans Cooperative Creamery, the St. Albans Messenger, and the St. Albans Historical Society. The city is also home to several small businesses, including restaurants, retail stores, and professional services.
The city is served by the St. Albans Town Airport, which is located just outside the city limits. The airport is used for general aviation and is home to several charter and air taxi services.
Demographics
As of the 2010 census, there were 6,918 people, 2,845 households, and 1,717 families residing in the city. The population density was 1,683.3 people per square mile. The racial makeup of the city was 95.2% White, 0.7% African American, 0.5% Native American, 0.7% Asian, 0.1% Pacific Islander, 0.7% from other races, and 2.2% from two or more races. Hispanic or Latino of any race were 2.2% of the population.
The median income for a household in the city was $41,945, and the median income for a family was $50,945. Males had a median income of $36,945 versus $27,945 for females. The per capita income for the city was $20,945. About 8.2% of families and 10.2% of the population were below the poverty line, including 14.2% of those under age 18 and 8.2% of those age 65 or over.
Common Questions
What is Per Capita Income in St Albans?
Per Capita income in St Albans is $27,640.
What is the Median Family Income in St Albans?
Median Family Income in St Albans is $65,714.
What is the Median Household income in St Albans?
Median Household Income in St Albans is $49,736.
What is Income or Wage Gap in St Albans?
Income or Wage Gap in St Albans is 21.9%.
Women in St Albans earn 78.1 cents for every dollar earned by a man.
What is Family Income Deficit in St Albans?
Family Income Deficit in St Albans is $15,362.
Families that are below poverty line in St Albans earn $15,362 less on average than the poverty threshold level.
What is Inequality or Gini Index in St Albans?
Inequality or Gini Index in St Albans is 0.42.
What is the Total Population of St Albans?
Total Population of St Albans is 6,891.
What is the Total Male Population of St Albans?
Total Male Population of St Albans is 3,206.
What is the Total Female Population of St Albans?
Total Female Population of St Albans is 3,685.
What is the Ratio of Males per 100 Females in St Albans?
There are 87.00 Males per 100 Females in St Albans.
What is the Ratio of Females per 100 Males in St Albans?
There are 114.94 Females per 100 Males in St Albans.
What is the Median Population Age in St Albans?
Median Population Age in St Albans is 36.8 Years.
What is the Average Family Size in St Albans
Average Family Size in St Albans is 3.1 People.
What is the Average Household Size in St Albans
Average Household Size in St Albans is 2.4 People.
How Large is the Labor Force in St Albans?
There are 3,375 People in the Labor Forcein in St Albans.
What is the Percentage of People in the Labor Force in St Albans?
59.7% of People are in the Labor Force in St Albans.
What is the Unemployment Rate in St Albans?
Unemployment Rate in St Albans is 2.2%.