Concord, VT Map & Demographics
Concord Map
Concord Overview
$29,942
PER CAPITA INCOME
$52,188
AVG HOUSEHOLD INCOME
0.32
INEQUALITY / GINI INDEX
181
TOTAL POPULATION
74
MALE POPULATION
107
FEMALE POPULATION
69.16
MALES / 100 FEMALES
144.59
FEMALES / 100 MALES
38.6
MEDIAN AGE
2.4
AVG FAMILY SIZE
2.3
AVG HOUSEHOLD SIZE
113
LABOR FORCE [ PEOPLE ]
74.3%
PERCENT IN LABOR FORCE
Concord Zip Codes
Concord Area Codes
Income in Concord
Income Overview in Concord
| Characteristic | Number | Measure |
| Per Capita Income | 181 | $29,942 |
| Median Family Income | 59 | $0 |
| Mean Family Income | 59 | $69,707 |
| Median Household Income | 78 | $52,188 |
| Mean Household Income | 78 | $74,410 |
| Income Deficit | 59 | $0 |
| Wage / Income Gap (%) | 181 | 0.00% |
| Wage / Income Gap ($) | 181 | 100.00¢ per $1 |
| Gini / Inequality Index | 181 | 0.32 |
Earnings by Sex in Concord
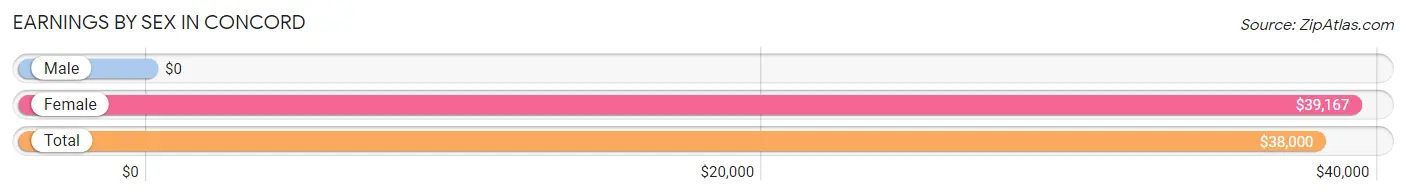
| Sex | Number | Average Earnings |
| Male | 56 (43.8%) | $0 |
| Female | 72 (56.2%) | $39,167 |
| Total | 128 (100.0%) | $38,000 |
Earnings by Sex by Income Bracket in Concord
The most common earnings brackets in Concord are $2,500 to $4,999 for men (20 | 35.7%) and $35,000 to $39,999 for women (15 | 20.8%).
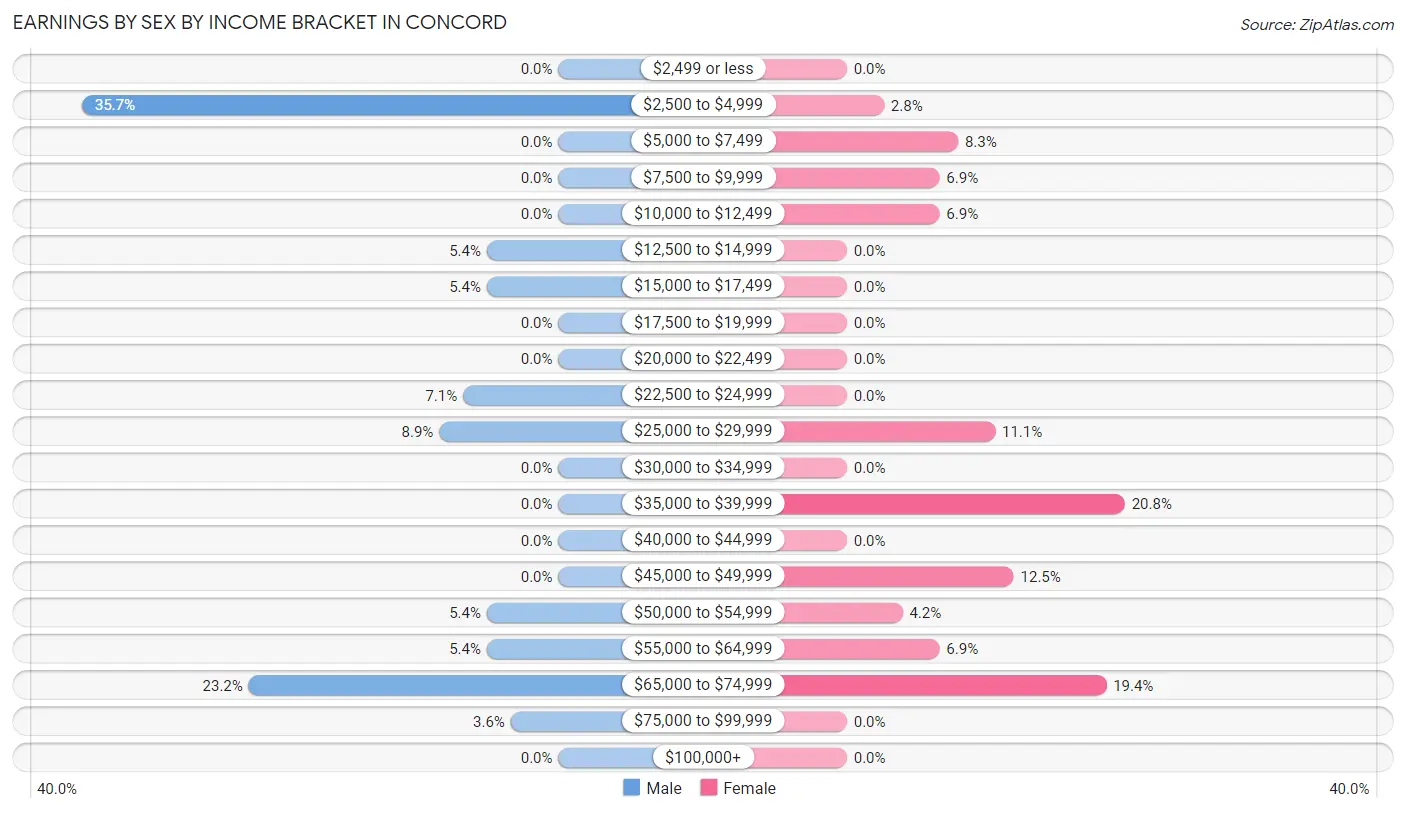
| Income | Male | Female |
| $2,499 or less | 0 (0.0%) | 0 (0.0%) |
| $2,500 to $4,999 | 20 (35.7%) | 2 (2.8%) |
| $5,000 to $7,499 | 0 (0.0%) | 6 (8.3%) |
| $7,500 to $9,999 | 0 (0.0%) | 5 (6.9%) |
| $10,000 to $12,499 | 0 (0.0%) | 5 (6.9%) |
| $12,500 to $14,999 | 3 (5.4%) | 0 (0.0%) |
| $15,000 to $17,499 | 3 (5.4%) | 0 (0.0%) |
| $17,500 to $19,999 | 0 (0.0%) | 0 (0.0%) |
| $20,000 to $22,499 | 0 (0.0%) | 0 (0.0%) |
| $22,500 to $24,999 | 4 (7.1%) | 0 (0.0%) |
| $25,000 to $29,999 | 5 (8.9%) | 8 (11.1%) |
| $30,000 to $34,999 | 0 (0.0%) | 0 (0.0%) |
| $35,000 to $39,999 | 0 (0.0%) | 15 (20.8%) |
| $40,000 to $44,999 | 0 (0.0%) | 0 (0.0%) |
| $45,000 to $49,999 | 0 (0.0%) | 9 (12.5%) |
| $50,000 to $54,999 | 3 (5.4%) | 3 (4.2%) |
| $55,000 to $64,999 | 3 (5.4%) | 5 (6.9%) |
| $65,000 to $74,999 | 13 (23.2%) | 14 (19.4%) |
| $75,000 to $99,999 | 2 (3.6%) | 0 (0.0%) |
| $100,000+ | 0 (0.0%) | 0 (0.0%) |
| Total | 56 (100.0%) | 72 (100.0%) |
Earnings by Sex by Educational Attainment in Concord
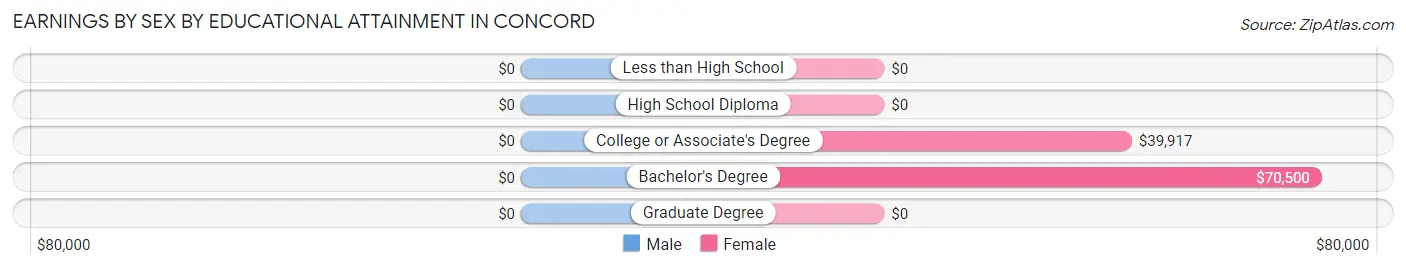
| Educational Attainment | Male Income | Female Income |
| Less than High School | - | - |
| High School Diploma | - | - |
| College or Associate's Degree | - | - |
| Bachelor's Degree | - | - |
| Graduate Degree | - | - |
| Total | - | - |
Family Income in Concord
Family Income Brackets in Concord
According to the Concord family income data, there are 25 families falling into the $100,000 to $149,999 income range, which is the most common income bracket and makes up 42.4% of all families.
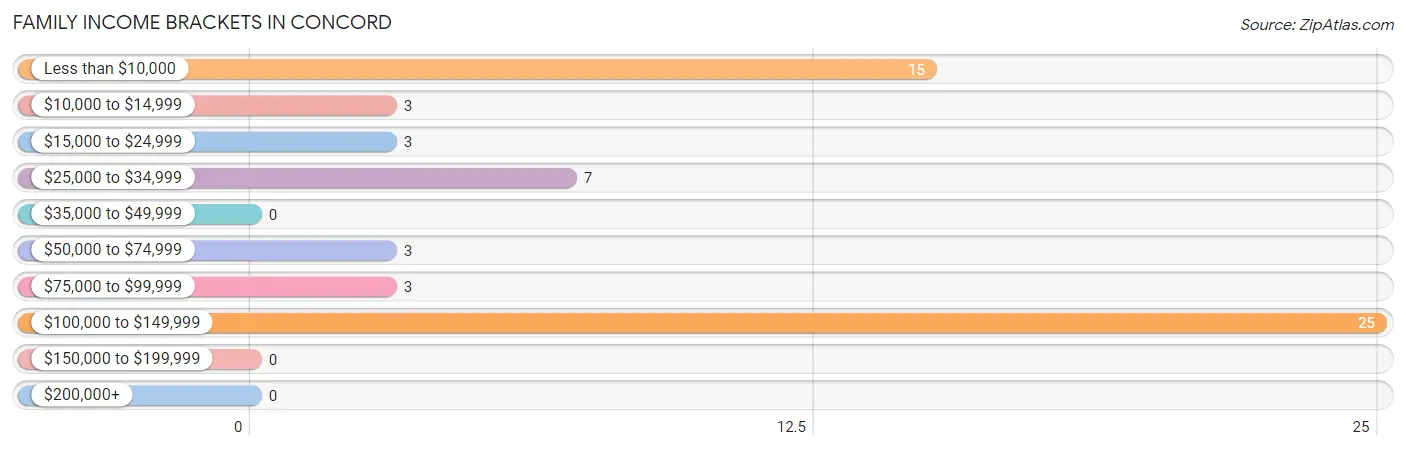
| Income Bracket | # Families | % Families |
| Less than $10,000 | 15 | 25.4% |
| $10,000 to $14,999 | 3 | 5.1% |
| $15,000 to $24,999 | 3 | 5.1% |
| $25,000 to $34,999 | 7 | 11.9% |
| $35,000 to $49,999 | 0 | 0.0% |
| $50,000 to $74,999 | 3 | 5.1% |
| $75,000 to $99,999 | 3 | 5.1% |
| $100,000 to $149,999 | 25 | 42.4% |
| $150,000 to $199,999 | 0 | 0.0% |
| $200,000+ | 0 | 0.0% |
Family Income by Famaliy Size in Concord
3-person families (28 | 47.5%) account for the highest median family income in Concord with $137,000 per family, while 3-person families (28 | 47.5%) have the highest median income of $45,667 per family member.
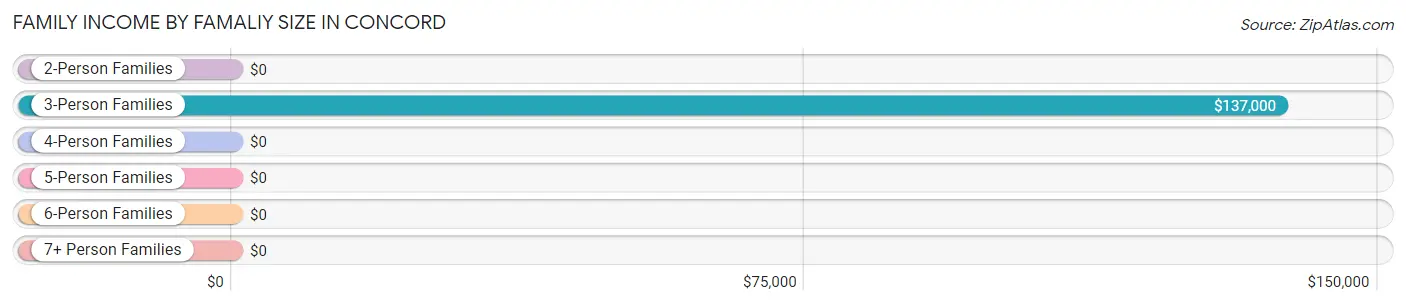
| Income Bracket | # Families | Median Income |
| 2-Person Families | 28 (47.5%) | $0 |
| 3-Person Families | 28 (47.5%) | $137,000 |
| 4-Person Families | 3 (5.1%) | $0 |
| 5-Person Families | 0 (0.0%) | $0 |
| 6-Person Families | 0 (0.0%) | $0 |
| 7+ Person Families | 0 (0.0%) | $0 |
| Total | 59 (100.0%) | $0 |
Family Income by Number of Earners in Concord
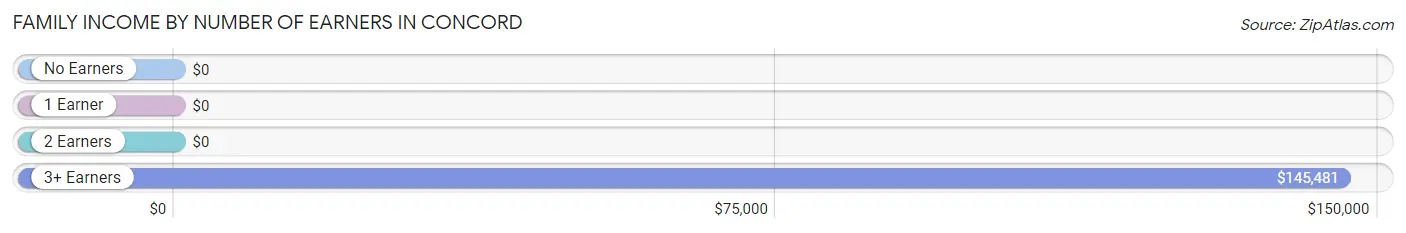
| Number of Earners | # Families | Median Income |
| No Earners | 6 (10.2%) | $0 |
| 1 Earner | 25 (42.4%) | $0 |
| 2 Earners | 7 (11.9%) | $0 |
| 3+ Earners | 21 (35.6%) | $145,481 |
| Total | 59 (100.0%) | $0 |
Household Income in Concord
Household Income Brackets in Concord
With 25 households falling in the category, the $100,000 to $149,999 income range is the most frequent in Concord, accounting for 32.1% of all households.
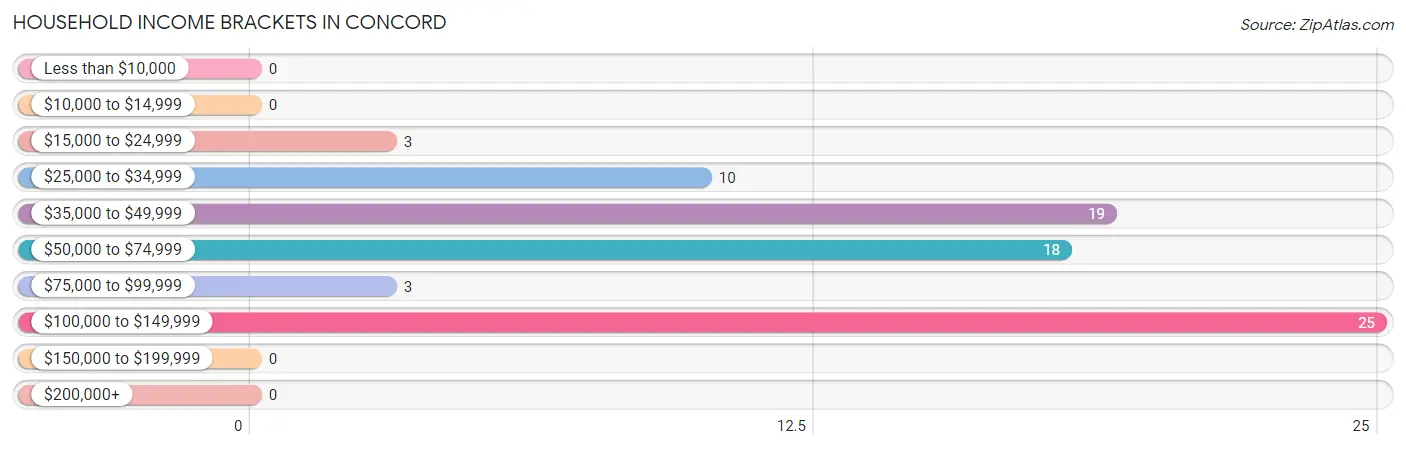
| Income Bracket | # Households | % Households |
| Less than $10,000 | 0 | 0.0% |
| $10,000 to $14,999 | 0 | 0.0% |
| $15,000 to $24,999 | 3 | 3.8% |
| $25,000 to $34,999 | 10 | 12.8% |
| $35,000 to $49,999 | 19 | 24.4% |
| $50,000 to $74,999 | 18 | 23.1% |
| $75,000 to $99,999 | 3 | 3.8% |
| $100,000 to $149,999 | 25 | 32.1% |
| $150,000 to $199,999 | 0 | 0.0% |
| $200,000+ | 0 | 0.0% |
Household Income by Householder Age in Concord
The median household income in Concord is $52,188, with the highest median household income of $109,750 found in the 45 to 64 years age bracket for the primary householder. A total of 37 households (47.4%) fall into this category.
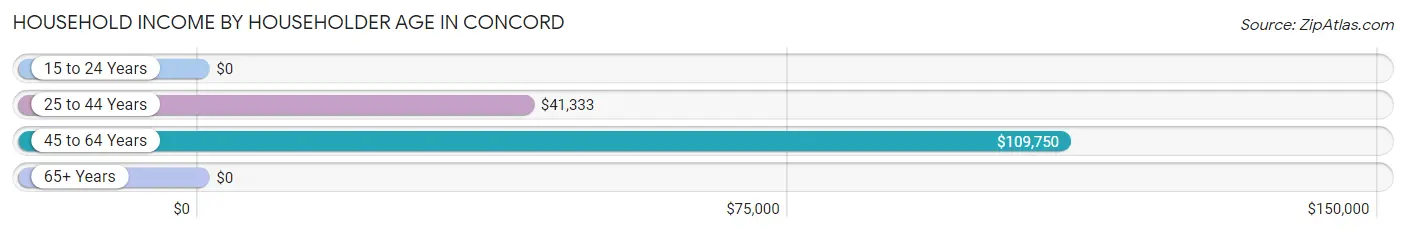
| Income Bracket | # Households | Median Income |
| 15 to 24 Years | 0 (0.0%) | $0 |
| 25 to 44 Years | 24 (30.8%) | $41,333 |
| 45 to 64 Years | 37 (47.4%) | $109,750 |
| 65+ Years | 17 (21.8%) | $0 |
| Total | 78 (100.0%) | $52,188 |
Poverty in Concord
Income Below Poverty by Sex and Age in Concord
With 24.3% poverty level for males and 15.9% for females among the residents of Concord, 35 to 44 year old males and 6 to 11 year old females are the most vulnerable to poverty, with 15 males (100.0%) and 3 females (100.0%) in their respective age groups living below the poverty level.
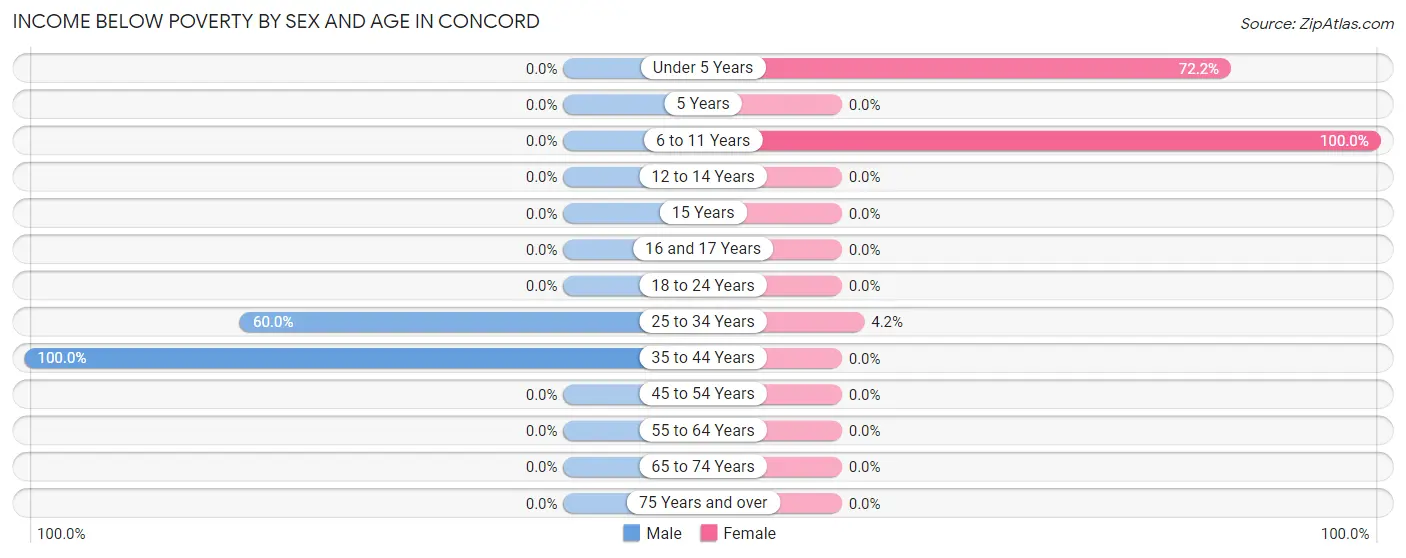
| Age Bracket | Male | Female |
| Under 5 Years | 0 (0.0%) | 13 (72.2%) |
| 5 Years | 0 (0.0%) | 0 (0.0%) |
| 6 to 11 Years | 0 (0.0%) | 3 (100.0%) |
| 12 to 14 Years | 0 (0.0%) | 0 (0.0%) |
| 15 Years | 0 (0.0%) | 0 (0.0%) |
| 16 and 17 Years | 0 (0.0%) | 0 (0.0%) |
| 18 to 24 Years | 0 (0.0%) | 0 (0.0%) |
| 25 to 34 Years | 3 (60.0%) | 1 (4.2%) |
| 35 to 44 Years | 15 (100.0%) | 0 (0.0%) |
| 45 to 54 Years | 0 (0.0%) | 0 (0.0%) |
| 55 to 64 Years | 0 (0.0%) | 0 (0.0%) |
| 65 to 74 Years | 0 (0.0%) | 0 (0.0%) |
| 75 Years and over | 0 (0.0%) | 0 (0.0%) |
| Total | 18 (24.3%) | 17 (15.9%) |
Income Above Poverty by Sex and Age in Concord
According to the poverty statistics in Concord, males aged 12 to 14 years and females aged 18 to 24 years are the age groups that are most secure financially, with 100.0% of males and 100.0% of females in these age groups living above the poverty line.
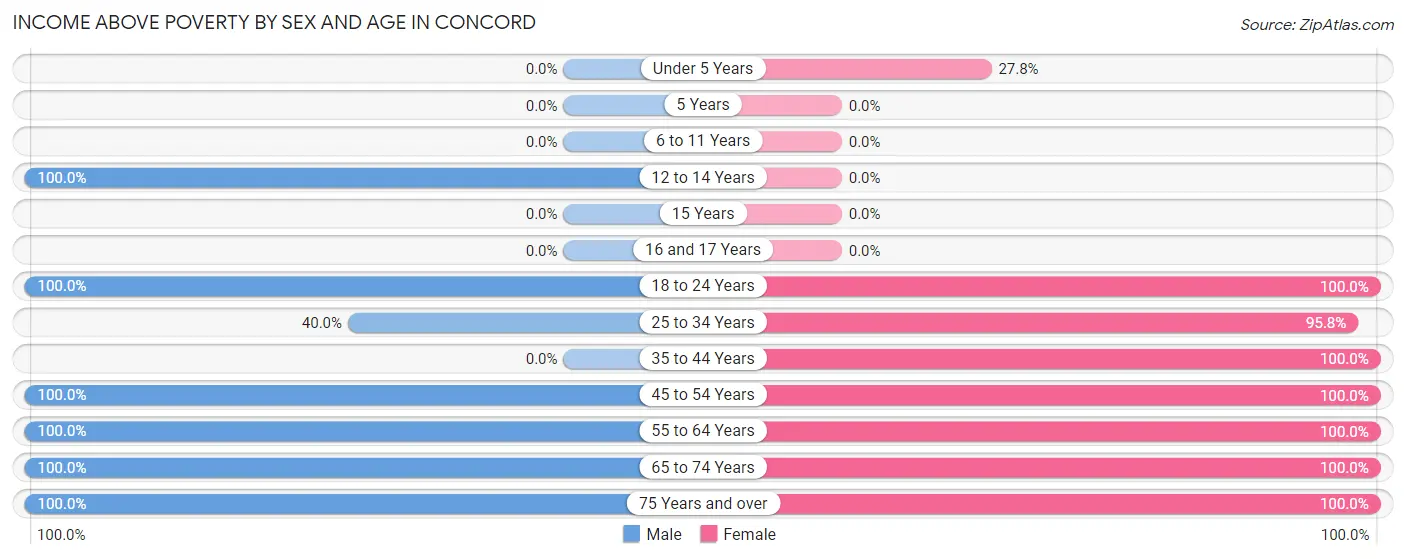
| Age Bracket | Male | Female |
| Under 5 Years | 0 (0.0%) | 5 (27.8%) |
| 5 Years | 0 (0.0%) | 0 (0.0%) |
| 6 to 11 Years | 0 (0.0%) | 0 (0.0%) |
| 12 to 14 Years | 8 (100.0%) | 0 (0.0%) |
| 15 Years | 0 (0.0%) | 0 (0.0%) |
| 16 and 17 Years | 0 (0.0%) | 0 (0.0%) |
| 18 to 24 Years | 9 (100.0%) | 15 (100.0%) |
| 25 to 34 Years | 2 (40.0%) | 23 (95.8%) |
| 35 to 44 Years | 0 (0.0%) | 4 (100.0%) |
| 45 to 54 Years | 6 (100.0%) | 14 (100.0%) |
| 55 to 64 Years | 16 (100.0%) | 18 (100.0%) |
| 65 to 74 Years | 12 (100.0%) | 8 (100.0%) |
| 75 Years and over | 3 (100.0%) | 3 (100.0%) |
| Total | 56 (75.7%) | 90 (84.1%) |
Income Below Poverty Among Married-Couple Families in Concord
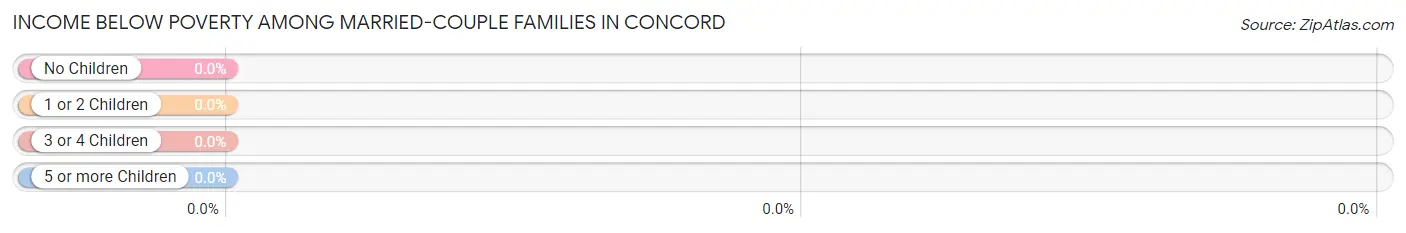
| Children | Above Poverty | Below Poverty |
| No Children | 24 (100.0%) | 0 (0.0%) |
| 1 or 2 Children | 7 (100.0%) | 0 (0.0%) |
| 3 or 4 Children | 0 (0.0%) | 0 (0.0%) |
| 5 or more Children | 0 (0.0%) | 0 (0.0%) |
| Total | 31 (100.0%) | 0 (0.0%) |
Income Below Poverty Among Single-Parent Households in Concord
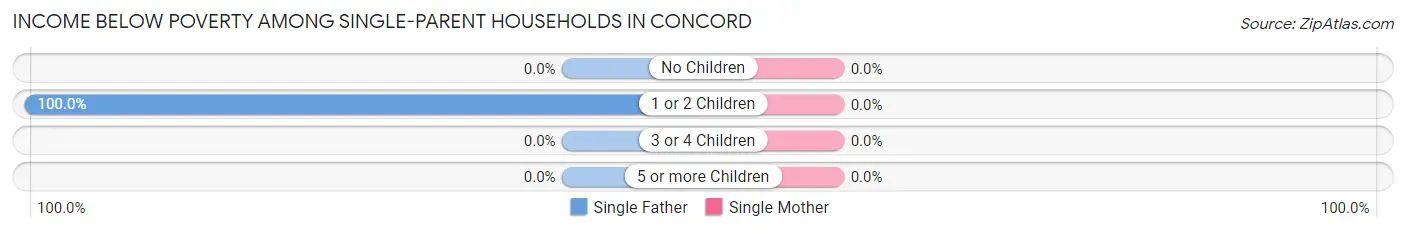
| Children | Single Father | Single Mother |
| No Children | 0 (0.0%) | 0 (0.0%) |
| 1 or 2 Children | 18 (100.0%) | 0 (0.0%) |
| 3 or 4 Children | 0 (0.0%) | 0 (0.0%) |
| 5 or more Children | 0 (0.0%) | 0 (0.0%) |
| Total | 18 (85.7%) | 0 (0.0%) |
Income Below Poverty Among Married-Couple vs Single-Parent Households in Concord
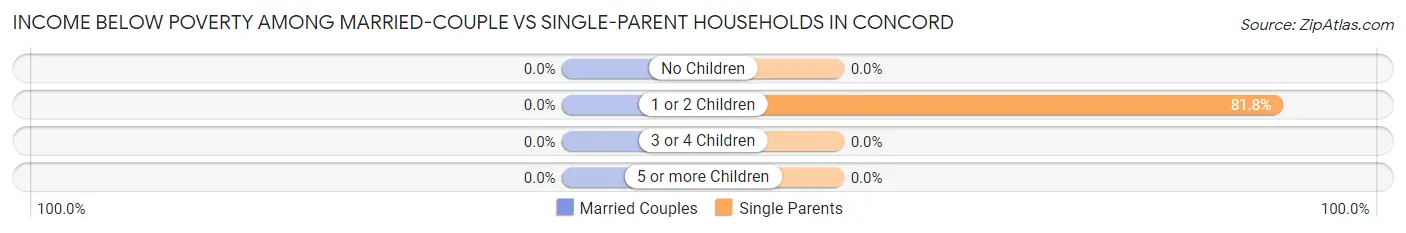
| Children | Married-Couple Families | Single-Parent Households |
| No Children | 0 (0.0%) | 0 (0.0%) |
| 1 or 2 Children | 0 (0.0%) | 18 (81.8%) |
| 3 or 4 Children | 0 (0.0%) | 0 (0.0%) |
| 5 or more Children | 0 (0.0%) | 0 (0.0%) |
| Total | 0 (0.0%) | 18 (64.3%) |
Race in Concord
The most populous races in Concord are White / Caucasian (173 | 95.6%), and Asian (8 | 4.4%).
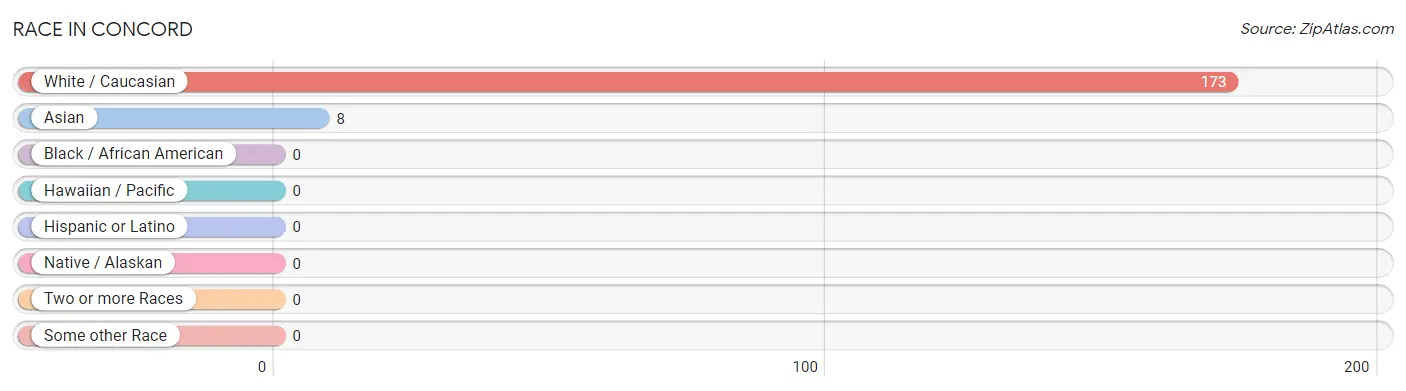
| Race | # Population | % Population |
| Asian | 8 | 4.4% |
| Black / African American | 0 | 0.0% |
| Hawaiian / Pacific | 0 | 0.0% |
| Hispanic or Latino | 0 | 0.0% |
| Native / Alaskan | 0 | 0.0% |
| White / Caucasian | 173 | 95.6% |
| Two or more Races | 0 | 0.0% |
| Some other Race | 0 | 0.0% |
| Total | 181 | 100.0% |
Ancestry in Concord
The most populous ancestries reported in Concord are English (48 | 26.5%), French (35 | 19.3%), Portuguese (25 | 13.8%), Irish (24 | 13.3%), and Scottish (17 | 9.4%), together accounting for 82.3% of all Concord residents.
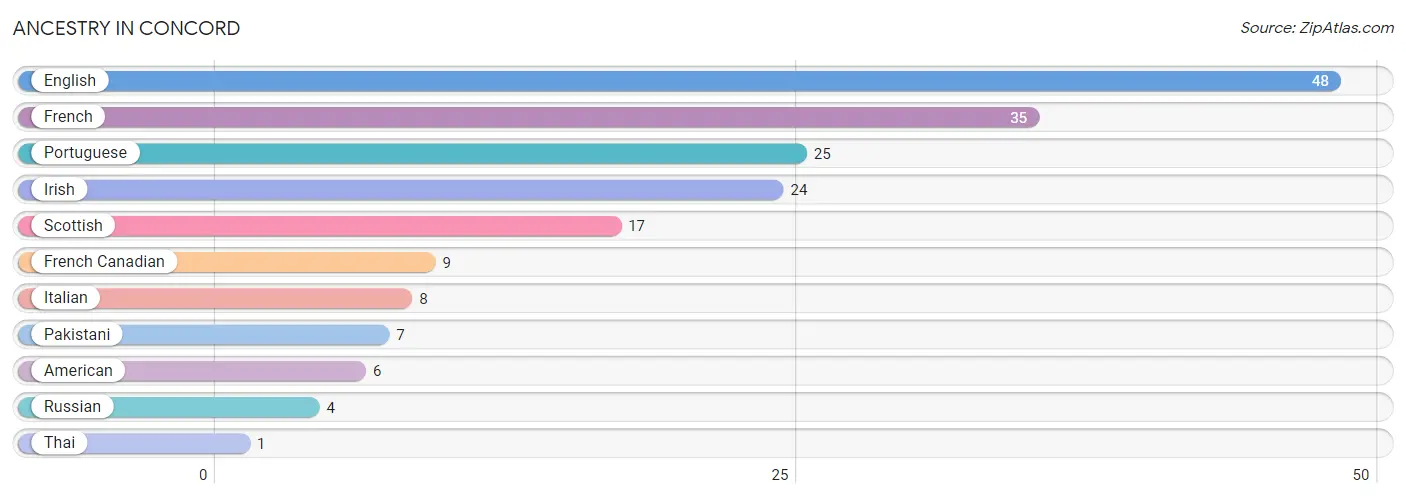
| Ancestry | # Population | % Population |
| American | 6 | 3.3% |
| English | 48 | 26.5% |
| French | 35 | 19.3% |
| French Canadian | 9 | 5.0% |
| Irish | 24 | 13.3% |
| Italian | 8 | 4.4% |
| Pakistani | 7 | 3.9% |
| Portuguese | 25 | 13.8% |
| Russian | 4 | 2.2% |
| Scottish | 17 | 9.4% |
| Thai | 1 | 0.5% | View All 11 Rows |
Immigrants in Concord
The most numerous immigrant groups reported in Concord came from Canada (4 | 2.2%), Asia (3 | 1.7%), South Eastern Asia (3 | 1.7%), and Thailand (3 | 1.7%), together accounting for 7.2% of all Concord residents.
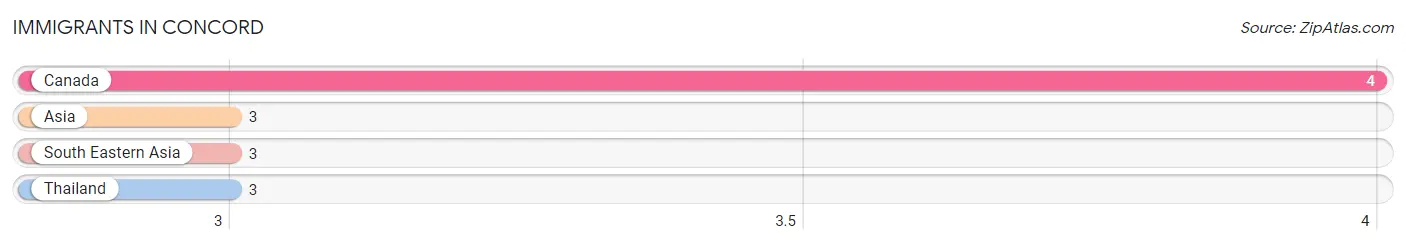
| Immigration Origin | # Population | % Population |
| Asia | 3 | 1.7% |
| Canada | 4 | 2.2% |
| South Eastern Asia | 3 | 1.7% |
| Thailand | 3 | 1.7% | View All 4 Rows |
Sex and Age in Concord
Sex and Age in Concord
The most populous age groups in Concord are 35 to 39 Years (15 | 20.3%) for men and 30 to 34 Years (20 | 18.7%) for women.
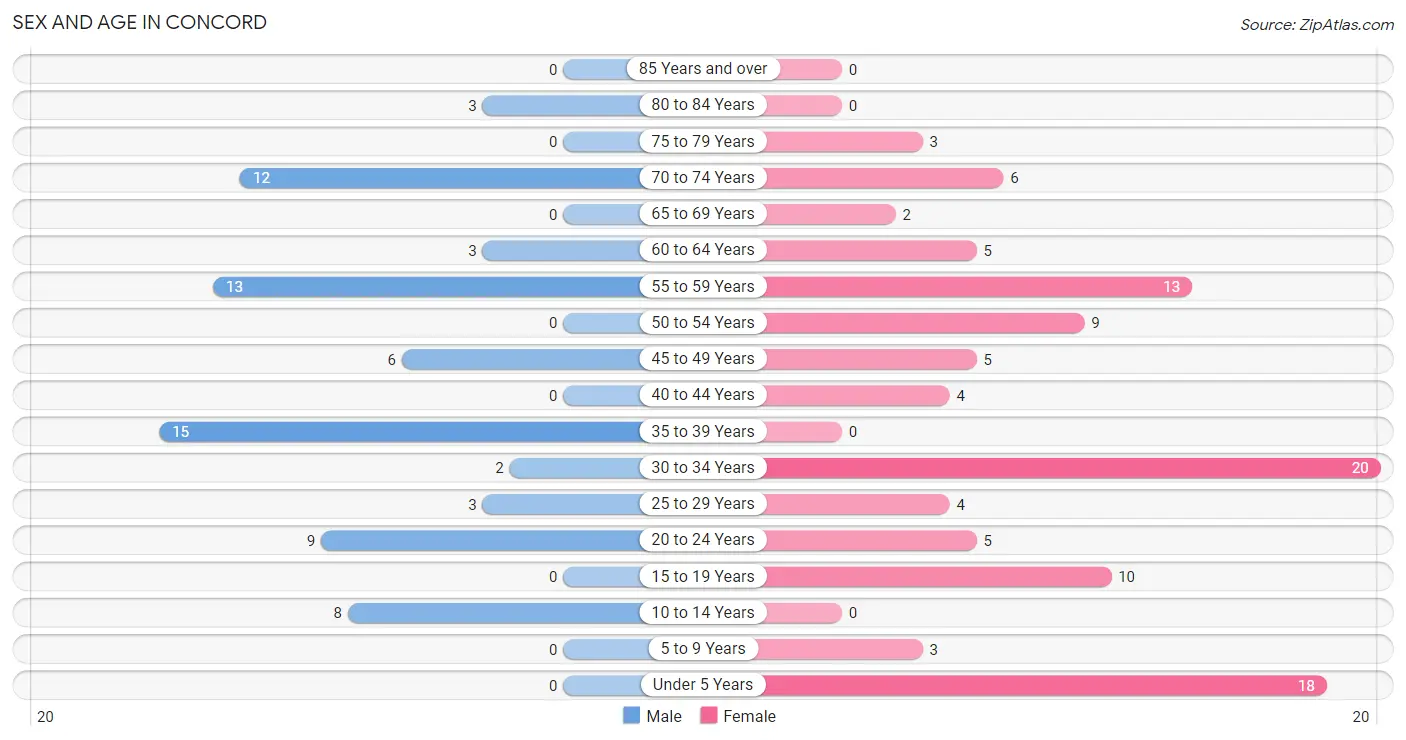
| Age Bracket | Male | Female |
| Under 5 Years | 0 (0.0%) | 18 (16.8%) |
| 5 to 9 Years | 0 (0.0%) | 3 (2.8%) |
| 10 to 14 Years | 8 (10.8%) | 0 (0.0%) |
| 15 to 19 Years | 0 (0.0%) | 10 (9.3%) |
| 20 to 24 Years | 9 (12.2%) | 5 (4.7%) |
| 25 to 29 Years | 3 (4.1%) | 4 (3.7%) |
| 30 to 34 Years | 2 (2.7%) | 20 (18.7%) |
| 35 to 39 Years | 15 (20.3%) | 0 (0.0%) |
| 40 to 44 Years | 0 (0.0%) | 4 (3.7%) |
| 45 to 49 Years | 6 (8.1%) | 5 (4.7%) |
| 50 to 54 Years | 0 (0.0%) | 9 (8.4%) |
| 55 to 59 Years | 13 (17.6%) | 13 (12.1%) |
| 60 to 64 Years | 3 (4.1%) | 5 (4.7%) |
| 65 to 69 Years | 0 (0.0%) | 2 (1.9%) |
| 70 to 74 Years | 12 (16.2%) | 6 (5.6%) |
| 75 to 79 Years | 0 (0.0%) | 3 (2.8%) |
| 80 to 84 Years | 3 (4.1%) | 0 (0.0%) |
| 85 Years and over | 0 (0.0%) | 0 (0.0%) |
| Total | 74 (100.0%) | 107 (100.0%) |
Families and Households in Concord
Median Family Size in Concord
The median family size in Concord is 2.36 persons per family, with single female/mother families (7 | 11.9%) accounting for the largest median family size of 3.29 persons per family. On the other hand, single male/father families (21 | 35.6%) represent the smallest median family size with 1.86 persons per family.
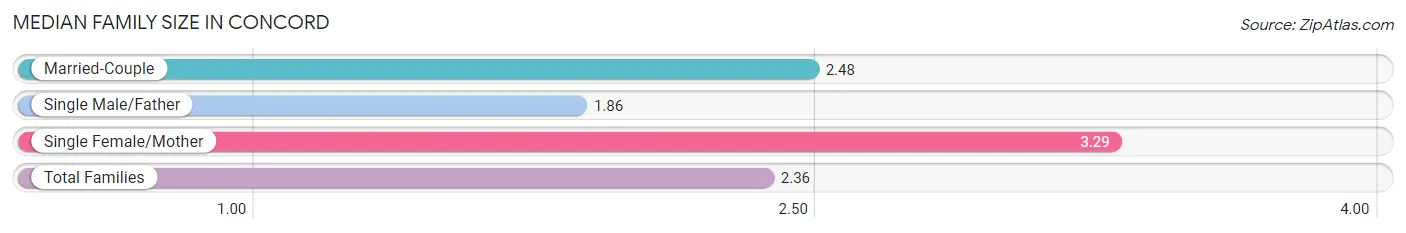
| Family Type | # Families | Family Size |
| Married-Couple | 31 (52.5%) | 2.48 |
| Single Male/Father | 21 (35.6%) | 1.86 |
| Single Female/Mother | 7 (11.9%) | 3.29 |
| Total Families | 59 (100.0%) | 2.36 |
Median Household Size in Concord
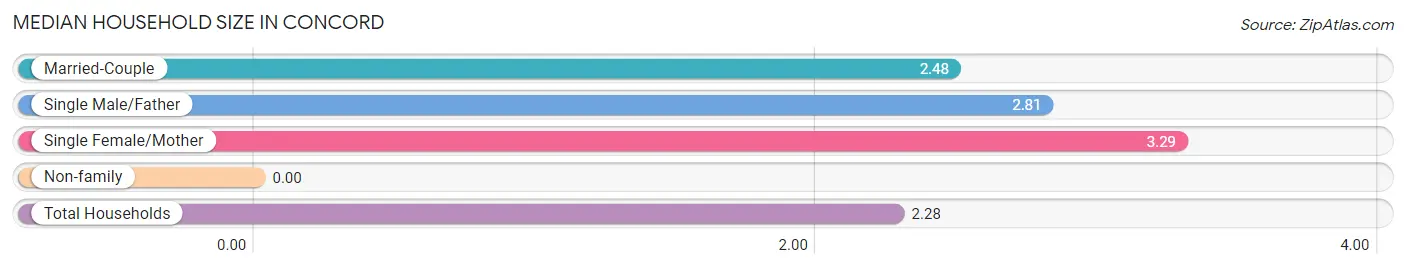
| Household Type | # Households | Household Size |
| Married-Couple | 31 (39.7%) | 2.48 |
| Single Male/Father | 21 (26.9%) | 2.81 |
| Single Female/Mother | 7 (9.0%) | 3.29 |
| Non-family | 19 (24.4%) | - |
| Total Households | 78 (100.0%) | 2.28 |
Household Size by Marriage Status in Concord
Out of a total of 78 households in Concord, 59 (75.6%) are family households, while 19 (24.4%) are nonfamily households. The most numerous type of family households are 3-person households, comprising 40, and the most common type of nonfamily households are 1-person households, comprising 19.
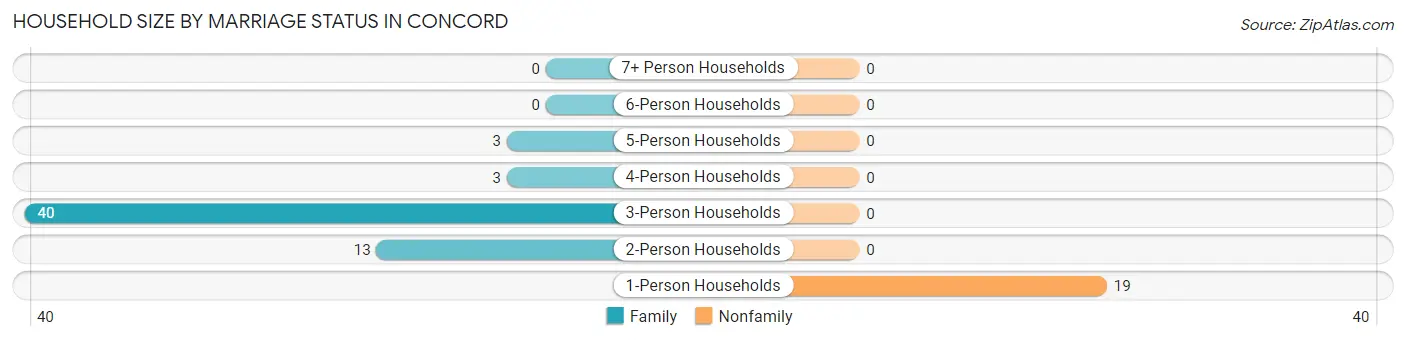
| Household Size | Family Households | Nonfamily Households |
| 1-Person Households | - | 19 (24.4%) |
| 2-Person Households | 13 (16.7%) | 0 (0.0%) |
| 3-Person Households | 40 (51.3%) | 0 (0.0%) |
| 4-Person Households | 3 (3.8%) | 0 (0.0%) |
| 5-Person Households | 3 (3.8%) | 0 (0.0%) |
| 6-Person Households | 0 (0.0%) | 0 (0.0%) |
| 7+ Person Households | 0 (0.0%) | 0 (0.0%) |
| Total | 59 (75.6%) | 19 (24.4%) |
Female Fertility in Concord
Fertility by Age in Concord
Average fertility rate in Concord is 104.0 births per 1,000 women. Women in the age bracket of 20 to 34 years have the highest fertility rate with 172.0 births per 1,000 women. Women in the age bracket of 20 to 34 years acount for 100.0% of all women with births.
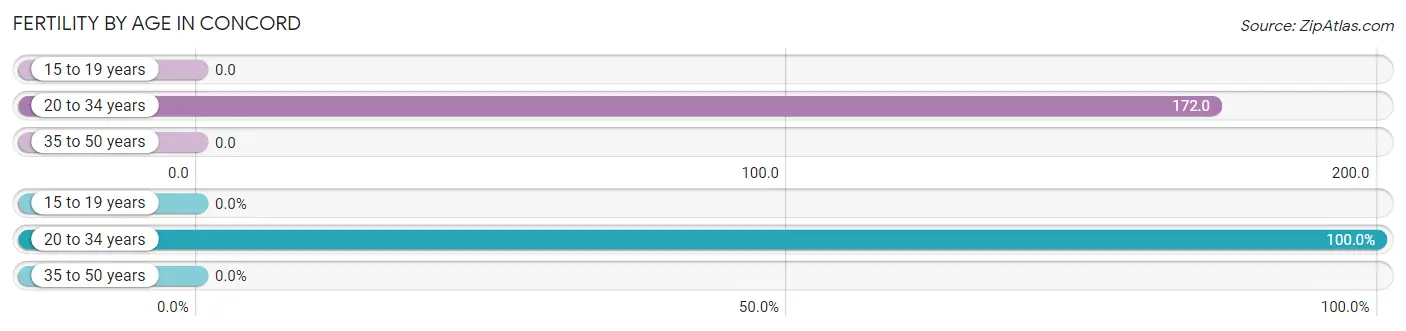
| Age Bracket | Women with Births | Births / 1,000 Women |
| 15 to 19 years | 0 (0.0%) | 0.0 |
| 20 to 34 years | 5 (100.0%) | 172.0 |
| 35 to 50 years | 0 (0.0%) | 0.0 |
| Total | 5 (100.0%) | 104.0 |
Fertility by Age by Marriage Status in Concord
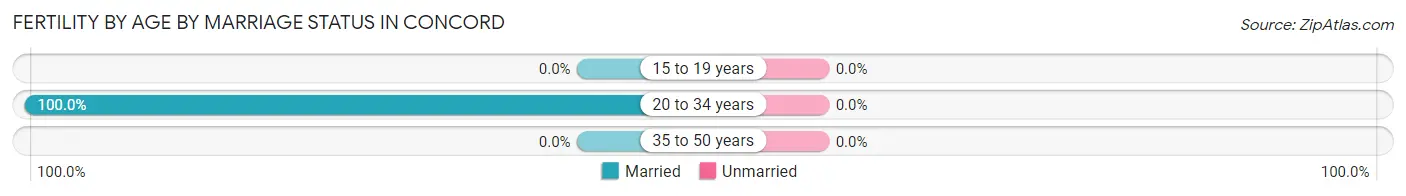
| Age Bracket | Married | Unmarried |
| 15 to 19 years | 0 (0.0%) | 0 (0.0%) |
| 20 to 34 years | 5 (100.0%) | 0 (0.0%) |
| 35 to 50 years | 0 (0.0%) | 0 (0.0%) |
| Total | 5 (100.0%) | 0 (0.0%) |
Fertility by Education in Concord
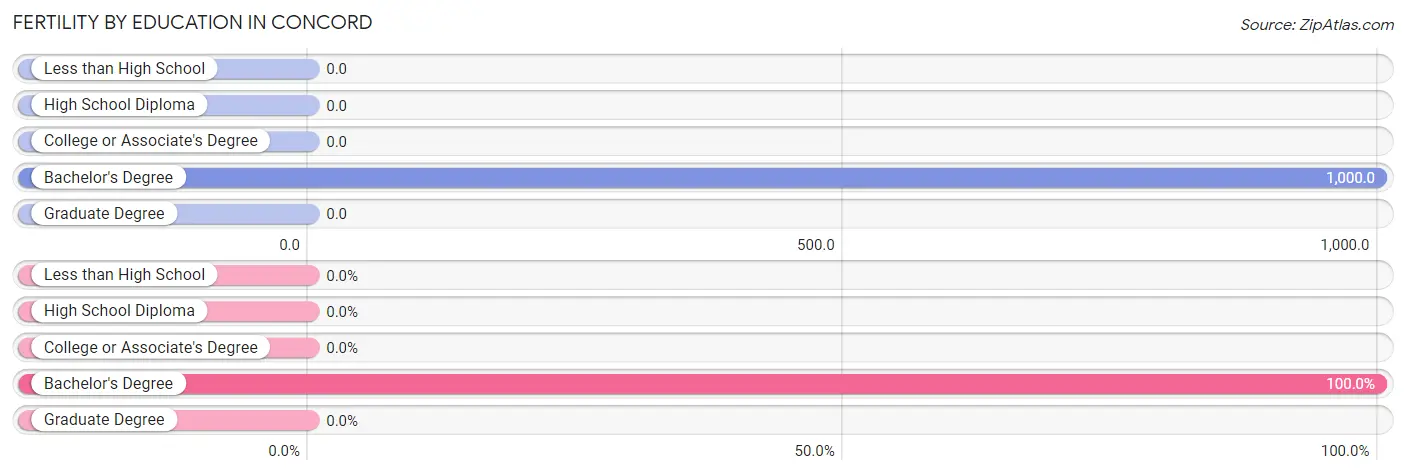
| Educational Attainment | Women with Births | Births / 1,000 Women |
| Less than High School | 0 (0.0%) | 0.0 |
| High School Diploma | 0 (0.0%) | 0.0 |
| College or Associate's Degree | 0 (0.0%) | 0.0 |
| Bachelor's Degree | 5 (100.0%) | 1,000.0 |
| Graduate Degree | 0 (0.0%) | 0.0 |
| Total | 5 (100.0%) | 104.0 |
Fertility by Education by Marriage Status in Concord
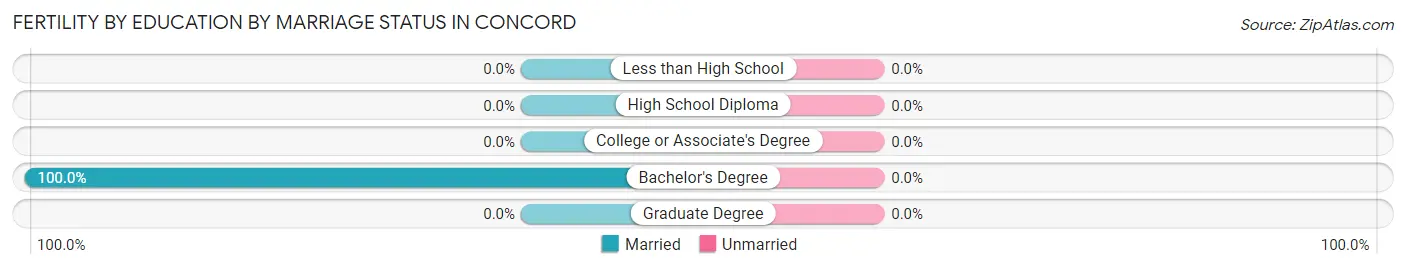
| Educational Attainment | Married | Unmarried |
| Less than High School | 0 (0.0%) | 0 (0.0%) |
| High School Diploma | 0 (0.0%) | 0 (0.0%) |
| College or Associate's Degree | 0 (0.0%) | 0 (0.0%) |
| Bachelor's Degree | 5 (100.0%) | 0 (0.0%) |
| Graduate Degree | 0 (0.0%) | 0 (0.0%) |
| Total | 5 (100.0%) | 0 (0.0%) |
Employment Characteristics in Concord
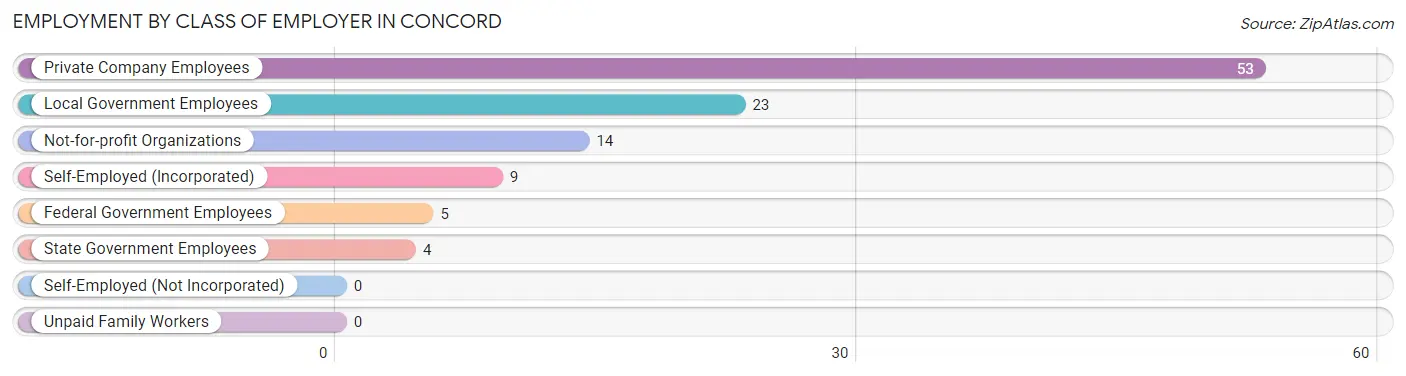
Employment by Class of Employer in Concord
Among the 108 employed individuals in Concord, private company employees (53 | 49.1%), local government employees (23 | 21.3%), and not-for-profit organizations (14 | 13.0%) make up the most common classes of employment.
| Employer Class | # Employees | % Employees |
| Private Company Employees | 53 | 49.1% |
| Self-Employed (Incorporated) | 9 | 8.3% |
| Self-Employed (Not Incorporated) | 0 | 0.0% |
| Not-for-profit Organizations | 14 | 13.0% |
| Local Government Employees | 23 | 21.3% |
| State Government Employees | 4 | 3.7% |
| Federal Government Employees | 5 | 4.6% |
| Unpaid Family Workers | 0 | 0.0% |
| Total | 108 | 100.0% |
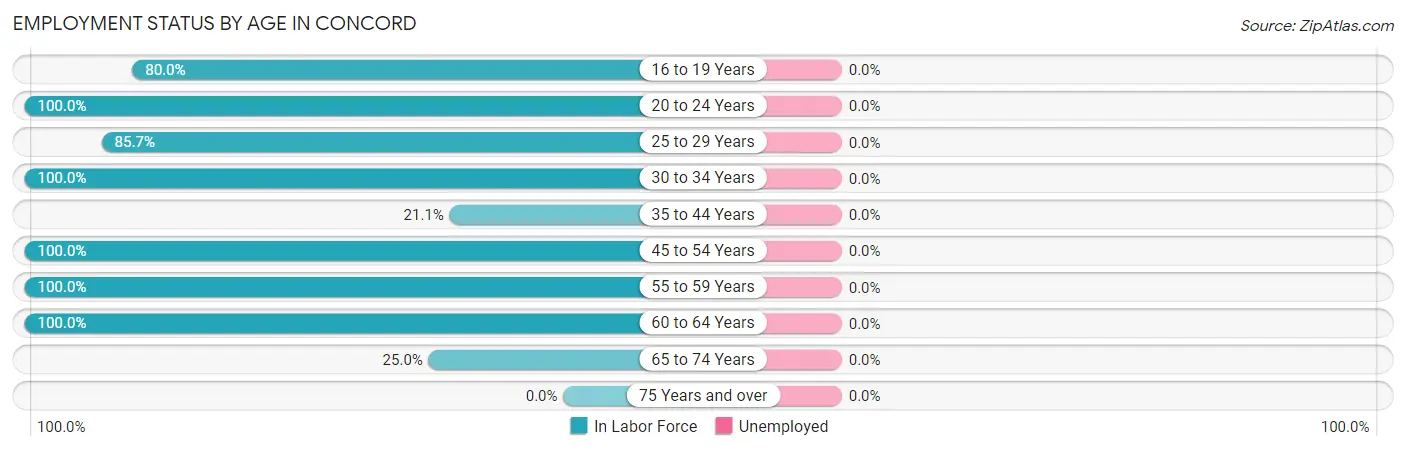
Employment Status by Age in Concord
| Age Bracket | In Labor Force | Unemployed |
| 16 to 19 Years | 8 (80.0%) | 0 (0.0%) |
| 20 to 24 Years | 14 (100.0%) | 0 (0.0%) |
| 25 to 29 Years | 6 (85.7%) | 0 (0.0%) |
| 30 to 34 Years | 22 (100.0%) | 0 (0.0%) |
| 35 to 44 Years | 4 (21.1%) | 0 (0.0%) |
| 45 to 54 Years | 20 (100.0%) | 0 (0.0%) |
| 55 to 59 Years | 26 (100.0%) | 0 (0.0%) |
| 60 to 64 Years | 8 (100.0%) | 0 (0.0%) |
| 65 to 74 Years | 5 (25.0%) | 0 (0.0%) |
| 75 Years and over | 0 (0.0%) | 0 (0.0%) |
| Total | 113 (74.3%) | 0 (0.0%) |
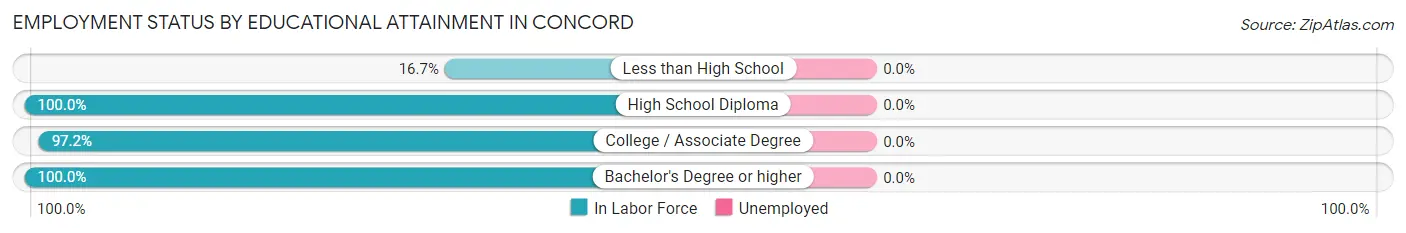
Employment Status by Educational Attainment in Concord
| Educational Attainment | In Labor Force | Unemployed |
| Less than High School | 3 (16.7%) | 0 (0.0%) |
| High School Diploma | 13 (100.0%) | 0 (0.0%) |
| College / Associate Degree | 35 (97.2%) | 0 (0.0%) |
| Bachelor's Degree or higher | 35 (100.0%) | 0 (0.0%) |
| Total | 86 (84.3%) | 0 (0.0%) |
Employment Occupations by Sex in Concord
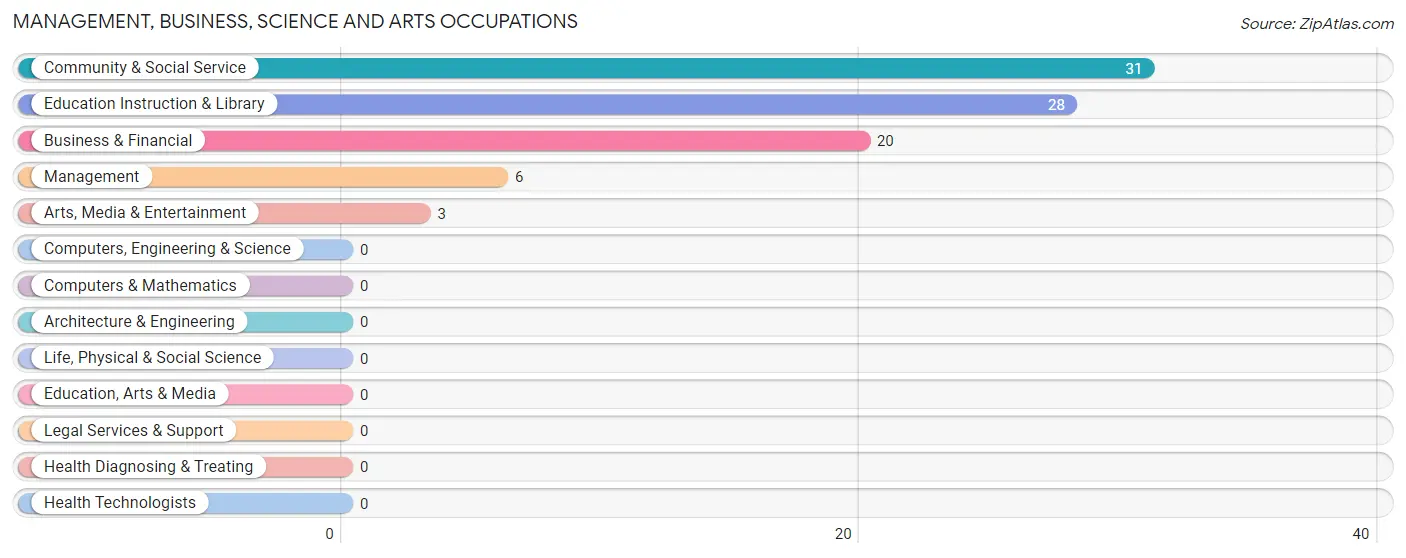
Management, Business, Science and Arts Occupations
The most common Management, Business, Science and Arts occupations in Concord are Community & Social Service (31 | 27.9%), Education Instruction & Library (28 | 25.2%), Business & Financial (20 | 18.0%), Management (6 | 5.4%), and Arts, Media & Entertainment (3 | 2.7%).
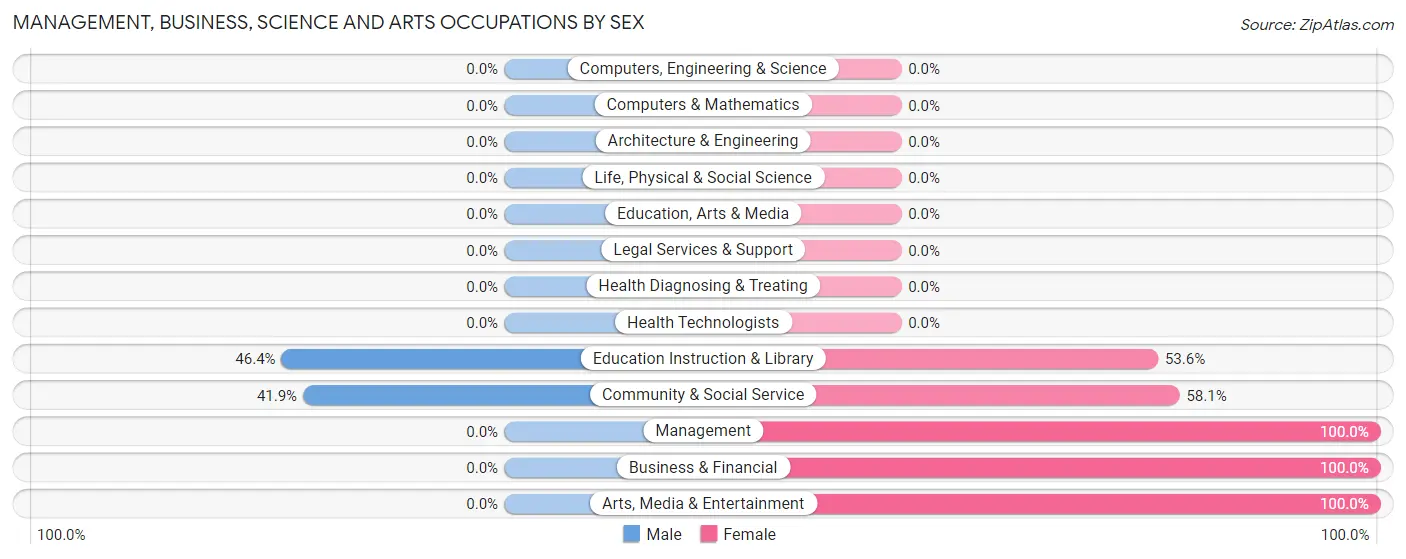
Management, Business, Science and Arts Occupations by Sex
Within the Management, Business, Science and Arts occupations in Concord, the most male-oriented occupations are Education Instruction & Library (46.4%), and Community & Social Service (41.9%), while the most female-oriented occupations are Management (100.0%), Business & Financial (100.0%), and Arts, Media & Entertainment (100.0%).
| Occupation | Male | Female |
| Management | 0 (0.0%) | 6 (100.0%) |
| Business & Financial | 0 (0.0%) | 20 (100.0%) |
| Computers, Engineering & Science | 0 (0.0%) | 0 (0.0%) |
| Computers & Mathematics | 0 (0.0%) | 0 (0.0%) |
| Architecture & Engineering | 0 (0.0%) | 0 (0.0%) |
| Life, Physical & Social Science | 0 (0.0%) | 0 (0.0%) |
| Community & Social Service | 13 (41.9%) | 18 (58.1%) |
| Education, Arts & Media | 0 (0.0%) | 0 (0.0%) |
| Legal Services & Support | 0 (0.0%) | 0 (0.0%) |
| Education Instruction & Library | 13 (46.4%) | 15 (53.6%) |
| Arts, Media & Entertainment | 0 (0.0%) | 3 (100.0%) |
| Health Diagnosing & Treating | 0 (0.0%) | 0 (0.0%) |
| Health Technologists | 0 (0.0%) | 0 (0.0%) |
| Total (Category) | 13 (22.8%) | 44 (77.2%) |
| Total (Overall) | 39 (35.1%) | 72 (64.9%) |
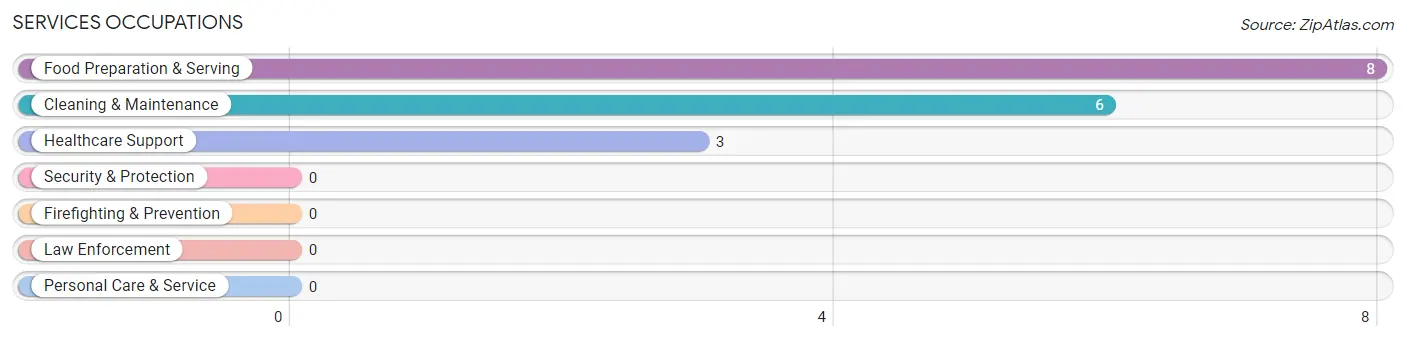
Services Occupations
The most common Services occupations in Concord are Food Preparation & Serving (8 | 7.2%), Cleaning & Maintenance (6 | 5.4%), and Healthcare Support (3 | 2.7%).
Services Occupations by Sex
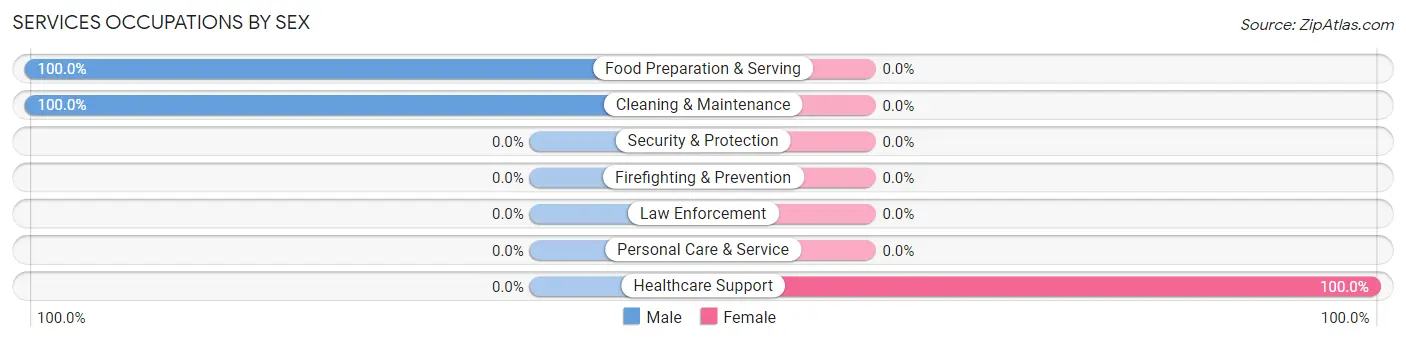
| Occupation | Male | Female |
| Healthcare Support | 0 (0.0%) | 3 (100.0%) |
| Security & Protection | 0 (0.0%) | 0 (0.0%) |
| Firefighting & Prevention | 0 (0.0%) | 0 (0.0%) |
| Law Enforcement | 0 (0.0%) | 0 (0.0%) |
| Food Preparation & Serving | 8 (100.0%) | 0 (0.0%) |
| Cleaning & Maintenance | 6 (100.0%) | 0 (0.0%) |
| Personal Care & Service | 0 (0.0%) | 0 (0.0%) |
| Total (Category) | 14 (82.4%) | 3 (17.6%) |
| Total (Overall) | 39 (35.1%) | 72 (64.9%) |
Sales and Office Occupations
The most common Sales and Office occupations in Concord are Office & Administration (13 | 11.7%), and Sales & Related (10 | 9.0%).
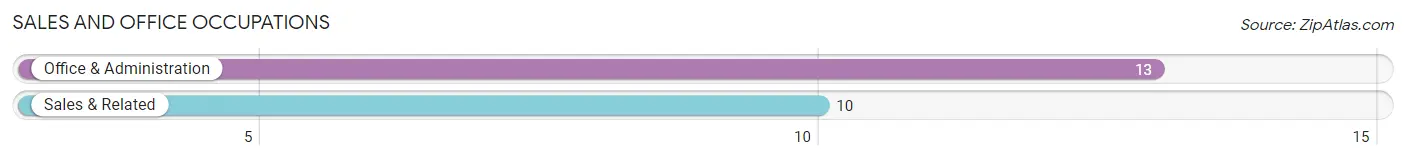
Sales and Office Occupations by Sex
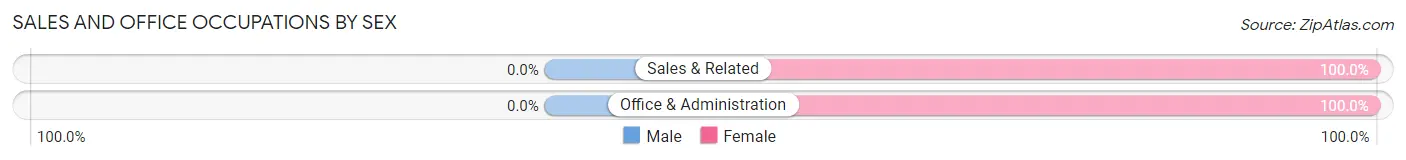
| Occupation | Male | Female |
| Sales & Related | 0 (0.0%) | 10 (100.0%) |
| Office & Administration | 0 (0.0%) | 13 (100.0%) |
| Total (Category) | 0 (0.0%) | 23 (100.0%) |
| Total (Overall) | 39 (35.1%) | 72 (64.9%) |
Natural Resources, Construction and Maintenance Occupations
The most common Natural Resources, Construction and Maintenance occupations in Concord are , and Farming, Fishing & Forestry (2 | 1.8%).
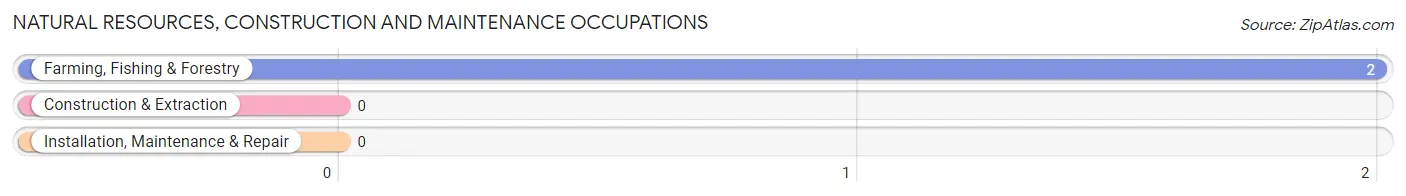
Natural Resources, Construction and Maintenance Occupations by Sex
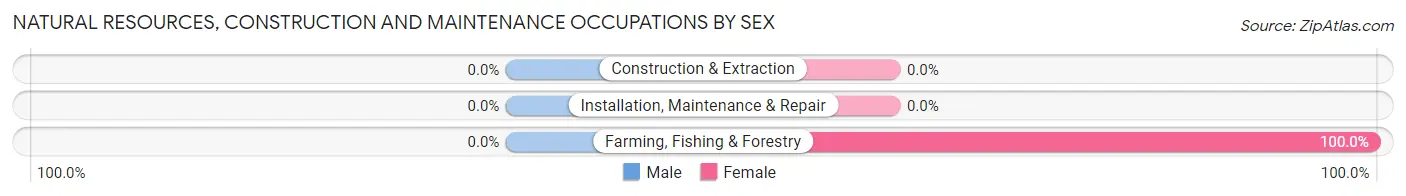
| Occupation | Male | Female |
| Farming, Fishing & Forestry | 0 (0.0%) | 2 (100.0%) |
| Construction & Extraction | 0 (0.0%) | 0 (0.0%) |
| Installation, Maintenance & Repair | 0 (0.0%) | 0 (0.0%) |
| Total (Category) | 0 (0.0%) | 2 (100.0%) |
| Total (Overall) | 39 (35.1%) | 72 (64.9%) |
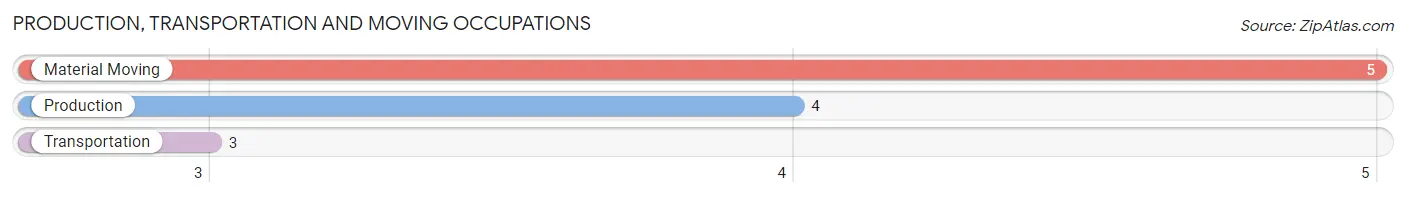
Production, Transportation and Moving Occupations
The most common Production, Transportation and Moving occupations in Concord are Material Moving (5 | 4.5%), Production (4 | 3.6%), and Transportation (3 | 2.7%).
Production, Transportation and Moving Occupations by Sex
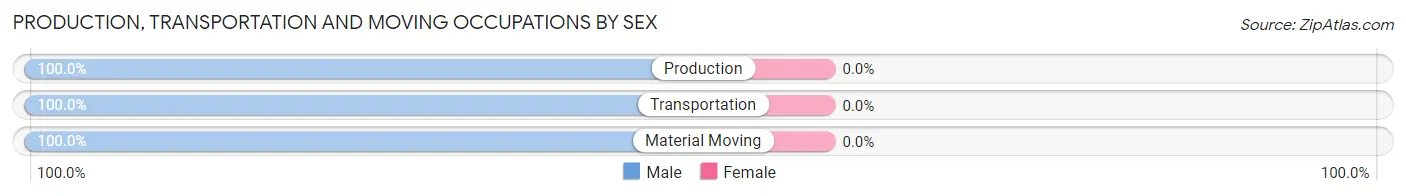
| Occupation | Male | Female |
| Production | 4 (100.0%) | 0 (0.0%) |
| Transportation | 3 (100.0%) | 0 (0.0%) |
| Material Moving | 5 (100.0%) | 0 (0.0%) |
| Total (Category) | 12 (100.0%) | 0 (0.0%) |
| Total (Overall) | 39 (35.1%) | 72 (64.9%) |
Employment Industries by Sex in Concord
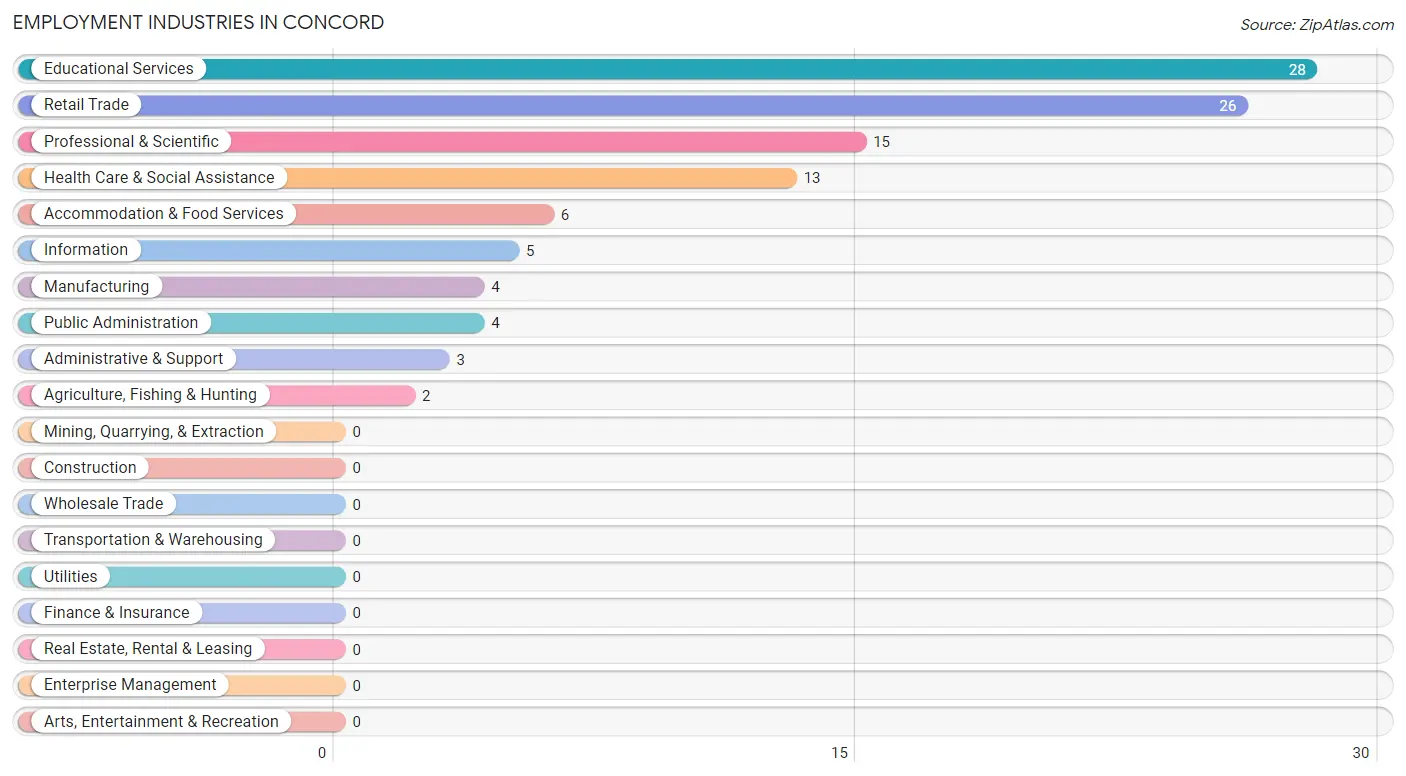
Employment Industries in Concord
The major employment industries in Concord include Educational Services (28 | 25.2%), Retail Trade (26 | 23.4%), Professional & Scientific (15 | 13.5%), Health Care & Social Assistance (13 | 11.7%), and Accommodation & Food Services (6 | 5.4%).
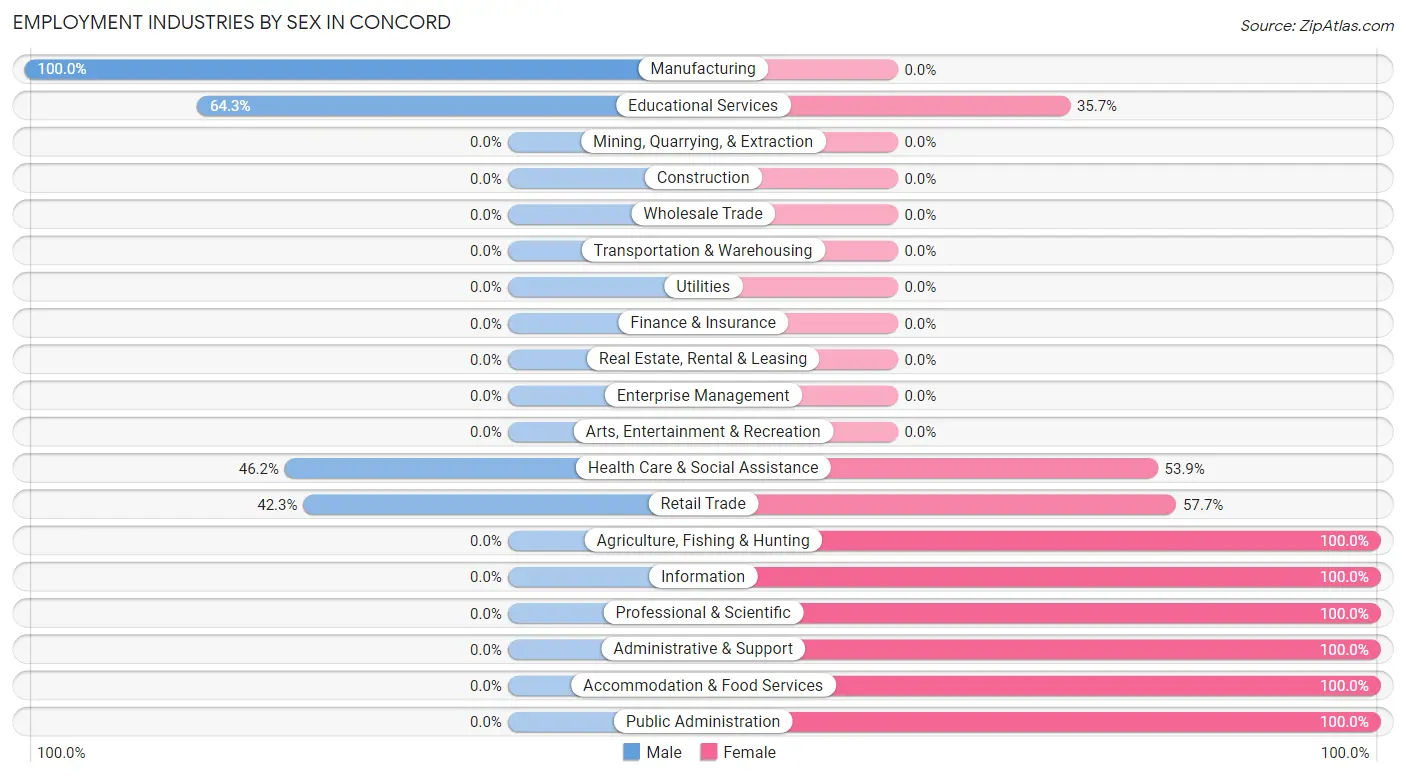
Employment Industries by Sex in Concord
The Concord industries that see more men than women are Manufacturing (100.0%), Educational Services (64.3%), and Health Care & Social Assistance (46.2%), whereas the industries that tend to have a higher number of women are Agriculture, Fishing & Hunting (100.0%), Information (100.0%), and Professional & Scientific (100.0%).
| Industry | Male | Female |
| Agriculture, Fishing & Hunting | 0 (0.0%) | 2 (100.0%) |
| Mining, Quarrying, & Extraction | 0 (0.0%) | 0 (0.0%) |
| Construction | 0 (0.0%) | 0 (0.0%) |
| Manufacturing | 4 (100.0%) | 0 (0.0%) |
| Wholesale Trade | 0 (0.0%) | 0 (0.0%) |
| Retail Trade | 11 (42.3%) | 15 (57.7%) |
| Transportation & Warehousing | 0 (0.0%) | 0 (0.0%) |
| Utilities | 0 (0.0%) | 0 (0.0%) |
| Information | 0 (0.0%) | 5 (100.0%) |
| Finance & Insurance | 0 (0.0%) | 0 (0.0%) |
| Real Estate, Rental & Leasing | 0 (0.0%) | 0 (0.0%) |
| Professional & Scientific | 0 (0.0%) | 15 (100.0%) |
| Enterprise Management | 0 (0.0%) | 0 (0.0%) |
| Administrative & Support | 0 (0.0%) | 3 (100.0%) |
| Educational Services | 18 (64.3%) | 10 (35.7%) |
| Health Care & Social Assistance | 6 (46.2%) | 7 (53.8%) |
| Arts, Entertainment & Recreation | 0 (0.0%) | 0 (0.0%) |
| Accommodation & Food Services | 0 (0.0%) | 6 (100.0%) |
| Public Administration | 0 (0.0%) | 4 (100.0%) |
| Total | 39 (35.1%) | 72 (64.9%) |
Education in Concord
School Enrollment in Concord
The most common levels of schooling among the 71 students in Concord are college / undergraduate (31 | 43.7%), high school (19 | 26.8%), and nursery / preschool (10 | 14.1%).
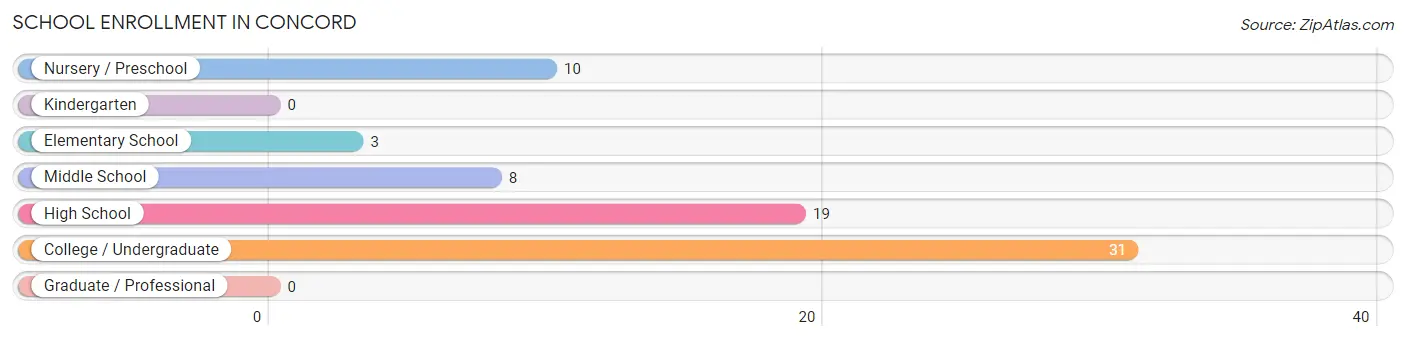
| School Level | # Students | % Students |
| Nursery / Preschool | 10 | 14.1% |
| Kindergarten | 0 | 0.0% |
| Elementary School | 3 | 4.2% |
| Middle School | 8 | 11.3% |
| High School | 19 | 26.8% |
| College / Undergraduate | 31 | 43.7% |
| Graduate / Professional | 0 | 0.0% |
| Total | 71 | 100.0% |
School Enrollment by Age by Funding Source in Concord
Out of a total of 71 students who are enrolled in schools in Concord, 10 (14.1%) attend a private institution, while the remaining 61 (85.9%) are enrolled in public schools. The age group of 20 to 24 year olds has the highest likelihood of being enrolled in private schools, with 10 (100.0% in the age bracket) enrolled. Conversely, the age group of 3 to 4 year olds has the lowest likelihood of being enrolled in a private school, with 10 (100.0% in the age bracket) attending a public institution.
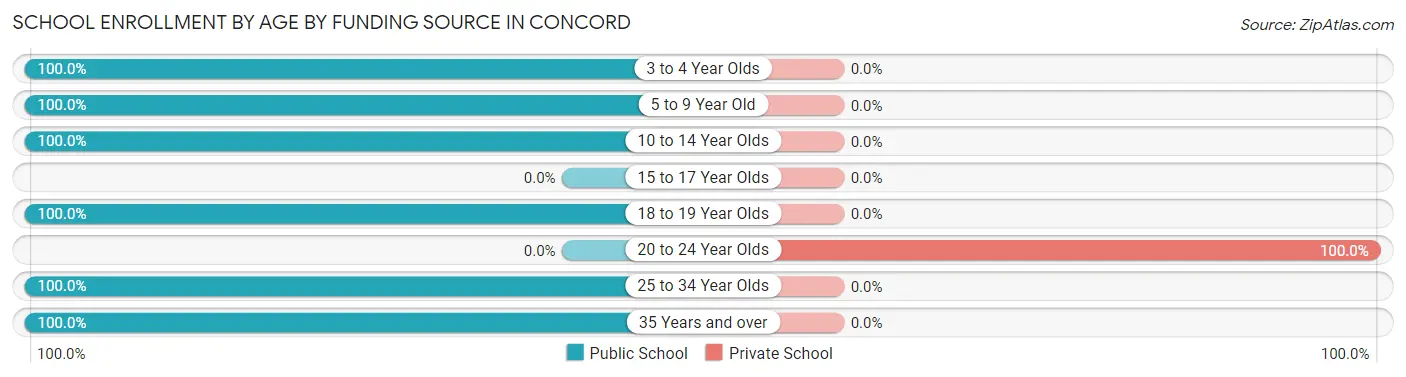
| Age Bracket | Public School | Private School |
| 3 to 4 Year Olds | 10 (100.0%) | 0 (0.0%) |
| 5 to 9 Year Old | 3 (100.0%) | 0 (0.0%) |
| 10 to 14 Year Olds | 8 (100.0%) | 0 (0.0%) |
| 15 to 17 Year Olds | 0 (0.0%) | 0 (0.0%) |
| 18 to 19 Year Olds | 10 (100.0%) | 0 (0.0%) |
| 20 to 24 Year Olds | 0 (0.0%) | 10 (100.0%) |
| 25 to 34 Year Olds | 15 (100.0%) | 0 (0.0%) |
| 35 Years and over | 15 (100.0%) | 0 (0.0%) |
| Total | 61 (85.9%) | 10 (14.1%) |
Educational Attainment by Field of Study in Concord
Physical & health sciences (13 | 30.2%), education (11 | 25.6%), bio, nature & agricultural (5 | 11.6%), science & technology (5 | 11.6%), and arts & humanities (4 | 9.3%) are the most common fields of study among 43 individuals in Concord who have obtained a bachelor's degree or higher.
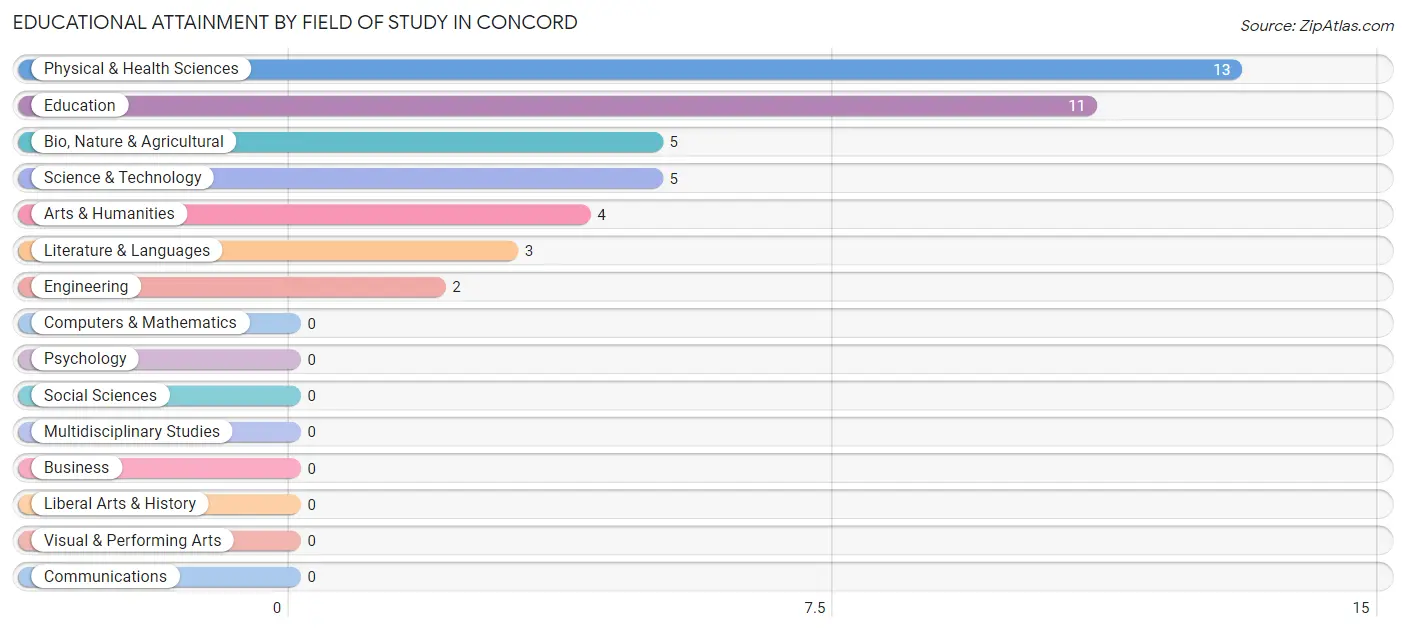
| Field of Study | # Graduates | % Graduates |
| Computers & Mathematics | 0 | 0.0% |
| Bio, Nature & Agricultural | 5 | 11.6% |
| Physical & Health Sciences | 13 | 30.2% |
| Psychology | 0 | 0.0% |
| Social Sciences | 0 | 0.0% |
| Engineering | 2 | 4.6% |
| Multidisciplinary Studies | 0 | 0.0% |
| Science & Technology | 5 | 11.6% |
| Business | 0 | 0.0% |
| Education | 11 | 25.6% |
| Literature & Languages | 3 | 7.0% |
| Liberal Arts & History | 0 | 0.0% |
| Visual & Performing Arts | 0 | 0.0% |
| Communications | 0 | 0.0% |
| Arts & Humanities | 4 | 9.3% |
| Total | 43 | 100.0% |
Transportation & Commute in Concord
Vehicle Availability by Sex in Concord
The most prevalent vehicle ownership categories in Concord are males with 3 vehicles (25, accounting for 61.0%) and females with 3 vehicles (31, making up 37.9%).
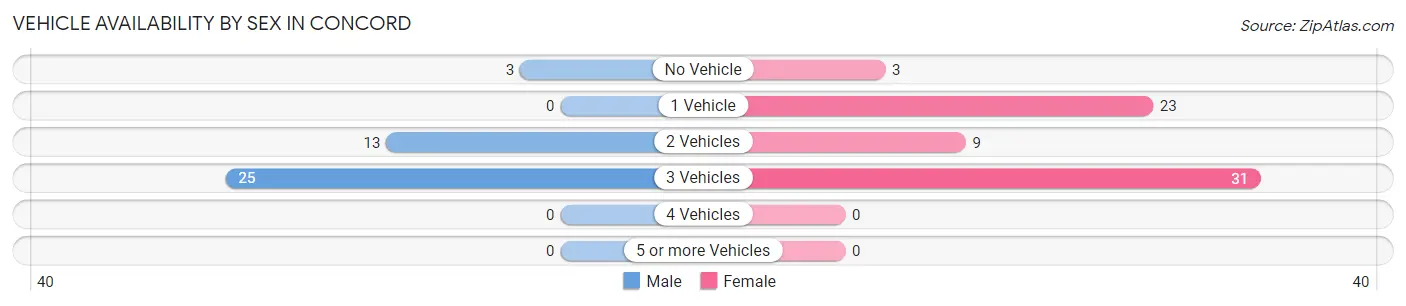
| Vehicles Available | Male | Female |
| No Vehicle | 3 (7.3%) | 3 (4.5%) |
| 1 Vehicle | 0 (0.0%) | 23 (34.8%) |
| 2 Vehicles | 13 (31.7%) | 9 (13.6%) |
| 3 Vehicles | 25 (61.0%) | 31 (47.0%) |
| 4 Vehicles | 0 (0.0%) | 0 (0.0%) |
| 5 or more Vehicles | 0 (0.0%) | 0 (0.0%) |
| Total | 41 (100.0%) | 66 (100.0%) |
Commute Time in Concord
The most frequently occuring commute durations in Concord are 5 to 9 minutes (23 commuters, 28.1%), 45 to 59 minutes (15 commuters, 18.3%), and 15 to 19 minutes (11 commuters, 13.4%).
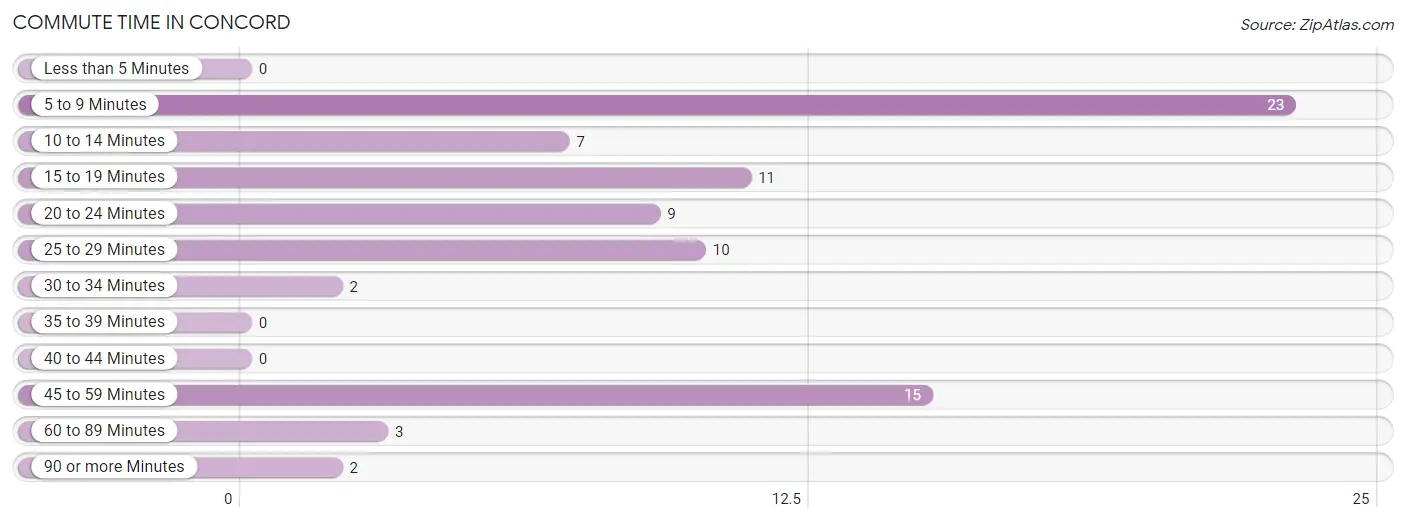
| Commute Time | # Commuters | % Commuters |
| Less than 5 Minutes | 0 | 0.0% |
| 5 to 9 Minutes | 23 | 28.1% |
| 10 to 14 Minutes | 7 | 8.5% |
| 15 to 19 Minutes | 11 | 13.4% |
| 20 to 24 Minutes | 9 | 11.0% |
| 25 to 29 Minutes | 10 | 12.2% |
| 30 to 34 Minutes | 2 | 2.4% |
| 35 to 39 Minutes | 0 | 0.0% |
| 40 to 44 Minutes | 0 | 0.0% |
| 45 to 59 Minutes | 15 | 18.3% |
| 60 to 89 Minutes | 3 | 3.7% |
| 90 or more Minutes | 2 | 2.4% |
Commute Time by Sex in Concord
The most common commute times in Concord are 5 to 9 minutes (13 commuters, 31.7%) for males and 5 to 9 minutes (10 commuters, 24.4%) for females.
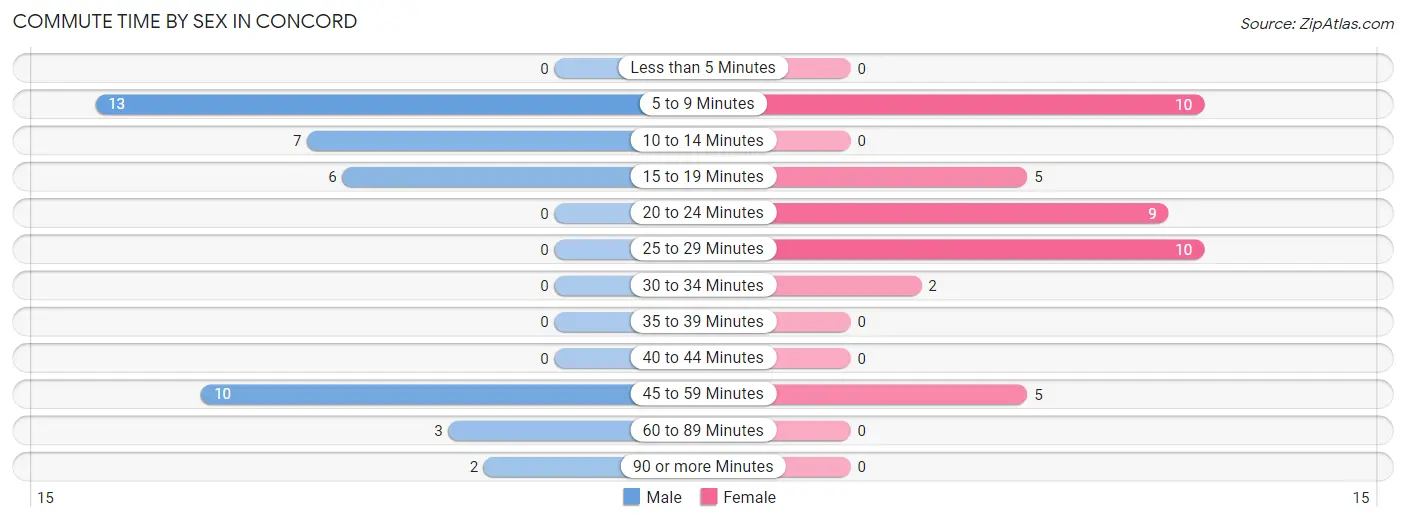
| Commute Time | Male | Female |
| Less than 5 Minutes | 0 (0.0%) | 0 (0.0%) |
| 5 to 9 Minutes | 13 (31.7%) | 10 (24.4%) |
| 10 to 14 Minutes | 7 (17.1%) | 0 (0.0%) |
| 15 to 19 Minutes | 6 (14.6%) | 5 (12.2%) |
| 20 to 24 Minutes | 0 (0.0%) | 9 (22.0%) |
| 25 to 29 Minutes | 0 (0.0%) | 10 (24.4%) |
| 30 to 34 Minutes | 0 (0.0%) | 2 (4.9%) |
| 35 to 39 Minutes | 0 (0.0%) | 0 (0.0%) |
| 40 to 44 Minutes | 0 (0.0%) | 0 (0.0%) |
| 45 to 59 Minutes | 10 (24.4%) | 5 (12.2%) |
| 60 to 89 Minutes | 3 (7.3%) | 0 (0.0%) |
| 90 or more Minutes | 2 (4.9%) | 0 (0.0%) |
Time of Departure to Work by Sex in Concord
The most frequent times of departure to work in Concord are 6:30 AM to 6:59 AM (13, 31.7%) for males and 6:30 AM to 6:59 AM (12, 29.3%) for females.
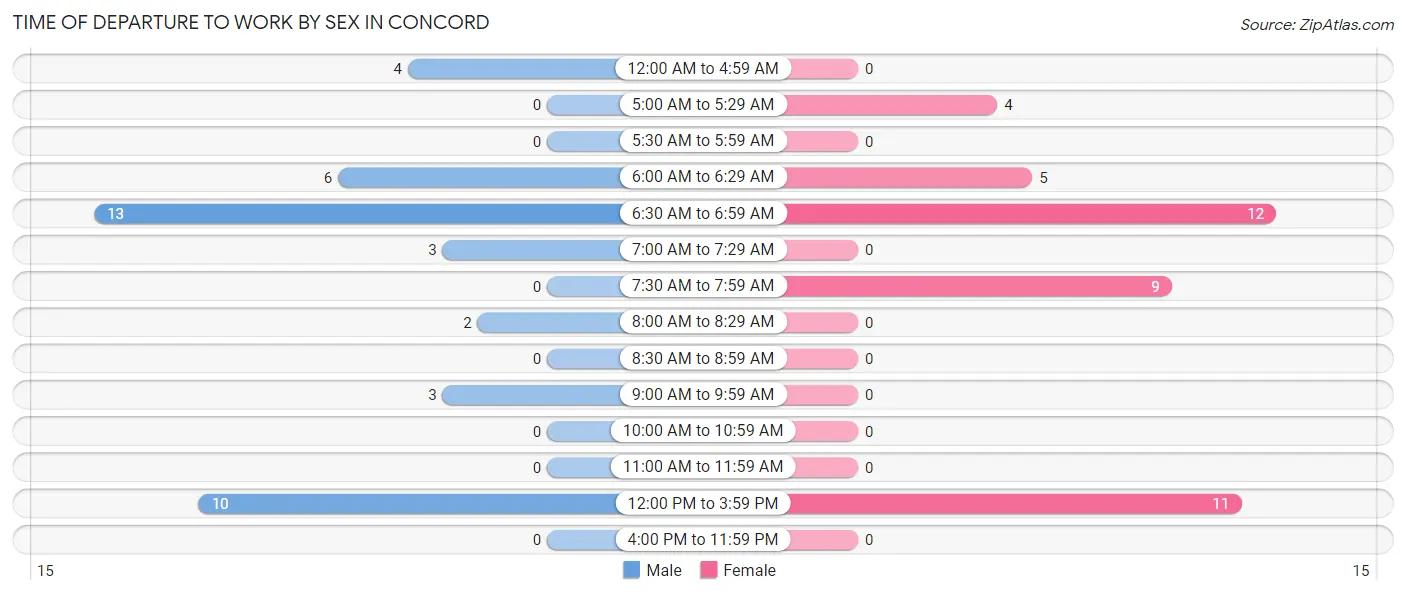
| Time of Departure | Male | Female |
| 12:00 AM to 4:59 AM | 4 (9.8%) | 0 (0.0%) |
| 5:00 AM to 5:29 AM | 0 (0.0%) | 4 (9.8%) |
| 5:30 AM to 5:59 AM | 0 (0.0%) | 0 (0.0%) |
| 6:00 AM to 6:29 AM | 6 (14.6%) | 5 (12.2%) |
| 6:30 AM to 6:59 AM | 13 (31.7%) | 12 (29.3%) |
| 7:00 AM to 7:29 AM | 3 (7.3%) | 0 (0.0%) |
| 7:30 AM to 7:59 AM | 0 (0.0%) | 9 (22.0%) |
| 8:00 AM to 8:29 AM | 2 (4.9%) | 0 (0.0%) |
| 8:30 AM to 8:59 AM | 0 (0.0%) | 0 (0.0%) |
| 9:00 AM to 9:59 AM | 3 (7.3%) | 0 (0.0%) |
| 10:00 AM to 10:59 AM | 0 (0.0%) | 0 (0.0%) |
| 11:00 AM to 11:59 AM | 0 (0.0%) | 0 (0.0%) |
| 12:00 PM to 3:59 PM | 10 (24.4%) | 11 (26.8%) |
| 4:00 PM to 11:59 PM | 0 (0.0%) | 0 (0.0%) |
| Total | 41 (100.0%) | 41 (100.0%) |
Housing Occupancy in Concord
Occupancy by Ownership in Concord
Of the total 78 dwellings in Concord, owner-occupied units account for 53 (67.9%), while renter-occupied units make up 25 (32.1%).
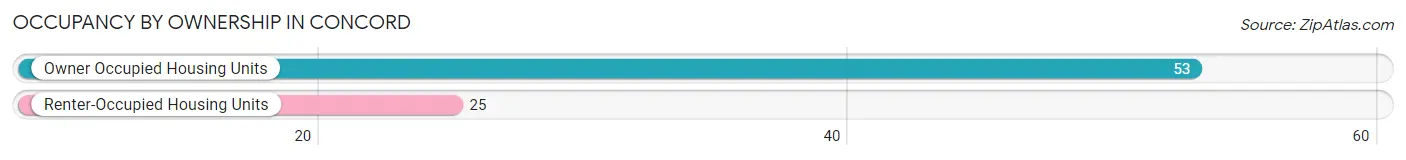
| Occupancy | # Housing Units | % Housing Units |
| Owner Occupied Housing Units | 53 | 67.9% |
| Renter-Occupied Housing Units | 25 | 32.1% |
| Total Occupied Housing Units | 78 | 100.0% |
Occupancy by Household Size in Concord
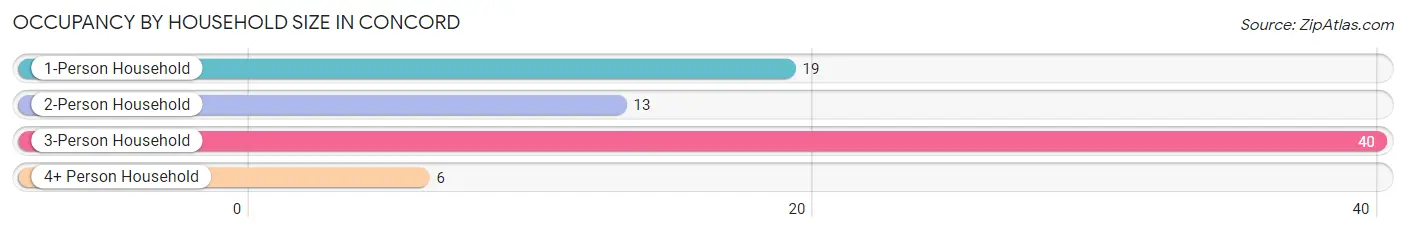
| Household Size | # Housing Units | % Housing Units |
| 1-Person Household | 19 | 24.4% |
| 2-Person Household | 13 | 16.7% |
| 3-Person Household | 40 | 51.3% |
| 4+ Person Household | 6 | 7.7% |
| Total Housing Units | 78 | 100.0% |
Occupancy by Ownership by Household Size in Concord
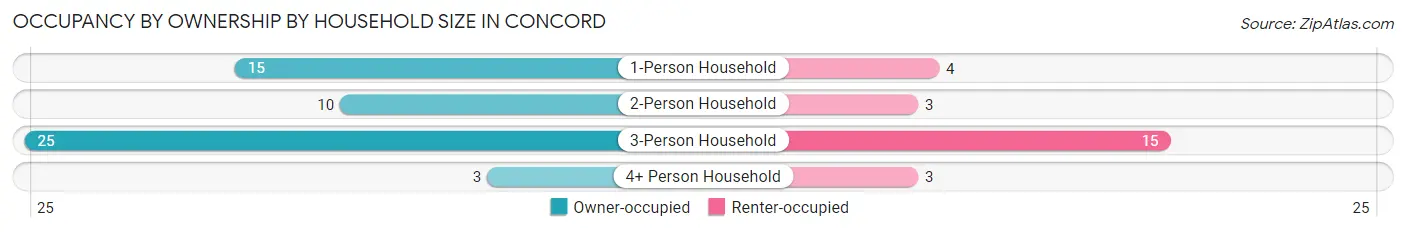
| Household Size | Owner-occupied | Renter-occupied |
| 1-Person Household | 15 (78.9%) | 4 (21.0%) |
| 2-Person Household | 10 (76.9%) | 3 (23.1%) |
| 3-Person Household | 25 (62.5%) | 15 (37.5%) |
| 4+ Person Household | 3 (50.0%) | 3 (50.0%) |
| Total Housing Units | 53 (67.9%) | 25 (32.1%) |
Occupancy by Educational Attainment in Concord
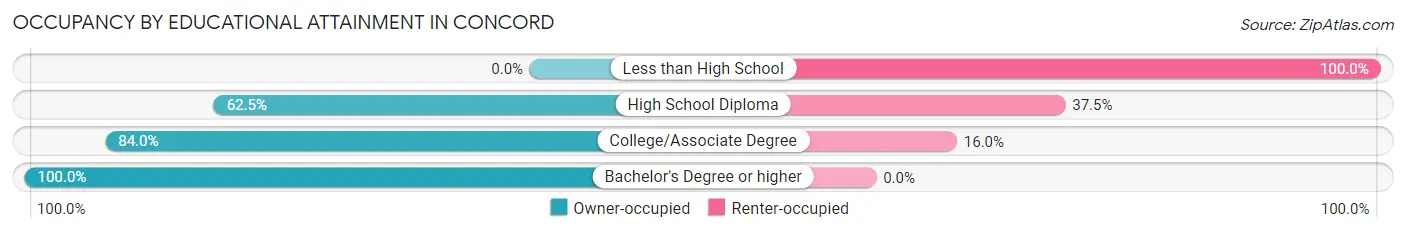
| Household Size | Owner-occupied | Renter-occupied |
| Less than High School | 0 (0.0%) | 15 (100.0%) |
| High School Diploma | 10 (62.5%) | 6 (37.5%) |
| College/Associate Degree | 21 (84.0%) | 4 (16.0%) |
| Bachelor's Degree or higher | 22 (100.0%) | 0 (0.0%) |
Occupancy by Age of Householder in Concord
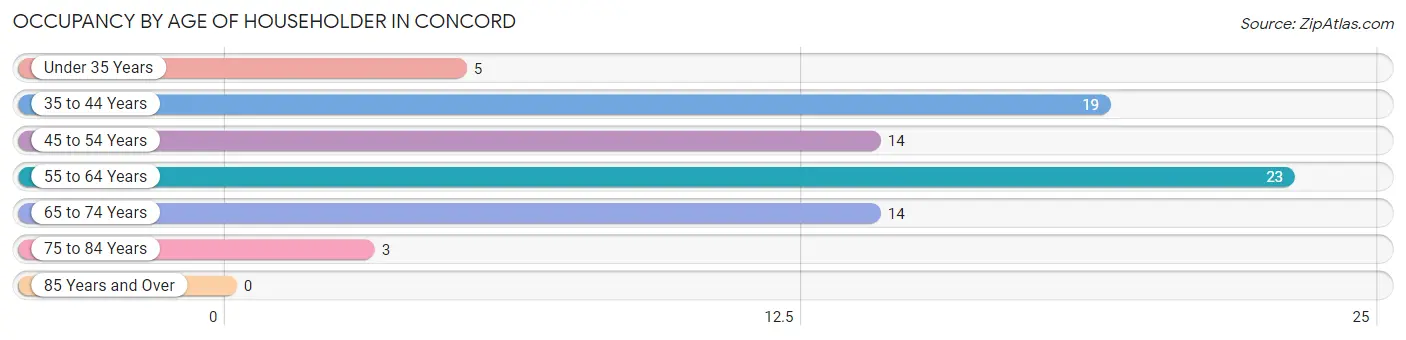
| Age Bracket | # Households | % Households |
| Under 35 Years | 5 | 6.4% |
| 35 to 44 Years | 19 | 24.4% |
| 45 to 54 Years | 14 | 17.9% |
| 55 to 64 Years | 23 | 29.5% |
| 65 to 74 Years | 14 | 17.9% |
| 75 to 84 Years | 3 | 3.8% |
| 85 Years and Over | 0 | 0.0% |
| Total | 78 | 100.0% |
Housing Finances in Concord
Median Income by Occupancy in Concord
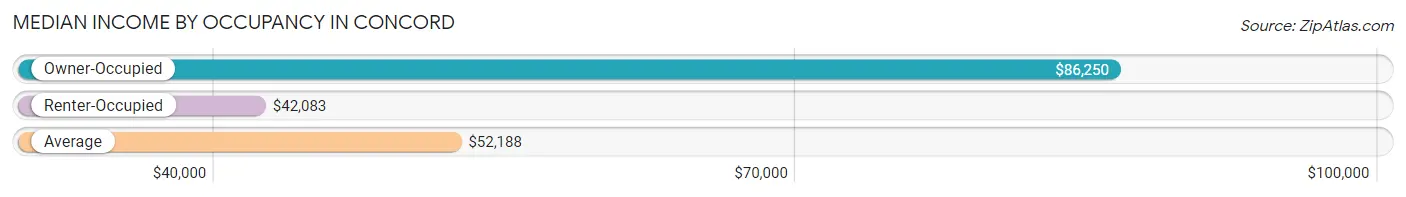
| Occupancy Type | # Households | Median Income |
| Owner-Occupied | 53 (67.9%) | $86,250 |
| Renter-Occupied | 25 (32.1%) | $42,083 |
| Average | 78 (100.0%) | $52,188 |
Occupancy by Householder Income Bracket in Concord
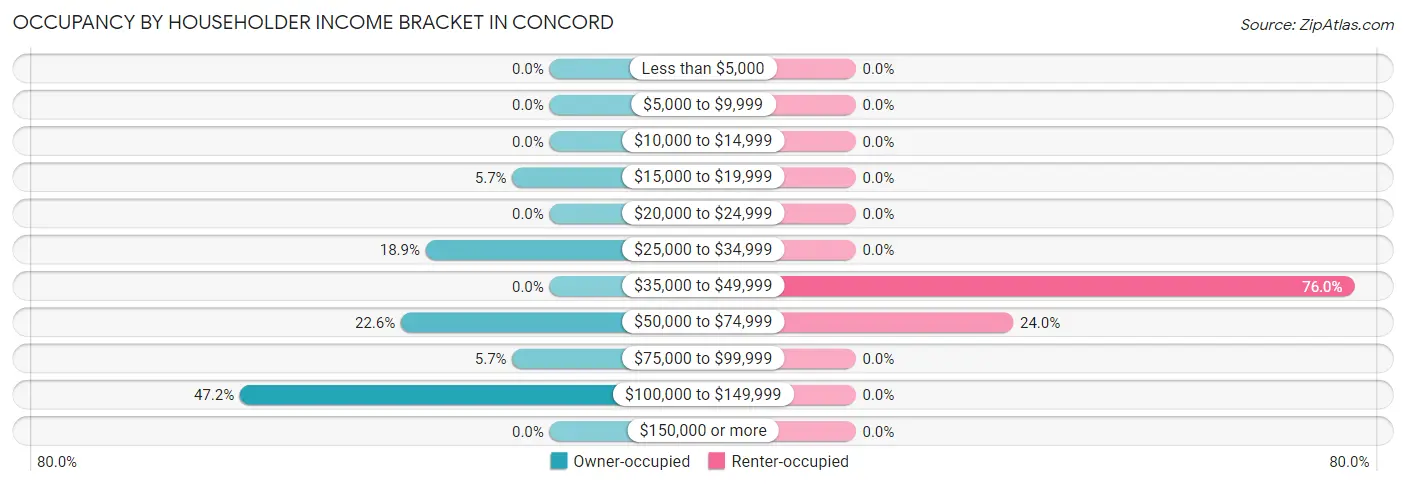
| Income Bracket | Owner-occupied | Renter-occupied |
| Less than $5,000 | 0 (0.0%) | 0 (0.0%) |
| $5,000 to $9,999 | 0 (0.0%) | 0 (0.0%) |
| $10,000 to $14,999 | 0 (0.0%) | 0 (0.0%) |
| $15,000 to $19,999 | 3 (5.7%) | 0 (0.0%) |
| $20,000 to $24,999 | 0 (0.0%) | 0 (0.0%) |
| $25,000 to $34,999 | 10 (18.9%) | 0 (0.0%) |
| $35,000 to $49,999 | 0 (0.0%) | 19 (76.0%) |
| $50,000 to $74,999 | 12 (22.6%) | 6 (24.0%) |
| $75,000 to $99,999 | 3 (5.7%) | 0 (0.0%) |
| $100,000 to $149,999 | 25 (47.2%) | 0 (0.0%) |
| $150,000 or more | 0 (0.0%) | 0 (0.0%) |
| Total | 53 (100.0%) | 25 (100.0%) |
Monthly Housing Cost Tiers in Concord
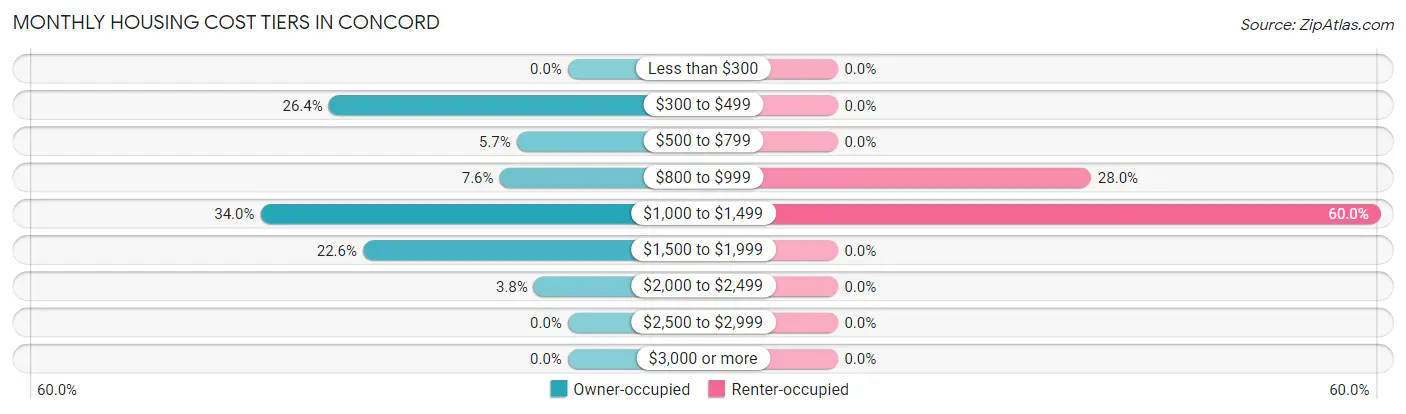
| Monthly Cost | Owner-occupied | Renter-occupied |
| Less than $300 | 0 (0.0%) | 0 (0.0%) |
| $300 to $499 | 14 (26.4%) | 0 (0.0%) |
| $500 to $799 | 3 (5.7%) | 0 (0.0%) |
| $800 to $999 | 4 (7.5%) | 7 (28.0%) |
| $1,000 to $1,499 | 18 (34.0%) | 15 (60.0%) |
| $1,500 to $1,999 | 12 (22.6%) | 0 (0.0%) |
| $2,000 to $2,499 | 2 (3.8%) | 0 (0.0%) |
| $2,500 to $2,999 | 0 (0.0%) | 0 (0.0%) |
| $3,000 or more | 0 (0.0%) | 0 (0.0%) |
| Total | 53 (100.0%) | 25 (100.0%) |
Physical Housing Characteristics in Concord
Housing Structures in Concord
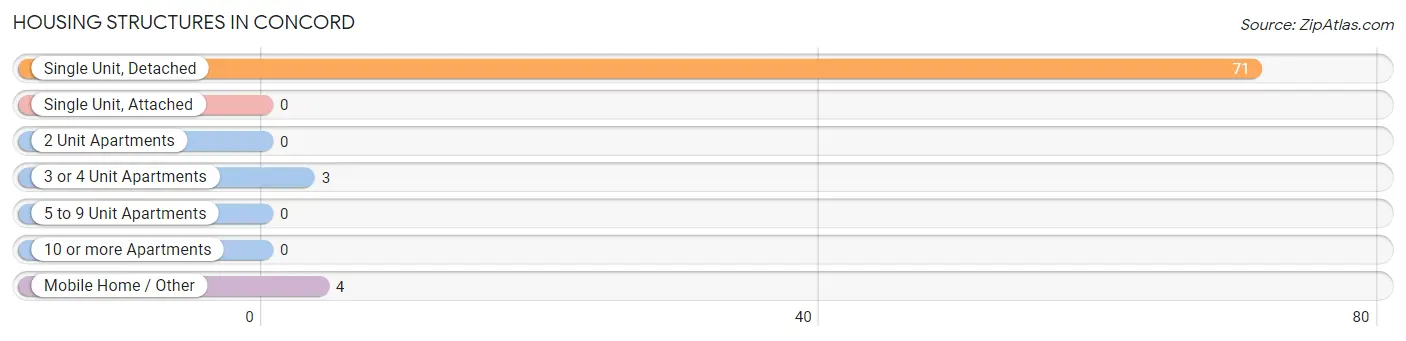
| Structure Type | # Housing Units | % Housing Units |
| Single Unit, Detached | 71 | 91.0% |
| Single Unit, Attached | 0 | 0.0% |
| 2 Unit Apartments | 0 | 0.0% |
| 3 or 4 Unit Apartments | 3 | 3.8% |
| 5 to 9 Unit Apartments | 0 | 0.0% |
| 10 or more Apartments | 0 | 0.0% |
| Mobile Home / Other | 4 | 5.1% |
| Total | 78 | 100.0% |
Housing Structures by Occupancy in Concord
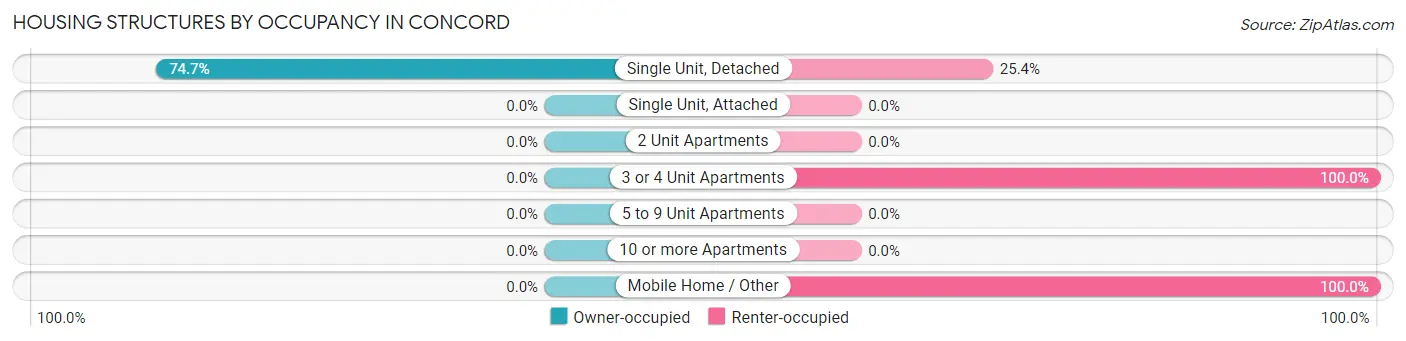
| Structure Type | Owner-occupied | Renter-occupied |
| Single Unit, Detached | 53 (74.7%) | 18 (25.4%) |
| Single Unit, Attached | 0 (0.0%) | 0 (0.0%) |
| 2 Unit Apartments | 0 (0.0%) | 0 (0.0%) |
| 3 or 4 Unit Apartments | 0 (0.0%) | 3 (100.0%) |
| 5 to 9 Unit Apartments | 0 (0.0%) | 0 (0.0%) |
| 10 or more Apartments | 0 (0.0%) | 0 (0.0%) |
| Mobile Home / Other | 0 (0.0%) | 4 (100.0%) |
| Total | 53 (67.9%) | 25 (32.1%) |
Housing Structures by Number of Rooms in Concord
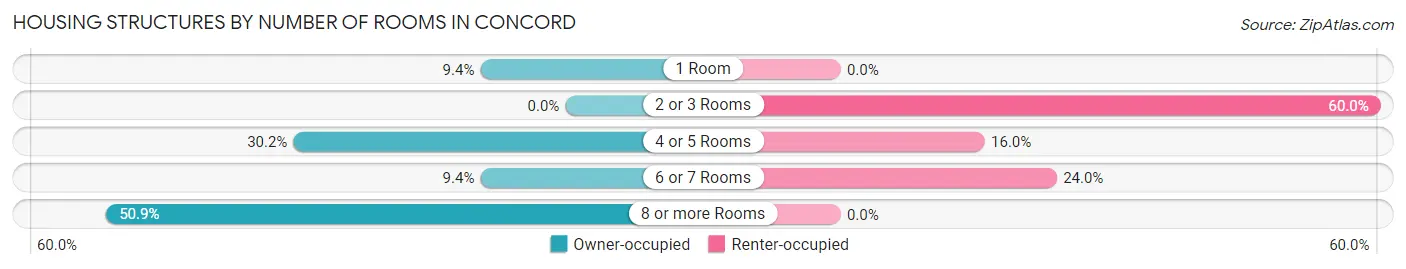
| Number of Rooms | Owner-occupied | Renter-occupied |
| 1 Room | 5 (9.4%) | 0 (0.0%) |
| 2 or 3 Rooms | 0 (0.0%) | 15 (60.0%) |
| 4 or 5 Rooms | 16 (30.2%) | 4 (16.0%) |
| 6 or 7 Rooms | 5 (9.4%) | 6 (24.0%) |
| 8 or more Rooms | 27 (50.9%) | 0 (0.0%) |
| Total | 53 (100.0%) | 25 (100.0%) |
Housing Structure by Heating Type in Concord
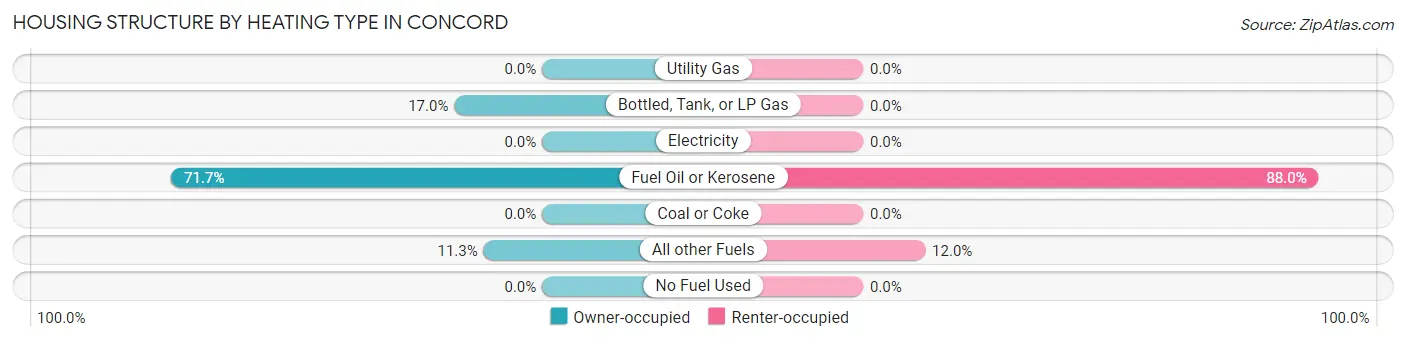
| Heating Type | Owner-occupied | Renter-occupied |
| Utility Gas | 0 (0.0%) | 0 (0.0%) |
| Bottled, Tank, or LP Gas | 9 (17.0%) | 0 (0.0%) |
| Electricity | 0 (0.0%) | 0 (0.0%) |
| Fuel Oil or Kerosene | 38 (71.7%) | 22 (88.0%) |
| Coal or Coke | 0 (0.0%) | 0 (0.0%) |
| All other Fuels | 6 (11.3%) | 3 (12.0%) |
| No Fuel Used | 0 (0.0%) | 0 (0.0%) |
| Total | 53 (100.0%) | 25 (100.0%) |
Household Vehicle Usage in Concord
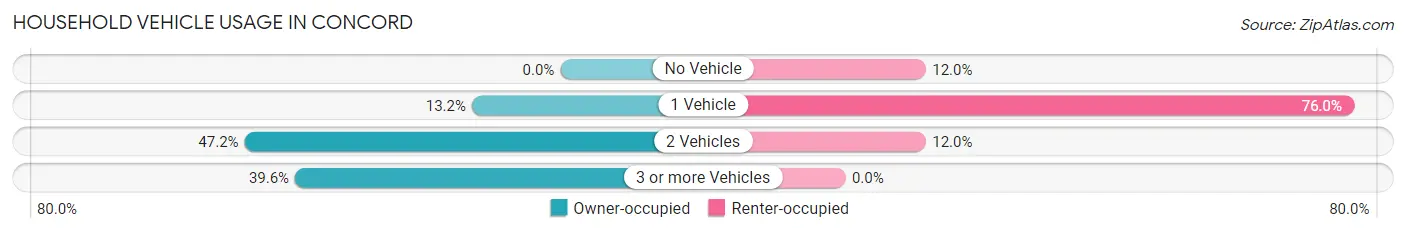
| Vehicles per Household | Owner-occupied | Renter-occupied |
| No Vehicle | 0 (0.0%) | 3 (12.0%) |
| 1 Vehicle | 7 (13.2%) | 19 (76.0%) |
| 2 Vehicles | 25 (47.2%) | 3 (12.0%) |
| 3 or more Vehicles | 21 (39.6%) | 0 (0.0%) |
| Total | 53 (100.0%) | 25 (100.0%) |
Real Estate & Mortgages in Concord
Real Estate and Mortgage Overview in Concord
| Characteristic | Without Mortgage | With Mortgage |
| Housing Units | 20 | 33 |
| Median Property Value | $96,400 | $143,800 |
| Median Household Income | $50,313 | $0 |
| Monthly Housing Costs | $450 | $0 |
| Real Estate Taxes | $2,125 | $0 |
Property Value by Mortgage Status in Concord
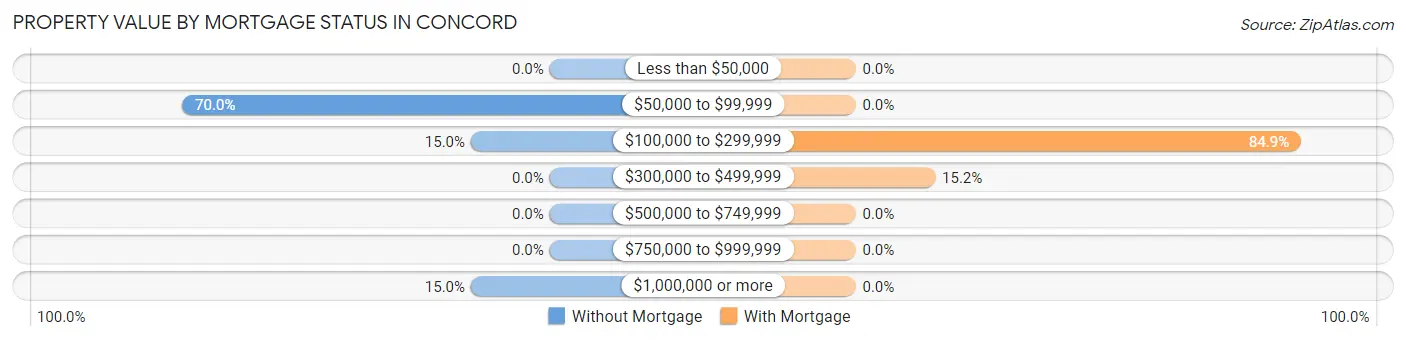
| Property Value | Without Mortgage | With Mortgage |
| Less than $50,000 | 0 (0.0%) | 0 (0.0%) |
| $50,000 to $99,999 | 14 (70.0%) | 0 (0.0%) |
| $100,000 to $299,999 | 3 (15.0%) | 28 (84.9%) |
| $300,000 to $499,999 | 0 (0.0%) | 5 (15.1%) |
| $500,000 to $749,999 | 0 (0.0%) | 0 (0.0%) |
| $750,000 to $999,999 | 0 (0.0%) | 0 (0.0%) |
| $1,000,000 or more | 3 (15.0%) | 0 (0.0%) |
| Total | 20 (100.0%) | 33 (100.0%) |
Household Income by Mortgage Status in Concord
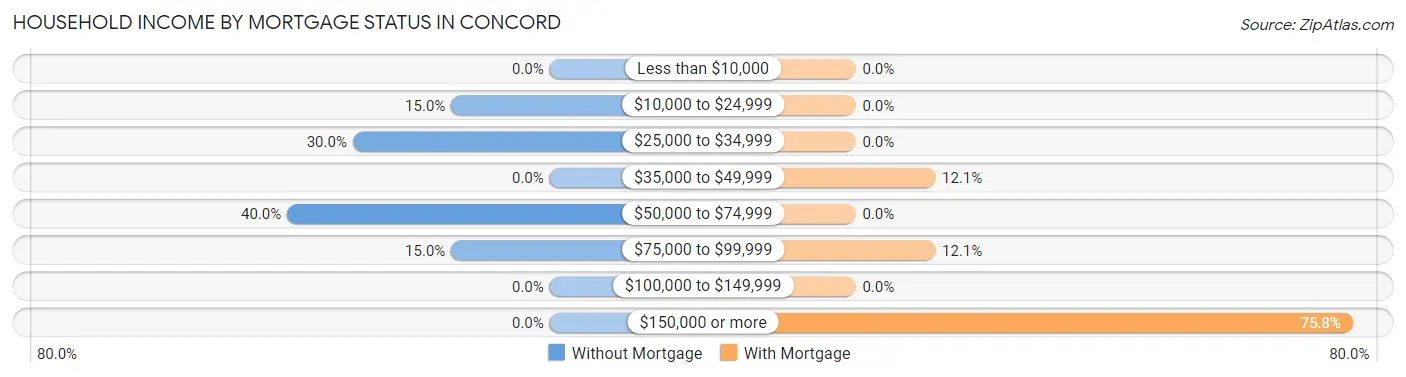
| Household Income | Without Mortgage | With Mortgage |
| Less than $10,000 | 0 (0.0%) | 0 (0.0%) |
| $10,000 to $24,999 | 3 (15.0%) | 0 (0.0%) |
| $25,000 to $34,999 | 6 (30.0%) | 0 (0.0%) |
| $35,000 to $49,999 | 0 (0.0%) | 4 (12.1%) |
| $50,000 to $74,999 | 8 (40.0%) | 0 (0.0%) |
| $75,000 to $99,999 | 3 (15.0%) | 4 (12.1%) |
| $100,000 to $149,999 | 0 (0.0%) | 0 (0.0%) |
| $150,000 or more | 0 (0.0%) | 25 (75.8%) |
| Total | 20 (100.0%) | 33 (100.0%) |
Property Value to Household Income Ratio in Concord
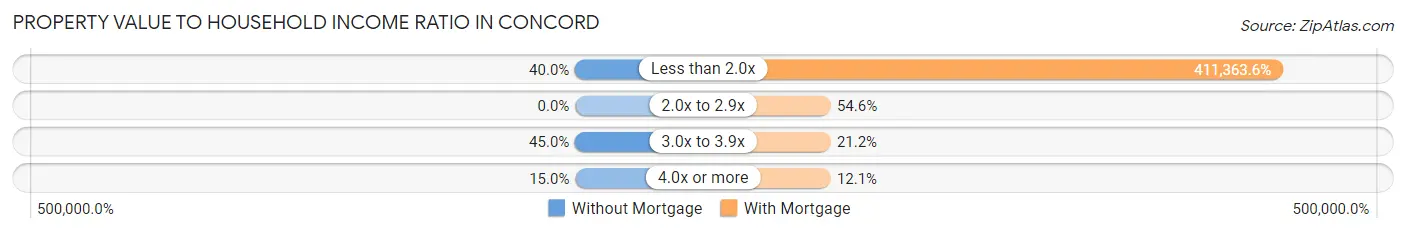
| Value-to-Income Ratio | Without Mortgage | With Mortgage |
| Less than 2.0x | 8 (40.0%) | 135,750 (411,363.6%) |
| 2.0x to 2.9x | 0 (0.0%) | 18 (54.5%) |
| 3.0x to 3.9x | 9 (45.0%) | 7 (21.2%) |
| 4.0x or more | 3 (15.0%) | 4 (12.1%) |
| Total | 20 (100.0%) | 33 (100.0%) |
Real Estate Taxes by Mortgage Status in Concord
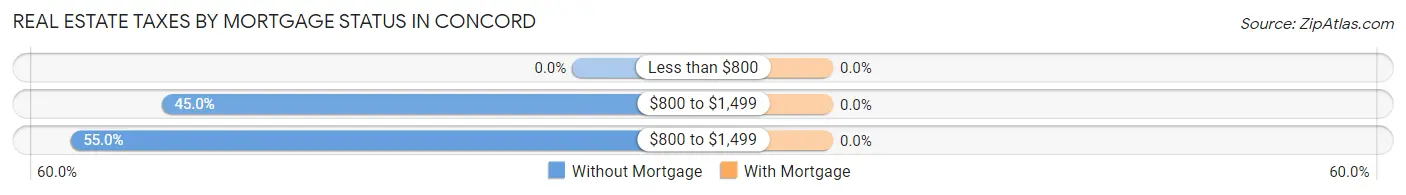
| Property Taxes | Without Mortgage | With Mortgage |
| Less than $800 | 0 (0.0%) | 0 (0.0%) |
| $800 to $1,499 | 9 (45.0%) | 0 (0.0%) |
| $800 to $1,499 | 11 (55.0%) | 0 (0.0%) |
| Total | 20 (100.0%) | 33 (100.0%) |
Health & Disability in Concord
Health Insurance Coverage by Age in Concord
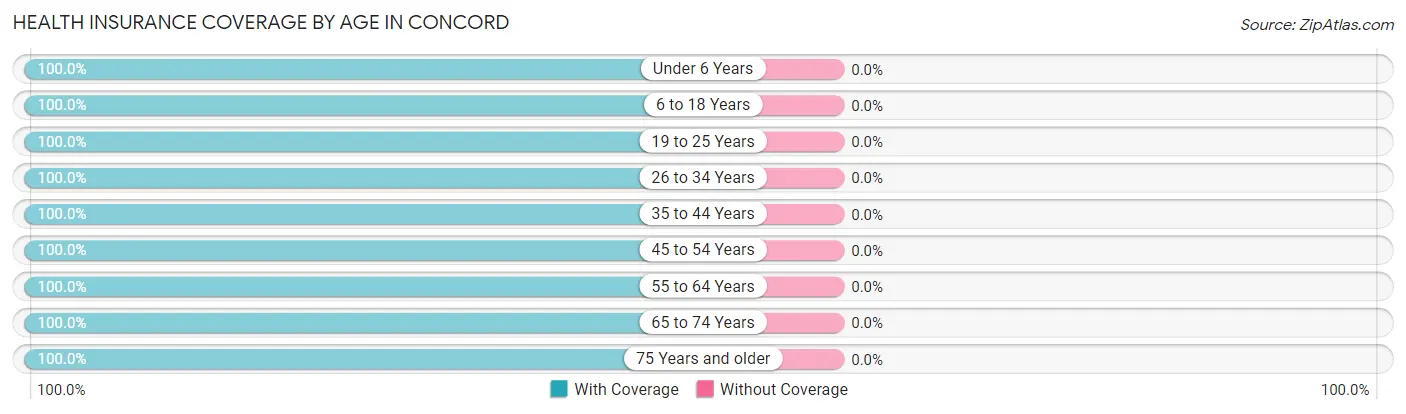
| Age Bracket | With Coverage | Without Coverage |
| Under 6 Years | 18 (100.0%) | 0 (0.0%) |
| 6 to 18 Years | 21 (100.0%) | 0 (0.0%) |
| 19 to 25 Years | 15 (100.0%) | 0 (0.0%) |
| 26 to 34 Years | 26 (100.0%) | 0 (0.0%) |
| 35 to 44 Years | 19 (100.0%) | 0 (0.0%) |
| 45 to 54 Years | 20 (100.0%) | 0 (0.0%) |
| 55 to 64 Years | 34 (100.0%) | 0 (0.0%) |
| 65 to 74 Years | 20 (100.0%) | 0 (0.0%) |
| 75 Years and older | 6 (100.0%) | 0 (0.0%) |
| Total | 179 (100.0%) | 0 (0.0%) |
Health Insurance Coverage by Citizenship Status in Concord
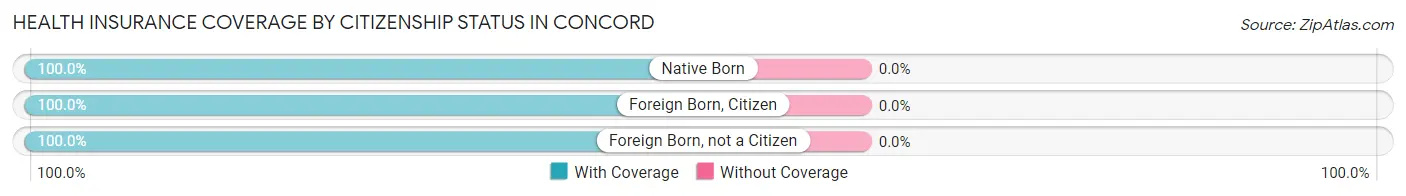
| Citizenship Status | With Coverage | Without Coverage |
| Native Born | 18 (100.0%) | 0 (0.0%) |
| Foreign Born, Citizen | 21 (100.0%) | 0 (0.0%) |
| Foreign Born, not a Citizen | 15 (100.0%) | 0 (0.0%) |
Health Insurance Coverage by Household Income in Concord
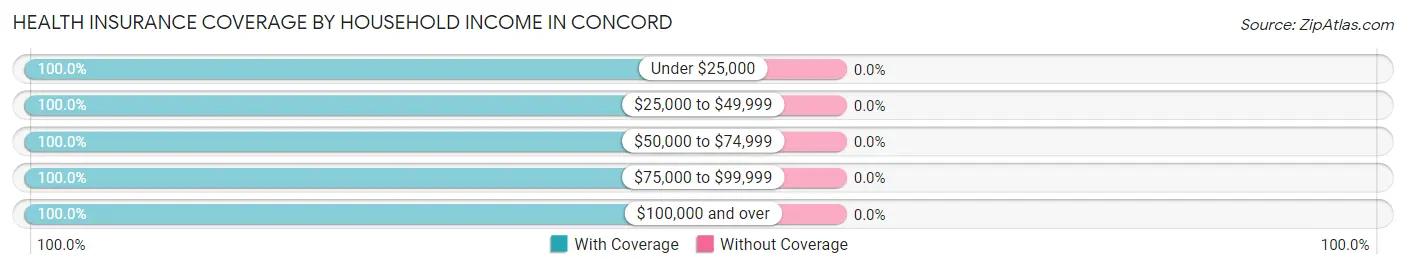
| Household Income | With Coverage | Without Coverage |
| Under $25,000 | 6 (100.0%) | 0 (0.0%) |
| $25,000 to $49,999 | 61 (100.0%) | 0 (0.0%) |
| $50,000 to $74,999 | 31 (100.0%) | 0 (0.0%) |
| $75,000 to $99,999 | 15 (100.0%) | 0 (0.0%) |
| $100,000 and over | 63 (100.0%) | 0 (0.0%) |
Public vs Private Health Insurance Coverage by Age in Concord
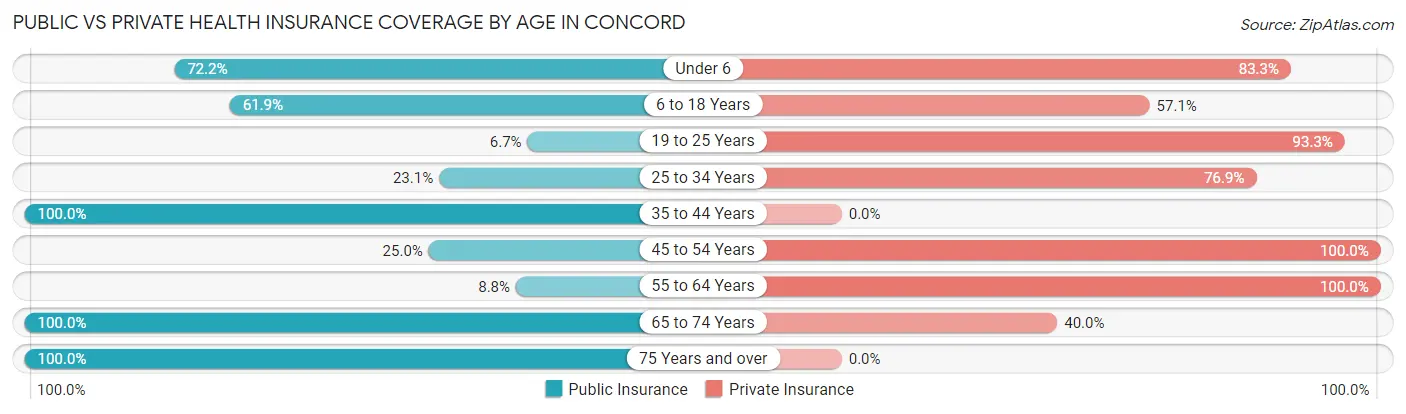
| Age Bracket | Public Insurance | Private Insurance |
| Under 6 | 13 (72.2%) | 15 (83.3%) |
| 6 to 18 Years | 13 (61.9%) | 12 (57.1%) |
| 19 to 25 Years | 1 (6.7%) | 14 (93.3%) |
| 25 to 34 Years | 6 (23.1%) | 20 (76.9%) |
| 35 to 44 Years | 19 (100.0%) | 0 (0.0%) |
| 45 to 54 Years | 5 (25.0%) | 20 (100.0%) |
| 55 to 64 Years | 3 (8.8%) | 34 (100.0%) |
| 65 to 74 Years | 20 (100.0%) | 8 (40.0%) |
| 75 Years and over | 6 (100.0%) | 0 (0.0%) |
| Total | 86 (48.0%) | 123 (68.7%) |
Disability Status by Sex by Age in Concord
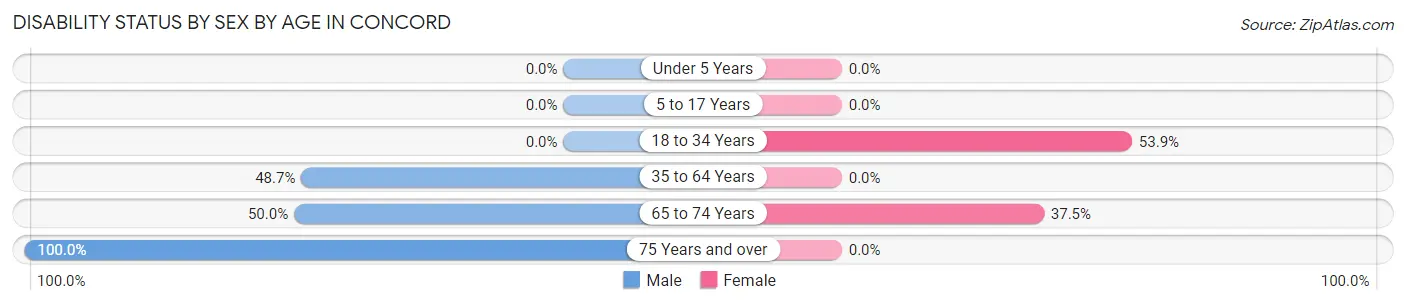
| Age Bracket | Male | Female |
| Under 5 Years | 0 (0.0%) | 0 (0.0%) |
| 5 to 17 Years | 0 (0.0%) | 0 (0.0%) |
| 18 to 34 Years | 0 (0.0%) | 21 (53.8%) |
| 35 to 64 Years | 18 (48.6%) | 0 (0.0%) |
| 65 to 74 Years | 6 (50.0%) | 3 (37.5%) |
| 75 Years and over | 3 (100.0%) | 0 (0.0%) |
Disability Class by Sex by Age in Concord
Disability Class: Hearing Difficulty
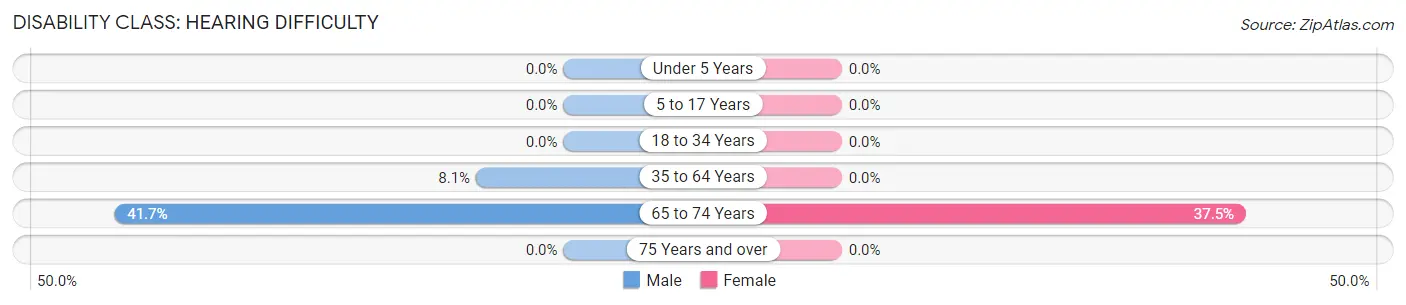
| Age Bracket | Male | Female |
| Under 5 Years | 0 (0.0%) | 0 (0.0%) |
| 5 to 17 Years | 0 (0.0%) | 0 (0.0%) |
| 18 to 34 Years | 0 (0.0%) | 0 (0.0%) |
| 35 to 64 Years | 3 (8.1%) | 0 (0.0%) |
| 65 to 74 Years | 5 (41.7%) | 3 (37.5%) |
| 75 Years and over | 0 (0.0%) | 0 (0.0%) |
Disability Class: Vision Difficulty
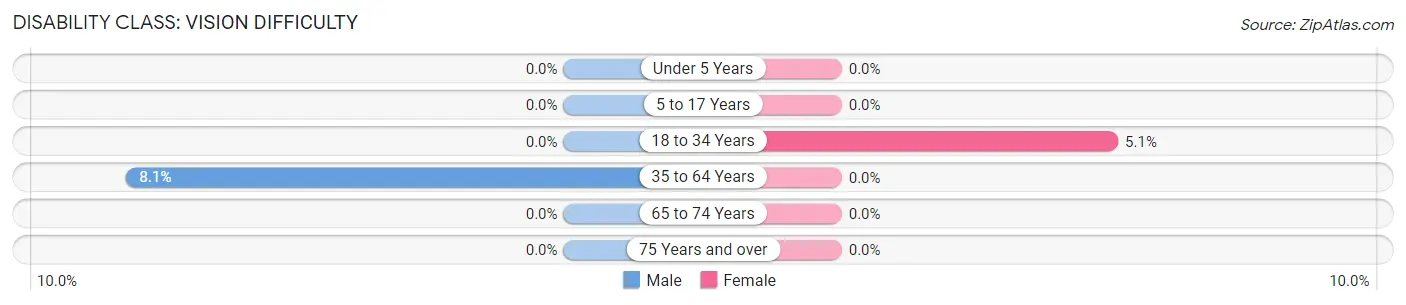
| Age Bracket | Male | Female |
| Under 5 Years | 0 (0.0%) | 0 (0.0%) |
| 5 to 17 Years | 0 (0.0%) | 0 (0.0%) |
| 18 to 34 Years | 0 (0.0%) | 2 (5.1%) |
| 35 to 64 Years | 3 (8.1%) | 0 (0.0%) |
| 65 to 74 Years | 0 (0.0%) | 0 (0.0%) |
| 75 Years and over | 0 (0.0%) | 0 (0.0%) |
Disability Class: Cognitive Difficulty
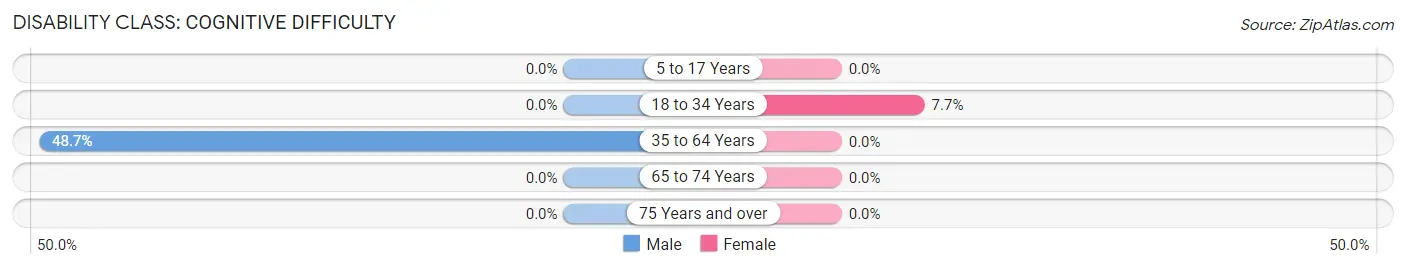
| Age Bracket | Male | Female |
| 5 to 17 Years | 0 (0.0%) | 0 (0.0%) |
| 18 to 34 Years | 0 (0.0%) | 3 (7.7%) |
| 35 to 64 Years | 18 (48.6%) | 0 (0.0%) |
| 65 to 74 Years | 0 (0.0%) | 0 (0.0%) |
| 75 Years and over | 0 (0.0%) | 0 (0.0%) |
Disability Class: Ambulatory Difficulty
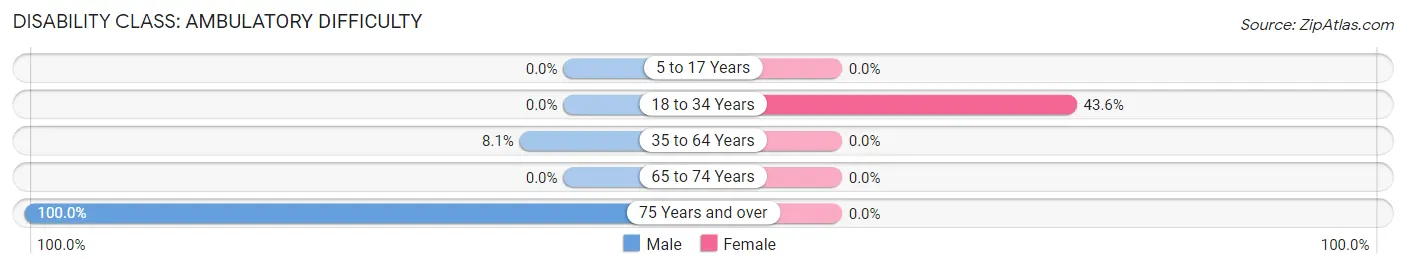
| Age Bracket | Male | Female |
| 5 to 17 Years | 0 (0.0%) | 0 (0.0%) |
| 18 to 34 Years | 0 (0.0%) | 17 (43.6%) |
| 35 to 64 Years | 3 (8.1%) | 0 (0.0%) |
| 65 to 74 Years | 0 (0.0%) | 0 (0.0%) |
| 75 Years and over | 3 (100.0%) | 0 (0.0%) |
Disability Class: Self-Care Difficulty
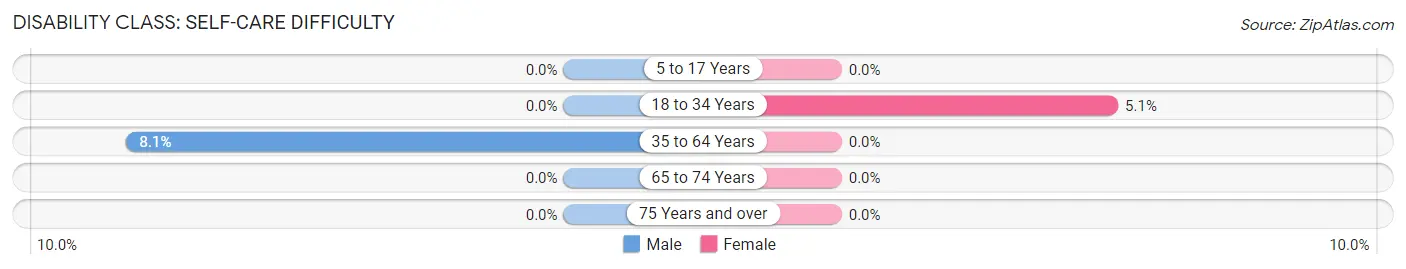
| Age Bracket | Male | Female |
| 5 to 17 Years | 0 (0.0%) | 0 (0.0%) |
| 18 to 34 Years | 0 (0.0%) | 2 (5.1%) |
| 35 to 64 Years | 3 (8.1%) | 0 (0.0%) |
| 65 to 74 Years | 0 (0.0%) | 0 (0.0%) |
| 75 Years and over | 0 (0.0%) | 0 (0.0%) |
Technology Access in Concord
Computing Device Access in Concord
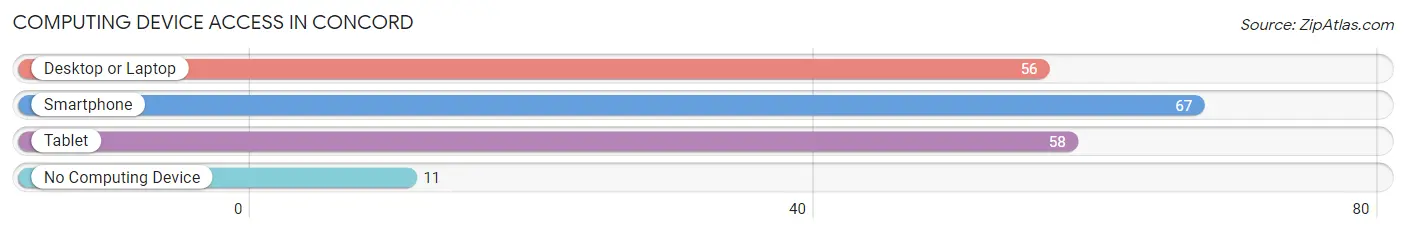
| Device Type | # Households | % Households |
| Desktop or Laptop | 56 | 71.8% |
| Smartphone | 67 | 85.9% |
| Tablet | 58 | 74.4% |
| No Computing Device | 11 | 14.1% |
| Total | 78 | 100.0% |
Internet Access in Concord
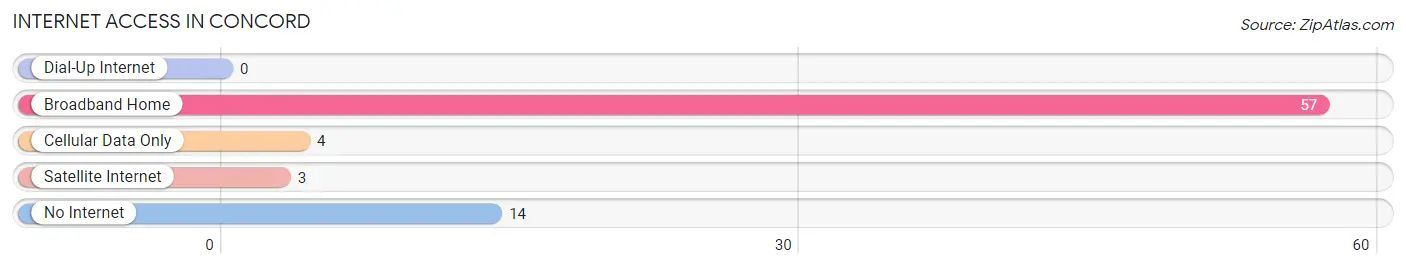
| Internet Type | # Households | % Households |
| Dial-Up Internet | 0 | 0.0% |
| Broadband Home | 57 | 73.1% |
| Cellular Data Only | 4 | 5.1% |
| Satellite Internet | 3 | 3.8% |
| No Internet | 14 | 17.9% |
| Total | 78 | 100.0% |
Concord Summary
Concord is a town located in the state of Vermont, in the United States of America. It is located in the county of Essex, and is part of the Burlington-South Burlington Metropolitan Statistical Area. The town has a population of approximately 1,400 people, and is located in the northern part of the state.
History
The area that is now Concord was first settled in 1790 by a group of settlers from Massachusetts. The town was originally known as “New Concord”, and was incorporated in 1802. The town was named after the town of Concord, Massachusetts, which was the birthplace of many of the settlers.
The town was primarily an agricultural community, with the main crops being wheat, corn, and potatoes. The town also had a number of sawmills, gristmills, and other small industries.
In the late 19th century, the town began to experience a period of growth and development. The town was connected to the railroad in 1875, and the first telephone line was installed in 1883. The town also had a number of stores, hotels, and other businesses.
Geography
Concord is located in the northern part of Vermont, in the county of Essex. The town is situated in the Green Mountains, and is surrounded by the towns of Essex Junction, Jericho, and Underhill. The town is located approximately 25 miles from Burlington, the largest city in the state.
The town has a total area of 24.2 square miles, of which 24.1 square miles is land and 0.1 square miles is water. The town is located at an elevation of 1,000 feet above sea level.
Economy
The economy of Concord is primarily based on agriculture and tourism. The town is home to a number of farms, which produce a variety of crops, including corn, wheat, and potatoes. The town also has a number of small businesses, including restaurants, stores, and other services.
The town is also a popular tourist destination, due to its proximity to Burlington and other attractions in the area. The town is home to a number of historic sites, including the Old Stone House, which was built in 1790. The town also has a number of parks and recreational areas, including the Concord Town Forest and the Concord Town Beach.
Demographics
As of the 2010 census, the population of Concord was 1,400 people. The racial makeup of the town was 97.3% White, 0.6% African American, 0.3% Native American, 0.3% Asian, 0.1% Pacific Islander, 0.3% from other races, and 1.3% from two or more races. Hispanic or Latino of any race were 1.3% of the population.
The median income for a household in the town was $50,000, and the median income for a family was $60,000. The per capita income for the town was $25,000. About 8.3% of families and 10.3% of the population were below the poverty line, including 14.3% of those under age 18 and 5.3% of those age 65 or over.
Common Questions
What is Per Capita Income in Concord?
Per Capita income in Concord is $29,942.
What is the Median Household income in Concord?
Median Household Income in Concord is $52,188.
What is Inequality or Gini Index in Concord?
Inequality or Gini Index in Concord is 0.32.
What is the Total Population of Concord?
Total Population of Concord is 181.
What is the Total Male Population of Concord?
Total Male Population of Concord is 74.
What is the Total Female Population of Concord?
Total Female Population of Concord is 107.
What is the Ratio of Males per 100 Females in Concord?
There are 69.16 Males per 100 Females in Concord.
What is the Ratio of Females per 100 Males in Concord?
There are 144.59 Females per 100 Males in Concord.
What is the Median Population Age in Concord?
Median Population Age in Concord is 38.6 Years.
What is the Average Family Size in Concord
Average Family Size in Concord is 2.4 People.
What is the Average Household Size in Concord
Average Household Size in Concord is 2.3 People.
How Large is the Labor Force in Concord?
There are 113 People in the Labor Forcein in Concord.
What is the Percentage of People in the Labor Force in Concord?
74.3% of People are in the Labor Force in Concord.