Groton, VT Map & Demographics
Groton Map
Groton Overview
$25,555
PER CAPITA INCOME
$72,212
AVG FAMILY INCOME
$54,769
AVG HOUSEHOLD INCOME
71.3%
WAGE / INCOME GAP [ % ]
28.7¢/ $1
WAGE / INCOME GAP [ $ ]
0.35
INEQUALITY / GINI INDEX
576
TOTAL POPULATION
264
MALE POPULATION
312
FEMALE POPULATION
84.62
MALES / 100 FEMALES
118.18
FEMALES / 100 MALES
31.3
MEDIAN AGE
3.2
AVG FAMILY SIZE
2.8
AVG HOUSEHOLD SIZE
281
LABOR FORCE [ PEOPLE ]
54.8%
PERCENT IN LABOR FORCE
10.7%
UNEMPLOYMENT RATE
Groton Zip Codes
Groton Area Codes
Income in Groton
Income Overview in Groton
Per Capita Income in Groton is $25,555, while median incomes of families and households are $72,212 and $54,769 respectively.
| Characteristic | Number | Measure |
| Per Capita Income | 576 | $25,555 |
| Median Family Income | 147 | $72,212 |
| Mean Family Income | 147 | $73,799 |
| Median Household Income | 207 | $54,769 |
| Mean Household Income | 207 | $64,339 |
| Income Deficit | 147 | $0 |
| Wage / Income Gap (%) | 576 | 71.34% |
| Wage / Income Gap ($) | 576 | 28.66¢ per $1 |
| Gini / Inequality Index | 576 | 0.35 |
Earnings by Sex in Groton
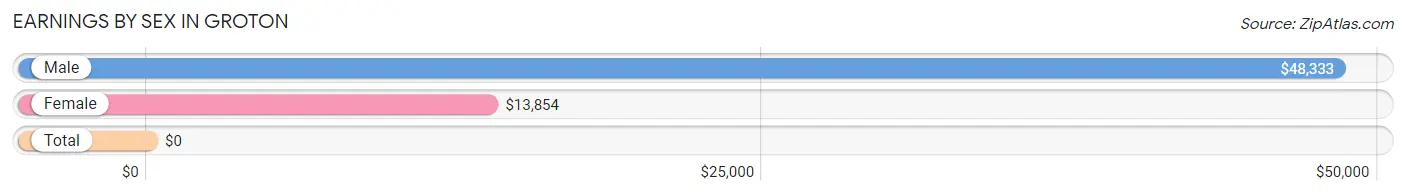
| Sex | Number | Average Earnings |
| Male | 136 (38.3%) | $48,333 |
| Female | 219 (61.7%) | $13,854 |
| Total | 355 (100.0%) | $0 |
Earnings by Sex by Income Bracket in Groton
The most common earnings brackets in Groton are $45,000 to $49,999 for men (26 | 19.1%) and $12,500 to $14,999 for women (84 | 38.4%).
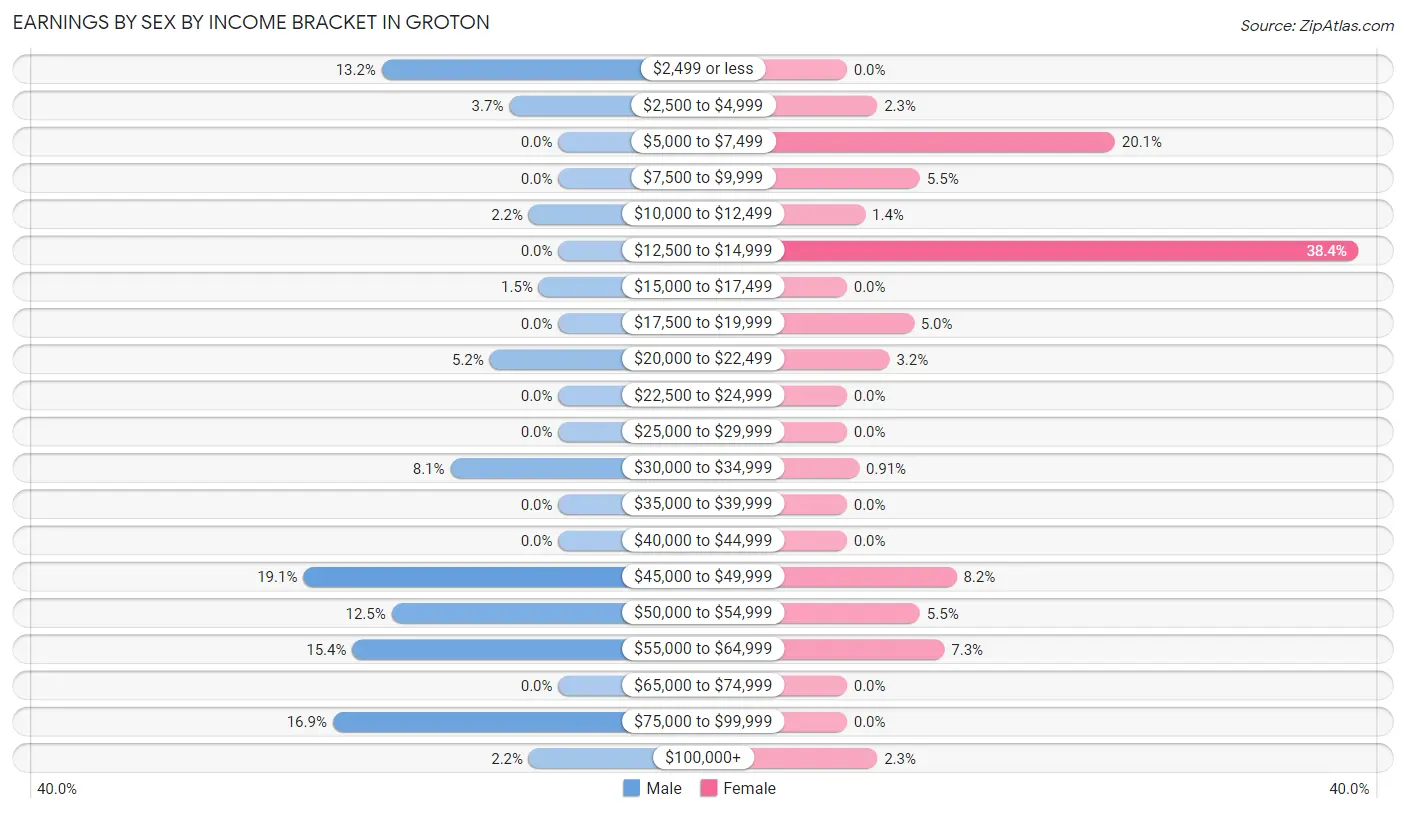
| Income | Male | Female |
| $2,499 or less | 18 (13.2%) | 0 (0.0%) |
| $2,500 to $4,999 | 5 (3.7%) | 5 (2.3%) |
| $5,000 to $7,499 | 0 (0.0%) | 44 (20.1%) |
| $7,500 to $9,999 | 0 (0.0%) | 12 (5.5%) |
| $10,000 to $12,499 | 3 (2.2%) | 3 (1.4%) |
| $12,500 to $14,999 | 0 (0.0%) | 84 (38.4%) |
| $15,000 to $17,499 | 2 (1.5%) | 0 (0.0%) |
| $17,500 to $19,999 | 0 (0.0%) | 11 (5.0%) |
| $20,000 to $22,499 | 7 (5.1%) | 7 (3.2%) |
| $22,500 to $24,999 | 0 (0.0%) | 0 (0.0%) |
| $25,000 to $29,999 | 0 (0.0%) | 0 (0.0%) |
| $30,000 to $34,999 | 11 (8.1%) | 2 (0.9%) |
| $35,000 to $39,999 | 0 (0.0%) | 0 (0.0%) |
| $40,000 to $44,999 | 0 (0.0%) | 0 (0.0%) |
| $45,000 to $49,999 | 26 (19.1%) | 18 (8.2%) |
| $50,000 to $54,999 | 17 (12.5%) | 12 (5.5%) |
| $55,000 to $64,999 | 21 (15.4%) | 16 (7.3%) |
| $65,000 to $74,999 | 0 (0.0%) | 0 (0.0%) |
| $75,000 to $99,999 | 23 (16.9%) | 0 (0.0%) |
| $100,000+ | 3 (2.2%) | 5 (2.3%) |
| Total | 136 (100.0%) | 219 (100.0%) |
Earnings by Sex by Educational Attainment in Groton
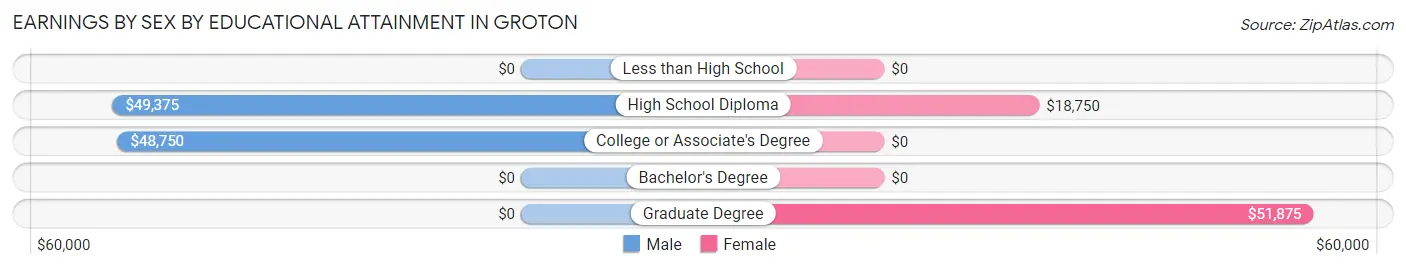
| Educational Attainment | Male Income | Female Income |
| Less than High School | - | - |
| High School Diploma | $49,375 | $18,750 |
| College or Associate's Degree | $48,750 | $0 |
| Bachelor's Degree | - | - |
| Graduate Degree | - | - |
| Total | $48,958 | $0 |
Family Income in Groton
Family Income Brackets in Groton
According to the Groton family income data, there are 42 families falling into the $50,000 to $74,999 income range, which is the most common income bracket and makes up 28.6% of all families.
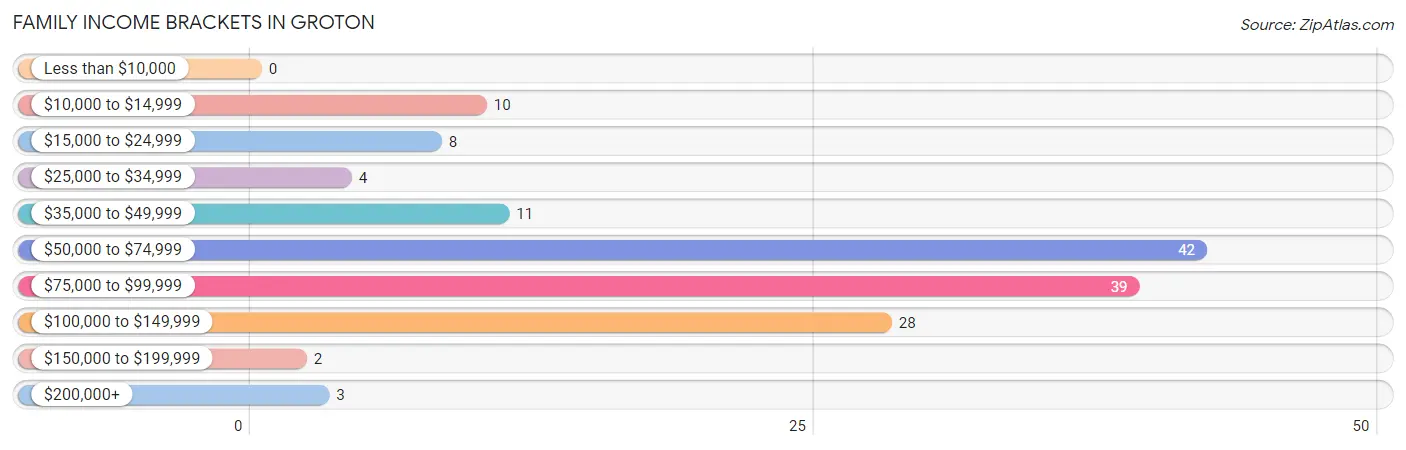
| Income Bracket | # Families | % Families |
| Less than $10,000 | 0 | 0.0% |
| $10,000 to $14,999 | 10 | 6.8% |
| $15,000 to $24,999 | 8 | 5.4% |
| $25,000 to $34,999 | 4 | 2.7% |
| $35,000 to $49,999 | 11 | 7.5% |
| $50,000 to $74,999 | 42 | 28.6% |
| $75,000 to $99,999 | 39 | 26.5% |
| $100,000 to $149,999 | 28 | 19.0% |
| $150,000 to $199,999 | 2 | 1.4% |
| $200,000+ | 3 | 2.0% |
Family Income by Famaliy Size in Groton
2-person families (78 | 53.1%) account for the highest median family income in Groton with $70,769 per family, while 2-person families (78 | 53.1%) have the highest median income of $35,384 per family member.
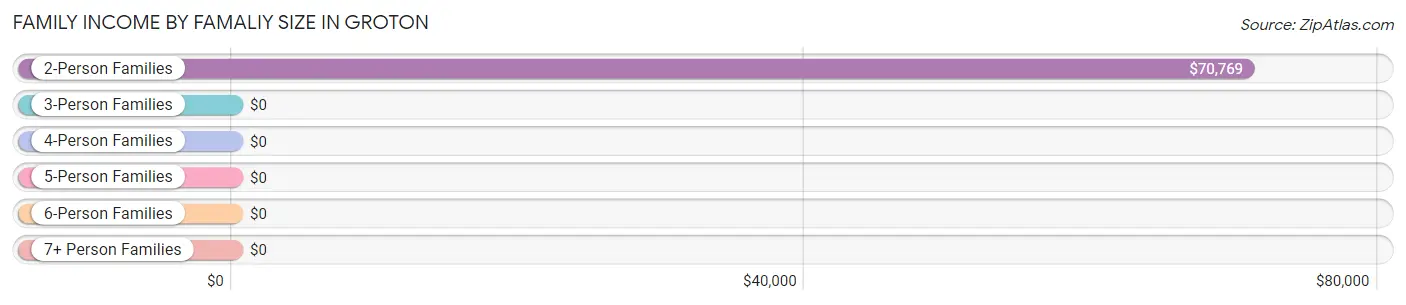
| Income Bracket | # Families | Median Income |
| 2-Person Families | 78 (53.1%) | $70,769 |
| 3-Person Families | 16 (10.9%) | $0 |
| 4-Person Families | 47 (32.0%) | $0 |
| 5-Person Families | 3 (2.0%) | $0 |
| 6-Person Families | 3 (2.0%) | $0 |
| 7+ Person Families | 0 (0.0%) | $0 |
| Total | 147 (100.0%) | $72,212 |
Family Income by Number of Earners in Groton
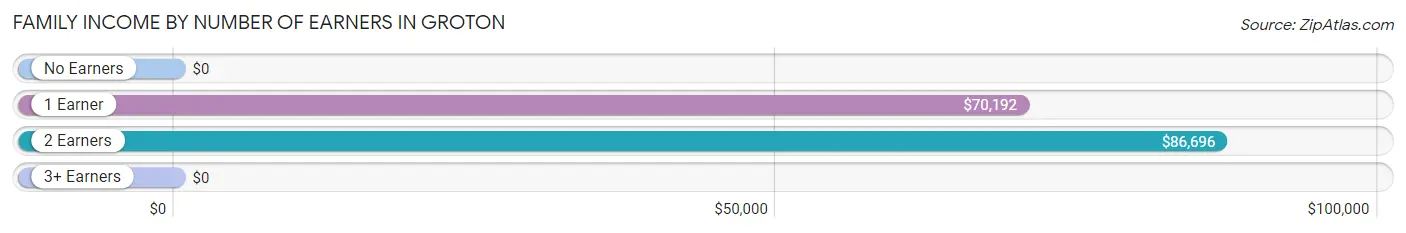
| Number of Earners | # Families | Median Income |
| No Earners | 15 (10.2%) | $0 |
| 1 Earner | 34 (23.1%) | $70,192 |
| 2 Earners | 91 (61.9%) | $86,696 |
| 3+ Earners | 7 (4.8%) | $0 |
| Total | 147 (100.0%) | $72,212 |
Household Income in Groton
Household Income Brackets in Groton
With 44 households falling in the category, the $50,000 to $74,999 income range is the most frequent in Groton, accounting for 21.3% of all households.
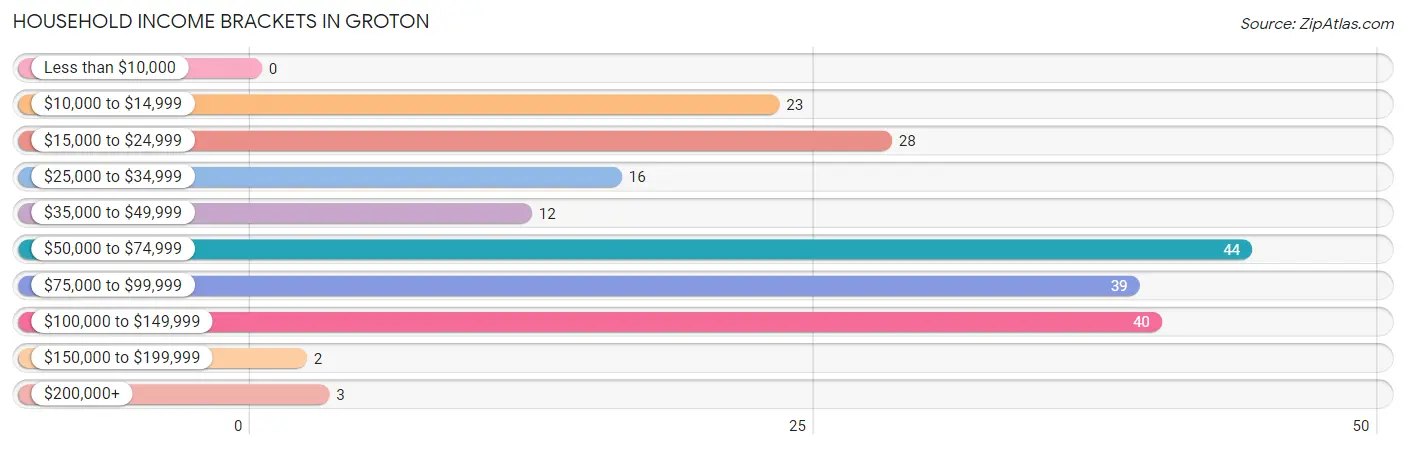
| Income Bracket | # Households | % Households |
| Less than $10,000 | 0 | 0.0% |
| $10,000 to $14,999 | 23 | 11.1% |
| $15,000 to $24,999 | 28 | 13.5% |
| $25,000 to $34,999 | 16 | 7.7% |
| $35,000 to $49,999 | 12 | 5.8% |
| $50,000 to $74,999 | 44 | 21.3% |
| $75,000 to $99,999 | 39 | 18.8% |
| $100,000 to $149,999 | 40 | 19.3% |
| $150,000 to $199,999 | 2 | 1.0% |
| $200,000+ | 3 | 1.4% |
Household Income by Householder Age in Groton
The median household income in Groton is $54,769, with the highest median household income of $90,887 found in the 25 to 44 years age bracket for the primary householder. A total of 92 households (44.4%) fall into this category.
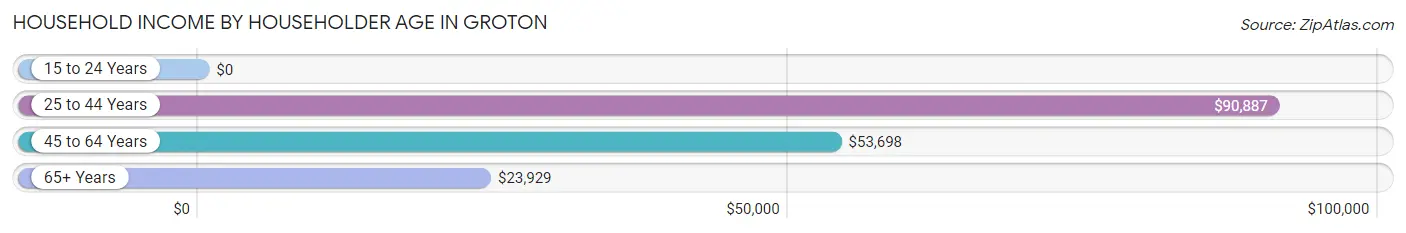
| Income Bracket | # Households | Median Income |
| 15 to 24 Years | 0 (0.0%) | $0 |
| 25 to 44 Years | 92 (44.4%) | $90,887 |
| 45 to 64 Years | 59 (28.5%) | $53,698 |
| 65+ Years | 56 (27.1%) | $23,929 |
| Total | 207 (100.0%) | $54,769 |
Poverty in Groton
Income Below Poverty by Sex and Age in Groton
With 10.4% poverty level for males and 18.6% for females among the residents of Groton, 12 to 14 year old males and 35 to 44 year old females are the most vulnerable to poverty, with 3 males (50.0%) and 14 females (50.0%) in their respective age groups living below the poverty level.
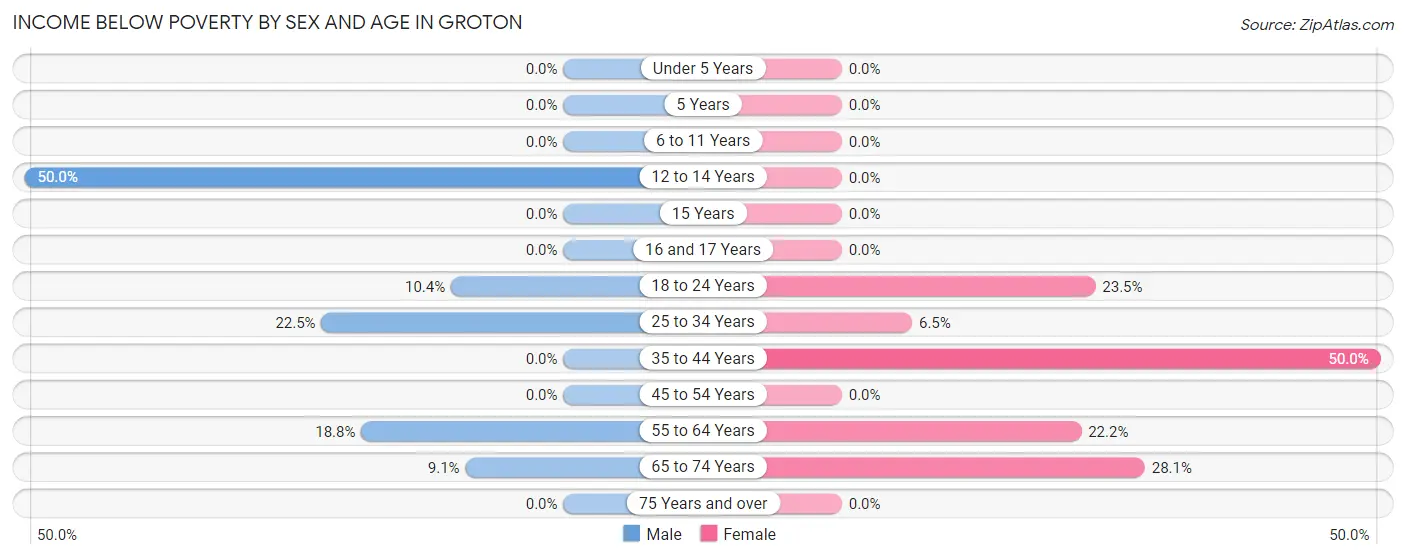
| Age Bracket | Male | Female |
| Under 5 Years | 0 (0.0%) | 0 (0.0%) |
| 5 Years | 0 (0.0%) | 0 (0.0%) |
| 6 to 11 Years | 0 (0.0%) | 0 (0.0%) |
| 12 to 14 Years | 3 (50.0%) | 0 (0.0%) |
| 15 Years | 0 (0.0%) | 0 (0.0%) |
| 16 and 17 Years | 0 (0.0%) | 0 (0.0%) |
| 18 to 24 Years | 5 (10.4%) | 24 (23.5%) |
| 25 to 34 Years | 11 (22.5%) | 3 (6.5%) |
| 35 to 44 Years | 0 (0.0%) | 14 (50.0%) |
| 45 to 54 Years | 0 (0.0%) | 0 (0.0%) |
| 55 to 64 Years | 6 (18.8%) | 8 (22.2%) |
| 65 to 74 Years | 2 (9.1%) | 9 (28.1%) |
| 75 Years and over | 0 (0.0%) | 0 (0.0%) |
| Total | 27 (10.4%) | 58 (18.6%) |
Income Above Poverty by Sex and Age in Groton
According to the poverty statistics in Groton, males aged under 5 years and females aged under 5 years are the age groups that are most secure financially, with 100.0% of males and 100.0% of females in these age groups living above the poverty line.
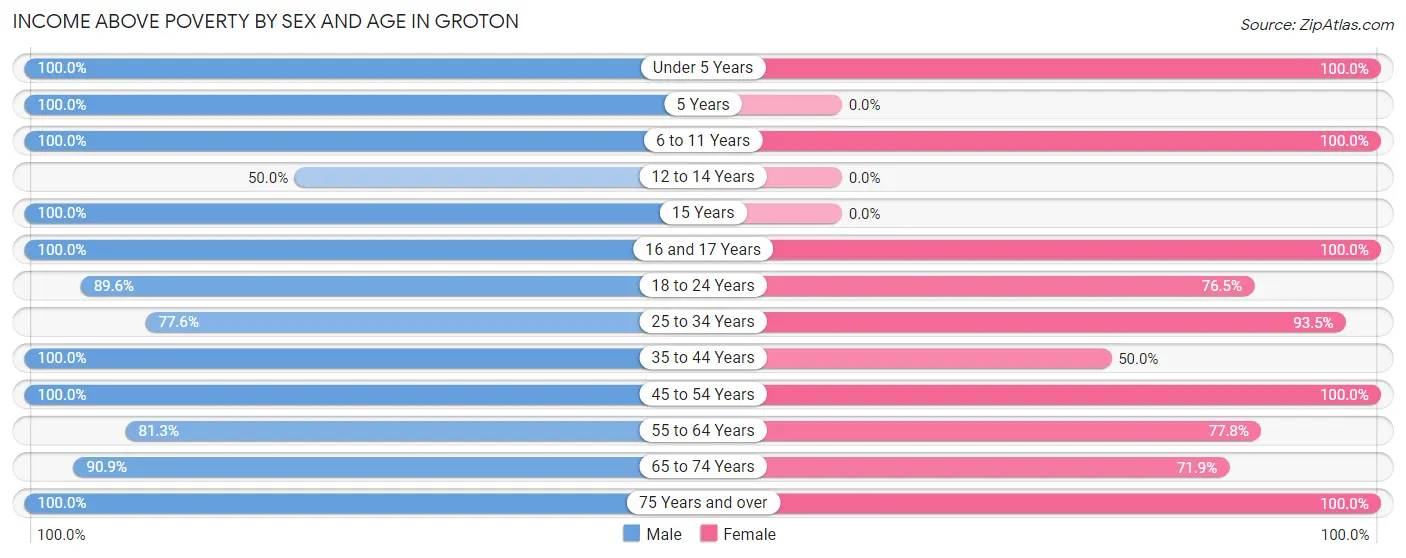
| Age Bracket | Male | Female |
| Under 5 Years | 9 (100.0%) | 12 (100.0%) |
| 5 Years | 6 (100.0%) | 0 (0.0%) |
| 6 to 11 Years | 2 (100.0%) | 7 (100.0%) |
| 12 to 14 Years | 3 (50.0%) | 0 (0.0%) |
| 15 Years | 17 (100.0%) | 0 (0.0%) |
| 16 and 17 Years | 4 (100.0%) | 7 (100.0%) |
| 18 to 24 Years | 43 (89.6%) | 78 (76.5%) |
| 25 to 34 Years | 38 (77.5%) | 43 (93.5%) |
| 35 to 44 Years | 17 (100.0%) | 14 (50.0%) |
| 45 to 54 Years | 36 (100.0%) | 22 (100.0%) |
| 55 to 64 Years | 26 (81.2%) | 28 (77.8%) |
| 65 to 74 Years | 20 (90.9%) | 23 (71.9%) |
| 75 Years and over | 12 (100.0%) | 20 (100.0%) |
| Total | 233 (89.6%) | 254 (81.4%) |
Income Below Poverty Among Married-Couple Families in Groton
The poverty statistics for married-couple families in Groton show that 6.6% or 8 of the total 121 families live below the poverty line. Families with no children have the highest poverty rate of 9.6%, comprising of 8 families. On the other hand, families with 1 or 2 children have the lowest poverty rate of 0.0%, which includes 0 families.
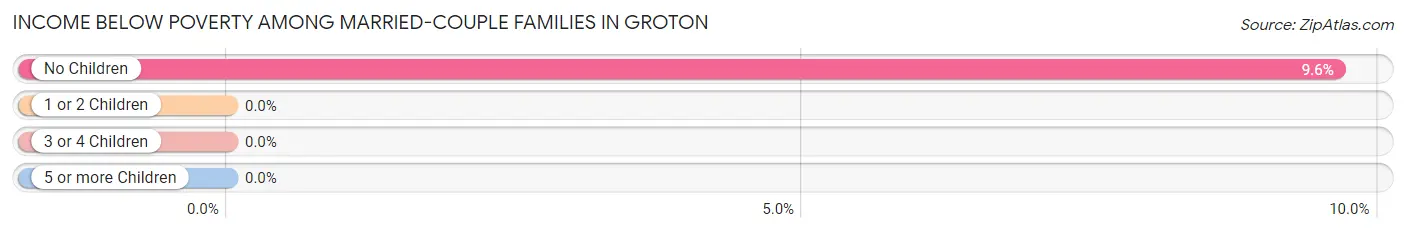
| Children | Above Poverty | Below Poverty |
| No Children | 75 (90.4%) | 8 (9.6%) |
| 1 or 2 Children | 35 (100.0%) | 0 (0.0%) |
| 3 or 4 Children | 3 (100.0%) | 0 (0.0%) |
| 5 or more Children | 0 (0.0%) | 0 (0.0%) |
| Total | 113 (93.4%) | 8 (6.6%) |
Income Below Poverty Among Single-Parent Households in Groton
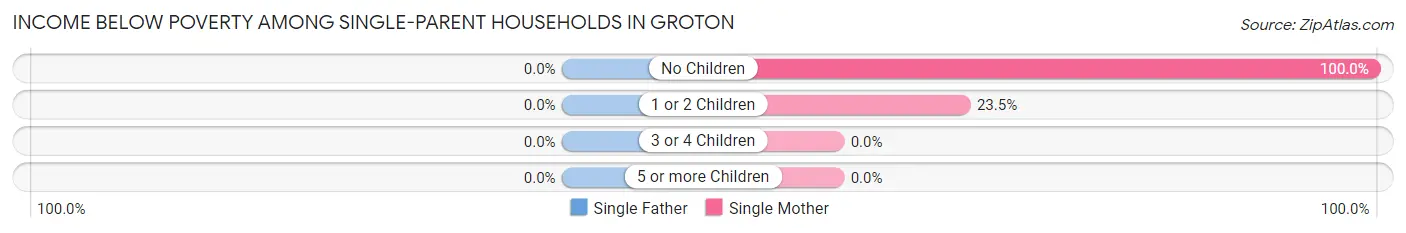
| Children | Single Father | Single Mother |
| No Children | 0 (0.0%) | 4 (100.0%) |
| 1 or 2 Children | 0 (0.0%) | 4 (23.5%) |
| 3 or 4 Children | 0 (0.0%) | 0 (0.0%) |
| 5 or more Children | 0 (0.0%) | 0 (0.0%) |
| Total | 0 (0.0%) | 8 (38.1%) |
Income Below Poverty Among Married-Couple vs Single-Parent Households in Groton
The poverty data for Groton shows that 8 of the married-couple family households (6.6%) and 8 of the single-parent households (30.8%) are living below the poverty level. Within the married-couple family households, those with no children have the highest poverty rate, with 8 households (9.6%) falling below the poverty line. Among the single-parent households, those with no children have the highest poverty rate, with 4 household (100.0%) living below poverty.
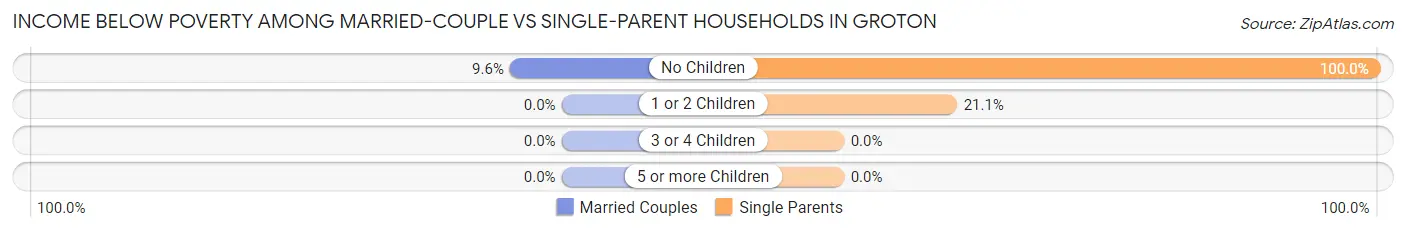
| Children | Married-Couple Families | Single-Parent Households |
| No Children | 8 (9.6%) | 4 (100.0%) |
| 1 or 2 Children | 0 (0.0%) | 4 (21.0%) |
| 3 or 4 Children | 0 (0.0%) | 0 (0.0%) |
| 5 or more Children | 0 (0.0%) | 0 (0.0%) |
| Total | 8 (6.6%) | 8 (30.8%) |
Race in Groton
The most populous races in Groton are White / Caucasian (541 | 93.9%), and Two or more Races (35 | 6.1%).
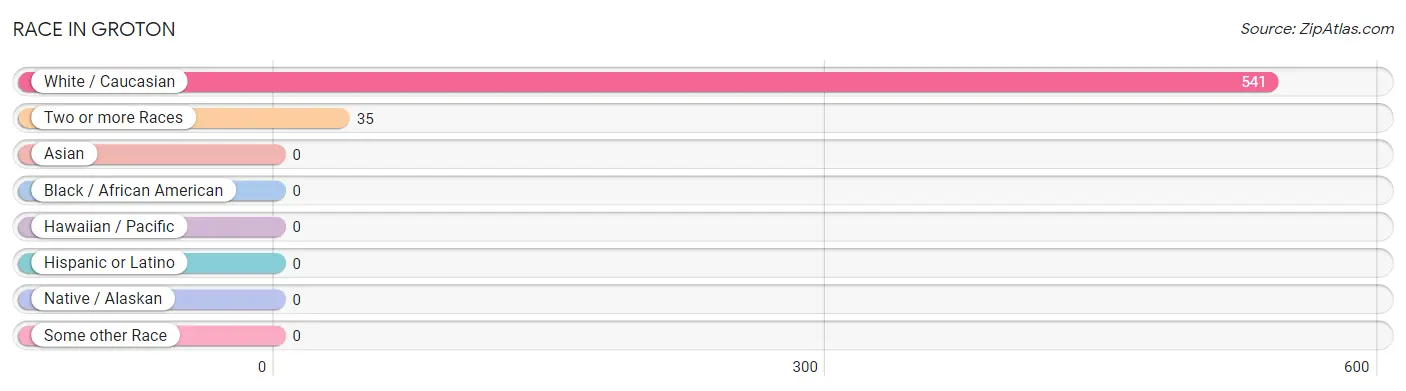
| Race | # Population | % Population |
| Asian | 0 | 0.0% |
| Black / African American | 0 | 0.0% |
| Hawaiian / Pacific | 0 | 0.0% |
| Hispanic or Latino | 0 | 0.0% |
| Native / Alaskan | 0 | 0.0% |
| White / Caucasian | 541 | 93.9% |
| Two or more Races | 35 | 6.1% |
| Some other Race | 0 | 0.0% |
| Total | 576 | 100.0% |
Ancestry in Groton
The most populous ancestries reported in Groton are Irish (212 | 36.8%), Swedish (119 | 20.7%), English (73 | 12.7%), German (63 | 10.9%), and American (35 | 6.1%), together accounting for 87.2% of all Groton residents.
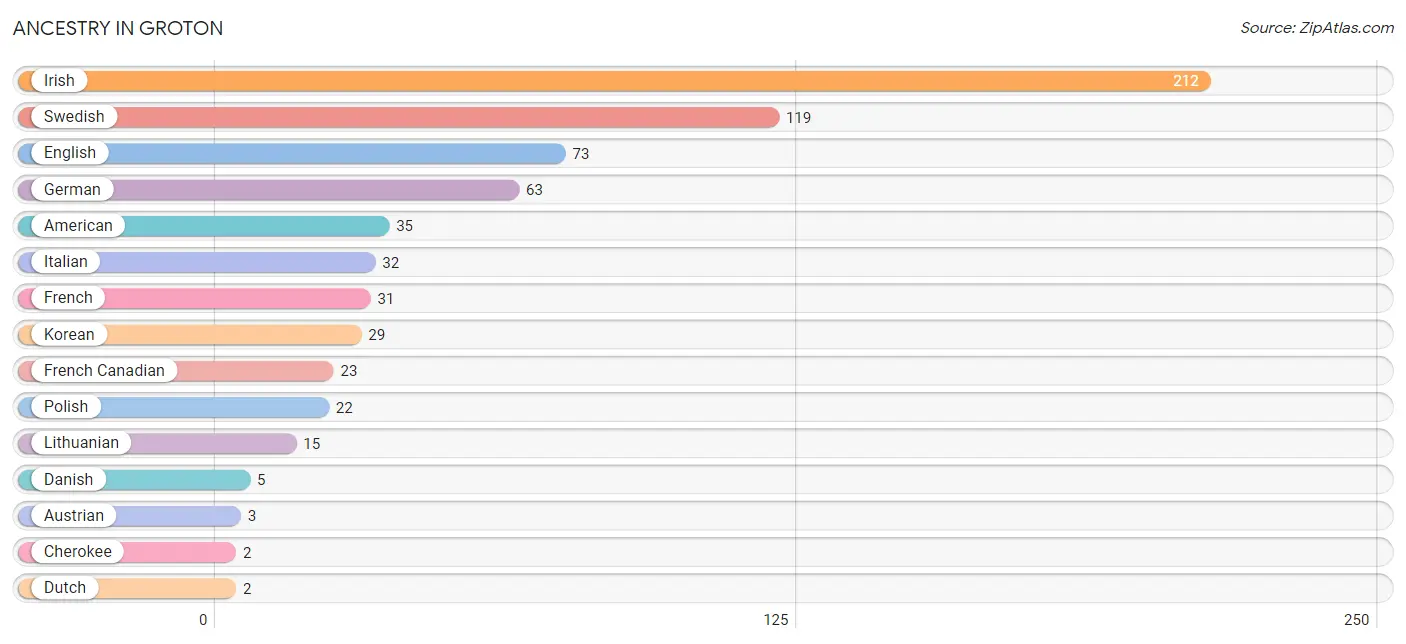
| Ancestry | # Population | % Population |
| American | 35 | 6.1% |
| Austrian | 3 | 0.5% |
| Cherokee | 2 | 0.4% |
| Danish | 5 | 0.9% |
| Dutch | 2 | 0.4% |
| English | 73 | 12.7% |
| French | 31 | 5.4% |
| French Canadian | 23 | 4.0% |
| German | 63 | 10.9% |
| Irish | 212 | 36.8% |
| Italian | 32 | 5.6% |
| Korean | 29 | 5.0% |
| Lithuanian | 15 | 2.6% |
| Polish | 22 | 3.8% |
| Swedish | 119 | 20.7% | View All 15 Rows |
Immigrants in Groton
The most numerous immigrant groups reported in Groton came from Europe (8 | 1.4%), and Northern Europe (8 | 1.4%), together accounting for 2.8% of all Groton residents.
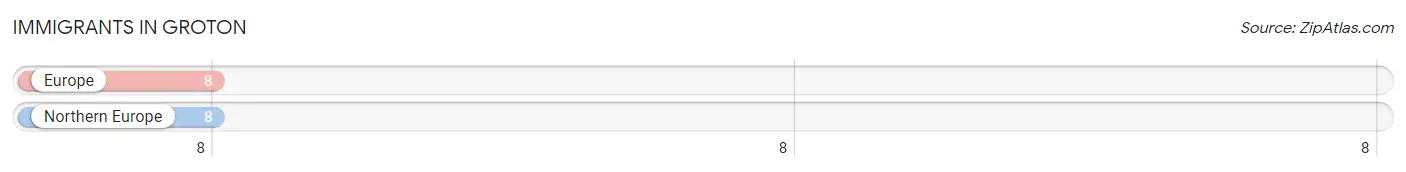
| Immigration Origin | # Population | % Population |
| Europe | 8 | 1.4% |
| Northern Europe | 8 | 1.4% | View All 2 Rows |
Sex and Age in Groton
Sex and Age in Groton
The most populous age groups in Groton are 20 to 24 Years (38 | 14.4%) for men and 15 to 19 Years (106 | 34.0%) for women.
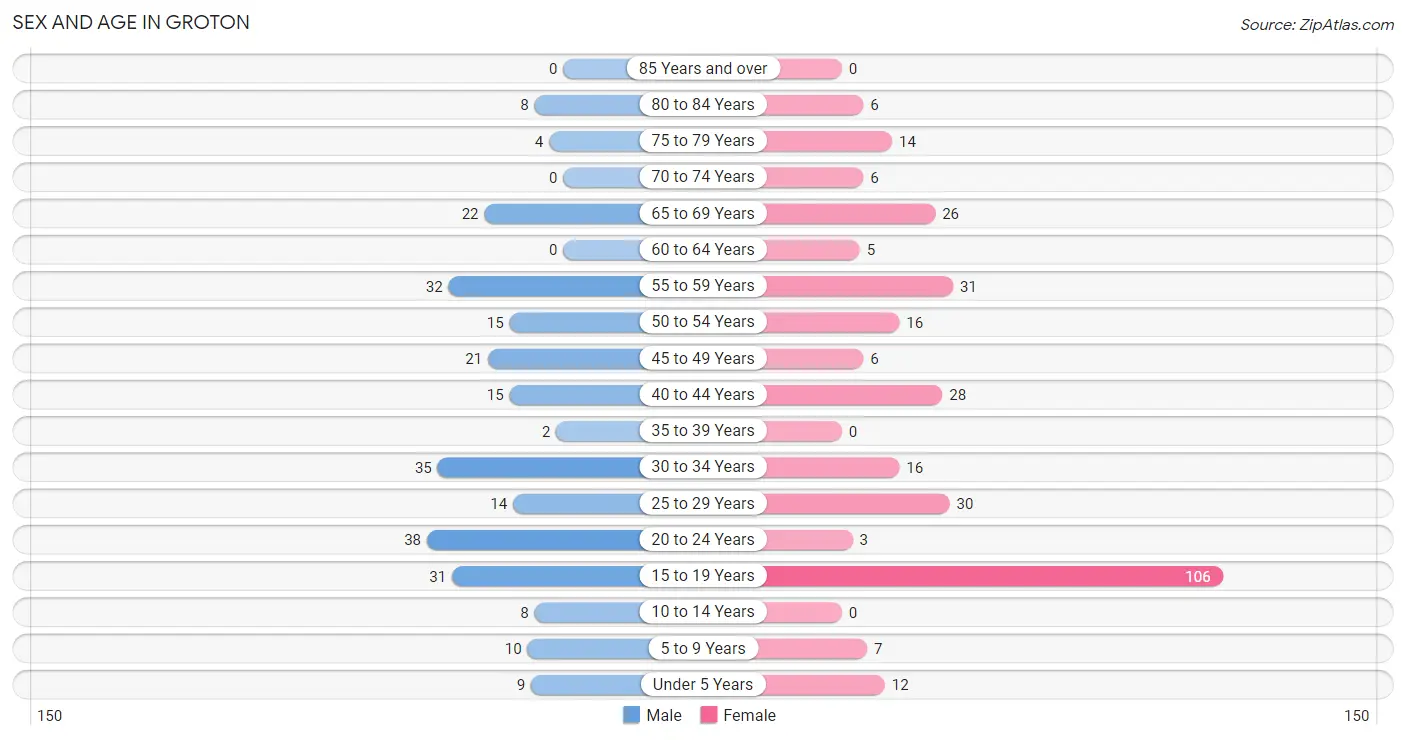
| Age Bracket | Male | Female |
| Under 5 Years | 9 (3.4%) | 12 (3.8%) |
| 5 to 9 Years | 10 (3.8%) | 7 (2.2%) |
| 10 to 14 Years | 8 (3.0%) | 0 (0.0%) |
| 15 to 19 Years | 31 (11.7%) | 106 (34.0%) |
| 20 to 24 Years | 38 (14.4%) | 3 (1.0%) |
| 25 to 29 Years | 14 (5.3%) | 30 (9.6%) |
| 30 to 34 Years | 35 (13.3%) | 16 (5.1%) |
| 35 to 39 Years | 2 (0.8%) | 0 (0.0%) |
| 40 to 44 Years | 15 (5.7%) | 28 (9.0%) |
| 45 to 49 Years | 21 (8.0%) | 6 (1.9%) |
| 50 to 54 Years | 15 (5.7%) | 16 (5.1%) |
| 55 to 59 Years | 32 (12.1%) | 31 (9.9%) |
| 60 to 64 Years | 0 (0.0%) | 5 (1.6%) |
| 65 to 69 Years | 22 (8.3%) | 26 (8.3%) |
| 70 to 74 Years | 0 (0.0%) | 6 (1.9%) |
| 75 to 79 Years | 4 (1.5%) | 14 (4.5%) |
| 80 to 84 Years | 8 (3.0%) | 6 (1.9%) |
| 85 Years and over | 0 (0.0%) | 0 (0.0%) |
| Total | 264 (100.0%) | 312 (100.0%) |
Families and Households in Groton
Median Family Size in Groton
The median family size in Groton is 3.21 persons per family, with married-couple families (121 | 82.3%) accounting for the largest median family size of 3.45 persons per family. On the other hand, single female/mother families (21 | 14.3%) represent the smallest median family size with 1.76 persons per family.
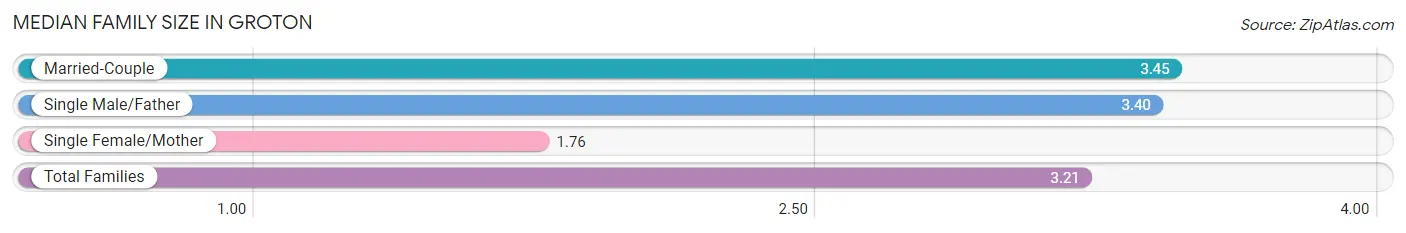
| Family Type | # Families | Family Size |
| Married-Couple | 121 (82.3%) | 3.45 |
| Single Male/Father | 5 (3.4%) | 3.40 |
| Single Female/Mother | 21 (14.3%) | 1.76 |
| Total Families | 147 (100.0%) | 3.21 |
Median Household Size in Groton
The median household size in Groton is 2.78 persons per household, with single male/father households (5 | 2.4%) accounting for the largest median household size of 4.8 persons per household. non-family households (60 | 29.0%) represent the smallest median household size with 1.03 persons per household.
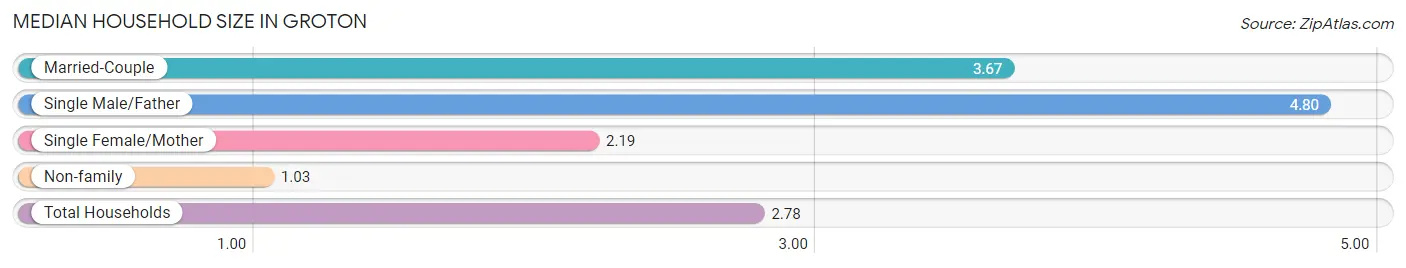
| Household Type | # Households | Household Size |
| Married-Couple | 121 (58.5%) | 3.67 |
| Single Male/Father | 5 (2.4%) | 4.80 |
| Single Female/Mother | 21 (10.1%) | 2.19 |
| Non-family | 60 (29.0%) | 1.03 |
| Total Households | 207 (100.0%) | 2.78 |
Household Size by Marriage Status in Groton
Out of a total of 207 households in Groton, 147 (71.0%) are family households, while 60 (29.0%) are nonfamily households. The most numerous type of family households are 2-person households, comprising 60, and the most common type of nonfamily households are 1-person households, comprising 58.
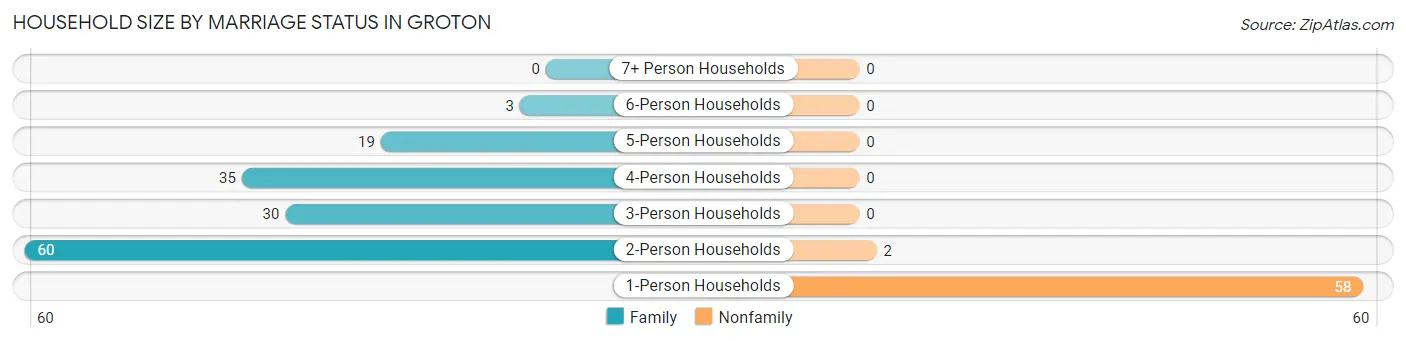
| Household Size | Family Households | Nonfamily Households |
| 1-Person Households | - | 58 (28.0%) |
| 2-Person Households | 60 (29.0%) | 2 (1.0%) |
| 3-Person Households | 30 (14.5%) | 0 (0.0%) |
| 4-Person Households | 35 (16.9%) | 0 (0.0%) |
| 5-Person Households | 19 (9.2%) | 0 (0.0%) |
| 6-Person Households | 3 (1.5%) | 0 (0.0%) |
| 7+ Person Households | 0 (0.0%) | 0 (0.0%) |
| Total | 147 (71.0%) | 60 (29.0%) |
Female Fertility in Groton
Fertility by Age in Groton
| Age Bracket | Women with Births | Births / 1,000 Women |
| 15 to 19 years | 0 (0.0%) | 0.0 |
| 20 to 34 years | 0 (0.0%) | 0.0 |
| 35 to 50 years | 0 (0.0%) | 0.0 |
| Total | 0 (0.0%) | 0.0 |
Fertility by Age by Marriage Status in Groton
| Age Bracket | Married | Unmarried |
| 15 to 19 years | 0 (0.0%) | 0 (0.0%) |
| 20 to 34 years | 0 (0.0%) | 0 (0.0%) |
| 35 to 50 years | 0 (0.0%) | 0 (0.0%) |
| Total | 0 (0.0%) | 0 (0.0%) |
Fertility by Education in Groton
| Educational Attainment | Women with Births | Births / 1,000 Women |
| Less than High School | 0 (0.0%) | 0.0 |
| High School Diploma | 0 (0.0%) | 0.0 |
| College or Associate's Degree | 0 (0.0%) | 0.0 |
| Bachelor's Degree | 0 (0.0%) | 0.0 |
| Graduate Degree | 0 (0.0%) | 0.0 |
| Total | 0 (0.0%) | 0.0 |
Fertility by Education by Marriage Status in Groton
| Educational Attainment | Married | Unmarried |
| Less than High School | 0 (0.0%) | 0 (0.0%) |
| High School Diploma | 0 (0.0%) | 0 (0.0%) |
| College or Associate's Degree | 0 (0.0%) | 0 (0.0%) |
| Bachelor's Degree | 0 (0.0%) | 0 (0.0%) |
| Graduate Degree | 0 (0.0%) | 0 (0.0%) |
| Total | 0 (0.0%) | 0 (0.0%) |
Employment Characteristics in Groton
Employment by Class of Employer in Groton
Among the 251 employed individuals in Groton, private company employees (166 | 66.1%), local government employees (44 | 17.5%), and not-for-profit organizations (22 | 8.8%) make up the most common classes of employment.
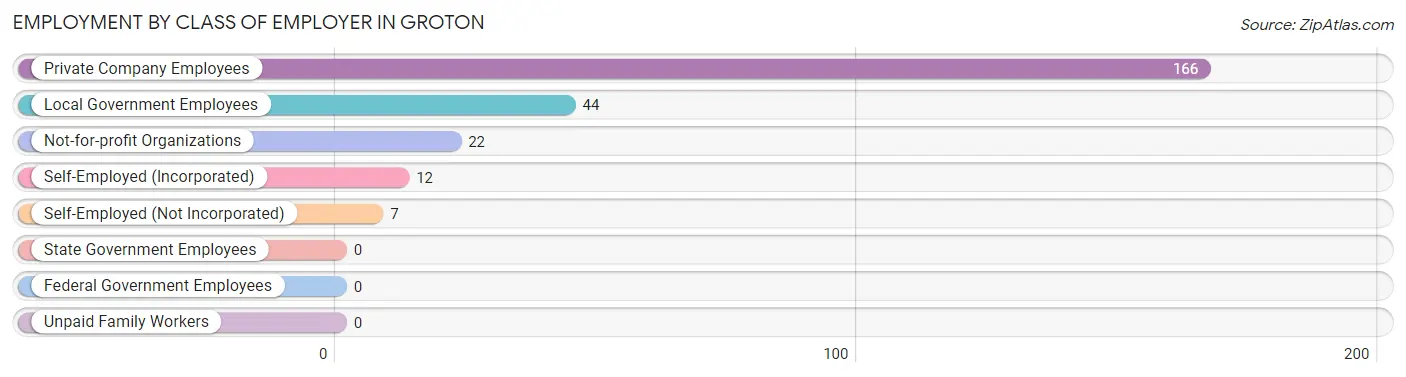
| Employer Class | # Employees | % Employees |
| Private Company Employees | 166 | 66.1% |
| Self-Employed (Incorporated) | 12 | 4.8% |
| Self-Employed (Not Incorporated) | 7 | 2.8% |
| Not-for-profit Organizations | 22 | 8.8% |
| Local Government Employees | 44 | 17.5% |
| State Government Employees | 0 | 0.0% |
| Federal Government Employees | 0 | 0.0% |
| Unpaid Family Workers | 0 | 0.0% |
| Total | 251 | 100.0% |
Employment Status by Age in Groton
According to the labor force statistics for Groton, out of the total population over 16 years of age (513), 54.8% or 281 individuals are in the labor force, with 10.7% or 30 of them unemployed. The age group with the highest labor force participation rate is 25 to 29 years, with 100.0% or 44 individuals in the labor force. Within the labor force, the 16 to 19 years age range has the highest percentage of unemployed individuals, with 50.0% or 21 of them being unemployed.
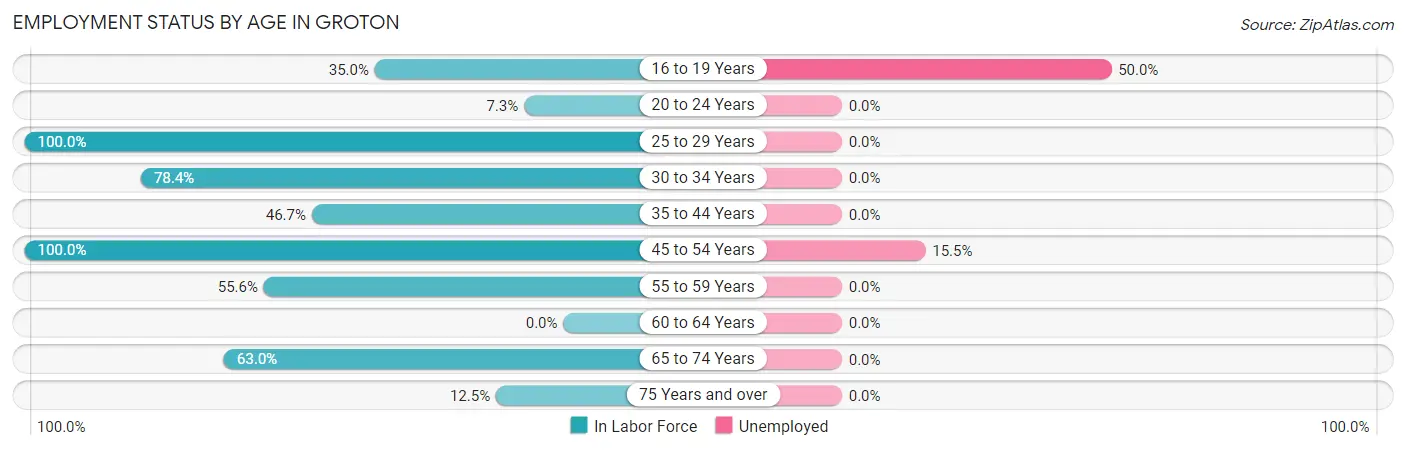
| Age Bracket | In Labor Force | Unemployed |
| 16 to 19 Years | 42 (35.0%) | 21 (50.0%) |
| 20 to 24 Years | 3 (7.3%) | 0 (0.0%) |
| 25 to 29 Years | 44 (100.0%) | 0 (0.0%) |
| 30 to 34 Years | 40 (78.4%) | 0 (0.0%) |
| 35 to 44 Years | 21 (46.7%) | 0 (0.0%) |
| 45 to 54 Years | 58 (100.0%) | 9 (15.5%) |
| 55 to 59 Years | 35 (55.6%) | 0 (0.0%) |
| 60 to 64 Years | 0 (0.0%) | 0 (0.0%) |
| 65 to 74 Years | 34 (63.0%) | 0 (0.0%) |
| 75 Years and over | 4 (12.5%) | 0 (0.0%) |
| Total | 281 (54.8%) | 30 (10.7%) |
Employment Status by Educational Attainment in Groton
According to labor force statistics for Groton, 74.4% of individuals (198) out of the total population between 25 and 64 years of age (266) are in the labor force, with 4.5% or 9 of them being unemployed. The group with the highest labor force participation rate are those with the educational attainment of less than high school, with 100.0% or 14 individuals in the labor force. Within the labor force, individuals with college / associate degree education have the highest percentage of unemployment, with 12.2% or 9 of them being unemployed.
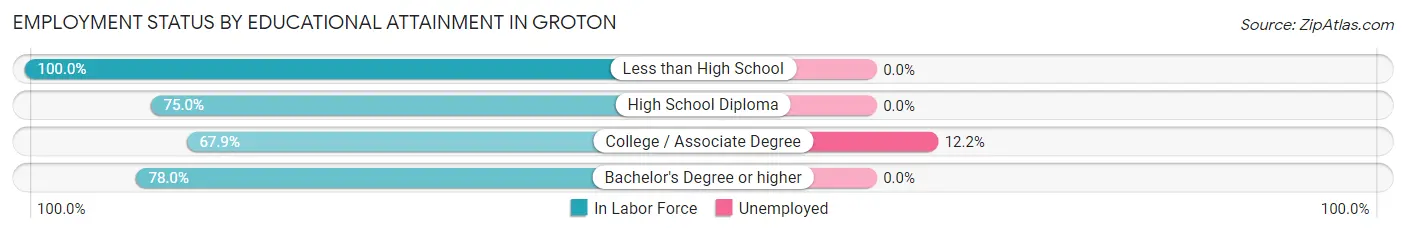
| Educational Attainment | In Labor Force | Unemployed |
| Less than High School | 14 (100.0%) | 0 (0.0%) |
| High School Diploma | 39 (75.0%) | 0 (0.0%) |
| College / Associate Degree | 74 (67.9%) | 13 (12.2%) |
| Bachelor's Degree or higher | 71 (78.0%) | 0 (0.0%) |
| Total | 198 (74.4%) | 12 (4.5%) |
Employment Occupations by Sex in Groton
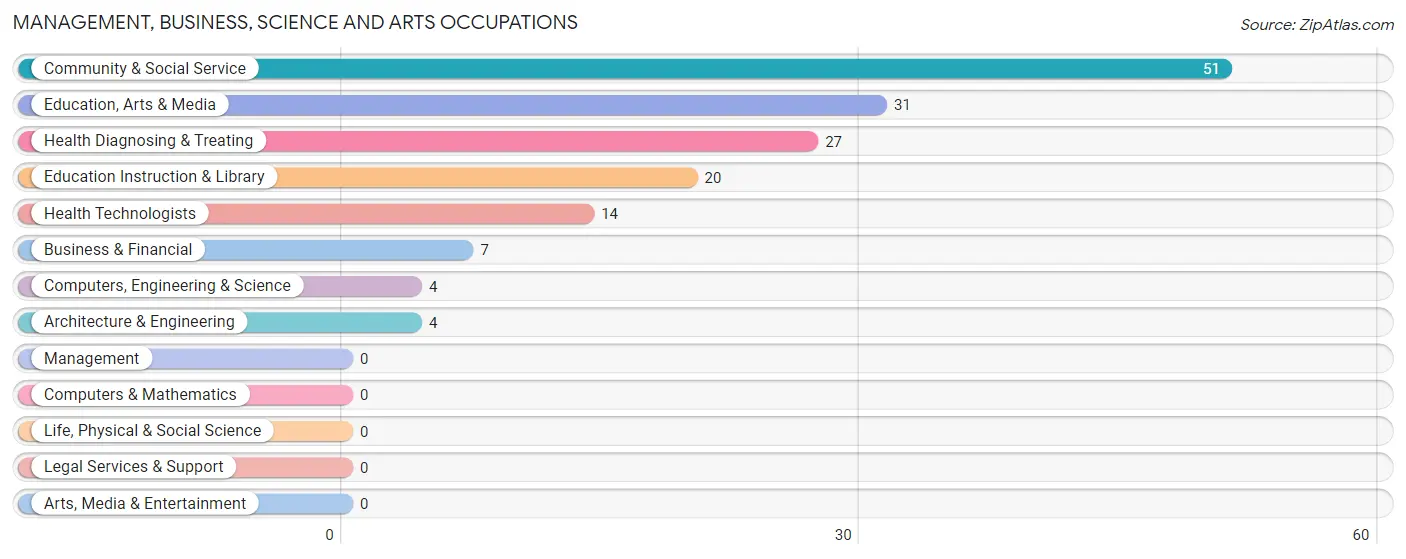
Management, Business, Science and Arts Occupations
The most common Management, Business, Science and Arts occupations in Groton are Community & Social Service (51 | 20.3%), Education, Arts & Media (31 | 12.3%), Health Diagnosing & Treating (27 | 10.8%), Education Instruction & Library (20 | 8.0%), and Health Technologists (14 | 5.6%).
Management, Business, Science and Arts Occupations by Sex
Within the Management, Business, Science and Arts occupations in Groton, the most male-oriented occupations are Computers, Engineering & Science (100.0%), Architecture & Engineering (100.0%), and Health Technologists (64.3%), while the most female-oriented occupations are Business & Financial (100.0%), Education Instruction & Library (90.0%), and Community & Social Service (82.4%).
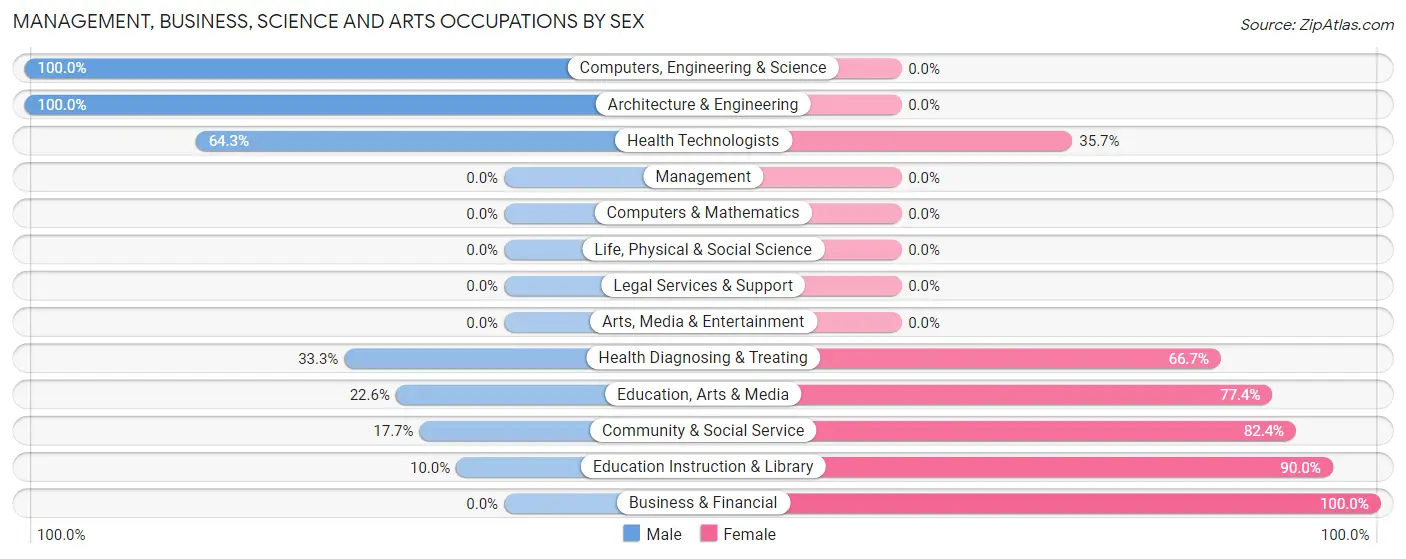
| Occupation | Male | Female |
| Management | 0 (0.0%) | 0 (0.0%) |
| Business & Financial | 0 (0.0%) | 7 (100.0%) |
| Computers, Engineering & Science | 4 (100.0%) | 0 (0.0%) |
| Computers & Mathematics | 0 (0.0%) | 0 (0.0%) |
| Architecture & Engineering | 4 (100.0%) | 0 (0.0%) |
| Life, Physical & Social Science | 0 (0.0%) | 0 (0.0%) |
| Community & Social Service | 9 (17.6%) | 42 (82.4%) |
| Education, Arts & Media | 7 (22.6%) | 24 (77.4%) |
| Legal Services & Support | 0 (0.0%) | 0 (0.0%) |
| Education Instruction & Library | 2 (10.0%) | 18 (90.0%) |
| Arts, Media & Entertainment | 0 (0.0%) | 0 (0.0%) |
| Health Diagnosing & Treating | 9 (33.3%) | 18 (66.7%) |
| Health Technologists | 9 (64.3%) | 5 (35.7%) |
| Total (Category) | 22 (24.7%) | 67 (75.3%) |
| Total (Overall) | 119 (47.4%) | 132 (52.6%) |
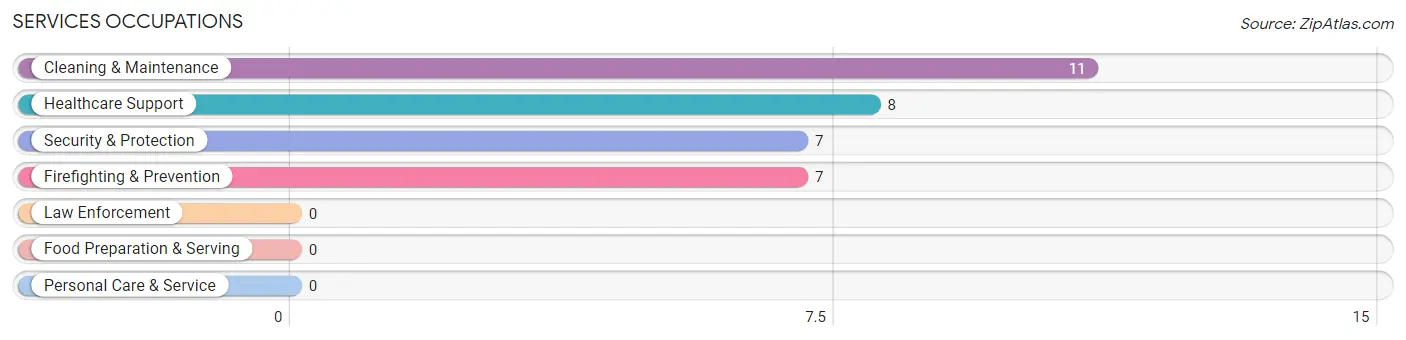
Services Occupations
The most common Services occupations in Groton are Cleaning & Maintenance (11 | 4.4%), Healthcare Support (8 | 3.2%), Security & Protection (7 | 2.8%), and Firefighting & Prevention (7 | 2.8%).
Services Occupations by Sex
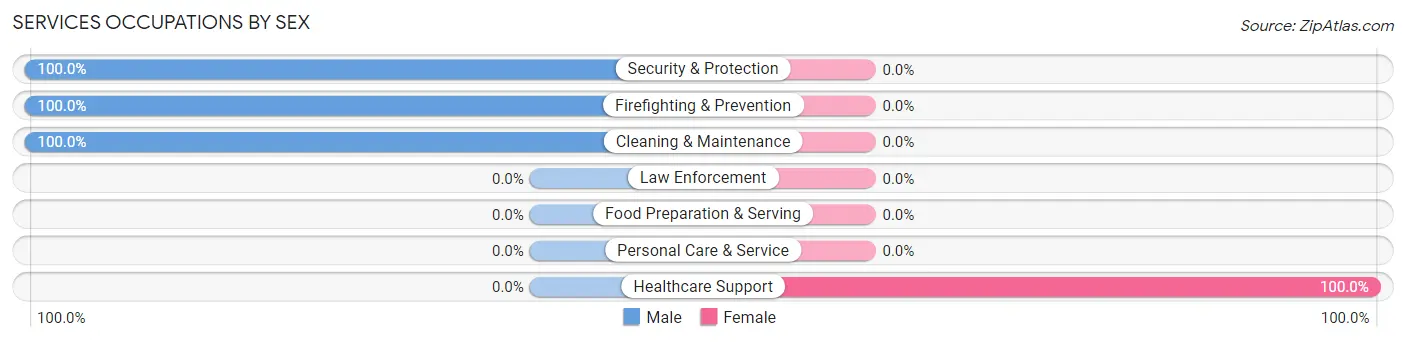
| Occupation | Male | Female |
| Healthcare Support | 0 (0.0%) | 8 (100.0%) |
| Security & Protection | 7 (100.0%) | 0 (0.0%) |
| Firefighting & Prevention | 7 (100.0%) | 0 (0.0%) |
| Law Enforcement | 0 (0.0%) | 0 (0.0%) |
| Food Preparation & Serving | 0 (0.0%) | 0 (0.0%) |
| Cleaning & Maintenance | 11 (100.0%) | 0 (0.0%) |
| Personal Care & Service | 0 (0.0%) | 0 (0.0%) |
| Total (Category) | 18 (69.2%) | 8 (30.8%) |
| Total (Overall) | 119 (47.4%) | 132 (52.6%) |
Sales and Office Occupations
The most common Sales and Office occupations in Groton are Office & Administration (24 | 9.6%), and Sales & Related (11 | 4.4%).

Sales and Office Occupations by Sex
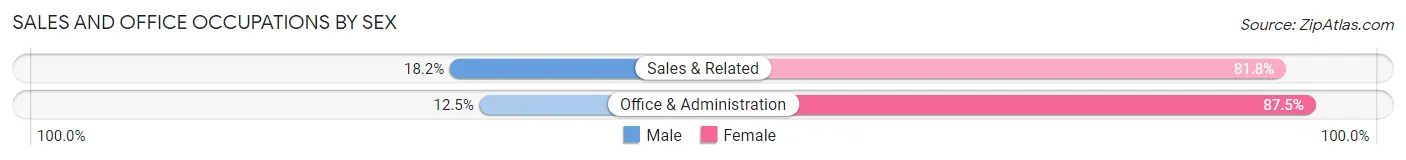
| Occupation | Male | Female |
| Sales & Related | 2 (18.2%) | 9 (81.8%) |
| Office & Administration | 3 (12.5%) | 21 (87.5%) |
| Total (Category) | 5 (14.3%) | 30 (85.7%) |
| Total (Overall) | 119 (47.4%) | 132 (52.6%) |
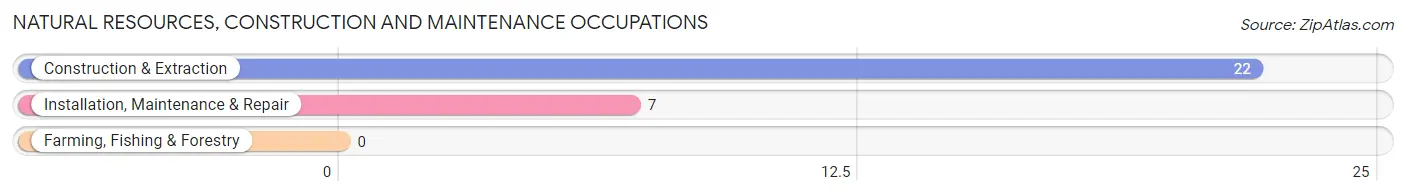
Natural Resources, Construction and Maintenance Occupations
The most common Natural Resources, Construction and Maintenance occupations in Groton are Construction & Extraction (22 | 8.8%), and Installation, Maintenance & Repair (7 | 2.8%).
Natural Resources, Construction and Maintenance Occupations by Sex
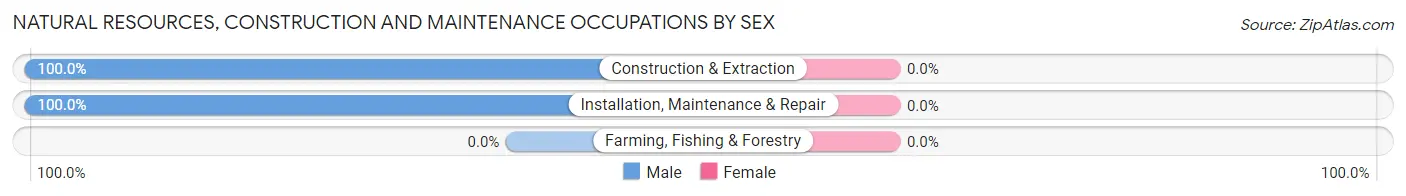
| Occupation | Male | Female |
| Farming, Fishing & Forestry | 0 (0.0%) | 0 (0.0%) |
| Construction & Extraction | 22 (100.0%) | 0 (0.0%) |
| Installation, Maintenance & Repair | 7 (100.0%) | 0 (0.0%) |
| Total (Category) | 29 (100.0%) | 0 (0.0%) |
| Total (Overall) | 119 (47.4%) | 132 (52.6%) |
Production, Transportation and Moving Occupations
The most common Production, Transportation and Moving occupations in Groton are Production (35 | 13.9%), Transportation (32 | 12.8%), and Material Moving (5 | 2.0%).
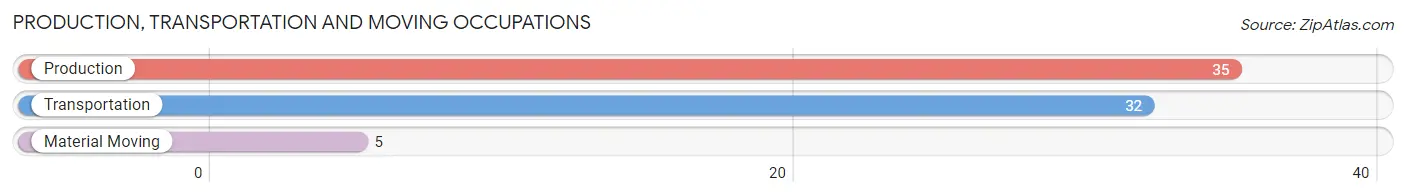
Production, Transportation and Moving Occupations by Sex
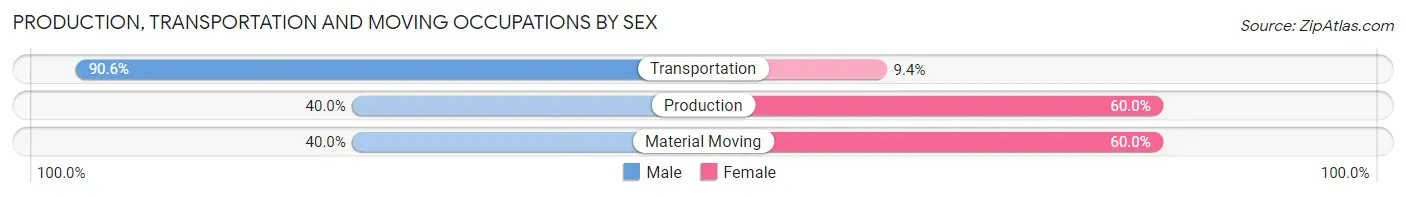
| Occupation | Male | Female |
| Production | 14 (40.0%) | 21 (60.0%) |
| Transportation | 29 (90.6%) | 3 (9.4%) |
| Material Moving | 2 (40.0%) | 3 (60.0%) |
| Total (Category) | 45 (62.5%) | 27 (37.5%) |
| Total (Overall) | 119 (47.4%) | 132 (52.6%) |
Employment Industries by Sex in Groton
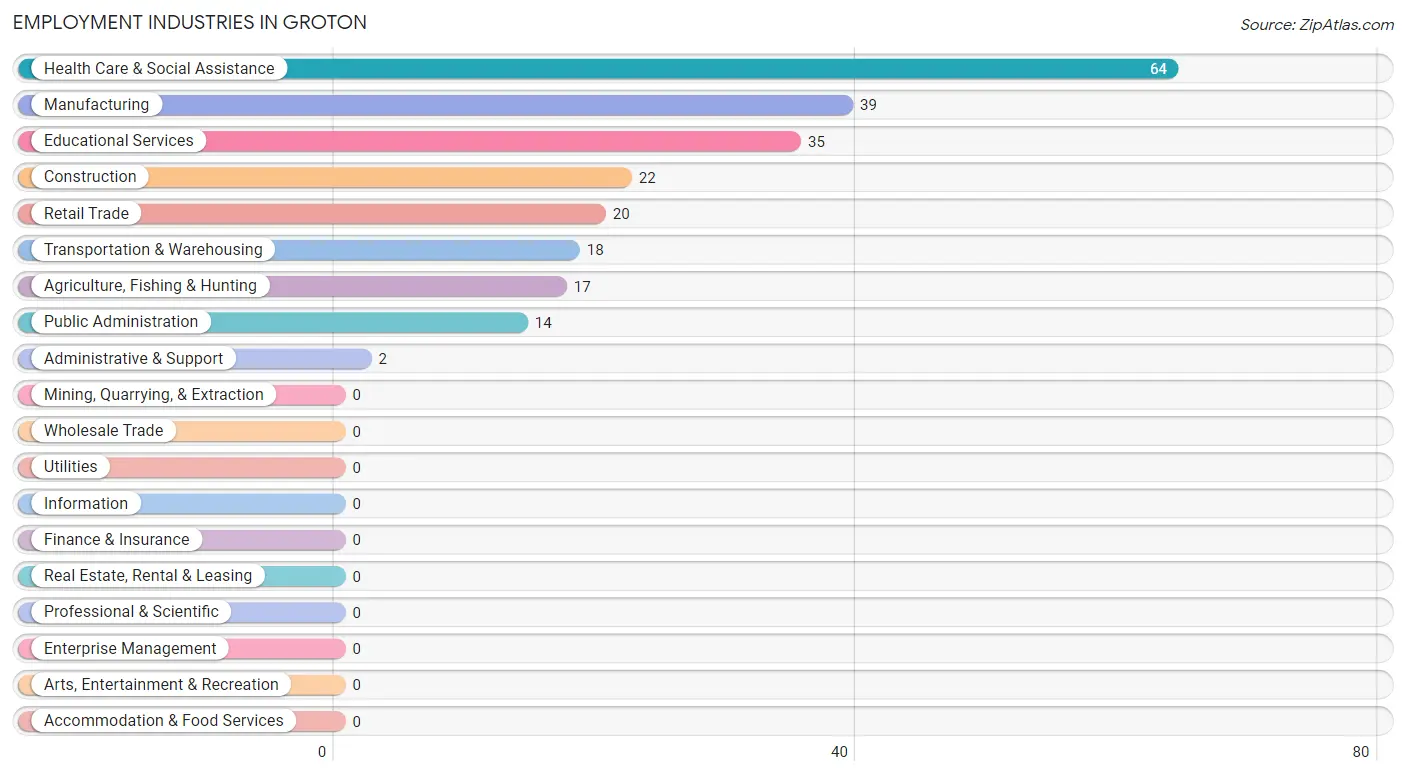
Employment Industries in Groton
The major employment industries in Groton include Health Care & Social Assistance (64 | 25.5%), Manufacturing (39 | 15.5%), Educational Services (35 | 13.9%), Construction (22 | 8.8%), and Retail Trade (20 | 8.0%).
Employment Industries by Sex in Groton
The Groton industries that see more men than women are Agriculture, Fishing & Hunting (100.0%), Construction (100.0%), and Administrative & Support (100.0%), whereas the industries that tend to have a higher number of women are Educational Services (94.3%), Retail Trade (75.0%), and Health Care & Social Assistance (75.0%).
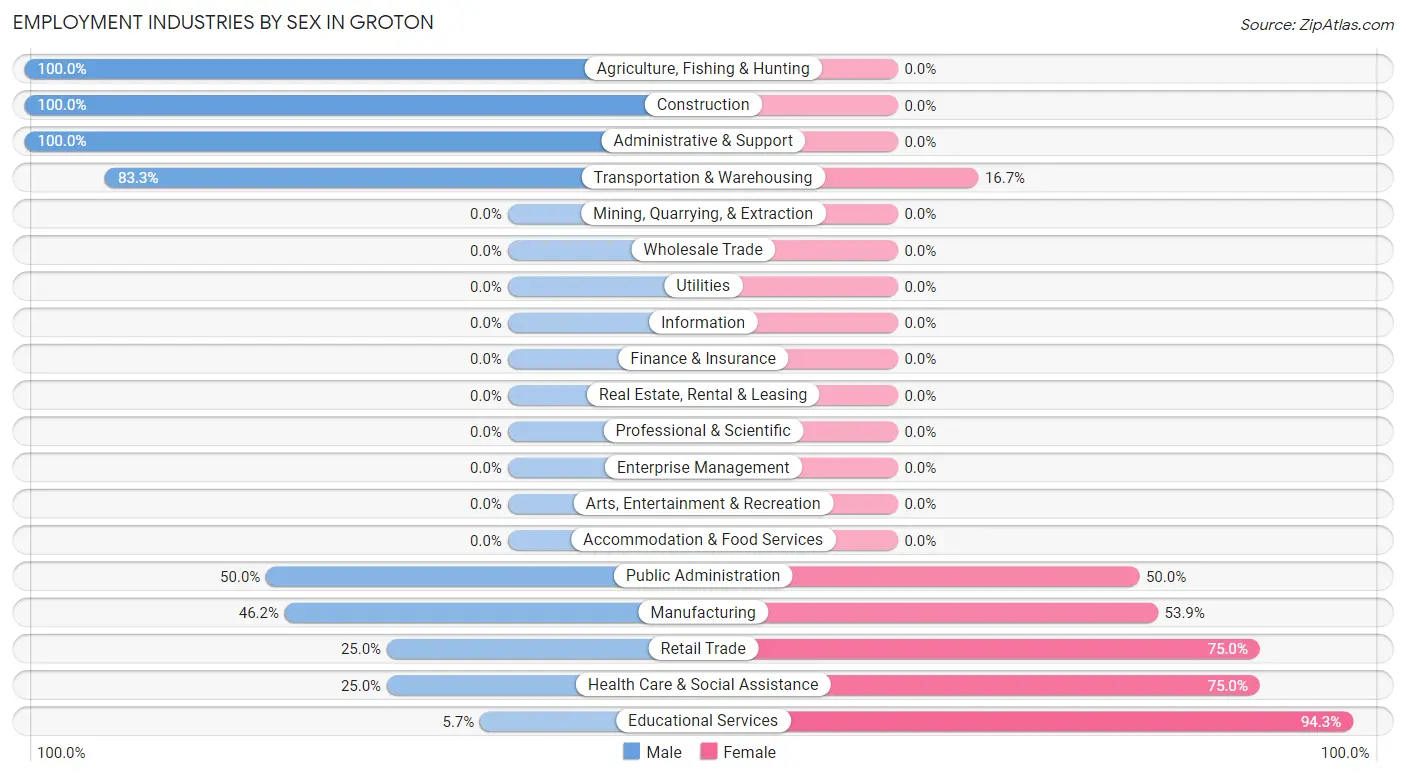
| Industry | Male | Female |
| Agriculture, Fishing & Hunting | 17 (100.0%) | 0 (0.0%) |
| Mining, Quarrying, & Extraction | 0 (0.0%) | 0 (0.0%) |
| Construction | 22 (100.0%) | 0 (0.0%) |
| Manufacturing | 18 (46.2%) | 21 (53.8%) |
| Wholesale Trade | 0 (0.0%) | 0 (0.0%) |
| Retail Trade | 5 (25.0%) | 15 (75.0%) |
| Transportation & Warehousing | 15 (83.3%) | 3 (16.7%) |
| Utilities | 0 (0.0%) | 0 (0.0%) |
| Information | 0 (0.0%) | 0 (0.0%) |
| Finance & Insurance | 0 (0.0%) | 0 (0.0%) |
| Real Estate, Rental & Leasing | 0 (0.0%) | 0 (0.0%) |
| Professional & Scientific | 0 (0.0%) | 0 (0.0%) |
| Enterprise Management | 0 (0.0%) | 0 (0.0%) |
| Administrative & Support | 2 (100.0%) | 0 (0.0%) |
| Educational Services | 2 (5.7%) | 33 (94.3%) |
| Health Care & Social Assistance | 16 (25.0%) | 48 (75.0%) |
| Arts, Entertainment & Recreation | 0 (0.0%) | 0 (0.0%) |
| Accommodation & Food Services | 0 (0.0%) | 0 (0.0%) |
| Public Administration | 7 (50.0%) | 7 (50.0%) |
| Total | 119 (47.4%) | 132 (52.6%) |
Education in Groton
School Enrollment in Groton
The most common levels of schooling among the 163 students in Groton are college / undergraduate (67 | 41.1%), high school (52 | 31.9%), and graduate / professional (15 | 9.2%).
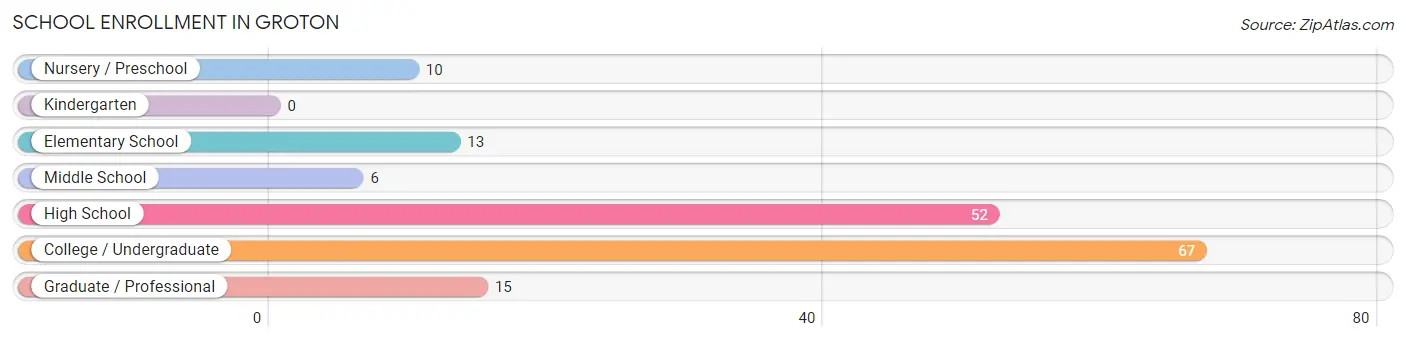
| School Level | # Students | % Students |
| Nursery / Preschool | 10 | 6.1% |
| Kindergarten | 0 | 0.0% |
| Elementary School | 13 | 8.0% |
| Middle School | 6 | 3.7% |
| High School | 52 | 31.9% |
| College / Undergraduate | 67 | 41.1% |
| Graduate / Professional | 15 | 9.2% |
| Total | 163 | 100.0% |
School Enrollment by Age by Funding Source in Groton
Out of a total of 163 students who are enrolled in schools in Groton, 43 (26.4%) attend a private institution, while the remaining 120 (73.6%) are enrolled in public schools. The age group of 25 to 34 year olds has the highest likelihood of being enrolled in private schools, with 12 (100.0% in the age bracket) enrolled. Conversely, the age group of 3 to 4 year olds has the lowest likelihood of being enrolled in a private school, with 4 (100.0% in the age bracket) attending a public institution.
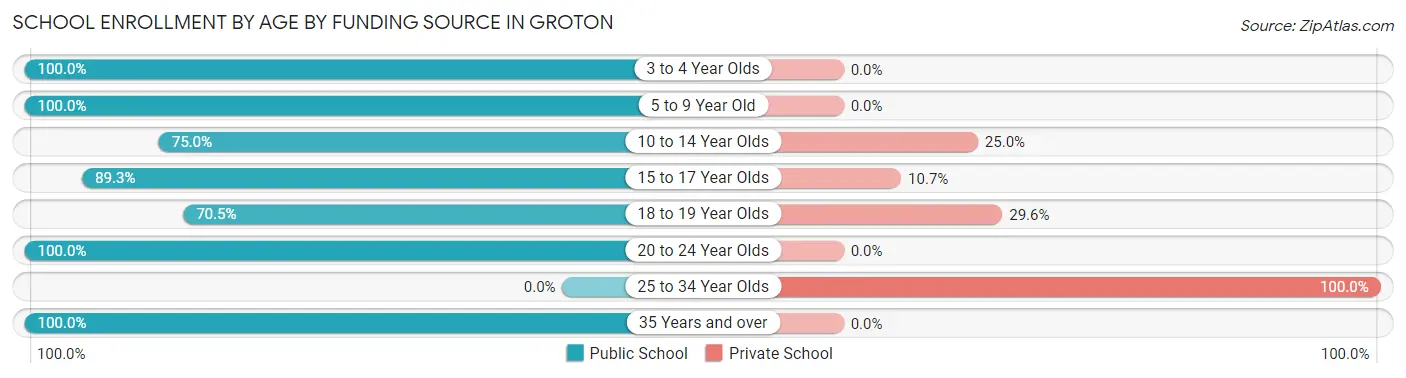
| Age Bracket | Public School | Private School |
| 3 to 4 Year Olds | 4 (100.0%) | 0 (0.0%) |
| 5 to 9 Year Old | 17 (100.0%) | 0 (0.0%) |
| 10 to 14 Year Olds | 6 (75.0%) | 2 (25.0%) |
| 15 to 17 Year Olds | 25 (89.3%) | 3 (10.7%) |
| 18 to 19 Year Olds | 62 (70.5%) | 26 (29.5%) |
| 20 to 24 Year Olds | 3 (100.0%) | 0 (0.0%) |
| 25 to 34 Year Olds | 0 (0.0%) | 12 (100.0%) |
| 35 Years and over | 3 (100.0%) | 0 (0.0%) |
| Total | 120 (73.6%) | 43 (26.4%) |
Educational Attainment by Field of Study in Groton
Engineering (24 | 20.0%), communications (24 | 20.0%), liberal arts & history (17 | 14.2%), business (15 | 12.5%), and education (15 | 12.5%) are the most common fields of study among 120 individuals in Groton who have obtained a bachelor's degree or higher.
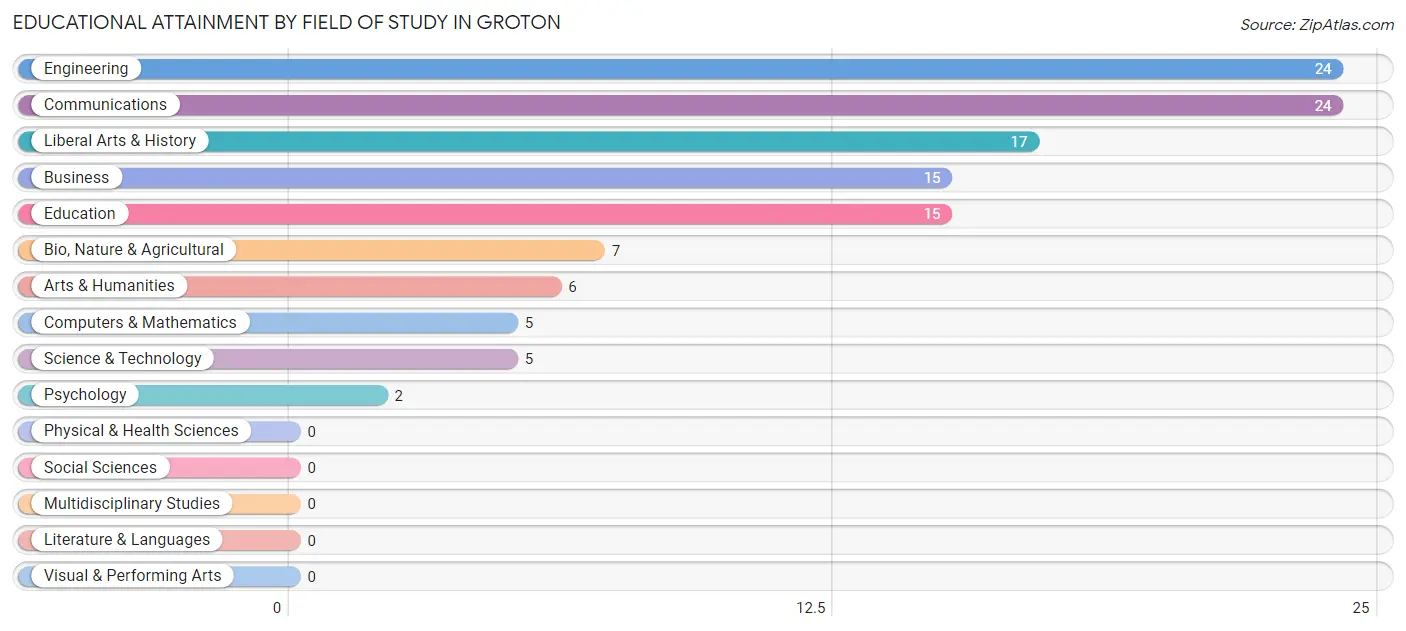
| Field of Study | # Graduates | % Graduates |
| Computers & Mathematics | 5 | 4.2% |
| Bio, Nature & Agricultural | 7 | 5.8% |
| Physical & Health Sciences | 0 | 0.0% |
| Psychology | 2 | 1.7% |
| Social Sciences | 0 | 0.0% |
| Engineering | 24 | 20.0% |
| Multidisciplinary Studies | 0 | 0.0% |
| Science & Technology | 5 | 4.2% |
| Business | 15 | 12.5% |
| Education | 15 | 12.5% |
| Literature & Languages | 0 | 0.0% |
| Liberal Arts & History | 17 | 14.2% |
| Visual & Performing Arts | 0 | 0.0% |
| Communications | 24 | 20.0% |
| Arts & Humanities | 6 | 5.0% |
| Total | 120 | 100.0% |
Transportation & Commute in Groton
Vehicle Availability by Sex in Groton
The most prevalent vehicle ownership categories in Groton are males with 2 vehicles (65, accounting for 54.6%) and females with 2 vehicles (88, making up 49.2%).
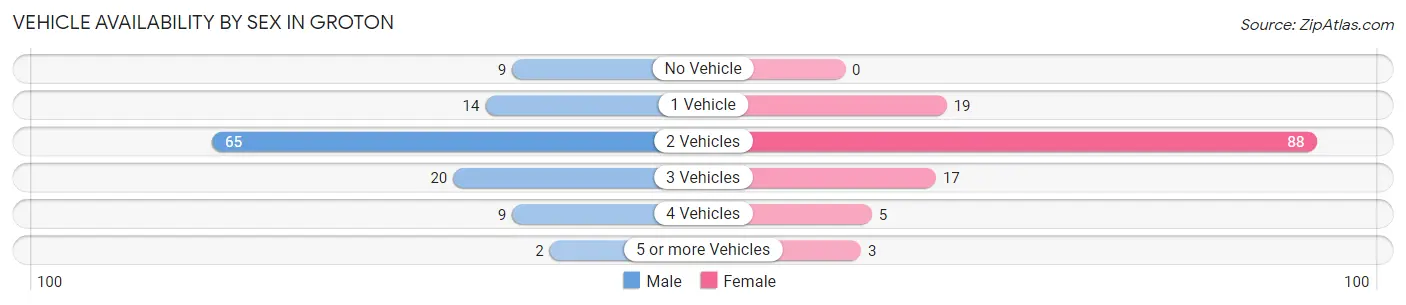
| Vehicles Available | Male | Female |
| No Vehicle | 9 (7.6%) | 0 (0.0%) |
| 1 Vehicle | 14 (11.8%) | 19 (14.4%) |
| 2 Vehicles | 65 (54.6%) | 88 (66.7%) |
| 3 Vehicles | 20 (16.8%) | 17 (12.9%) |
| 4 Vehicles | 9 (7.6%) | 5 (3.8%) |
| 5 or more Vehicles | 2 (1.7%) | 3 (2.3%) |
| Total | 119 (100.0%) | 132 (100.0%) |
Commute Time in Groton
The most frequently occuring commute durations in Groton are 30 to 34 minutes (45 commuters, 19.3%), 40 to 44 minutes (42 commuters, 18.0%), and 20 to 24 minutes (28 commuters, 12.0%).
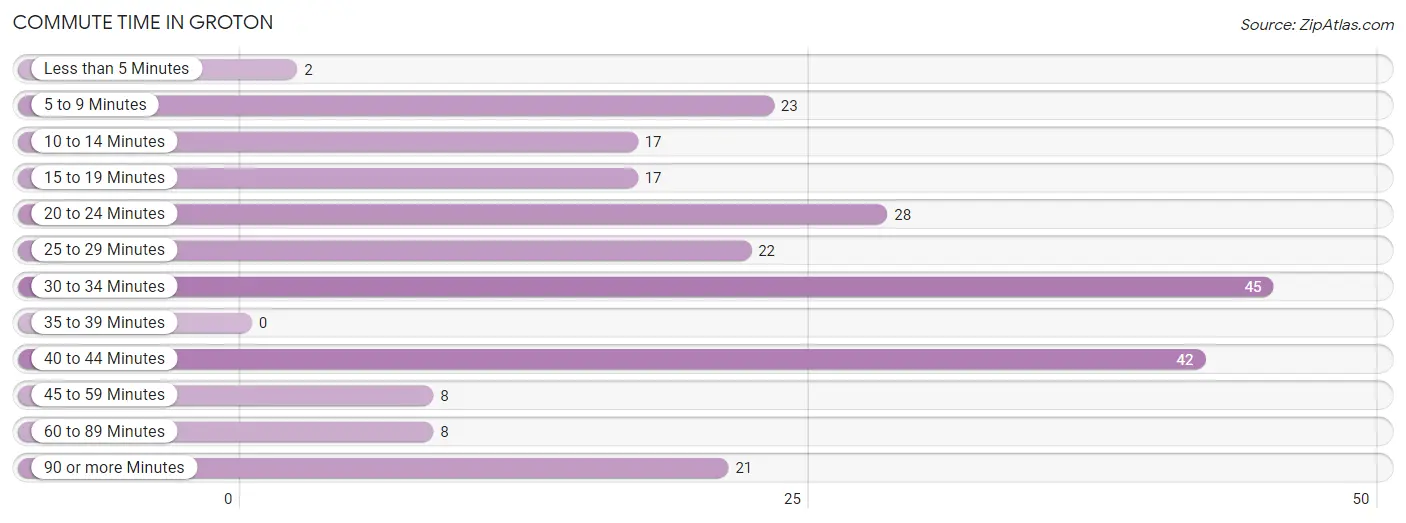
| Commute Time | # Commuters | % Commuters |
| Less than 5 Minutes | 2 | 0.9% |
| 5 to 9 Minutes | 23 | 9.9% |
| 10 to 14 Minutes | 17 | 7.3% |
| 15 to 19 Minutes | 17 | 7.3% |
| 20 to 24 Minutes | 28 | 12.0% |
| 25 to 29 Minutes | 22 | 9.4% |
| 30 to 34 Minutes | 45 | 19.3% |
| 35 to 39 Minutes | 0 | 0.0% |
| 40 to 44 Minutes | 42 | 18.0% |
| 45 to 59 Minutes | 8 | 3.4% |
| 60 to 89 Minutes | 8 | 3.4% |
| 90 or more Minutes | 21 | 9.0% |
Commute Time by Sex in Groton
The most common commute times in Groton are 30 to 34 minutes (26 commuters, 24.3%) for males and 40 to 44 minutes (24 commuters, 19.1%) for females.
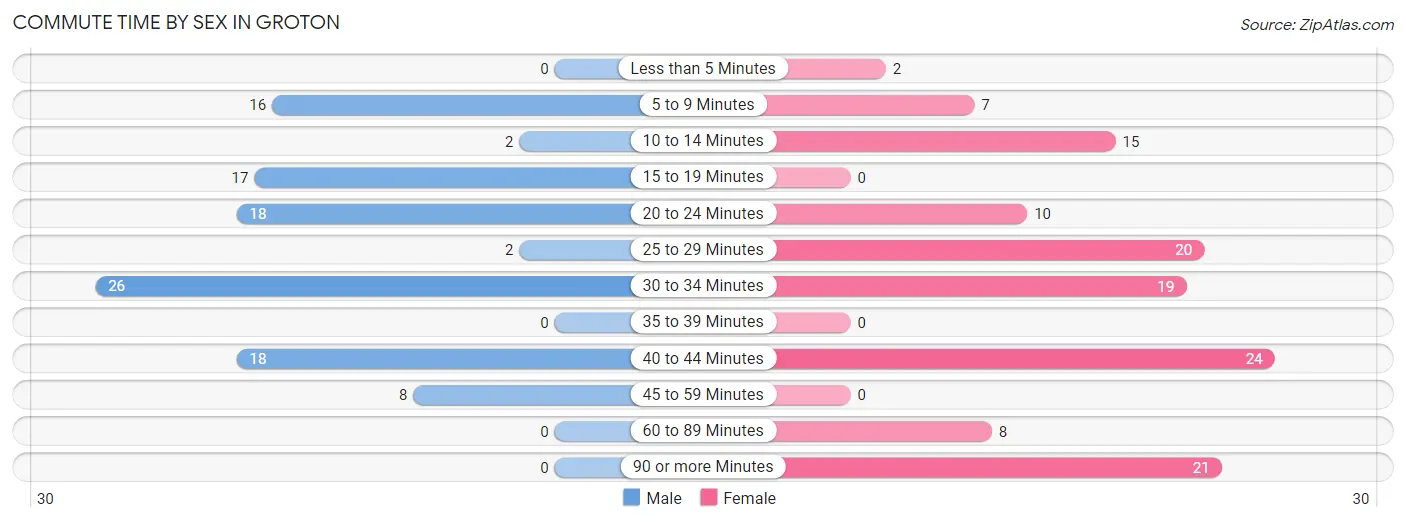
| Commute Time | Male | Female |
| Less than 5 Minutes | 0 (0.0%) | 2 (1.6%) |
| 5 to 9 Minutes | 16 (14.9%) | 7 (5.6%) |
| 10 to 14 Minutes | 2 (1.9%) | 15 (11.9%) |
| 15 to 19 Minutes | 17 (15.9%) | 0 (0.0%) |
| 20 to 24 Minutes | 18 (16.8%) | 10 (7.9%) |
| 25 to 29 Minutes | 2 (1.9%) | 20 (15.9%) |
| 30 to 34 Minutes | 26 (24.3%) | 19 (15.1%) |
| 35 to 39 Minutes | 0 (0.0%) | 0 (0.0%) |
| 40 to 44 Minutes | 18 (16.8%) | 24 (19.1%) |
| 45 to 59 Minutes | 8 (7.5%) | 0 (0.0%) |
| 60 to 89 Minutes | 0 (0.0%) | 8 (6.4%) |
| 90 or more Minutes | 0 (0.0%) | 21 (16.7%) |
Time of Departure to Work by Sex in Groton
The most frequent times of departure to work in Groton are 5:30 AM to 5:59 AM (34, 31.8%) for males and 7:30 AM to 7:59 AM (39, 30.9%) for females.
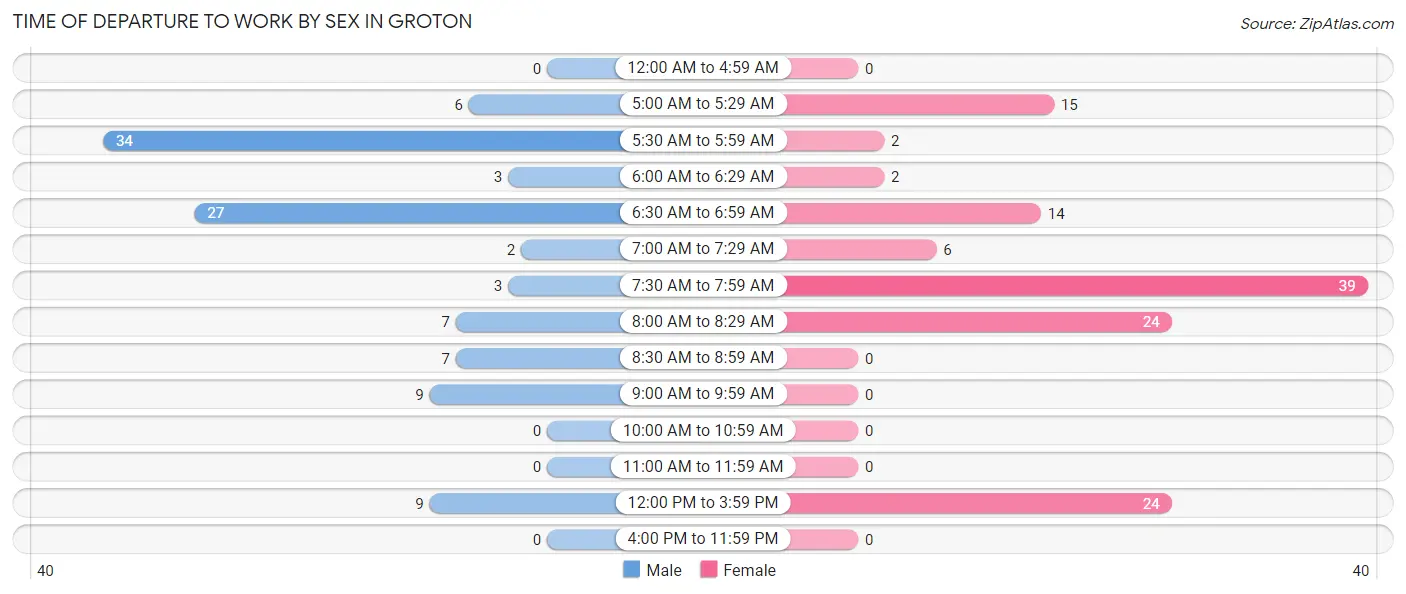
| Time of Departure | Male | Female |
| 12:00 AM to 4:59 AM | 0 (0.0%) | 0 (0.0%) |
| 5:00 AM to 5:29 AM | 6 (5.6%) | 15 (11.9%) |
| 5:30 AM to 5:59 AM | 34 (31.8%) | 2 (1.6%) |
| 6:00 AM to 6:29 AM | 3 (2.8%) | 2 (1.6%) |
| 6:30 AM to 6:59 AM | 27 (25.2%) | 14 (11.1%) |
| 7:00 AM to 7:29 AM | 2 (1.9%) | 6 (4.8%) |
| 7:30 AM to 7:59 AM | 3 (2.8%) | 39 (30.9%) |
| 8:00 AM to 8:29 AM | 7 (6.5%) | 24 (19.1%) |
| 8:30 AM to 8:59 AM | 7 (6.5%) | 0 (0.0%) |
| 9:00 AM to 9:59 AM | 9 (8.4%) | 0 (0.0%) |
| 10:00 AM to 10:59 AM | 0 (0.0%) | 0 (0.0%) |
| 11:00 AM to 11:59 AM | 0 (0.0%) | 0 (0.0%) |
| 12:00 PM to 3:59 PM | 9 (8.4%) | 24 (19.1%) |
| 4:00 PM to 11:59 PM | 0 (0.0%) | 0 (0.0%) |
| Total | 107 (100.0%) | 126 (100.0%) |
Housing Occupancy in Groton
Occupancy by Ownership in Groton
Of the total 207 dwellings in Groton, owner-occupied units account for 160 (77.3%), while renter-occupied units make up 47 (22.7%).
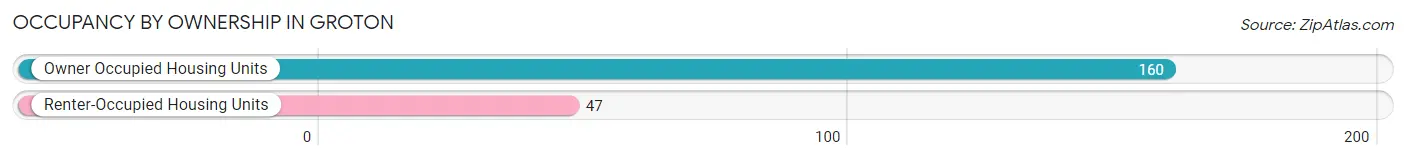
| Occupancy | # Housing Units | % Housing Units |
| Owner Occupied Housing Units | 160 | 77.3% |
| Renter-Occupied Housing Units | 47 | 22.7% |
| Total Occupied Housing Units | 207 | 100.0% |
Occupancy by Household Size in Groton
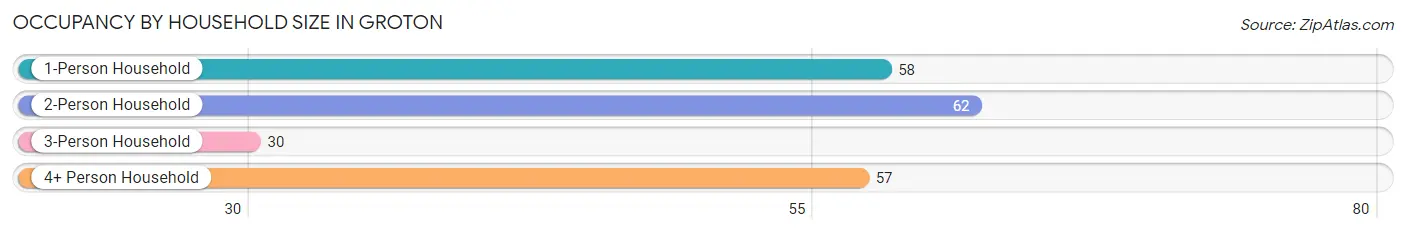
| Household Size | # Housing Units | % Housing Units |
| 1-Person Household | 58 | 28.0% |
| 2-Person Household | 62 | 29.9% |
| 3-Person Household | 30 | 14.5% |
| 4+ Person Household | 57 | 27.5% |
| Total Housing Units | 207 | 100.0% |
Occupancy by Ownership by Household Size in Groton
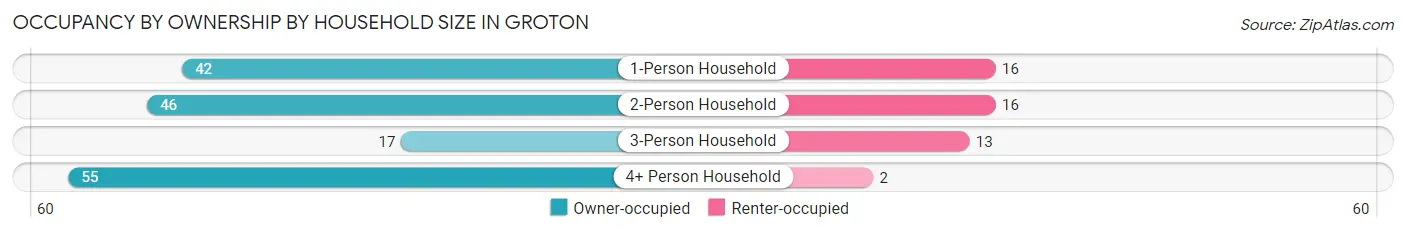
| Household Size | Owner-occupied | Renter-occupied |
| 1-Person Household | 42 (72.4%) | 16 (27.6%) |
| 2-Person Household | 46 (74.2%) | 16 (25.8%) |
| 3-Person Household | 17 (56.7%) | 13 (43.3%) |
| 4+ Person Household | 55 (96.5%) | 2 (3.5%) |
| Total Housing Units | 160 (77.3%) | 47 (22.7%) |
Occupancy by Educational Attainment in Groton
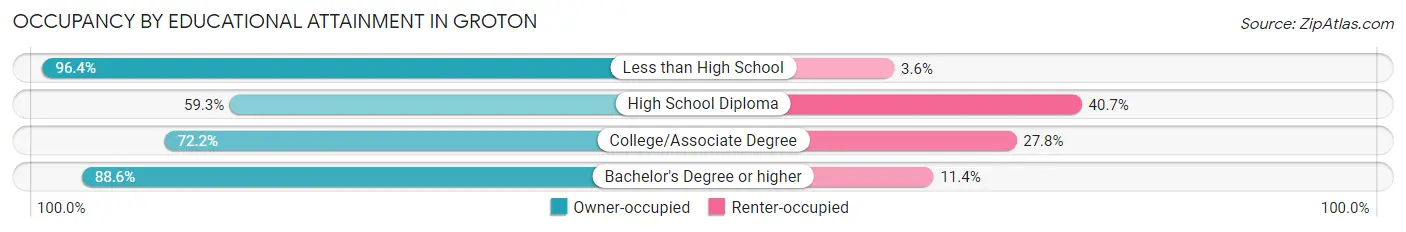
| Household Size | Owner-occupied | Renter-occupied |
| Less than High School | 27 (96.4%) | 1 (3.6%) |
| High School Diploma | 16 (59.3%) | 11 (40.7%) |
| College/Associate Degree | 78 (72.2%) | 30 (27.8%) |
| Bachelor's Degree or higher | 39 (88.6%) | 5 (11.4%) |
Occupancy by Age of Householder in Groton
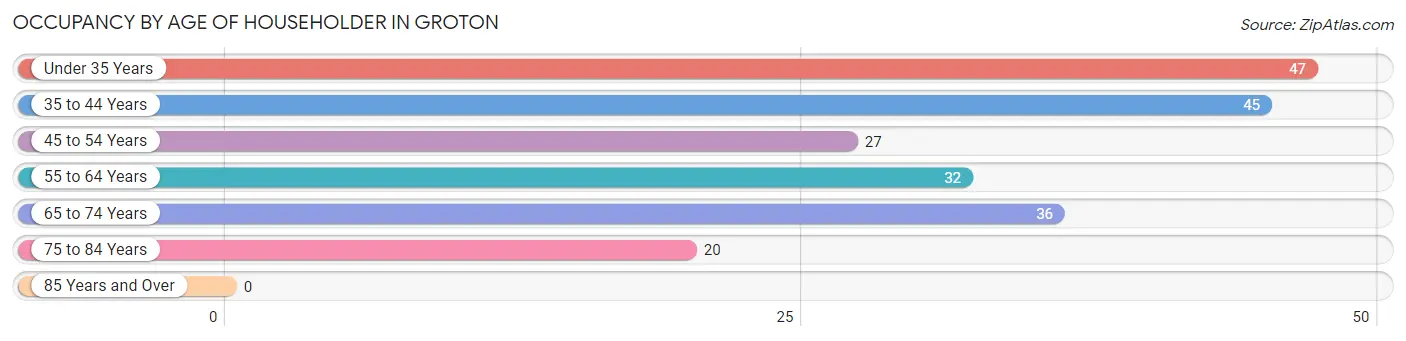
| Age Bracket | # Households | % Households |
| Under 35 Years | 47 | 22.7% |
| 35 to 44 Years | 45 | 21.7% |
| 45 to 54 Years | 27 | 13.0% |
| 55 to 64 Years | 32 | 15.5% |
| 65 to 74 Years | 36 | 17.4% |
| 75 to 84 Years | 20 | 9.7% |
| 85 Years and Over | 0 | 0.0% |
| Total | 207 | 100.0% |
Housing Finances in Groton
Median Income by Occupancy in Groton
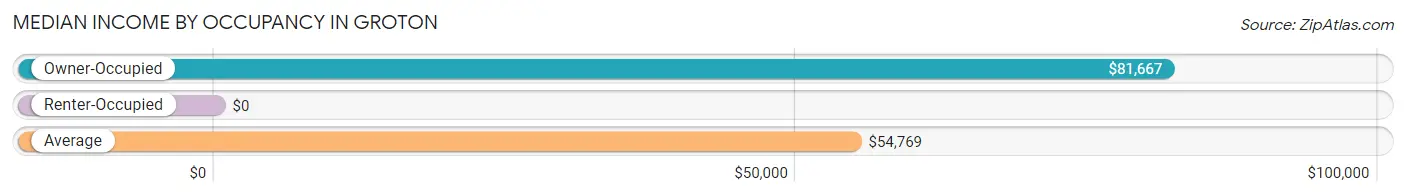
| Occupancy Type | # Households | Median Income |
| Owner-Occupied | 160 (77.3%) | $81,667 |
| Renter-Occupied | 47 (22.7%) | $0 |
| Average | 207 (100.0%) | $54,769 |
Occupancy by Householder Income Bracket in Groton
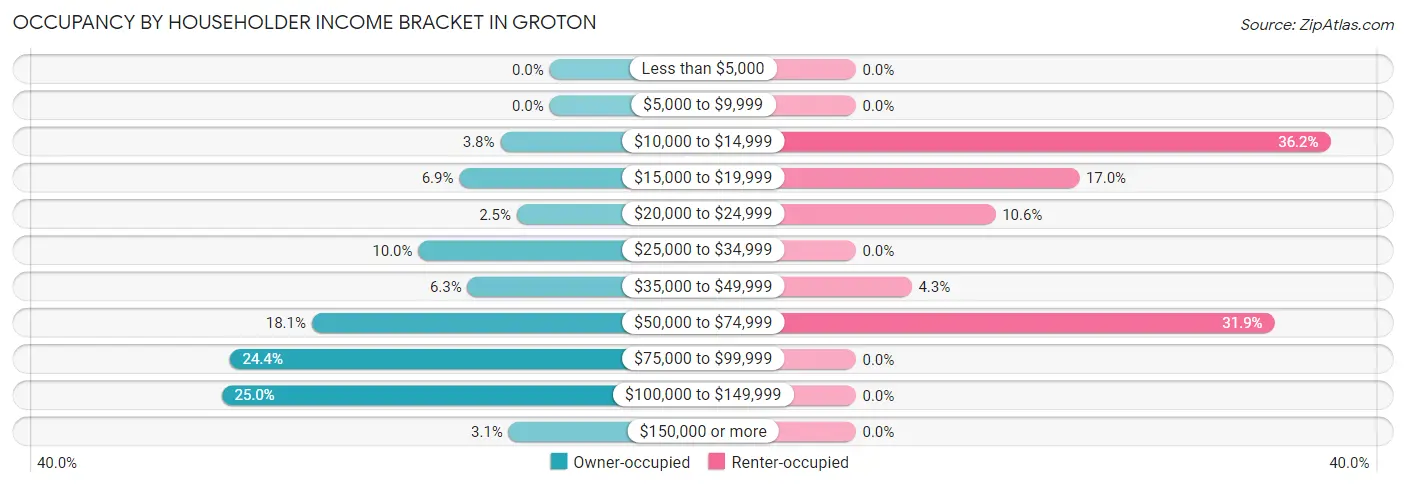
| Income Bracket | Owner-occupied | Renter-occupied |
| Less than $5,000 | 0 (0.0%) | 0 (0.0%) |
| $5,000 to $9,999 | 0 (0.0%) | 0 (0.0%) |
| $10,000 to $14,999 | 6 (3.7%) | 17 (36.2%) |
| $15,000 to $19,999 | 11 (6.9%) | 8 (17.0%) |
| $20,000 to $24,999 | 4 (2.5%) | 5 (10.6%) |
| $25,000 to $34,999 | 16 (10.0%) | 0 (0.0%) |
| $35,000 to $49,999 | 10 (6.2%) | 2 (4.3%) |
| $50,000 to $74,999 | 29 (18.1%) | 15 (31.9%) |
| $75,000 to $99,999 | 39 (24.4%) | 0 (0.0%) |
| $100,000 to $149,999 | 40 (25.0%) | 0 (0.0%) |
| $150,000 or more | 5 (3.1%) | 0 (0.0%) |
| Total | 160 (100.0%) | 47 (100.0%) |
Monthly Housing Cost Tiers in Groton
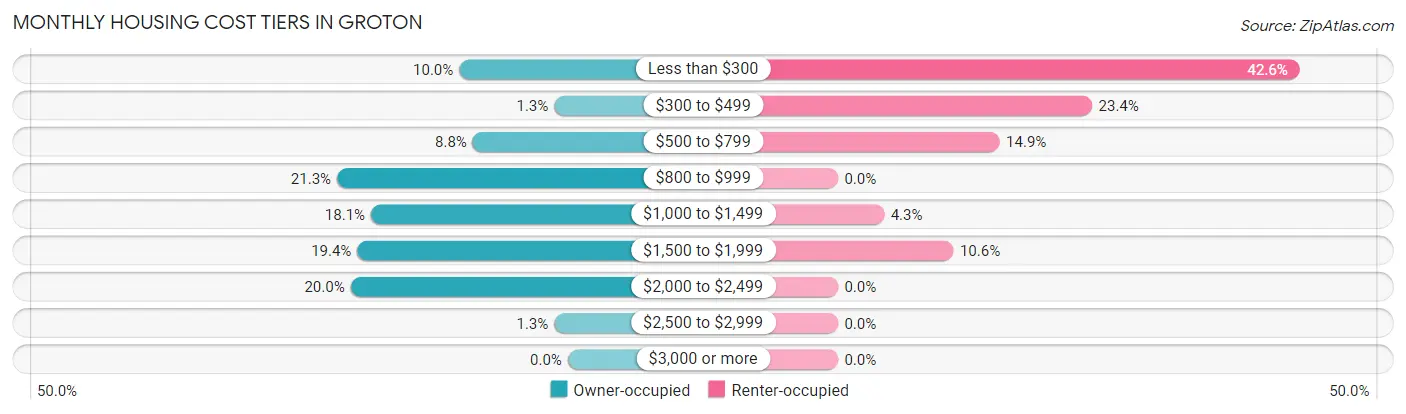
| Monthly Cost | Owner-occupied | Renter-occupied |
| Less than $300 | 16 (10.0%) | 20 (42.5%) |
| $300 to $499 | 2 (1.3%) | 11 (23.4%) |
| $500 to $799 | 14 (8.7%) | 7 (14.9%) |
| $800 to $999 | 34 (21.2%) | 0 (0.0%) |
| $1,000 to $1,499 | 29 (18.1%) | 2 (4.3%) |
| $1,500 to $1,999 | 31 (19.4%) | 5 (10.6%) |
| $2,000 to $2,499 | 32 (20.0%) | 0 (0.0%) |
| $2,500 to $2,999 | 2 (1.3%) | 0 (0.0%) |
| $3,000 or more | 0 (0.0%) | 0 (0.0%) |
| Total | 160 (100.0%) | 47 (100.0%) |
Physical Housing Characteristics in Groton
Housing Structures in Groton
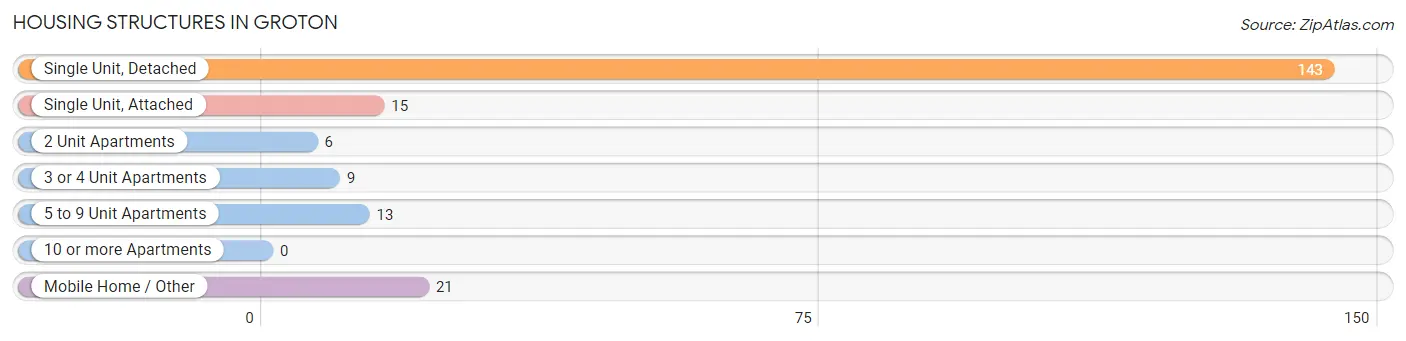
| Structure Type | # Housing Units | % Housing Units |
| Single Unit, Detached | 143 | 69.1% |
| Single Unit, Attached | 15 | 7.2% |
| 2 Unit Apartments | 6 | 2.9% |
| 3 or 4 Unit Apartments | 9 | 4.3% |
| 5 to 9 Unit Apartments | 13 | 6.3% |
| 10 or more Apartments | 0 | 0.0% |
| Mobile Home / Other | 21 | 10.1% |
| Total | 207 | 100.0% |
Housing Structures by Occupancy in Groton
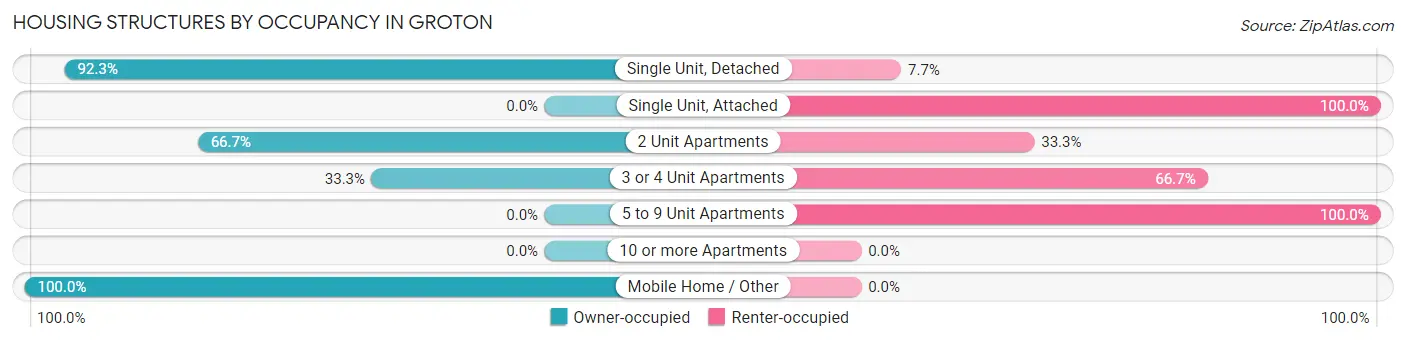
| Structure Type | Owner-occupied | Renter-occupied |
| Single Unit, Detached | 132 (92.3%) | 11 (7.7%) |
| Single Unit, Attached | 0 (0.0%) | 15 (100.0%) |
| 2 Unit Apartments | 4 (66.7%) | 2 (33.3%) |
| 3 or 4 Unit Apartments | 3 (33.3%) | 6 (66.7%) |
| 5 to 9 Unit Apartments | 0 (0.0%) | 13 (100.0%) |
| 10 or more Apartments | 0 (0.0%) | 0 (0.0%) |
| Mobile Home / Other | 21 (100.0%) | 0 (0.0%) |
| Total | 160 (77.3%) | 47 (22.7%) |
Housing Structures by Number of Rooms in Groton
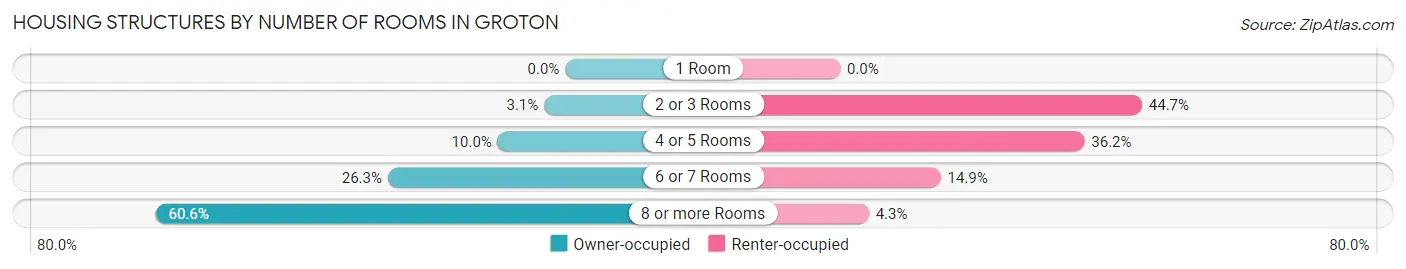
| Number of Rooms | Owner-occupied | Renter-occupied |
| 1 Room | 0 (0.0%) | 0 (0.0%) |
| 2 or 3 Rooms | 5 (3.1%) | 21 (44.7%) |
| 4 or 5 Rooms | 16 (10.0%) | 17 (36.2%) |
| 6 or 7 Rooms | 42 (26.3%) | 7 (14.9%) |
| 8 or more Rooms | 97 (60.6%) | 2 (4.3%) |
| Total | 160 (100.0%) | 47 (100.0%) |
Housing Structure by Heating Type in Groton
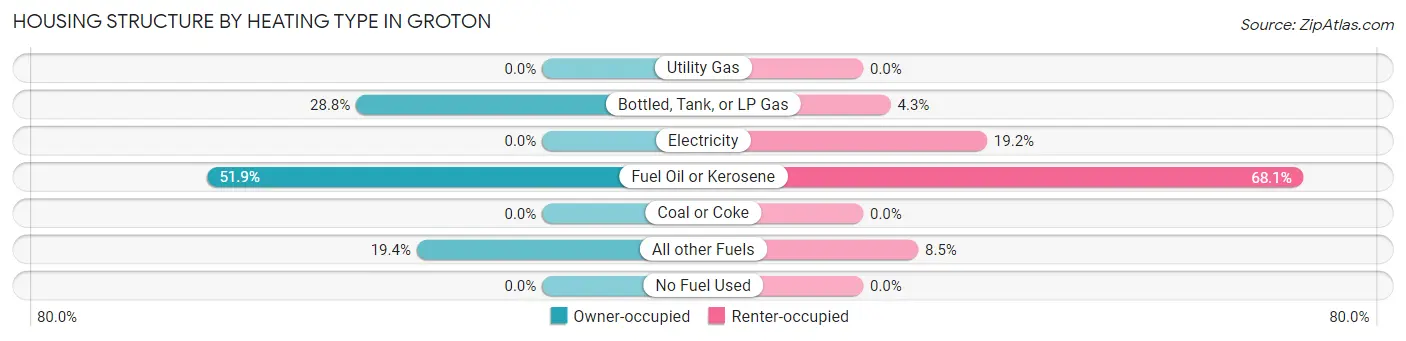
| Heating Type | Owner-occupied | Renter-occupied |
| Utility Gas | 0 (0.0%) | 0 (0.0%) |
| Bottled, Tank, or LP Gas | 46 (28.7%) | 2 (4.3%) |
| Electricity | 0 (0.0%) | 9 (19.2%) |
| Fuel Oil or Kerosene | 83 (51.9%) | 32 (68.1%) |
| Coal or Coke | 0 (0.0%) | 0 (0.0%) |
| All other Fuels | 31 (19.4%) | 4 (8.5%) |
| No Fuel Used | 0 (0.0%) | 0 (0.0%) |
| Total | 160 (100.0%) | 47 (100.0%) |
Household Vehicle Usage in Groton
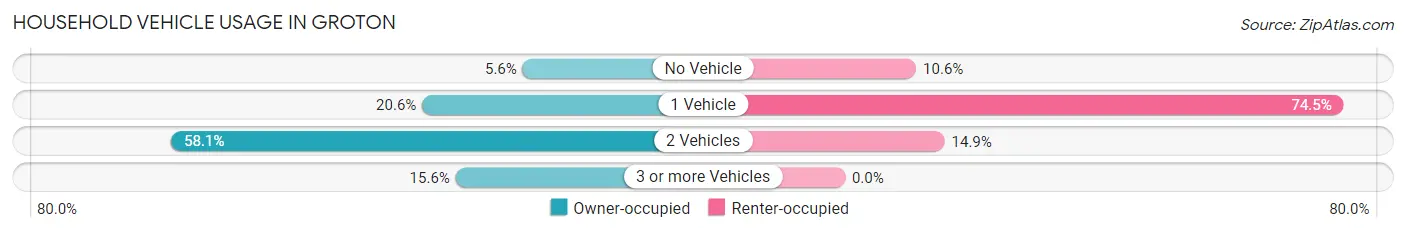
| Vehicles per Household | Owner-occupied | Renter-occupied |
| No Vehicle | 9 (5.6%) | 5 (10.6%) |
| 1 Vehicle | 33 (20.6%) | 35 (74.5%) |
| 2 Vehicles | 93 (58.1%) | 7 (14.9%) |
| 3 or more Vehicles | 25 (15.6%) | 0 (0.0%) |
| Total | 160 (100.0%) | 47 (100.0%) |
Real Estate & Mortgages in Groton
Real Estate and Mortgage Overview in Groton
| Characteristic | Without Mortgage | With Mortgage |
| Housing Units | 57 | 103 |
| Median Property Value | $111,400 | $199,500 |
| Median Household Income | $52,969 | $5 |
| Monthly Housing Costs | $725 | $0 |
| Real Estate Taxes | $1,875 | $34 |
Property Value by Mortgage Status in Groton
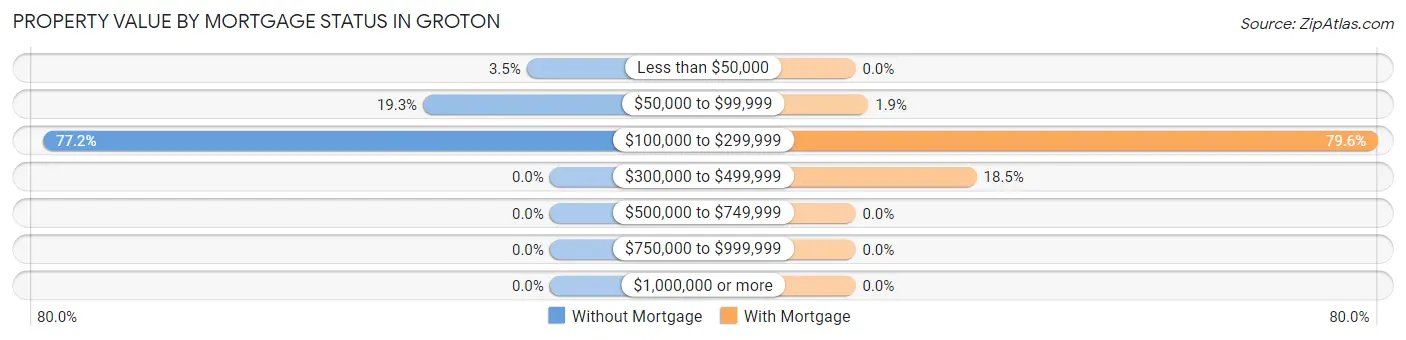
| Property Value | Without Mortgage | With Mortgage |
| Less than $50,000 | 2 (3.5%) | 0 (0.0%) |
| $50,000 to $99,999 | 11 (19.3%) | 2 (1.9%) |
| $100,000 to $299,999 | 44 (77.2%) | 82 (79.6%) |
| $300,000 to $499,999 | 0 (0.0%) | 19 (18.4%) |
| $500,000 to $749,999 | 0 (0.0%) | 0 (0.0%) |
| $750,000 to $999,999 | 0 (0.0%) | 0 (0.0%) |
| $1,000,000 or more | 0 (0.0%) | 0 (0.0%) |
| Total | 57 (100.0%) | 103 (100.0%) |
Household Income by Mortgage Status in Groton
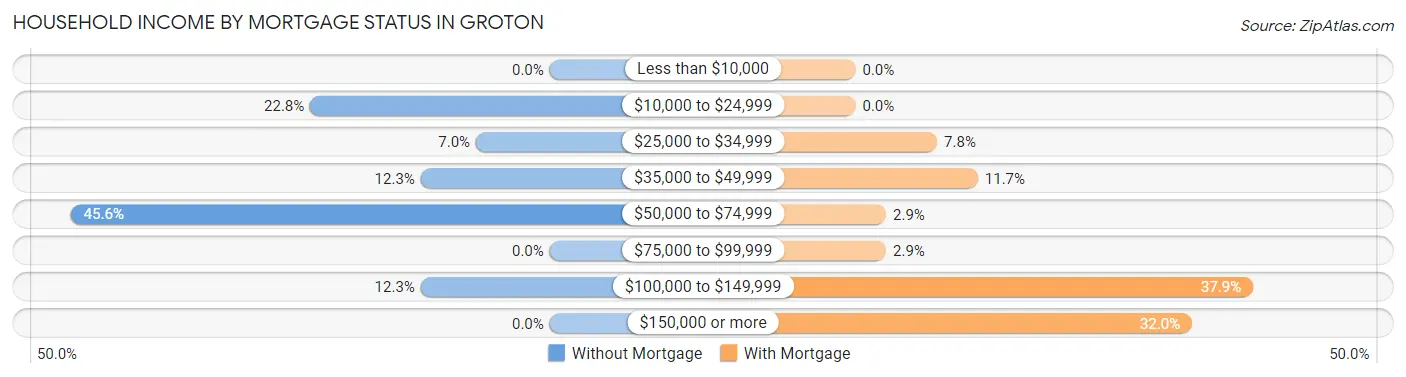
| Household Income | Without Mortgage | With Mortgage |
| Less than $10,000 | 0 (0.0%) | 0 (0.0%) |
| $10,000 to $24,999 | 13 (22.8%) | 0 (0.0%) |
| $25,000 to $34,999 | 4 (7.0%) | 8 (7.8%) |
| $35,000 to $49,999 | 7 (12.3%) | 12 (11.7%) |
| $50,000 to $74,999 | 26 (45.6%) | 3 (2.9%) |
| $75,000 to $99,999 | 0 (0.0%) | 3 (2.9%) |
| $100,000 to $149,999 | 7 (12.3%) | 39 (37.9%) |
| $150,000 or more | 0 (0.0%) | 33 (32.0%) |
| Total | 57 (100.0%) | 103 (100.0%) |
Property Value to Household Income Ratio in Groton
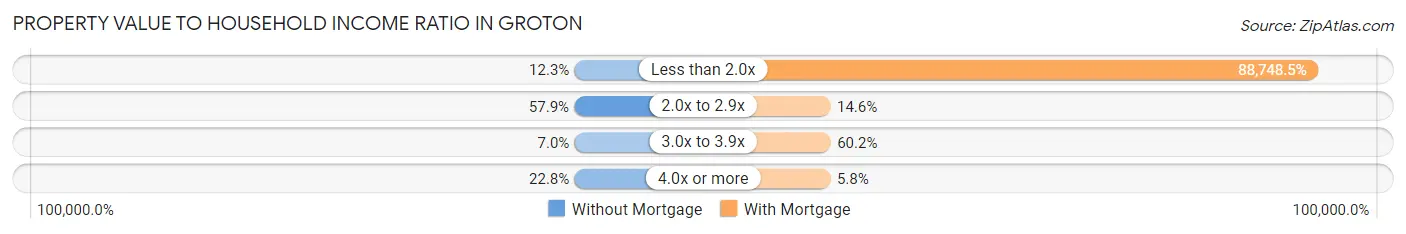
| Value-to-Income Ratio | Without Mortgage | With Mortgage |
| Less than 2.0x | 7 (12.3%) | 91,411 (88,748.5%) |
| 2.0x to 2.9x | 33 (57.9%) | 15 (14.6%) |
| 3.0x to 3.9x | 4 (7.0%) | 62 (60.2%) |
| 4.0x or more | 13 (22.8%) | 6 (5.8%) |
| Total | 57 (100.0%) | 103 (100.0%) |
Real Estate Taxes by Mortgage Status in Groton
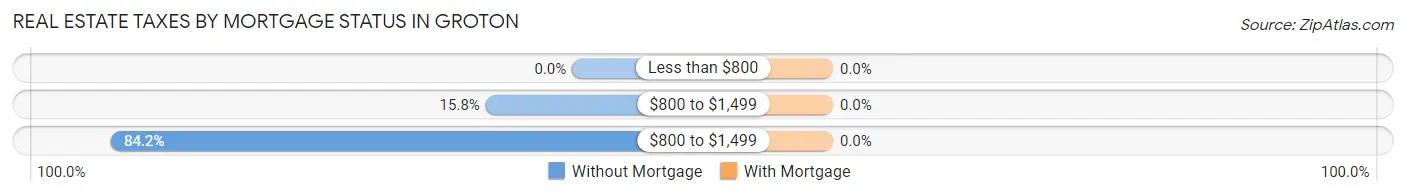
| Property Taxes | Without Mortgage | With Mortgage |
| Less than $800 | 0 (0.0%) | 0 (0.0%) |
| $800 to $1,499 | 9 (15.8%) | 0 (0.0%) |
| $800 to $1,499 | 48 (84.2%) | 0 (0.0%) |
| Total | 57 (100.0%) | 103 (100.0%) |
Health & Disability in Groton
Health Insurance Coverage by Age in Groton
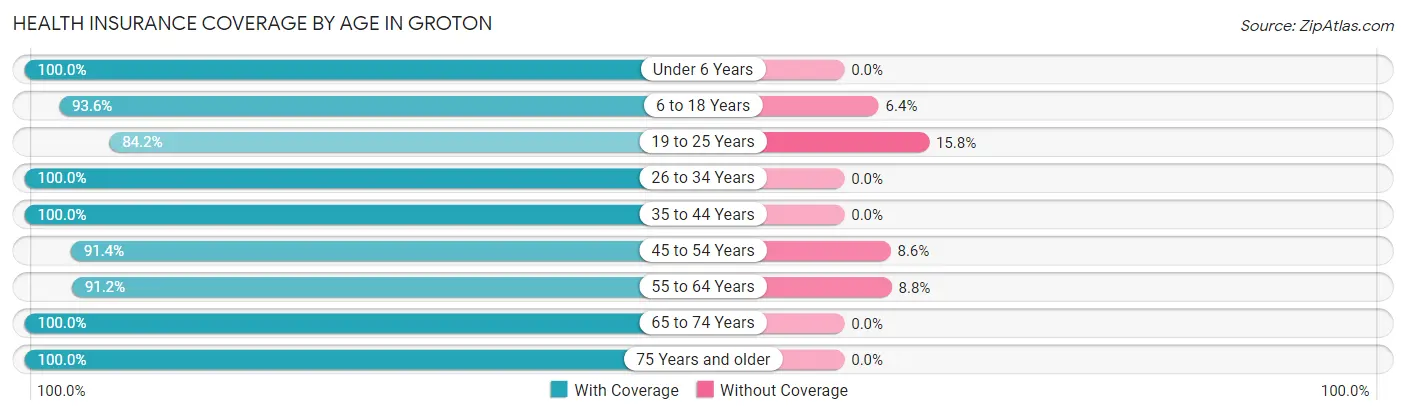
| Age Bracket | With Coverage | Without Coverage |
| Under 6 Years | 27 (100.0%) | 0 (0.0%) |
| 6 to 18 Years | 73 (93.6%) | 5 (6.4%) |
| 19 to 25 Years | 112 (84.2%) | 21 (15.8%) |
| 26 to 34 Years | 81 (100.0%) | 0 (0.0%) |
| 35 to 44 Years | 45 (100.0%) | 0 (0.0%) |
| 45 to 54 Years | 53 (91.4%) | 5 (8.6%) |
| 55 to 64 Years | 62 (91.2%) | 6 (8.8%) |
| 65 to 74 Years | 54 (100.0%) | 0 (0.0%) |
| 75 Years and older | 32 (100.0%) | 0 (0.0%) |
| Total | 539 (93.6%) | 37 (6.4%) |
Health Insurance Coverage by Citizenship Status in Groton
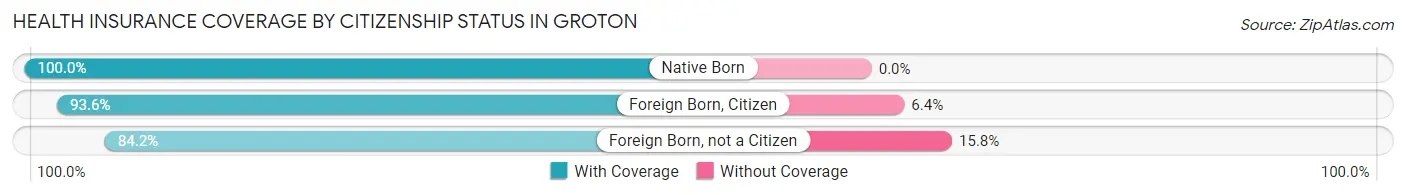
| Citizenship Status | With Coverage | Without Coverage |
| Native Born | 27 (100.0%) | 0 (0.0%) |
| Foreign Born, Citizen | 73 (93.6%) | 5 (6.4%) |
| Foreign Born, not a Citizen | 112 (84.2%) | 21 (15.8%) |
Health Insurance Coverage by Household Income in Groton
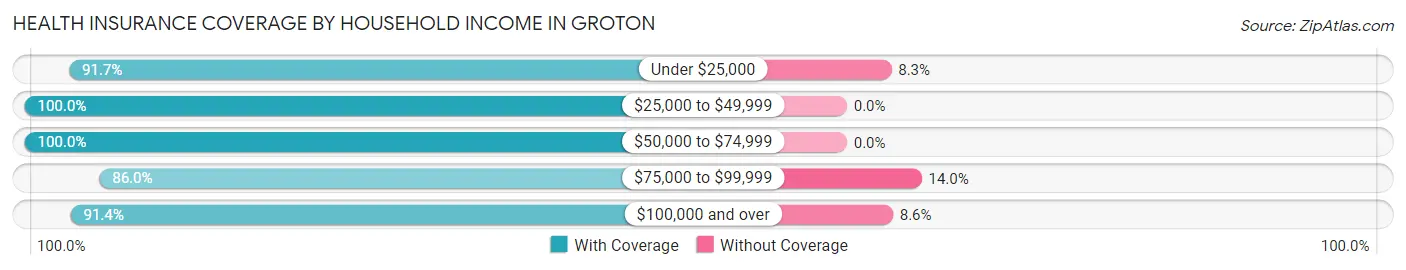
| Household Income | With Coverage | Without Coverage |
| Under $25,000 | 66 (91.7%) | 6 (8.3%) |
| $25,000 to $49,999 | 41 (100.0%) | 0 (0.0%) |
| $50,000 to $74,999 | 197 (100.0%) | 0 (0.0%) |
| $75,000 to $99,999 | 129 (86.0%) | 21 (14.0%) |
| $100,000 and over | 106 (91.4%) | 10 (8.6%) |
Public vs Private Health Insurance Coverage by Age in Groton
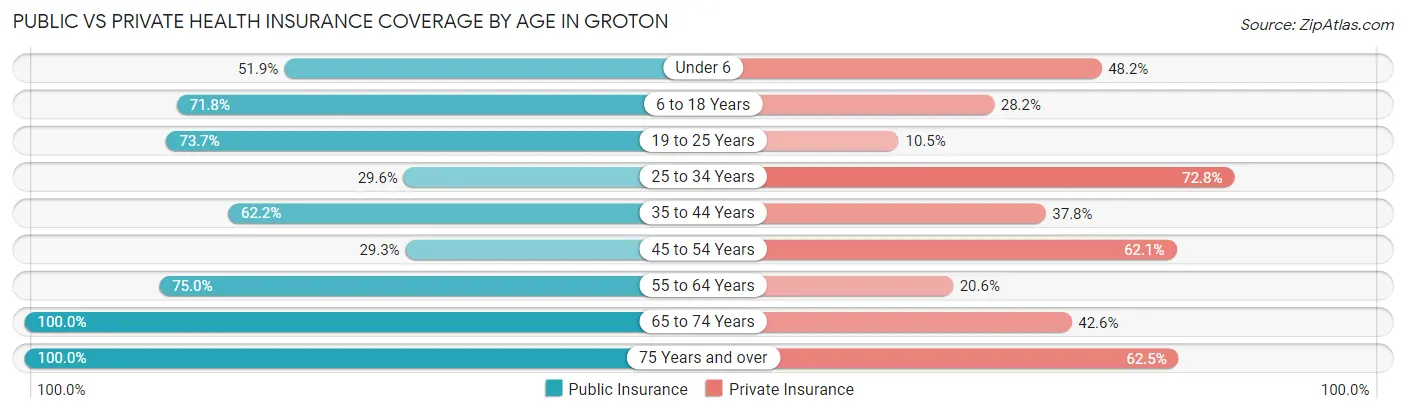
| Age Bracket | Public Insurance | Private Insurance |
| Under 6 | 14 (51.8%) | 13 (48.1%) |
| 6 to 18 Years | 56 (71.8%) | 22 (28.2%) |
| 19 to 25 Years | 98 (73.7%) | 14 (10.5%) |
| 25 to 34 Years | 24 (29.6%) | 59 (72.8%) |
| 35 to 44 Years | 28 (62.2%) | 17 (37.8%) |
| 45 to 54 Years | 17 (29.3%) | 36 (62.1%) |
| 55 to 64 Years | 51 (75.0%) | 14 (20.6%) |
| 65 to 74 Years | 54 (100.0%) | 23 (42.6%) |
| 75 Years and over | 32 (100.0%) | 20 (62.5%) |
| Total | 374 (64.9%) | 218 (37.9%) |
Disability Status by Sex by Age in Groton
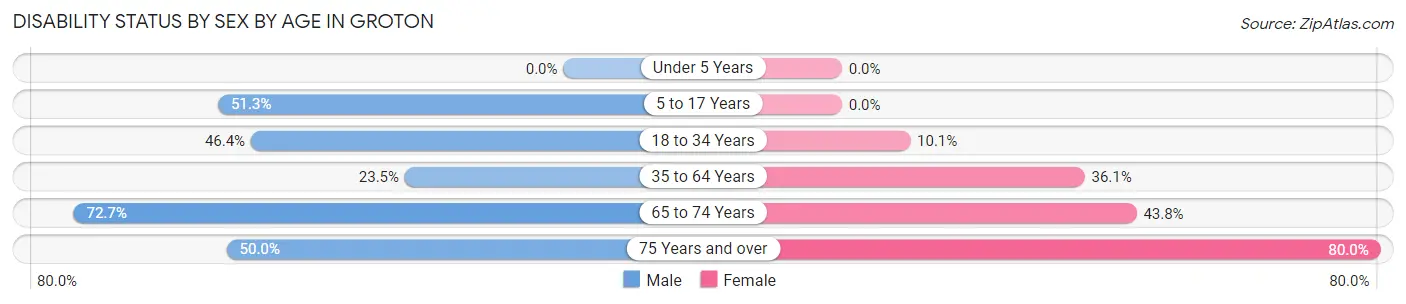
| Age Bracket | Male | Female |
| Under 5 Years | 0 (0.0%) | 0 (0.0%) |
| 5 to 17 Years | 20 (51.3%) | 0 (0.0%) |
| 18 to 34 Years | 45 (46.4%) | 15 (10.1%) |
| 35 to 64 Years | 20 (23.5%) | 31 (36.0%) |
| 65 to 74 Years | 16 (72.7%) | 14 (43.8%) |
| 75 Years and over | 6 (50.0%) | 16 (80.0%) |
Disability Class by Sex by Age in Groton
Disability Class: Hearing Difficulty
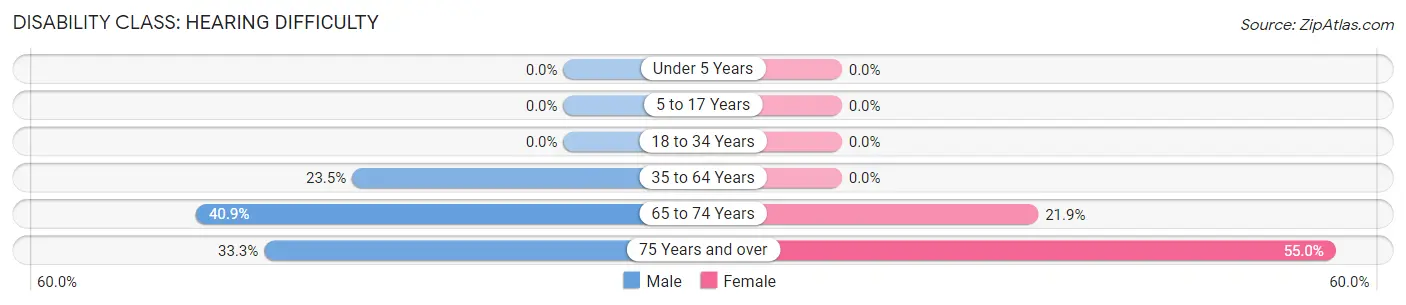
| Age Bracket | Male | Female |
| Under 5 Years | 0 (0.0%) | 0 (0.0%) |
| 5 to 17 Years | 0 (0.0%) | 0 (0.0%) |
| 18 to 34 Years | 0 (0.0%) | 0 (0.0%) |
| 35 to 64 Years | 20 (23.5%) | 0 (0.0%) |
| 65 to 74 Years | 9 (40.9%) | 7 (21.9%) |
| 75 Years and over | 4 (33.3%) | 11 (55.0%) |
Disability Class: Vision Difficulty
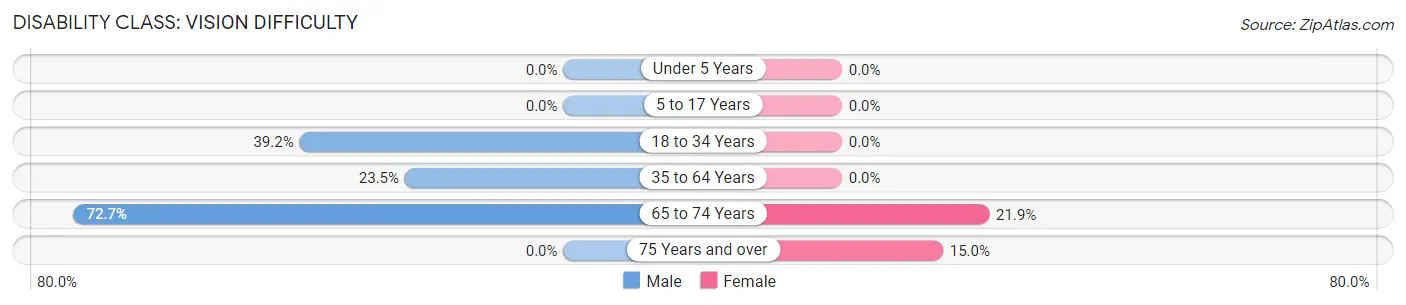
| Age Bracket | Male | Female |
| Under 5 Years | 0 (0.0%) | 0 (0.0%) |
| 5 to 17 Years | 0 (0.0%) | 0 (0.0%) |
| 18 to 34 Years | 38 (39.2%) | 0 (0.0%) |
| 35 to 64 Years | 20 (23.5%) | 0 (0.0%) |
| 65 to 74 Years | 16 (72.7%) | 7 (21.9%) |
| 75 Years and over | 0 (0.0%) | 3 (15.0%) |
Disability Class: Cognitive Difficulty
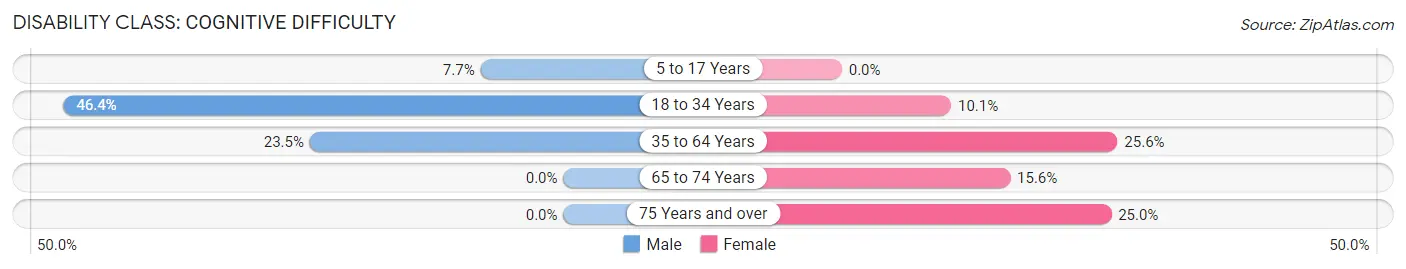
| Age Bracket | Male | Female |
| 5 to 17 Years | 3 (7.7%) | 0 (0.0%) |
| 18 to 34 Years | 45 (46.4%) | 15 (10.1%) |
| 35 to 64 Years | 20 (23.5%) | 22 (25.6%) |
| 65 to 74 Years | 0 (0.0%) | 5 (15.6%) |
| 75 Years and over | 0 (0.0%) | 5 (25.0%) |
Disability Class: Ambulatory Difficulty
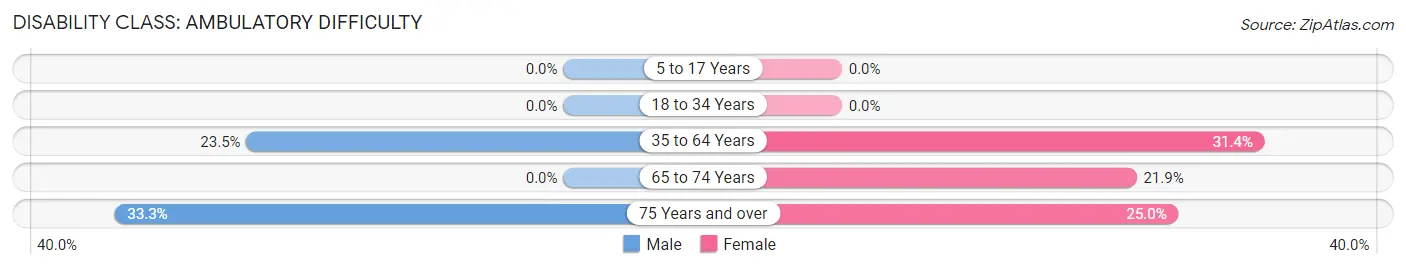
| Age Bracket | Male | Female |
| 5 to 17 Years | 0 (0.0%) | 0 (0.0%) |
| 18 to 34 Years | 0 (0.0%) | 0 (0.0%) |
| 35 to 64 Years | 20 (23.5%) | 27 (31.4%) |
| 65 to 74 Years | 0 (0.0%) | 7 (21.9%) |
| 75 Years and over | 4 (33.3%) | 5 (25.0%) |
Disability Class: Self-Care Difficulty
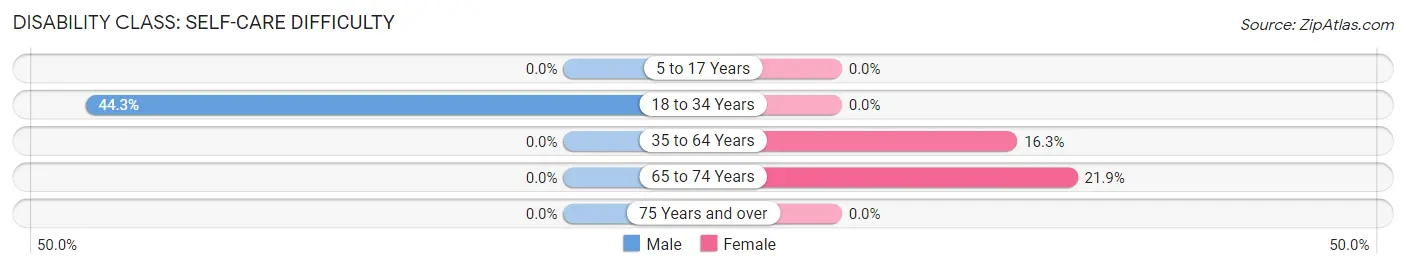
| Age Bracket | Male | Female |
| 5 to 17 Years | 0 (0.0%) | 0 (0.0%) |
| 18 to 34 Years | 43 (44.3%) | 0 (0.0%) |
| 35 to 64 Years | 0 (0.0%) | 14 (16.3%) |
| 65 to 74 Years | 0 (0.0%) | 7 (21.9%) |
| 75 Years and over | 0 (0.0%) | 0 (0.0%) |
Technology Access in Groton
Computing Device Access in Groton
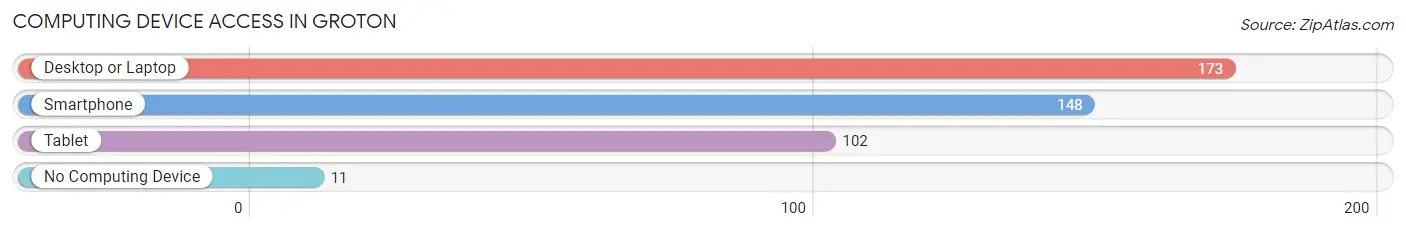
| Device Type | # Households | % Households |
| Desktop or Laptop | 173 | 83.6% |
| Smartphone | 148 | 71.5% |
| Tablet | 102 | 49.3% |
| No Computing Device | 11 | 5.3% |
| Total | 207 | 100.0% |
Internet Access in Groton
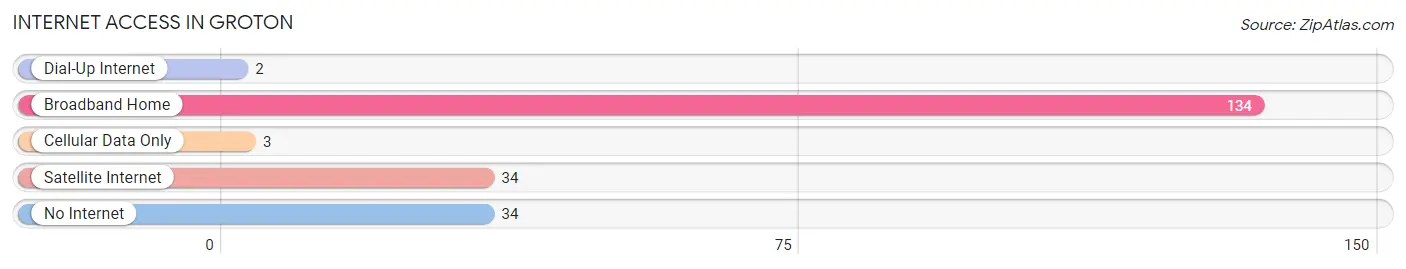
| Internet Type | # Households | % Households |
| Dial-Up Internet | 2 | 1.0% |
| Broadband Home | 134 | 64.7% |
| Cellular Data Only | 3 | 1.5% |
| Satellite Internet | 34 | 16.4% |
| No Internet | 34 | 16.4% |
| Total | 207 | 100.0% |
Groton Summary
History
The town of Groton, Vermont is located in Caledonia County in the northeastern part of the state. It was first settled in 1790 by a group of settlers from Massachusetts and New Hampshire. The town was originally called “Groton” after the town of Groton, Massachusetts. The town was incorporated in 1802 and has a population of 1,717 as of the 2010 census.
The town of Groton is located in a rural area of Vermont and is known for its rolling hills and forests. The town is home to several small lakes, including Lake Groton, which is the largest lake in the area. The town is also home to the Groton State Forest, which is the largest state forest in Vermont.
The town of Groton has a long history of farming and logging. The town was once home to several sawmills and gristmills, which were used to process lumber and grain. The town also had several small factories, including a woolen mill and a paper mill.
The town of Groton is also home to several historic sites, including the Groton Historical Society, which was founded in 1891. The society is dedicated to preserving the history of the town and its people. The society also operates a museum and a library.
Geography
The town of Groton is located in the northeastern part of Vermont in Caledonia County. The town is bordered by the towns of Hardwick to the north, Walden to the east, St. Johnsbury to the south, and Peacham to the west. The town is located in a rural area of Vermont and is known for its rolling hills and forests. The town is home to several small lakes, including Lake Groton, which is the largest lake in the area. The town is also home to the Groton State Forest, which is the largest state forest in Vermont.
The town of Groton is located in the Connecticut River Valley and is part of the Green Mountain National Forest. The town is located at an elevation of 1,000 feet and has a total area of 33.2 square miles. The town is located approximately 40 miles from the state capital of Montpelier and is approximately 90 miles from the city of Burlington.
Economy
The town of Groton has a strong agricultural economy. The town is home to several dairy farms, as well as several apple orchards. The town is also home to several small businesses, including a sawmill, a gristmill, and a woolen mill. The town is also home to several small manufacturing companies, including a paper mill and a furniture factory.
The town of Groton is also home to several tourist attractions, including the Groton State Forest and the Groton Historical Society. The town is also home to several small inns and bed and breakfasts.
Demographics
As of the 2010 census, the town of Groton had a population of 1,717. The town has a population density of 51.7 people per square mile. The median age of the population is 43.7 years. The median household income is $45,938 and the median family income is $54,844. The town has a poverty rate of 11.3%.
The town of Groton is predominantly white, with 95.3% of the population identifying as white. The town also has a small Hispanic population, with 2.2% of the population identifying as Hispanic or Latino. The town also has a small African American population, with 0.7% of the population identifying as African American. The town also has a small Asian population, with 0.5% of the population identifying as Asian.
Common Questions
What is Per Capita Income in Groton?
Per Capita income in Groton is $25,555.
What is the Median Family Income in Groton?
Median Family Income in Groton is $72,212.
What is the Median Household income in Groton?
Median Household Income in Groton is $54,769.
What is Income or Wage Gap in Groton?
Income or Wage Gap in Groton is 71.3%.
Women in Groton earn 28.7 cents for every dollar earned by a man.
What is Inequality or Gini Index in Groton?
Inequality or Gini Index in Groton is 0.35.
What is the Total Population of Groton?
Total Population of Groton is 576.
What is the Total Male Population of Groton?
Total Male Population of Groton is 264.
What is the Total Female Population of Groton?
Total Female Population of Groton is 312.
What is the Ratio of Males per 100 Females in Groton?
There are 84.62 Males per 100 Females in Groton.
What is the Ratio of Females per 100 Males in Groton?
There are 118.18 Females per 100 Males in Groton.
What is the Median Population Age in Groton?
Median Population Age in Groton is 31.3 Years.
What is the Average Family Size in Groton
Average Family Size in Groton is 3.2 People.
What is the Average Household Size in Groton
Average Household Size in Groton is 2.8 People.
How Large is the Labor Force in Groton?
There are 281 People in the Labor Forcein in Groton.
What is the Percentage of People in the Labor Force in Groton?
54.8% of People are in the Labor Force in Groton.
What is the Unemployment Rate in Groton?
Unemployment Rate in Groton is 10.7%.