Wilmington, VT Map & Demographics
Wilmington Map
Wilmington Overview
$43,448
PER CAPITA INCOME
$85,000
AVG FAMILY INCOME
$92,794
AVG HOUSEHOLD INCOME
68.1%
WAGE / INCOME GAP [ % ]
31.9¢/ $1
WAGE / INCOME GAP [ $ ]
0.28
INEQUALITY / GINI INDEX
385
TOTAL POPULATION
239
MALE POPULATION
146
FEMALE POPULATION
163.70
MALES / 100 FEMALES
61.09
FEMALES / 100 MALES
40.5
MEDIAN AGE
3.5
AVG FAMILY SIZE
2.0
AVG HOUSEHOLD SIZE
138
LABOR FORCE [ PEOPLE ]
49.6%
PERCENT IN LABOR FORCE
Wilmington Zip Codes
Wilmington Area Codes
Income in Wilmington
Income Overview in Wilmington
Per Capita Income in Wilmington is $43,448, while median incomes of families and households are $85,000 and $92,794 respectively.
| Characteristic | Number | Measure |
| Per Capita Income | 385 | $43,448 |
| Median Family Income | 70 | $85,000 |
| Mean Family Income | 70 | $78,751 |
| Median Household Income | 192 | $92,794 |
| Mean Household Income | 192 | $82,566 |
| Income Deficit | 70 | $0 |
| Wage / Income Gap (%) | 385 | 68.13% |
| Wage / Income Gap ($) | 385 | 31.87¢ per $1 |
| Gini / Inequality Index | 385 | 0.28 |
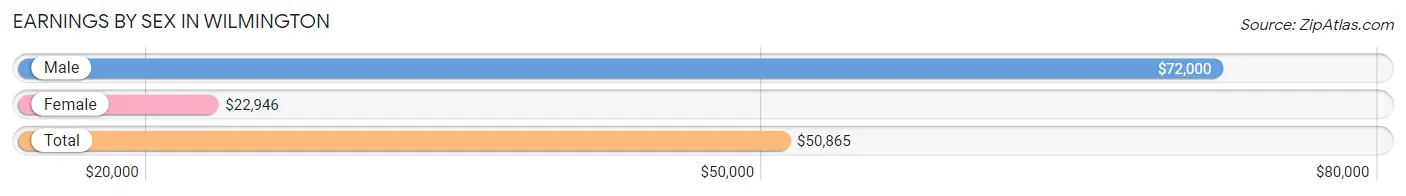
Earnings by Sex in Wilmington
Average Earnings in Wilmington are $50,865, $72,000 for men and $22,946 for women, a difference of 68.1%.
| Sex | Number | Average Earnings |
| Male | 80 (55.2%) | $72,000 |
| Female | 65 (44.8%) | $22,946 |
| Total | 145 (100.0%) | $50,865 |
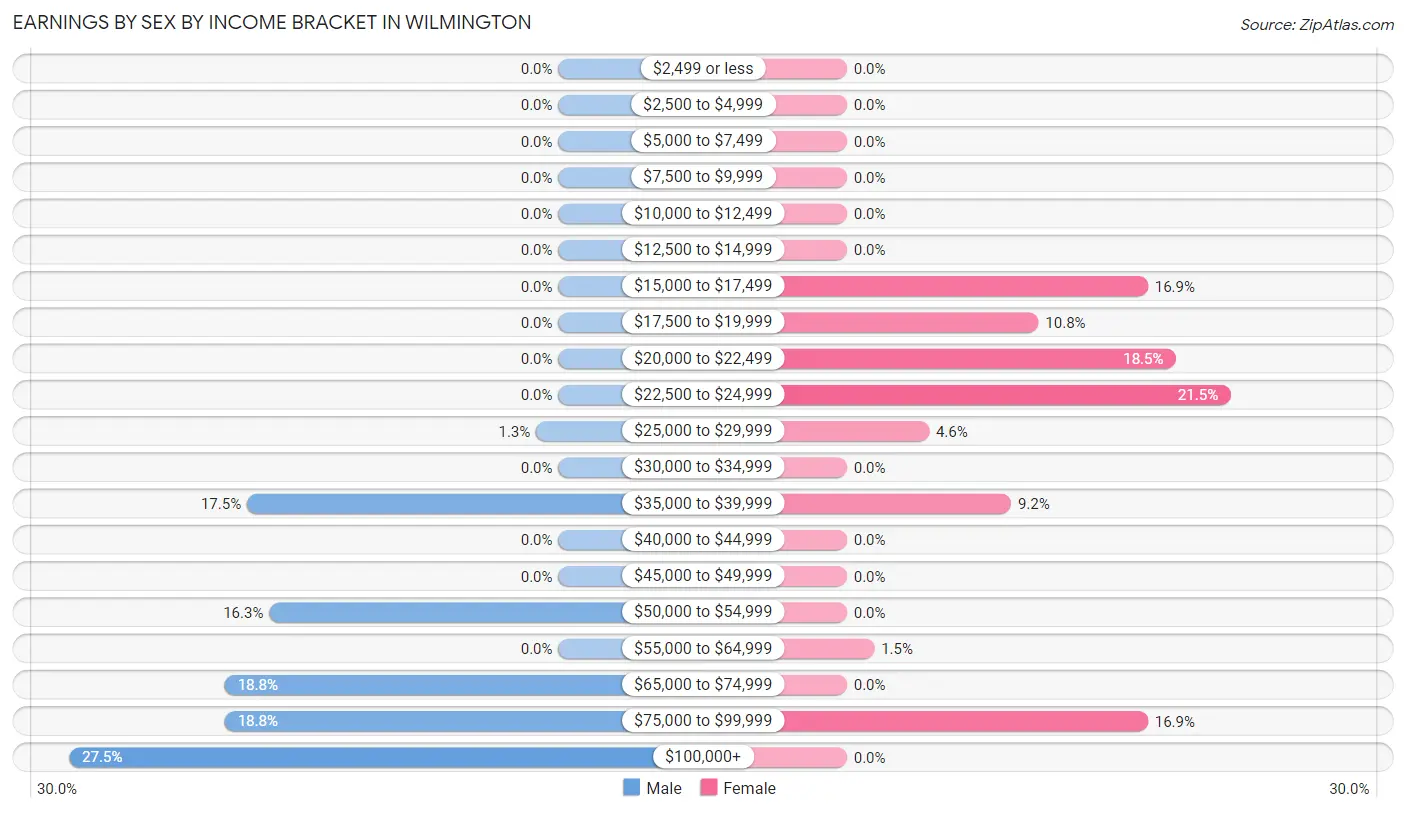
Earnings by Sex by Income Bracket in Wilmington
The most common earnings brackets in Wilmington are $100,000+ for men (22 | 27.5%) and $22,500 to $24,999 for women (14 | 21.5%).
| Income | Male | Female |
| $2,499 or less | 0 (0.0%) | 0 (0.0%) |
| $2,500 to $4,999 | 0 (0.0%) | 0 (0.0%) |
| $5,000 to $7,499 | 0 (0.0%) | 0 (0.0%) |
| $7,500 to $9,999 | 0 (0.0%) | 0 (0.0%) |
| $10,000 to $12,499 | 0 (0.0%) | 0 (0.0%) |
| $12,500 to $14,999 | 0 (0.0%) | 0 (0.0%) |
| $15,000 to $17,499 | 0 (0.0%) | 11 (16.9%) |
| $17,500 to $19,999 | 0 (0.0%) | 7 (10.8%) |
| $20,000 to $22,499 | 0 (0.0%) | 12 (18.5%) |
| $22,500 to $24,999 | 0 (0.0%) | 14 (21.5%) |
| $25,000 to $29,999 | 1 (1.3%) | 3 (4.6%) |
| $30,000 to $34,999 | 0 (0.0%) | 0 (0.0%) |
| $35,000 to $39,999 | 14 (17.5%) | 6 (9.2%) |
| $40,000 to $44,999 | 0 (0.0%) | 0 (0.0%) |
| $45,000 to $49,999 | 0 (0.0%) | 0 (0.0%) |
| $50,000 to $54,999 | 13 (16.3%) | 0 (0.0%) |
| $55,000 to $64,999 | 0 (0.0%) | 1 (1.5%) |
| $65,000 to $74,999 | 15 (18.8%) | 0 (0.0%) |
| $75,000 to $99,999 | 15 (18.8%) | 11 (16.9%) |
| $100,000+ | 22 (27.5%) | 0 (0.0%) |
| Total | 80 (100.0%) | 65 (100.0%) |
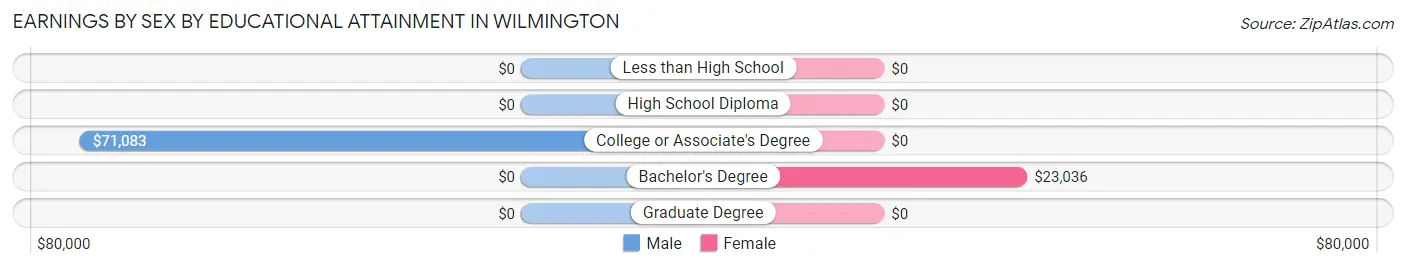
Earnings by Sex by Educational Attainment in Wilmington
Average earnings in Wilmington are $72,000 for men and $22,946 for women, a difference of 68.1%. Men with an educational attainment of college or associate's degree enjoy the highest average annual earnings of $71,083, while those with college or associate's degree education earn the least with $71,083. Women with an educational attainment of bachelor's degree earn the most with the average annual earnings of $23,036, while those with bachelor's degree education have the smallest earnings of $23,036.
| Educational Attainment | Male Income | Female Income |
| Less than High School | - | - |
| High School Diploma | - | - |
| College or Associate's Degree | $71,083 | $0 |
| Bachelor's Degree | - | - |
| Graduate Degree | - | - |
| Total | $72,000 | $22,946 |
Family Income in Wilmington
Family Income Brackets in Wilmington
According to the Wilmington family income data, there are 34 families falling into the $75,000 to $99,999 income range, which is the most common income bracket and makes up 48.6% of all families.
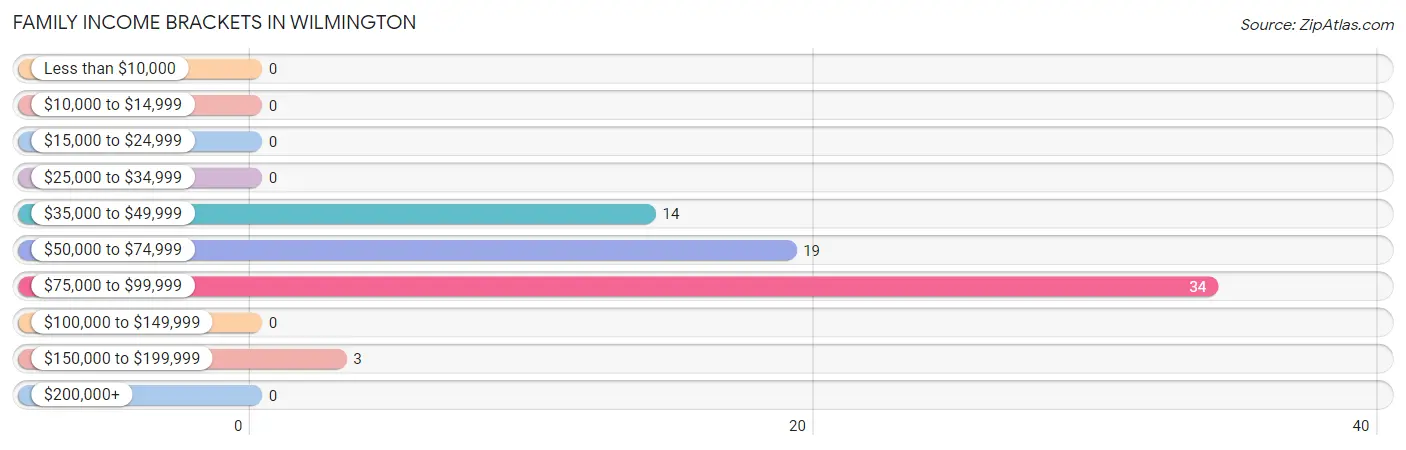
| Income Bracket | # Families | % Families |
| Less than $10,000 | 0 | 0.0% |
| $10,000 to $14,999 | 0 | 0.0% |
| $15,000 to $24,999 | 0 | 0.0% |
| $25,000 to $34,999 | 0 | 0.0% |
| $35,000 to $49,999 | 14 | 20.0% |
| $50,000 to $74,999 | 19 | 27.1% |
| $75,000 to $99,999 | 34 | 48.6% |
| $100,000 to $149,999 | 0 | 0.0% |
| $150,000 to $199,999 | 3 | 4.3% |
| $200,000+ | 0 | 0.0% |
Family Income by Famaliy Size in Wilmington
2-person families (30 | 42.9%) account for the highest median family income in Wilmington with $58,333 per family, while 2-person families (30 | 42.9%) have the highest median income of $29,166 per family member.
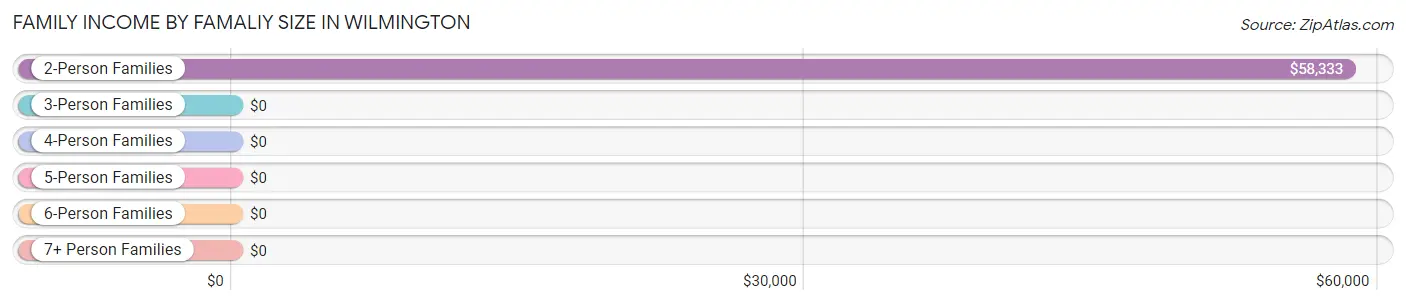
| Income Bracket | # Families | Median Income |
| 2-Person Families | 30 (42.9%) | $58,333 |
| 3-Person Families | 25 (35.7%) | $0 |
| 4-Person Families | 12 (17.1%) | $0 |
| 5-Person Families | 3 (4.3%) | $0 |
| 6-Person Families | 0 (0.0%) | $0 |
| 7+ Person Families | 0 (0.0%) | $0 |
| Total | 70 (100.0%) | $85,000 |
Family Income by Number of Earners in Wilmington
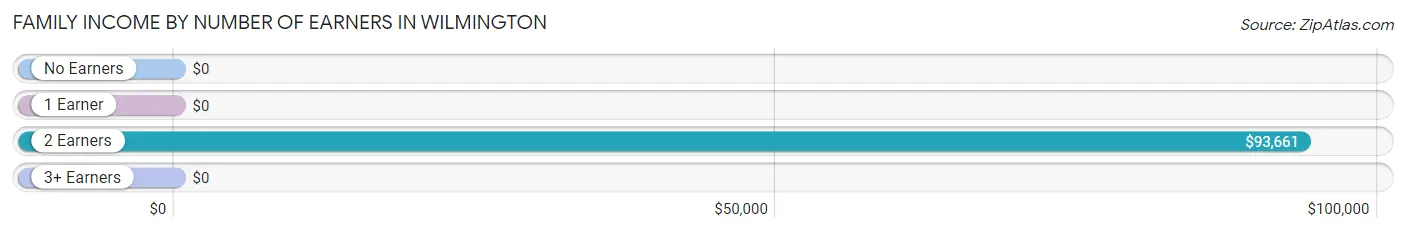
| Number of Earners | # Families | Median Income |
| No Earners | 2 (2.9%) | $0 |
| 1 Earner | 25 (35.7%) | $0 |
| 2 Earners | 43 (61.4%) | $93,661 |
| 3+ Earners | 0 (0.0%) | $0 |
| Total | 70 (100.0%) | $85,000 |
Household Income in Wilmington
Household Income Brackets in Wilmington
With 88 households falling in the category, the $75,000 to $99,999 income range is the most frequent in Wilmington, accounting for 45.8% of all households.
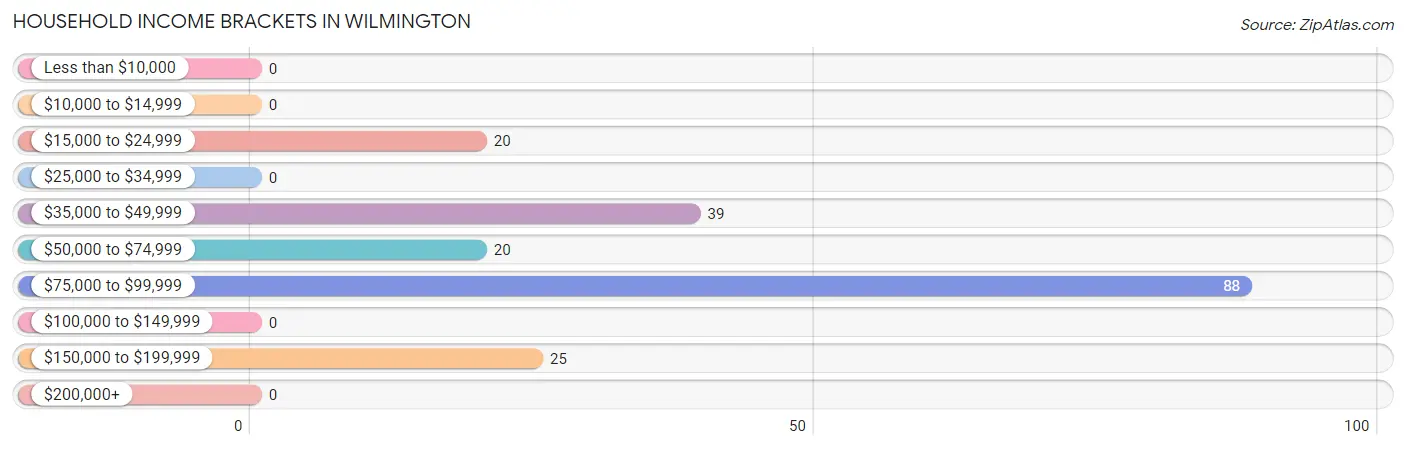
| Income Bracket | # Households | % Households |
| Less than $10,000 | 0 | 0.0% |
| $10,000 to $14,999 | 0 | 0.0% |
| $15,000 to $24,999 | 20 | 10.4% |
| $25,000 to $34,999 | 0 | 0.0% |
| $35,000 to $49,999 | 39 | 20.3% |
| $50,000 to $74,999 | 20 | 10.4% |
| $75,000 to $99,999 | 88 | 45.8% |
| $100,000 to $149,999 | 0 | 0.0% |
| $150,000 to $199,999 | 25 | 13.0% |
| $200,000+ | 0 | 0.0% |
Household Income by Householder Age in Wilmington
The median household income in Wilmington is $92,794, with the highest median household income of $173,011 found in the 45 to 64 years age bracket for the primary householder. A total of 35 households (18.2%) fall into this category.
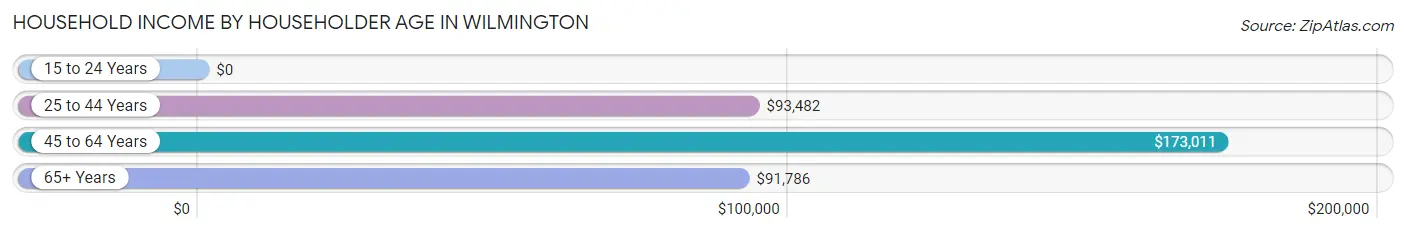
| Income Bracket | # Households | Median Income |
| 15 to 24 Years | 0 (0.0%) | $0 |
| 25 to 44 Years | 45 (23.4%) | $93,482 |
| 45 to 64 Years | 35 (18.2%) | $173,011 |
| 65+ Years | 112 (58.3%) | $91,786 |
| Total | 192 (100.0%) | $92,794 |
Poverty in Wilmington
Income Below Poverty by Sex and Age in Wilmington
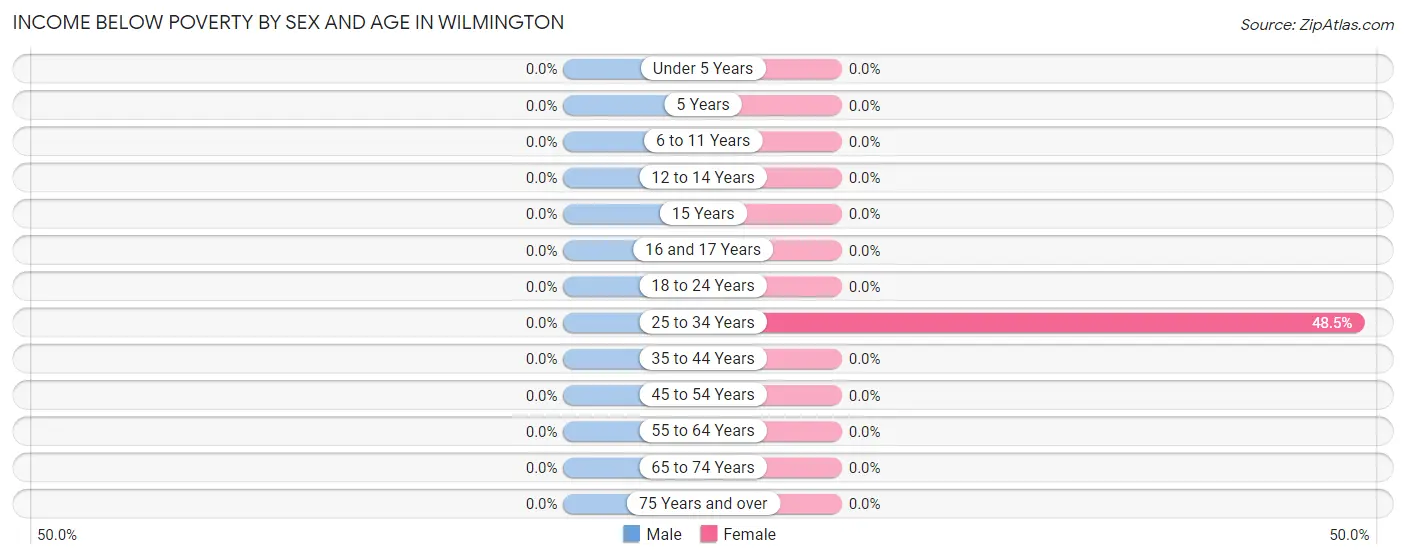
| Age Bracket | Male | Female |
| Under 5 Years | 0 (0.0%) | 0 (0.0%) |
| 5 Years | 0 (0.0%) | 0 (0.0%) |
| 6 to 11 Years | 0 (0.0%) | 0 (0.0%) |
| 12 to 14 Years | 0 (0.0%) | 0 (0.0%) |
| 15 Years | 0 (0.0%) | 0 (0.0%) |
| 16 and 17 Years | 0 (0.0%) | 0 (0.0%) |
| 18 to 24 Years | 0 (0.0%) | 0 (0.0%) |
| 25 to 34 Years | 0 (0.0%) | 16 (48.5%) |
| 35 to 44 Years | 0 (0.0%) | 0 (0.0%) |
| 45 to 54 Years | 0 (0.0%) | 0 (0.0%) |
| 55 to 64 Years | 0 (0.0%) | 0 (0.0%) |
| 65 to 74 Years | 0 (0.0%) | 0 (0.0%) |
| 75 Years and over | 0 (0.0%) | 0 (0.0%) |
| Total | 0 (0.0%) | 16 (11.0%) |
Income Above Poverty by Sex and Age in Wilmington
According to the poverty statistics in Wilmington, males aged under 5 years and females aged under 5 years are the age groups that are most secure financially, with 100.0% of males and 100.0% of females in these age groups living above the poverty line.
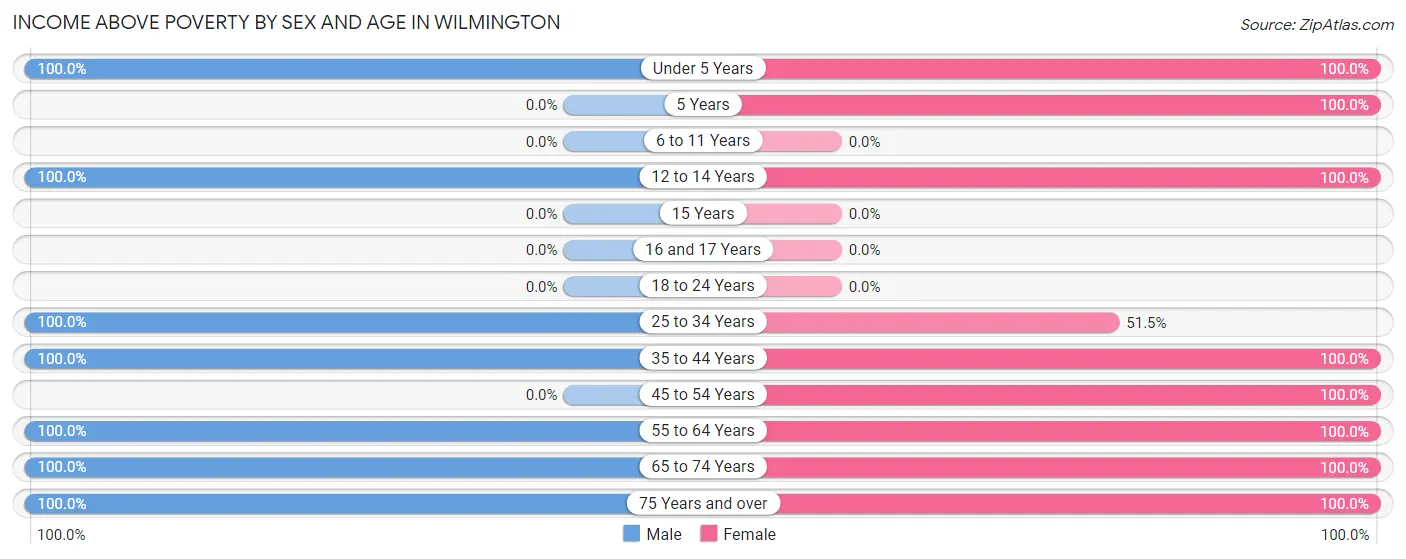
| Age Bracket | Male | Female |
| Under 5 Years | 58 (100.0%) | 15 (100.0%) |
| 5 Years | 0 (0.0%) | 6 (100.0%) |
| 6 to 11 Years | 0 (0.0%) | 0 (0.0%) |
| 12 to 14 Years | 14 (100.0%) | 14 (100.0%) |
| 15 Years | 0 (0.0%) | 0 (0.0%) |
| 16 and 17 Years | 0 (0.0%) | 0 (0.0%) |
| 18 to 24 Years | 0 (0.0%) | 0 (0.0%) |
| 25 to 34 Years | 33 (100.0%) | 17 (51.5%) |
| 35 to 44 Years | 12 (100.0%) | 14 (100.0%) |
| 45 to 54 Years | 0 (0.0%) | 12 (100.0%) |
| 55 to 64 Years | 35 (100.0%) | 18 (100.0%) |
| 65 to 74 Years | 33 (100.0%) | 9 (100.0%) |
| 75 Years and over | 54 (100.0%) | 25 (100.0%) |
| Total | 239 (100.0%) | 130 (89.0%) |
Income Below Poverty Among Married-Couple Families in Wilmington
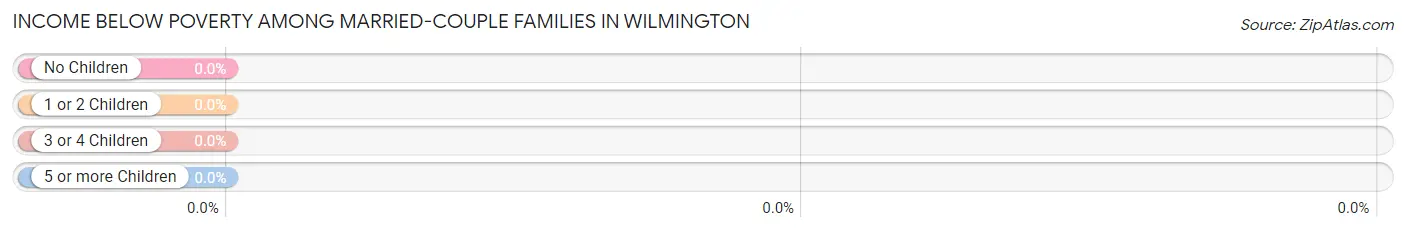
| Children | Above Poverty | Below Poverty |
| No Children | 12 (100.0%) | 0 (0.0%) |
| 1 or 2 Children | 40 (100.0%) | 0 (0.0%) |
| 3 or 4 Children | 0 (0.0%) | 0 (0.0%) |
| 5 or more Children | 0 (0.0%) | 0 (0.0%) |
| Total | 52 (100.0%) | 0 (0.0%) |
Income Below Poverty Among Single-Parent Households in Wilmington
| Children | Single Father | Single Mother |
| No Children | 0 (0.0%) | 0 (0.0%) |
| 1 or 2 Children | 0 (0.0%) | 0 (0.0%) |
| 3 or 4 Children | 0 (0.0%) | 0 (0.0%) |
| 5 or more Children | 0 (0.0%) | 0 (0.0%) |
| Total | 0 (0.0%) | 0 (0.0%) |
Income Below Poverty Among Married-Couple vs Single-Parent Households in Wilmington
| Children | Married-Couple Families | Single-Parent Households |
| No Children | 0 (0.0%) | 0 (0.0%) |
| 1 or 2 Children | 0 (0.0%) | 0 (0.0%) |
| 3 or 4 Children | 0 (0.0%) | 0 (0.0%) |
| 5 or more Children | 0 (0.0%) | 0 (0.0%) |
| Total | 0 (0.0%) | 0 (0.0%) |
Race in Wilmington
The most populous races in Wilmington are White / Caucasian (384 | 99.7%), Hispanic or Latino (4 | 1.0%), and Two or more Races (1 | 0.3%).
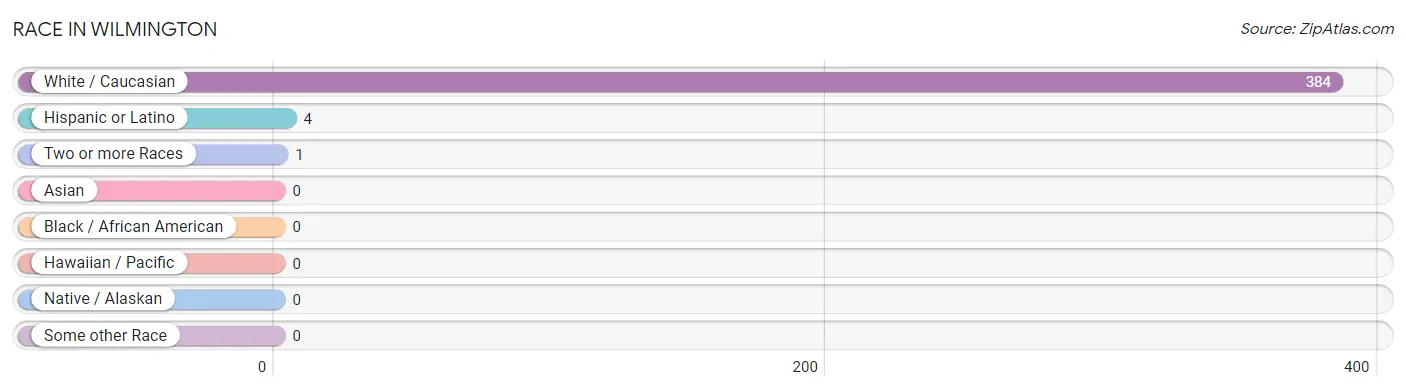
| Race | # Population | % Population |
| Asian | 0 | 0.0% |
| Black / African American | 0 | 0.0% |
| Hawaiian / Pacific | 0 | 0.0% |
| Hispanic or Latino | 4 | 1.0% |
| Native / Alaskan | 0 | 0.0% |
| White / Caucasian | 384 | 99.7% |
| Two or more Races | 1 | 0.3% |
| Some other Race | 0 | 0.0% |
| Total | 385 | 100.0% |
Ancestry in Wilmington
The most populous ancestries reported in Wilmington are English (93 | 24.2%), Irish (75 | 19.5%), Scottish (55 | 14.3%), German (22 | 5.7%), and British (8 | 2.1%), together accounting for 65.7% of all Wilmington residents.
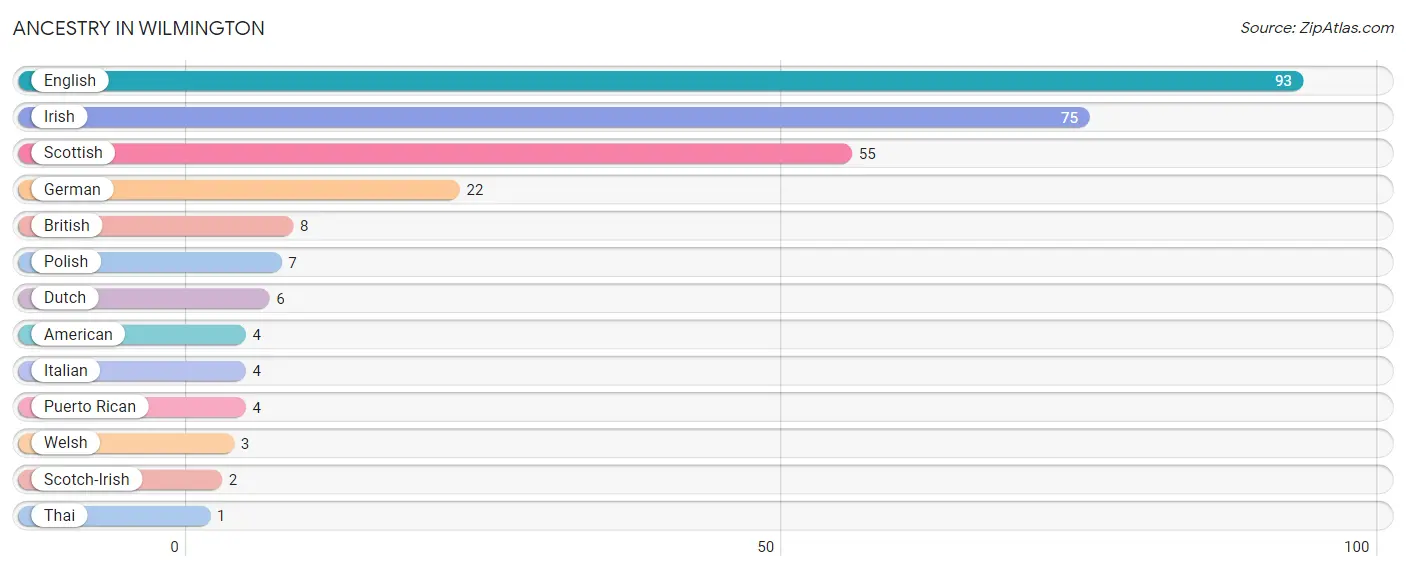
| Ancestry | # Population | % Population |
| American | 4 | 1.0% |
| British | 8 | 2.1% |
| Dutch | 6 | 1.6% |
| English | 93 | 24.2% |
| German | 22 | 5.7% |
| Irish | 75 | 19.5% |
| Italian | 4 | 1.0% |
| Polish | 7 | 1.8% |
| Puerto Rican | 4 | 1.0% |
| Scotch-Irish | 2 | 0.5% |
| Scottish | 55 | 14.3% |
| Thai | 1 | 0.3% |
| Welsh | 3 | 0.8% | View All 13 Rows |
Immigrants in Wilmington

| Immigration Origin | # Population | % Population | View All 0 Rows |
Sex and Age in Wilmington
Sex and Age in Wilmington
The most populous age groups in Wilmington are Under 5 Years (58 | 24.3%) for men and 30 to 34 Years (17 | 11.6%) for women.
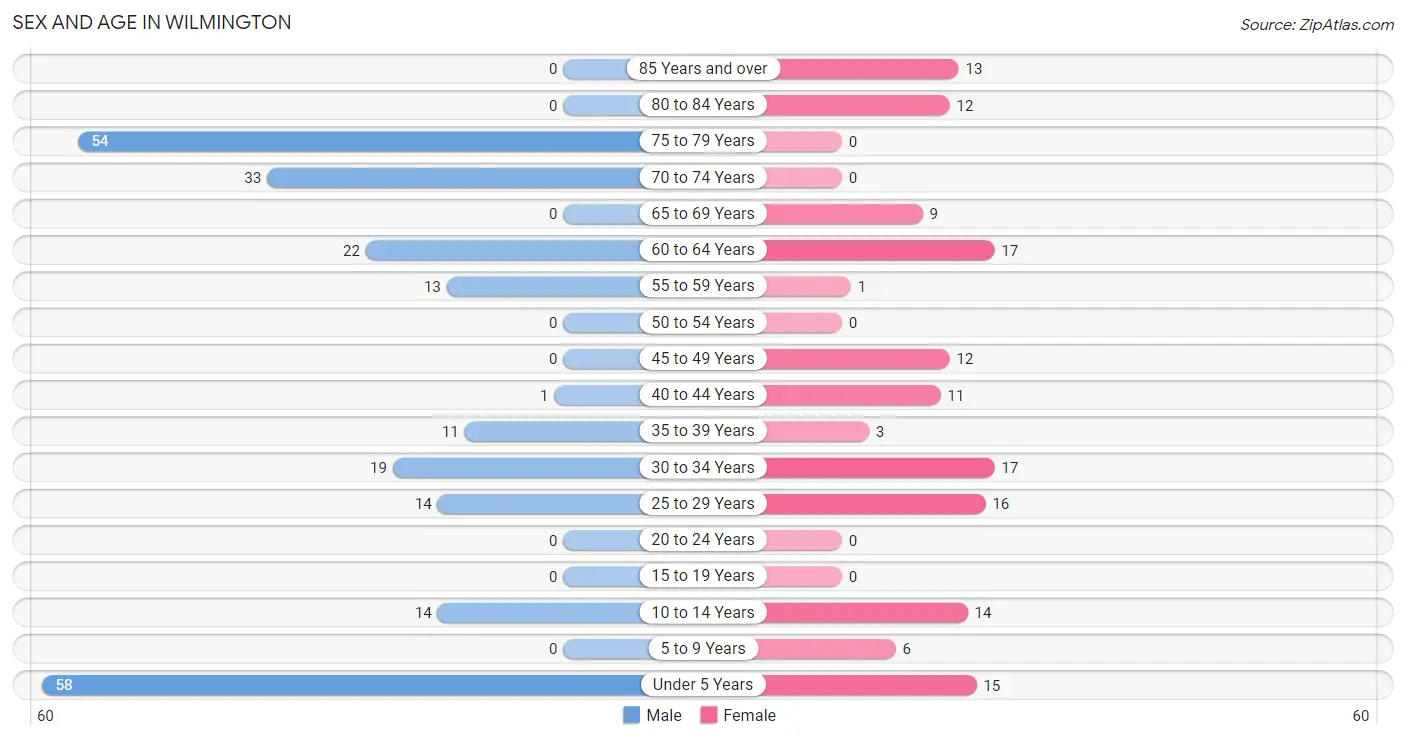
| Age Bracket | Male | Female |
| Under 5 Years | 58 (24.3%) | 15 (10.3%) |
| 5 to 9 Years | 0 (0.0%) | 6 (4.1%) |
| 10 to 14 Years | 14 (5.9%) | 14 (9.6%) |
| 15 to 19 Years | 0 (0.0%) | 0 (0.0%) |
| 20 to 24 Years | 0 (0.0%) | 0 (0.0%) |
| 25 to 29 Years | 14 (5.9%) | 16 (11.0%) |
| 30 to 34 Years | 19 (8.0%) | 17 (11.6%) |
| 35 to 39 Years | 11 (4.6%) | 3 (2.1%) |
| 40 to 44 Years | 1 (0.4%) | 11 (7.5%) |
| 45 to 49 Years | 0 (0.0%) | 12 (8.2%) |
| 50 to 54 Years | 0 (0.0%) | 0 (0.0%) |
| 55 to 59 Years | 13 (5.4%) | 1 (0.7%) |
| 60 to 64 Years | 22 (9.2%) | 17 (11.6%) |
| 65 to 69 Years | 0 (0.0%) | 9 (6.2%) |
| 70 to 74 Years | 33 (13.8%) | 0 (0.0%) |
| 75 to 79 Years | 54 (22.6%) | 0 (0.0%) |
| 80 to 84 Years | 0 (0.0%) | 12 (8.2%) |
| 85 Years and over | 0 (0.0%) | 13 (8.9%) |
| Total | 239 (100.0%) | 146 (100.0%) |
Families and Households in Wilmington
Median Family Size in Wilmington
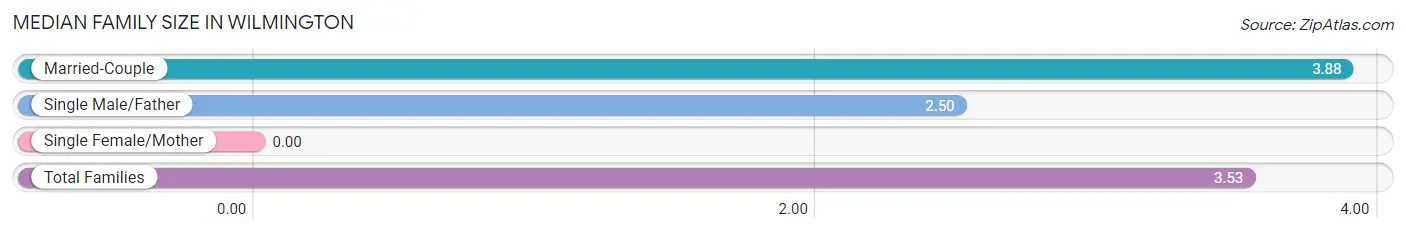
| Family Type | # Families | Family Size |
| Married-Couple | 52 (74.3%) | 3.88 |
| Single Male/Father | 18 (25.7%) | 2.50 |
| Single Female/Mother | 0 (0.0%) | - |
| Total Families | 70 (100.0%) | 3.53 |
Median Household Size in Wilmington
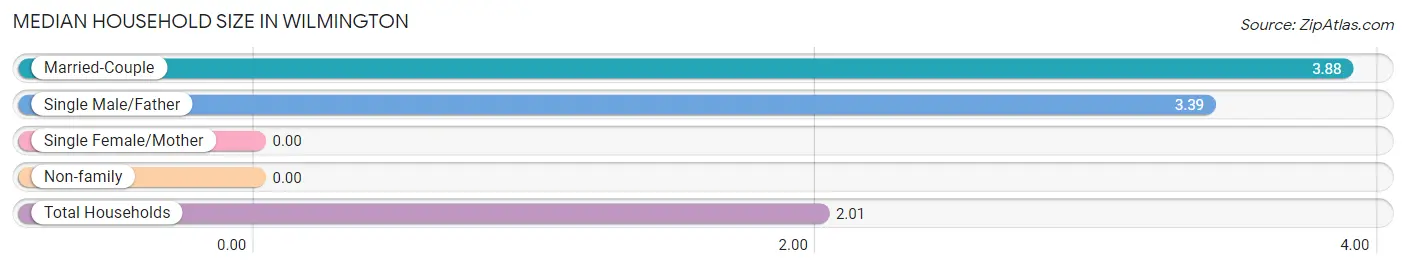
| Household Type | # Households | Household Size |
| Married-Couple | 52 (27.1%) | 3.88 |
| Single Male/Father | 18 (9.4%) | 3.39 |
| Single Female/Mother | 0 (0.0%) | - |
| Non-family | 122 (63.5%) | - |
| Total Households | 192 (100.0%) | 2.01 |
Household Size by Marriage Status in Wilmington
Out of a total of 192 households in Wilmington, 70 (36.5%) are family households, while 122 (63.5%) are nonfamily households. The most numerous type of family households are 3-person households, comprising 39, and the most common type of nonfamily households are 1-person households, comprising 122.
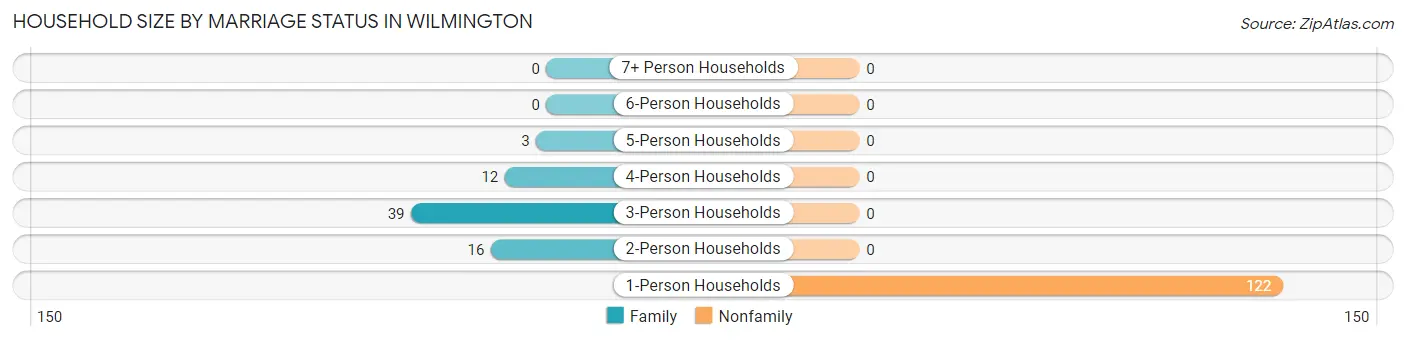
| Household Size | Family Households | Nonfamily Households |
| 1-Person Households | - | 122 (63.5%) |
| 2-Person Households | 16 (8.3%) | 0 (0.0%) |
| 3-Person Households | 39 (20.3%) | 0 (0.0%) |
| 4-Person Households | 12 (6.2%) | 0 (0.0%) |
| 5-Person Households | 3 (1.6%) | 0 (0.0%) |
| 6-Person Households | 0 (0.0%) | 0 (0.0%) |
| 7+ Person Households | 0 (0.0%) | 0 (0.0%) |
| Total | 70 (36.5%) | 122 (63.5%) |
Female Fertility in Wilmington
Fertility by Age in Wilmington
Average fertility rate in Wilmington is 51.0 births per 1,000 women. Women in the age bracket of 20 to 34 years have the highest fertility rate with 91.0 births per 1,000 women. Women in the age bracket of 20 to 34 years acount for 100.0% of all women with births.
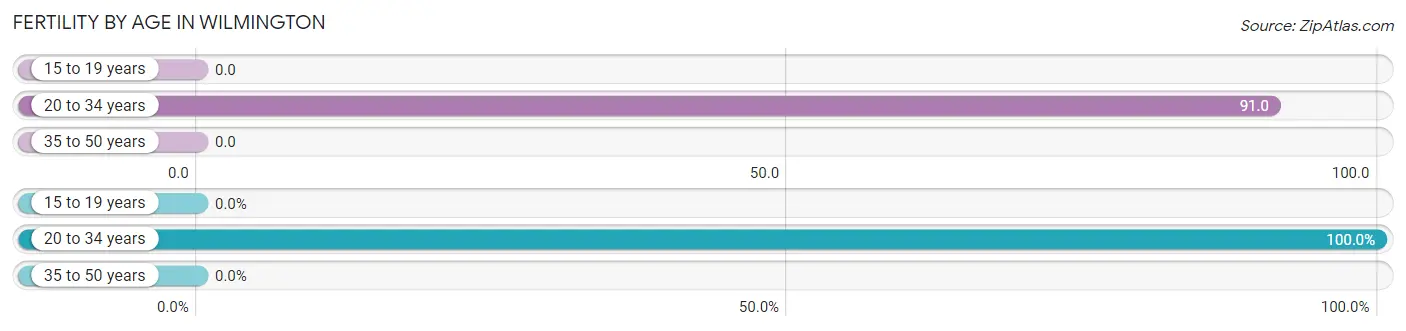
| Age Bracket | Women with Births | Births / 1,000 Women |
| 15 to 19 years | 0 (0.0%) | 0.0 |
| 20 to 34 years | 3 (100.0%) | 91.0 |
| 35 to 50 years | 0 (0.0%) | 0.0 |
| Total | 3 (100.0%) | 51.0 |
Fertility by Age by Marriage Status in Wilmington
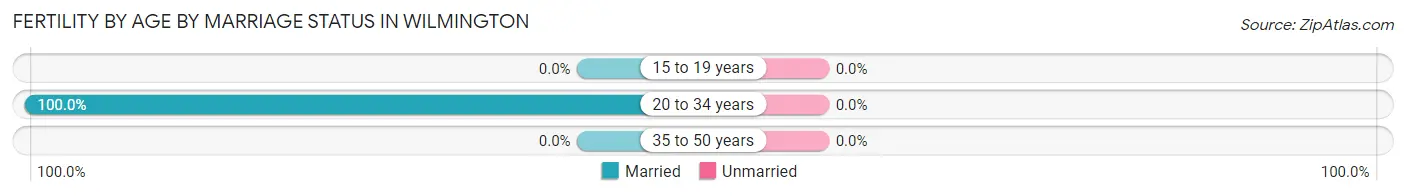
| Age Bracket | Married | Unmarried |
| 15 to 19 years | 0 (0.0%) | 0 (0.0%) |
| 20 to 34 years | 3 (100.0%) | 0 (0.0%) |
| 35 to 50 years | 0 (0.0%) | 0 (0.0%) |
| Total | 3 (100.0%) | 0 (0.0%) |
Fertility by Education in Wilmington
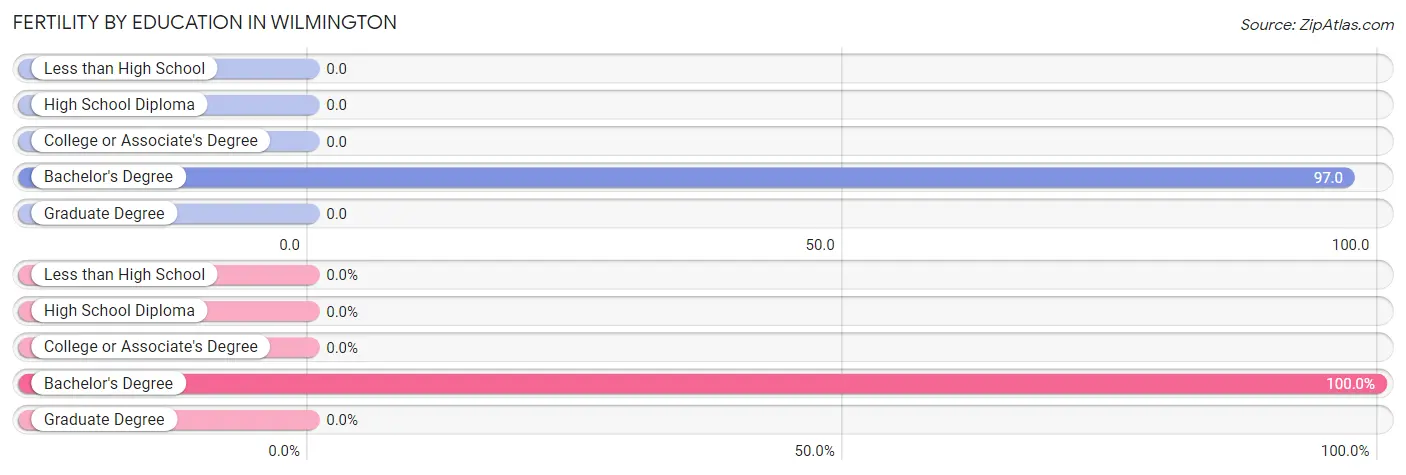
| Educational Attainment | Women with Births | Births / 1,000 Women |
| Less than High School | 0 (0.0%) | 0.0 |
| High School Diploma | 0 (0.0%) | 0.0 |
| College or Associate's Degree | 0 (0.0%) | 0.0 |
| Bachelor's Degree | 3 (100.0%) | 97.0 |
| Graduate Degree | 0 (0.0%) | 0.0 |
| Total | 3 (100.0%) | 51.0 |
Fertility by Education by Marriage Status in Wilmington
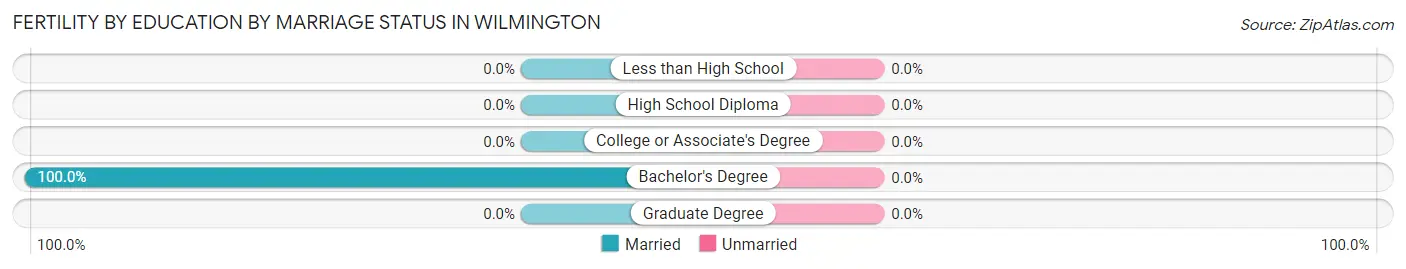
| Educational Attainment | Married | Unmarried |
| Less than High School | 0 (0.0%) | 0 (0.0%) |
| High School Diploma | 0 (0.0%) | 0 (0.0%) |
| College or Associate's Degree | 0 (0.0%) | 0 (0.0%) |
| Bachelor's Degree | 3 (100.0%) | 0 (0.0%) |
| Graduate Degree | 0 (0.0%) | 0 (0.0%) |
| Total | 3 (100.0%) | 0 (0.0%) |
Employment Characteristics in Wilmington
Employment by Class of Employer in Wilmington
Among the 138 employed individuals in Wilmington, private company employees (78 | 56.5%), local government employees (33 | 23.9%), and self-employed (not incorporated) (26 | 18.8%) make up the most common classes of employment.
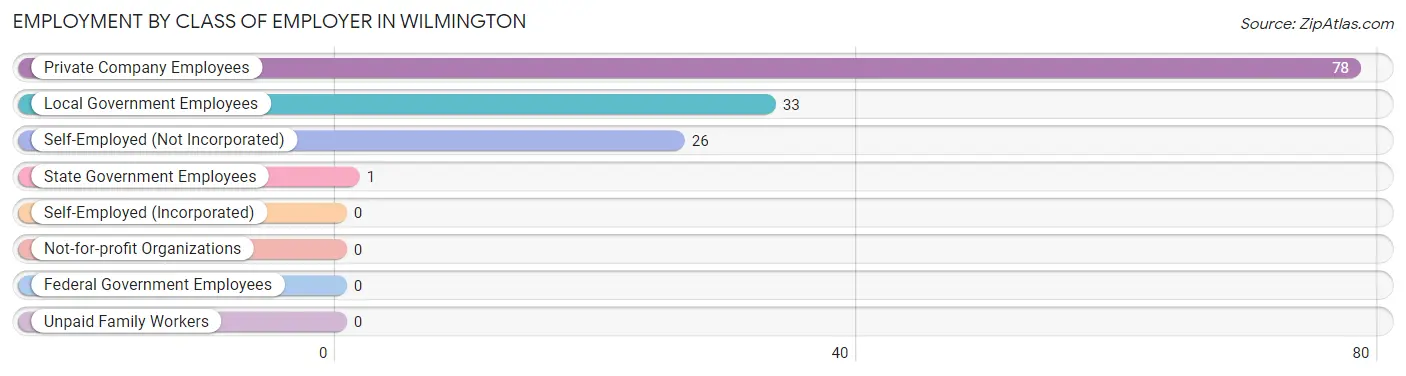
| Employer Class | # Employees | % Employees |
| Private Company Employees | 78 | 56.5% |
| Self-Employed (Incorporated) | 0 | 0.0% |
| Self-Employed (Not Incorporated) | 26 | 18.8% |
| Not-for-profit Organizations | 0 | 0.0% |
| Local Government Employees | 33 | 23.9% |
| State Government Employees | 1 | 0.7% |
| Federal Government Employees | 0 | 0.0% |
| Unpaid Family Workers | 0 | 0.0% |
| Total | 138 | 100.0% |
Employment Status by Age in Wilmington
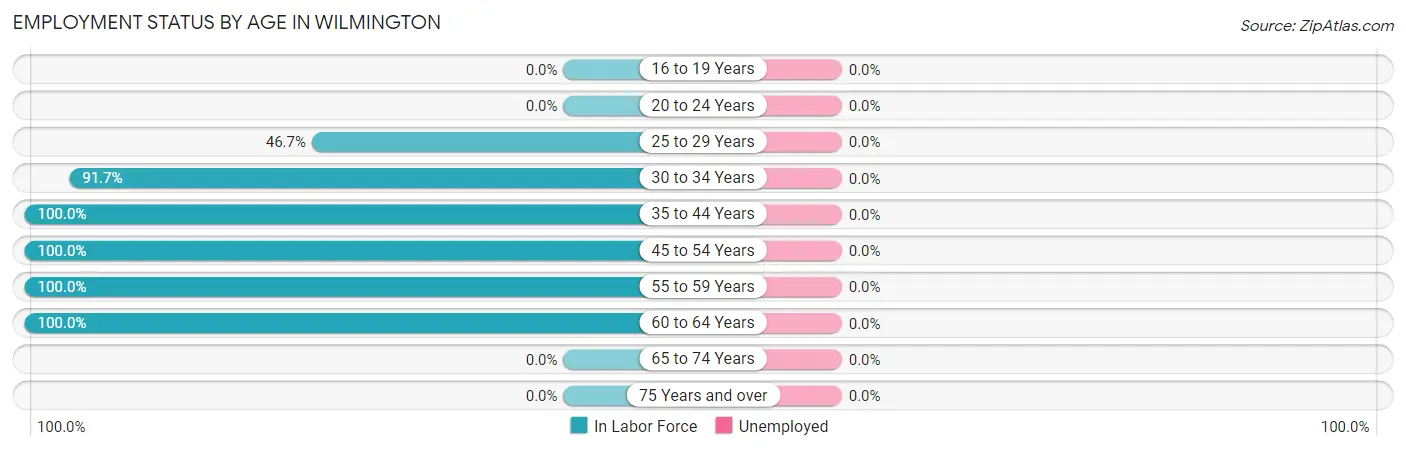
| Age Bracket | In Labor Force | Unemployed |
| 16 to 19 Years | 0 (0.0%) | 0 (0.0%) |
| 20 to 24 Years | 0 (0.0%) | 0 (0.0%) |
| 25 to 29 Years | 14 (46.7%) | 0 (0.0%) |
| 30 to 34 Years | 33 (91.7%) | 0 (0.0%) |
| 35 to 44 Years | 26 (100.0%) | 0 (0.0%) |
| 45 to 54 Years | 12 (100.0%) | 0 (0.0%) |
| 55 to 59 Years | 14 (100.0%) | 0 (0.0%) |
| 60 to 64 Years | 39 (100.0%) | 0 (0.0%) |
| 65 to 74 Years | 0 (0.0%) | 0 (0.0%) |
| 75 Years and over | 0 (0.0%) | 0 (0.0%) |
| Total | 138 (49.6%) | 0 (0.0%) |
Employment Status by Educational Attainment in Wilmington
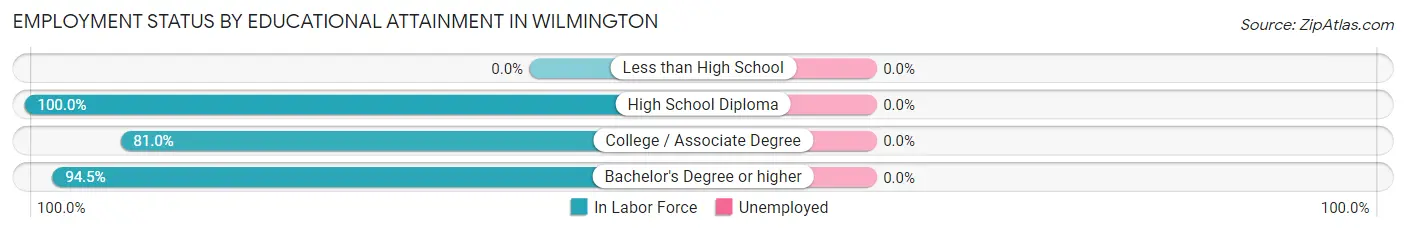
| Educational Attainment | In Labor Force | Unemployed |
| Less than High School | 0 (0.0%) | 0 (0.0%) |
| High School Diploma | 18 (100.0%) | 0 (0.0%) |
| College / Associate Degree | 68 (81.0%) | 0 (0.0%) |
| Bachelor's Degree or higher | 52 (94.5%) | 0 (0.0%) |
| Total | 138 (87.9%) | 0 (0.0%) |
Employment Occupations by Sex in Wilmington
Management, Business, Science and Arts Occupations
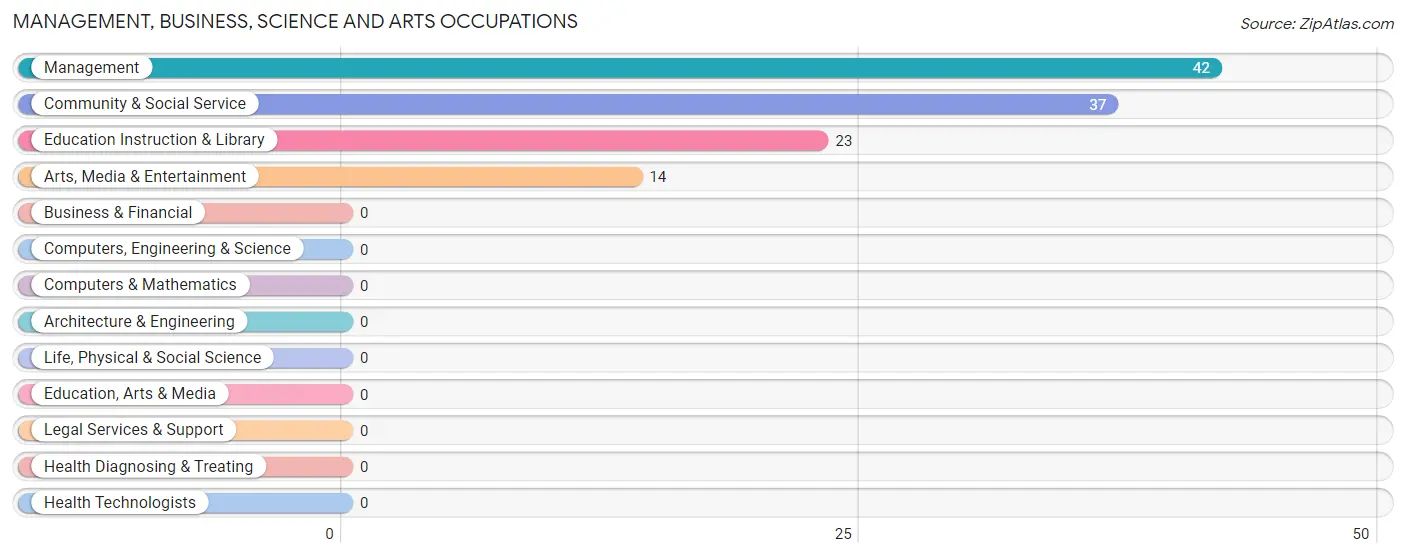
The most common Management, Business, Science and Arts occupations in Wilmington are Management (42 | 30.4%), Community & Social Service (37 | 26.8%), Education Instruction & Library (23 | 16.7%), and Arts, Media & Entertainment (14 | 10.1%).
Management, Business, Science and Arts Occupations by Sex
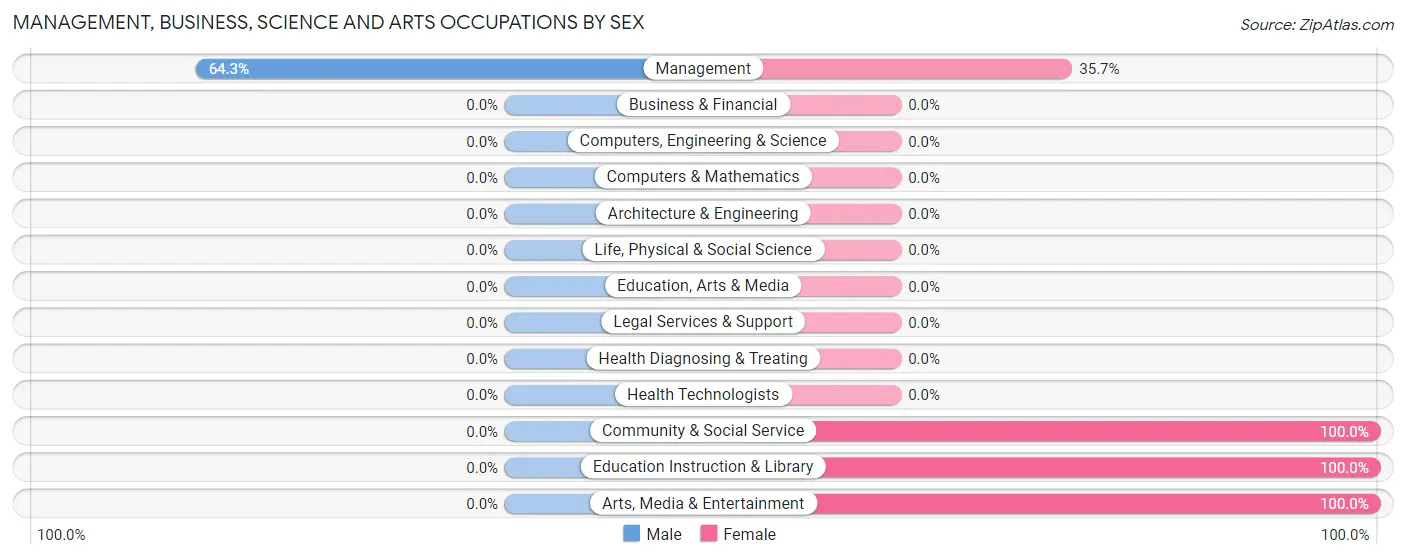
| Occupation | Male | Female |
| Management | 27 (64.3%) | 15 (35.7%) |
| Business & Financial | 0 (0.0%) | 0 (0.0%) |
| Computers, Engineering & Science | 0 (0.0%) | 0 (0.0%) |
| Computers & Mathematics | 0 (0.0%) | 0 (0.0%) |
| Architecture & Engineering | 0 (0.0%) | 0 (0.0%) |
| Life, Physical & Social Science | 0 (0.0%) | 0 (0.0%) |
| Community & Social Service | 0 (0.0%) | 37 (100.0%) |
| Education, Arts & Media | 0 (0.0%) | 0 (0.0%) |
| Legal Services & Support | 0 (0.0%) | 0 (0.0%) |
| Education Instruction & Library | 0 (0.0%) | 23 (100.0%) |
| Arts, Media & Entertainment | 0 (0.0%) | 14 (100.0%) |
| Health Diagnosing & Treating | 0 (0.0%) | 0 (0.0%) |
| Health Technologists | 0 (0.0%) | 0 (0.0%) |
| Total (Category) | 27 (34.2%) | 52 (65.8%) |
| Total (Overall) | 80 (58.0%) | 58 (42.0%) |
Services Occupations
Services Occupations by Sex
| Occupation | Male | Female |
| Healthcare Support | 0 (0.0%) | 0 (0.0%) |
| Security & Protection | 0 (0.0%) | 0 (0.0%) |
| Firefighting & Prevention | 0 (0.0%) | 0 (0.0%) |
| Law Enforcement | 0 (0.0%) | 0 (0.0%) |
| Food Preparation & Serving | 0 (0.0%) | 0 (0.0%) |
| Cleaning & Maintenance | 0 (0.0%) | 0 (0.0%) |
| Personal Care & Service | 0 (0.0%) | 0 (0.0%) |
| Total (Category) | 0 (0.0%) | 0 (0.0%) |
| Total (Overall) | 80 (58.0%) | 58 (42.0%) |
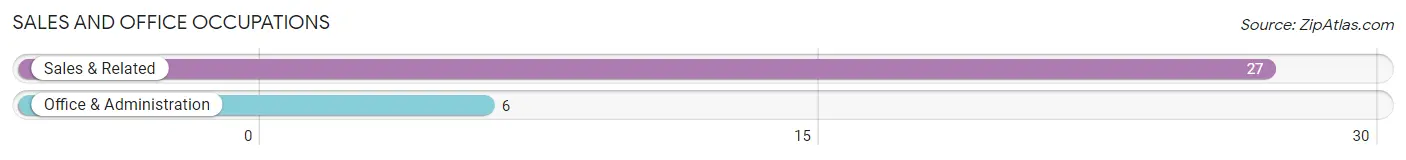
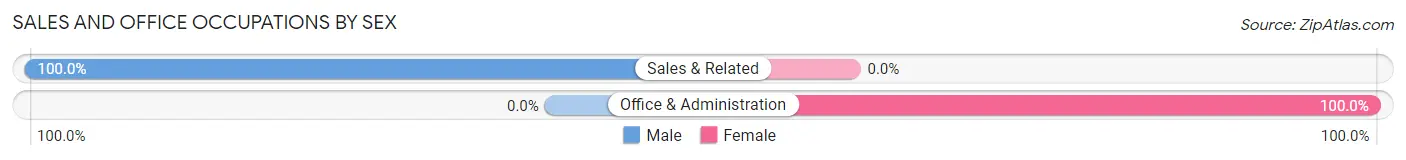
Sales and Office Occupations
The most common Sales and Office occupations in Wilmington are Sales & Related (27 | 19.6%), and Office & Administration (6 | 4.3%).
Sales and Office Occupations by Sex
| Occupation | Male | Female |
| Sales & Related | 27 (100.0%) | 0 (0.0%) |
| Office & Administration | 0 (0.0%) | 6 (100.0%) |
| Total (Category) | 27 (81.8%) | 6 (18.2%) |
| Total (Overall) | 80 (58.0%) | 58 (42.0%) |
Natural Resources, Construction and Maintenance Occupations
The most common Natural Resources, Construction and Maintenance occupations in Wilmington are , and Construction & Extraction (26 | 18.8%).
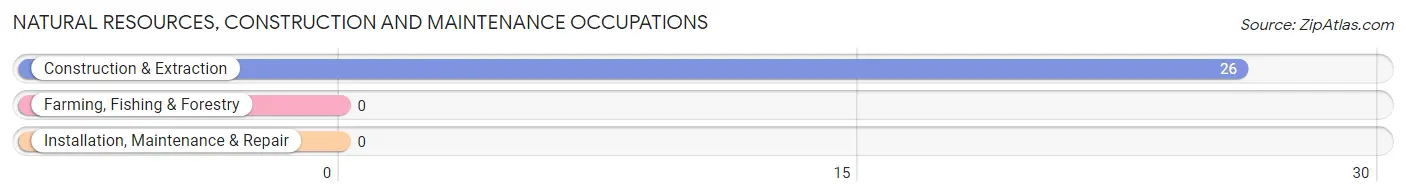
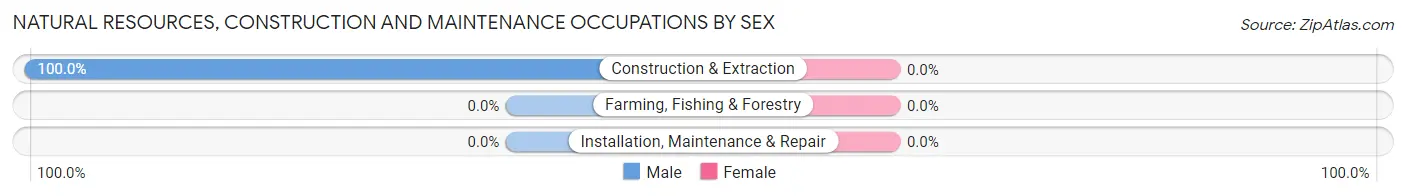
Natural Resources, Construction and Maintenance Occupations by Sex
| Occupation | Male | Female |
| Farming, Fishing & Forestry | 0 (0.0%) | 0 (0.0%) |
| Construction & Extraction | 26 (100.0%) | 0 (0.0%) |
| Installation, Maintenance & Repair | 0 (0.0%) | 0 (0.0%) |
| Total (Category) | 26 (100.0%) | 0 (0.0%) |
| Total (Overall) | 80 (58.0%) | 58 (42.0%) |
Production, Transportation and Moving Occupations
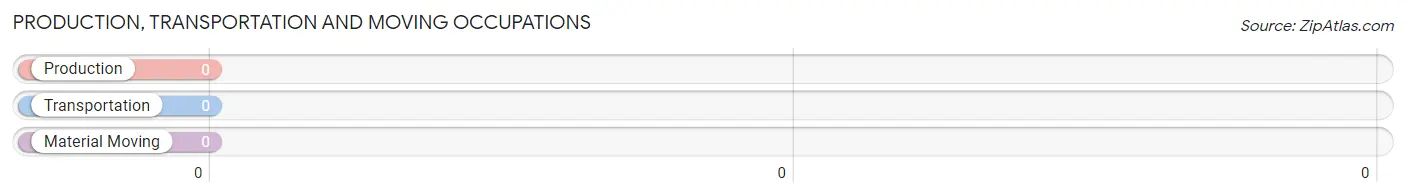
Production, Transportation and Moving Occupations by Sex
| Occupation | Male | Female |
| Production | 0 (0.0%) | 0 (0.0%) |
| Transportation | 0 (0.0%) | 0 (0.0%) |
| Material Moving | 0 (0.0%) | 0 (0.0%) |
| Total (Category) | 0 (0.0%) | 0 (0.0%) |
| Total (Overall) | 80 (58.0%) | 58 (42.0%) |
Employment Industries by Sex in Wilmington
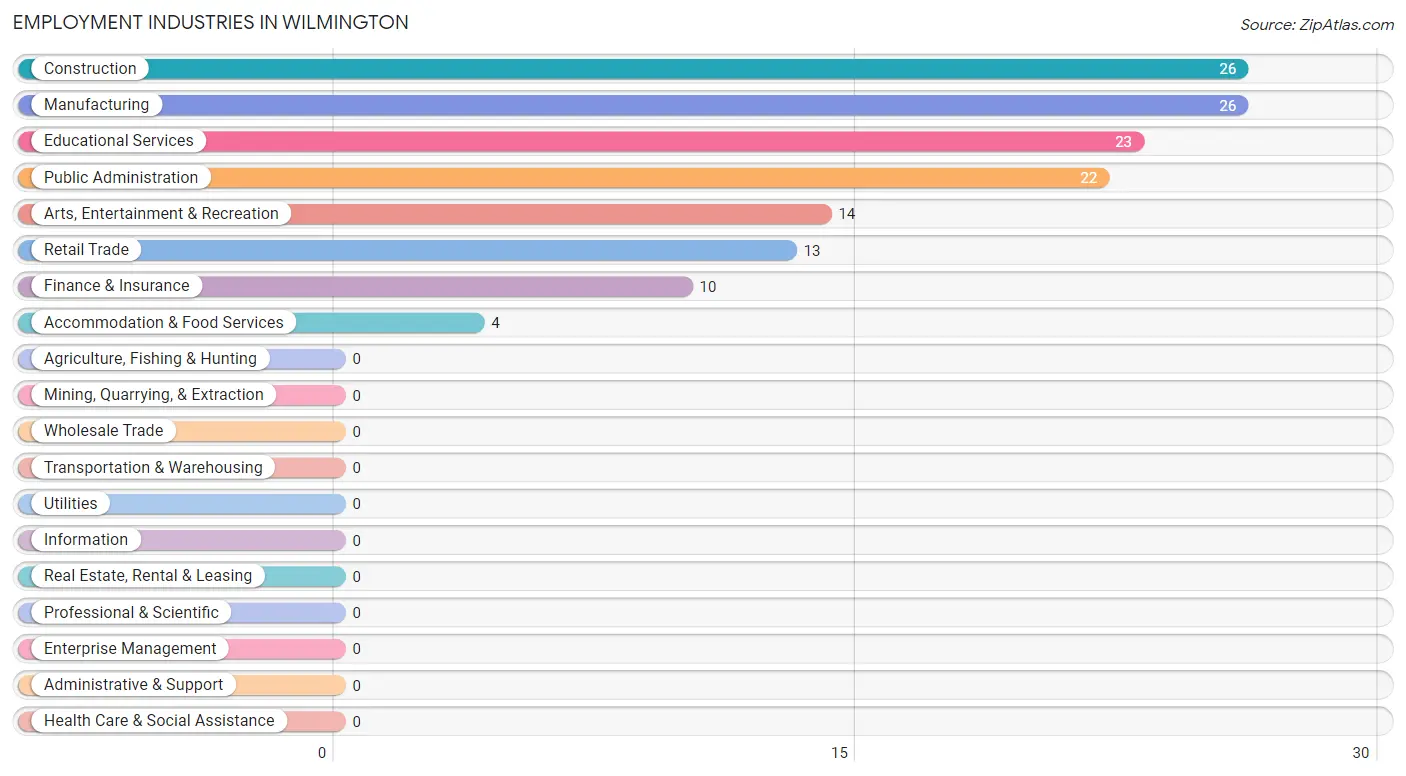
Employment Industries in Wilmington
The major employment industries in Wilmington include Construction (26 | 18.8%), Manufacturing (26 | 18.8%), Educational Services (23 | 16.7%), Public Administration (22 | 15.9%), and Arts, Entertainment & Recreation (14 | 10.1%).
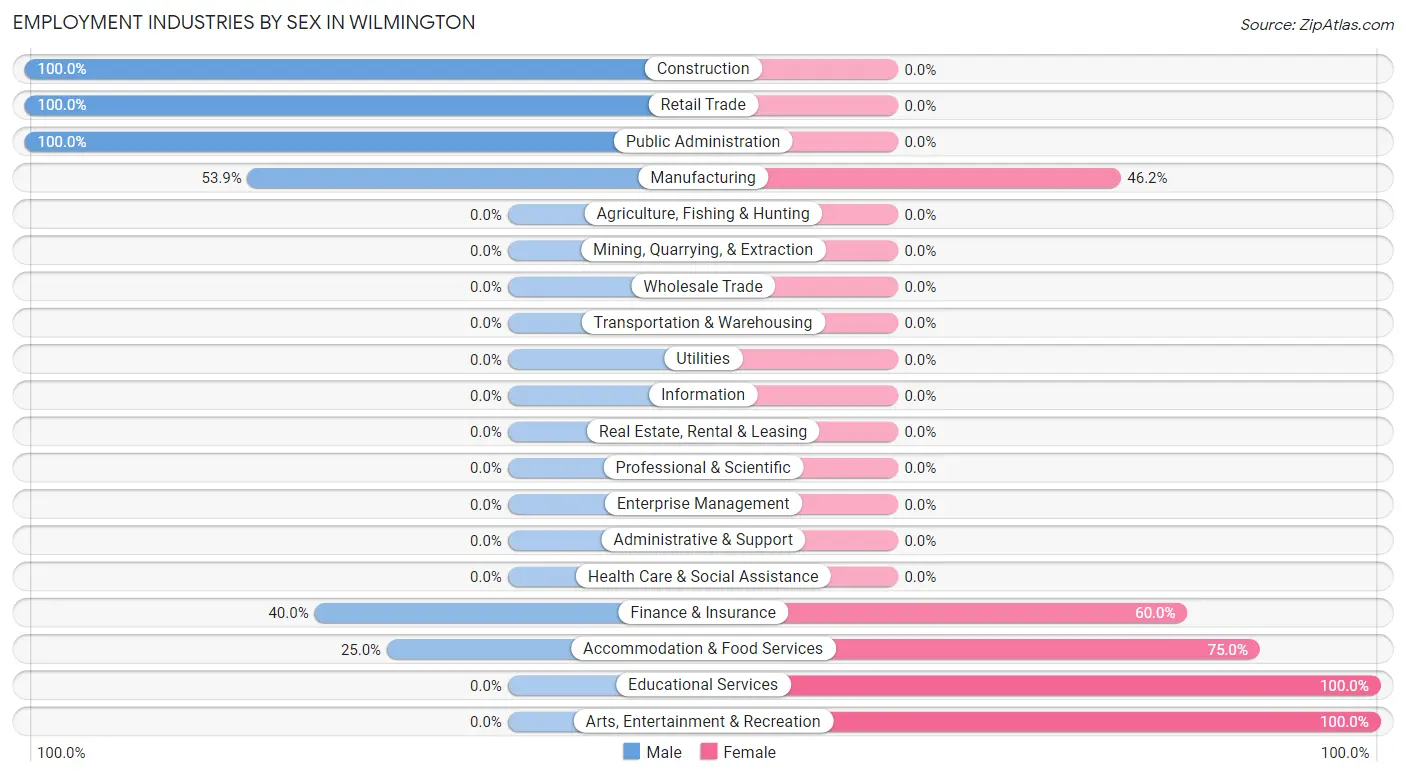
Employment Industries by Sex in Wilmington
The Wilmington industries that see more men than women are Construction (100.0%), Retail Trade (100.0%), and Public Administration (100.0%), whereas the industries that tend to have a higher number of women are Educational Services (100.0%), Arts, Entertainment & Recreation (100.0%), and Accommodation & Food Services (75.0%).
| Industry | Male | Female |
| Agriculture, Fishing & Hunting | 0 (0.0%) | 0 (0.0%) |
| Mining, Quarrying, & Extraction | 0 (0.0%) | 0 (0.0%) |
| Construction | 26 (100.0%) | 0 (0.0%) |
| Manufacturing | 14 (53.8%) | 12 (46.2%) |
| Wholesale Trade | 0 (0.0%) | 0 (0.0%) |
| Retail Trade | 13 (100.0%) | 0 (0.0%) |
| Transportation & Warehousing | 0 (0.0%) | 0 (0.0%) |
| Utilities | 0 (0.0%) | 0 (0.0%) |
| Information | 0 (0.0%) | 0 (0.0%) |
| Finance & Insurance | 4 (40.0%) | 6 (60.0%) |
| Real Estate, Rental & Leasing | 0 (0.0%) | 0 (0.0%) |
| Professional & Scientific | 0 (0.0%) | 0 (0.0%) |
| Enterprise Management | 0 (0.0%) | 0 (0.0%) |
| Administrative & Support | 0 (0.0%) | 0 (0.0%) |
| Educational Services | 0 (0.0%) | 23 (100.0%) |
| Health Care & Social Assistance | 0 (0.0%) | 0 (0.0%) |
| Arts, Entertainment & Recreation | 0 (0.0%) | 14 (100.0%) |
| Accommodation & Food Services | 1 (25.0%) | 3 (75.0%) |
| Public Administration | 22 (100.0%) | 0 (0.0%) |
| Total | 80 (58.0%) | 58 (42.0%) |
Education in Wilmington
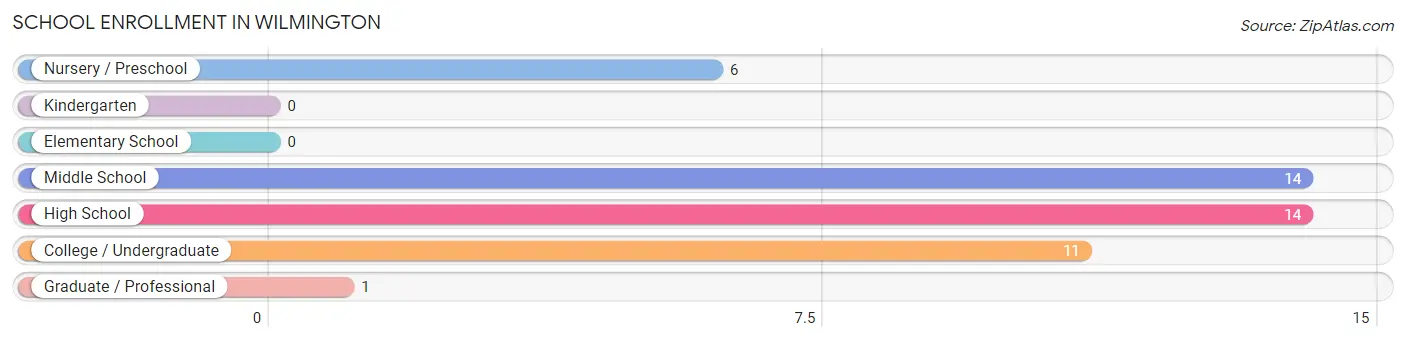
School Enrollment in Wilmington
The most common levels of schooling among the 46 students in Wilmington are middle school (14 | 30.4%), high school (14 | 30.4%), and college / undergraduate (11 | 23.9%).
| School Level | # Students | % Students |
| Nursery / Preschool | 6 | 13.0% |
| Kindergarten | 0 | 0.0% |
| Elementary School | 0 | 0.0% |
| Middle School | 14 | 30.4% |
| High School | 14 | 30.4% |
| College / Undergraduate | 11 | 23.9% |
| Graduate / Professional | 1 | 2.2% |
| Total | 46 | 100.0% |
School Enrollment by Age by Funding Source in Wilmington
Out of a total of 46 students who are enrolled in schools in Wilmington, 1 (2.2%) attend a private institution, while the remaining 45 (97.8%) are enrolled in public schools. The age group of 35 years and over has the highest likelihood of being enrolled in private schools, with 1 (8.3% in the age bracket) enrolled. Conversely, the age group of 5 to 9 year old has the lowest likelihood of being enrolled in a private school, with 6 (100.0% in the age bracket) attending a public institution.
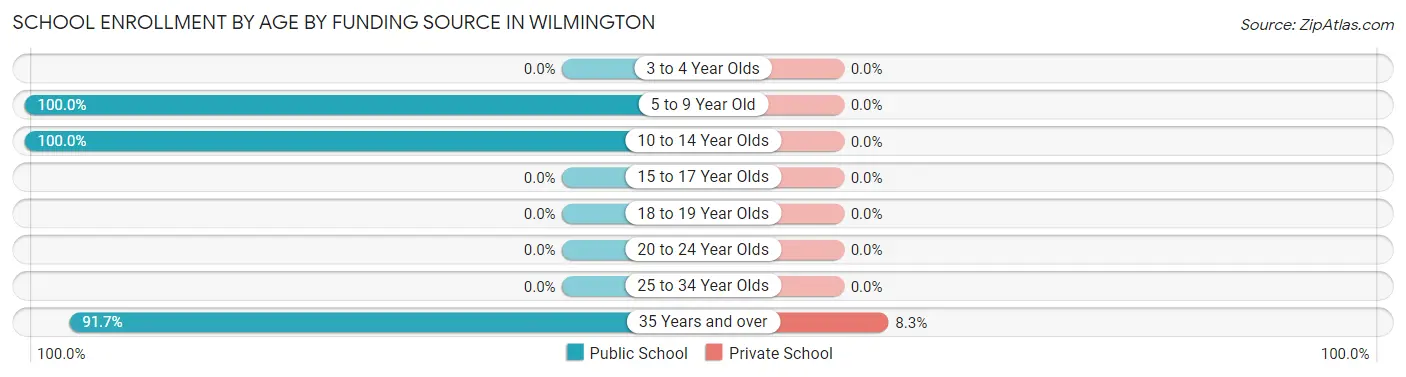
| Age Bracket | Public School | Private School |
| 3 to 4 Year Olds | 0 (0.0%) | 0 (0.0%) |
| 5 to 9 Year Old | 6 (100.0%) | 0 (0.0%) |
| 10 to 14 Year Olds | 28 (100.0%) | 0 (0.0%) |
| 15 to 17 Year Olds | 0 (0.0%) | 0 (0.0%) |
| 18 to 19 Year Olds | 0 (0.0%) | 0 (0.0%) |
| 20 to 24 Year Olds | 0 (0.0%) | 0 (0.0%) |
| 25 to 34 Year Olds | 0 (0.0%) | 0 (0.0%) |
| 35 Years and over | 11 (91.7%) | 1 (8.3%) |
| Total | 45 (97.8%) | 1 (2.2%) |
Educational Attainment by Field of Study in Wilmington
Social sciences (56 | 37.3%), visual & performing arts (22 | 14.7%), arts & humanities (22 | 14.7%), education (16 | 10.7%), and literature & languages (15 | 10.0%) are the most common fields of study among 150 individuals in Wilmington who have obtained a bachelor's degree or higher.
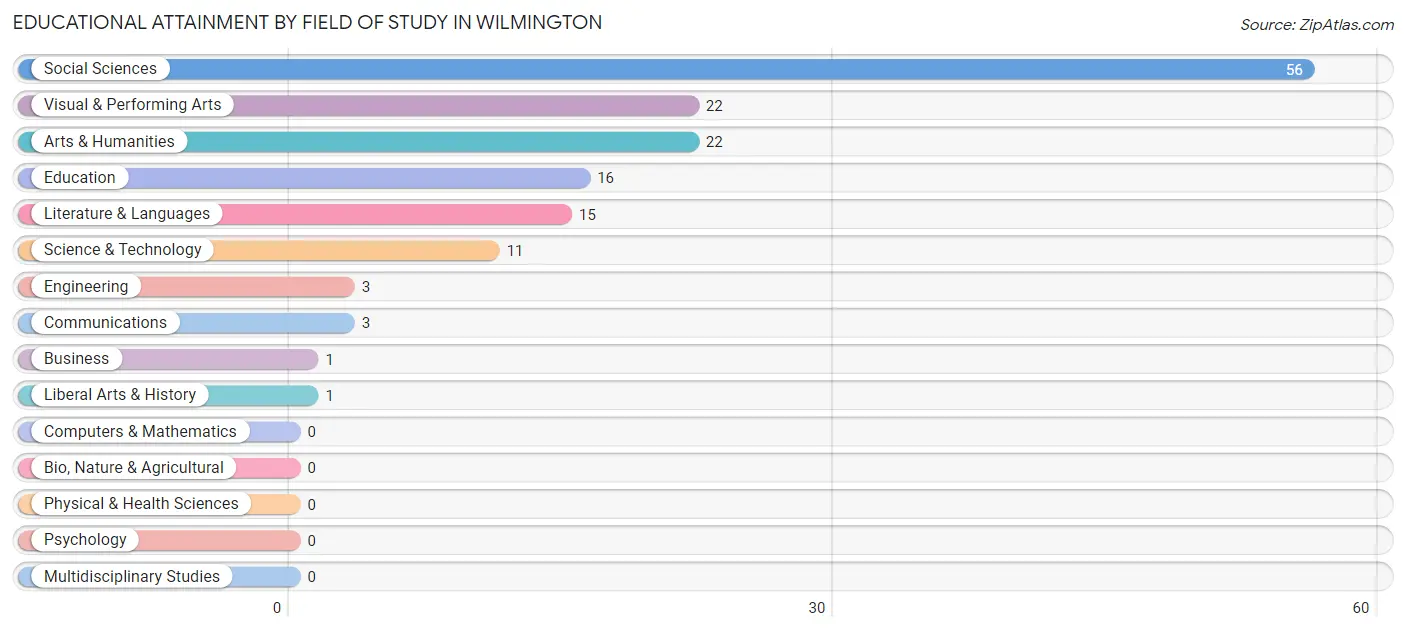
| Field of Study | # Graduates | % Graduates |
| Computers & Mathematics | 0 | 0.0% |
| Bio, Nature & Agricultural | 0 | 0.0% |
| Physical & Health Sciences | 0 | 0.0% |
| Psychology | 0 | 0.0% |
| Social Sciences | 56 | 37.3% |
| Engineering | 3 | 2.0% |
| Multidisciplinary Studies | 0 | 0.0% |
| Science & Technology | 11 | 7.3% |
| Business | 1 | 0.7% |
| Education | 16 | 10.7% |
| Literature & Languages | 15 | 10.0% |
| Liberal Arts & History | 1 | 0.7% |
| Visual & Performing Arts | 22 | 14.7% |
| Communications | 3 | 2.0% |
| Arts & Humanities | 22 | 14.7% |
| Total | 150 | 100.0% |
Transportation & Commute in Wilmington
Vehicle Availability by Sex in Wilmington
The most prevalent vehicle ownership categories in Wilmington are males with 3 vehicles (30, accounting for 37.5%) and females with 3 vehicles (36, making up 51.7%).
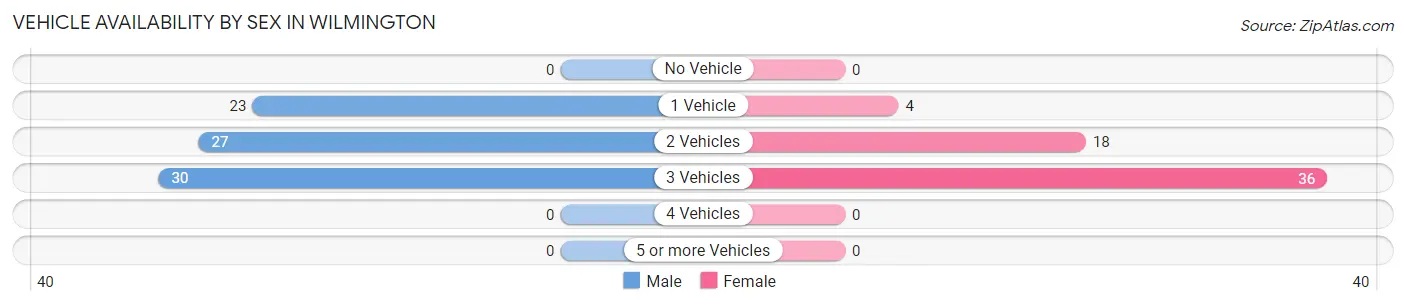
| Vehicles Available | Male | Female |
| No Vehicle | 0 (0.0%) | 0 (0.0%) |
| 1 Vehicle | 23 (28.7%) | 4 (6.9%) |
| 2 Vehicles | 27 (33.8%) | 18 (31.0%) |
| 3 Vehicles | 30 (37.5%) | 36 (62.1%) |
| 4 Vehicles | 0 (0.0%) | 0 (0.0%) |
| 5 or more Vehicles | 0 (0.0%) | 0 (0.0%) |
| Total | 80 (100.0%) | 58 (100.0%) |
Commute Time in Wilmington
The most frequently occuring commute durations in Wilmington are 5 to 9 minutes (36 commuters, 34.9%), 10 to 14 minutes (31 commuters, 30.1%), and less than 5 minutes (15 commuters, 14.6%).
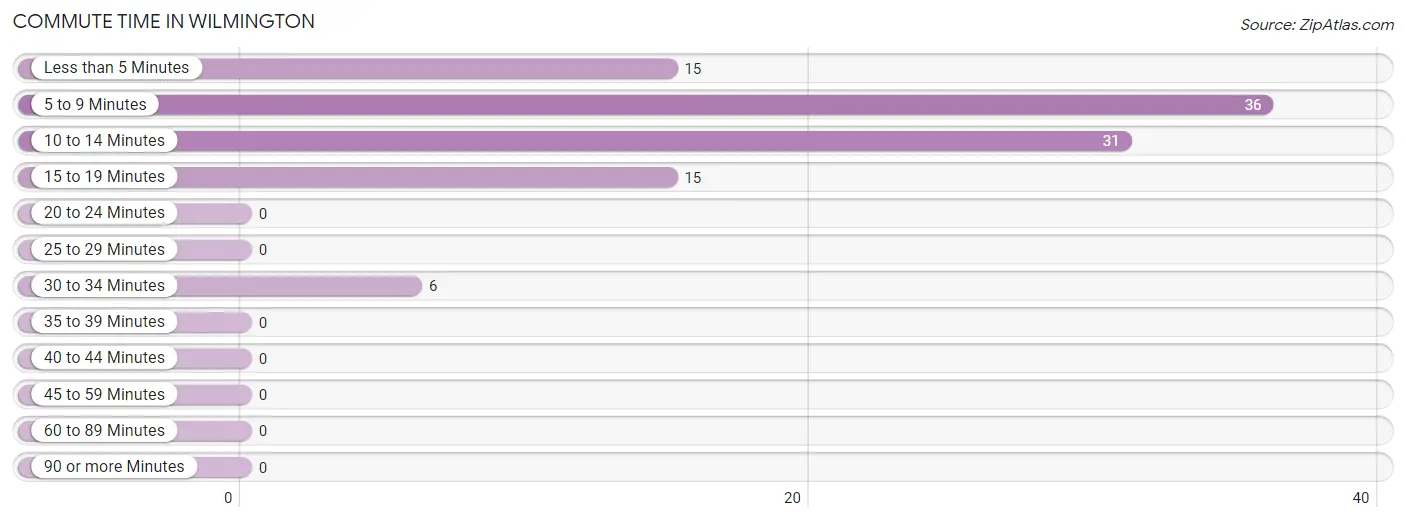
| Commute Time | # Commuters | % Commuters |
| Less than 5 Minutes | 15 | 14.6% |
| 5 to 9 Minutes | 36 | 34.9% |
| 10 to 14 Minutes | 31 | 30.1% |
| 15 to 19 Minutes | 15 | 14.6% |
| 20 to 24 Minutes | 0 | 0.0% |
| 25 to 29 Minutes | 0 | 0.0% |
| 30 to 34 Minutes | 6 | 5.8% |
| 35 to 39 Minutes | 0 | 0.0% |
| 40 to 44 Minutes | 0 | 0.0% |
| 45 to 59 Minutes | 0 | 0.0% |
| 60 to 89 Minutes | 0 | 0.0% |
| 90 or more Minutes | 0 | 0.0% |
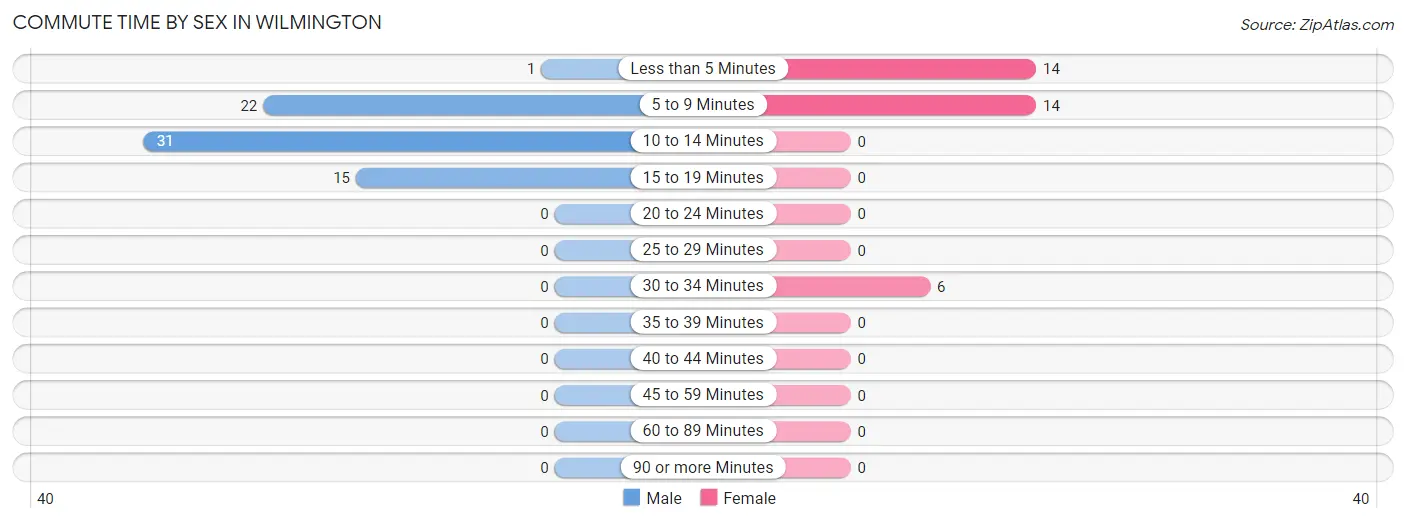
Commute Time by Sex in Wilmington
The most common commute times in Wilmington are 10 to 14 minutes (31 commuters, 44.9%) for males and less than 5 minutes (14 commuters, 41.2%) for females.
| Commute Time | Male | Female |
| Less than 5 Minutes | 1 (1.5%) | 14 (41.2%) |
| 5 to 9 Minutes | 22 (31.9%) | 14 (41.2%) |
| 10 to 14 Minutes | 31 (44.9%) | 0 (0.0%) |
| 15 to 19 Minutes | 15 (21.7%) | 0 (0.0%) |
| 20 to 24 Minutes | 0 (0.0%) | 0 (0.0%) |
| 25 to 29 Minutes | 0 (0.0%) | 0 (0.0%) |
| 30 to 34 Minutes | 0 (0.0%) | 6 (17.6%) |
| 35 to 39 Minutes | 0 (0.0%) | 0 (0.0%) |
| 40 to 44 Minutes | 0 (0.0%) | 0 (0.0%) |
| 45 to 59 Minutes | 0 (0.0%) | 0 (0.0%) |
| 60 to 89 Minutes | 0 (0.0%) | 0 (0.0%) |
| 90 or more Minutes | 0 (0.0%) | 0 (0.0%) |
Time of Departure to Work by Sex in Wilmington
The most frequent times of departure to work in Wilmington are 7:30 AM to 7:59 AM (50, 72.5%) for males and 6:30 AM to 6:59 AM (34, 100.0%) for females.

| Time of Departure | Male | Female |
| 12:00 AM to 4:59 AM | 0 (0.0%) | 0 (0.0%) |
| 5:00 AM to 5:29 AM | 0 (0.0%) | 0 (0.0%) |
| 5:30 AM to 5:59 AM | 0 (0.0%) | 0 (0.0%) |
| 6:00 AM to 6:29 AM | 0 (0.0%) | 0 (0.0%) |
| 6:30 AM to 6:59 AM | 4 (5.8%) | 34 (100.0%) |
| 7:00 AM to 7:29 AM | 1 (1.5%) | 0 (0.0%) |
| 7:30 AM to 7:59 AM | 50 (72.5%) | 0 (0.0%) |
| 8:00 AM to 8:29 AM | 14 (20.3%) | 0 (0.0%) |
| 8:30 AM to 8:59 AM | 0 (0.0%) | 0 (0.0%) |
| 9:00 AM to 9:59 AM | 0 (0.0%) | 0 (0.0%) |
| 10:00 AM to 10:59 AM | 0 (0.0%) | 0 (0.0%) |
| 11:00 AM to 11:59 AM | 0 (0.0%) | 0 (0.0%) |
| 12:00 PM to 3:59 PM | 0 (0.0%) | 0 (0.0%) |
| 4:00 PM to 11:59 PM | 0 (0.0%) | 0 (0.0%) |
| Total | 69 (100.0%) | 34 (100.0%) |
Housing Occupancy in Wilmington
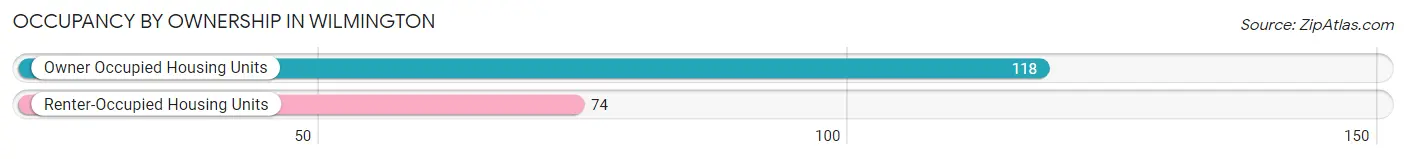
Occupancy by Ownership in Wilmington
Of the total 192 dwellings in Wilmington, owner-occupied units account for 118 (61.5%), while renter-occupied units make up 74 (38.5%).
| Occupancy | # Housing Units | % Housing Units |
| Owner Occupied Housing Units | 118 | 61.5% |
| Renter-Occupied Housing Units | 74 | 38.5% |
| Total Occupied Housing Units | 192 | 100.0% |
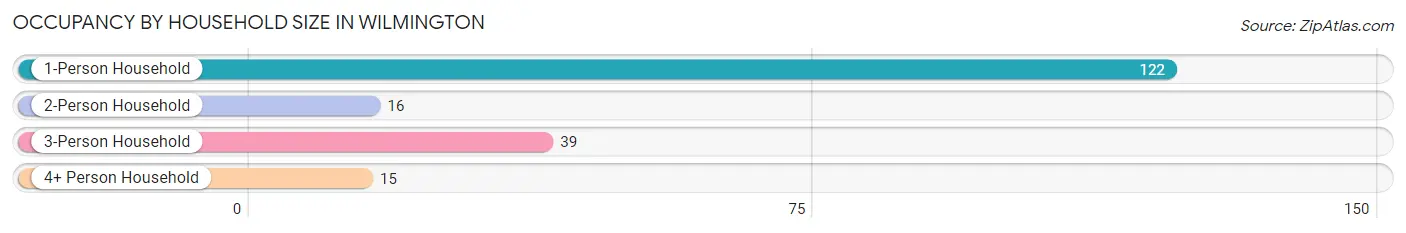
Occupancy by Household Size in Wilmington
| Household Size | # Housing Units | % Housing Units |
| 1-Person Household | 122 | 63.5% |
| 2-Person Household | 16 | 8.3% |
| 3-Person Household | 39 | 20.3% |
| 4+ Person Household | 15 | 7.8% |
| Total Housing Units | 192 | 100.0% |
Occupancy by Ownership by Household Size in Wilmington
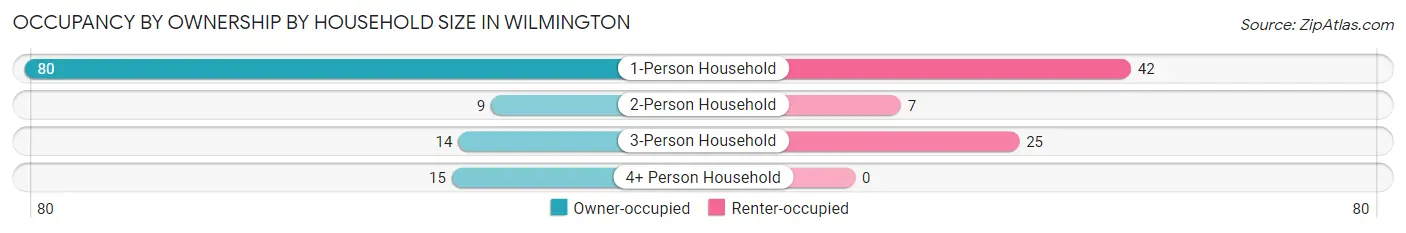
| Household Size | Owner-occupied | Renter-occupied |
| 1-Person Household | 80 (65.6%) | 42 (34.4%) |
| 2-Person Household | 9 (56.2%) | 7 (43.8%) |
| 3-Person Household | 14 (35.9%) | 25 (64.1%) |
| 4+ Person Household | 15 (100.0%) | 0 (0.0%) |
| Total Housing Units | 118 (61.5%) | 74 (38.5%) |
Occupancy by Educational Attainment in Wilmington
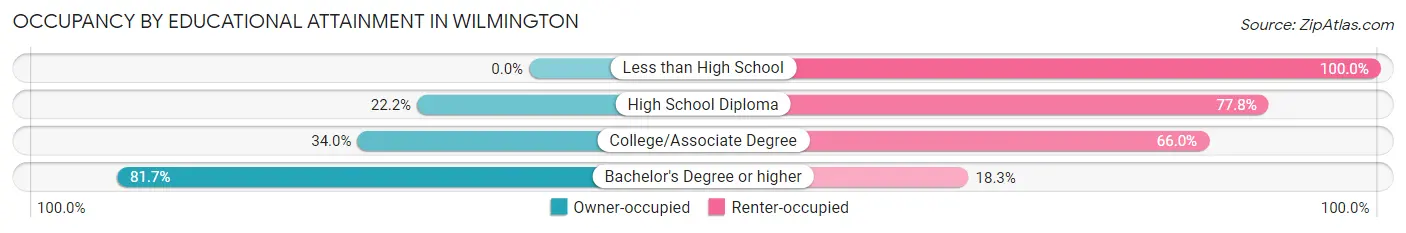
| Household Size | Owner-occupied | Renter-occupied |
| Less than High School | 0 (0.0%) | 7 (100.0%) |
| High School Diploma | 4 (22.2%) | 14 (77.8%) |
| College/Associate Degree | 16 (34.0%) | 31 (66.0%) |
| Bachelor's Degree or higher | 98 (81.7%) | 22 (18.3%) |
Occupancy by Age of Householder in Wilmington
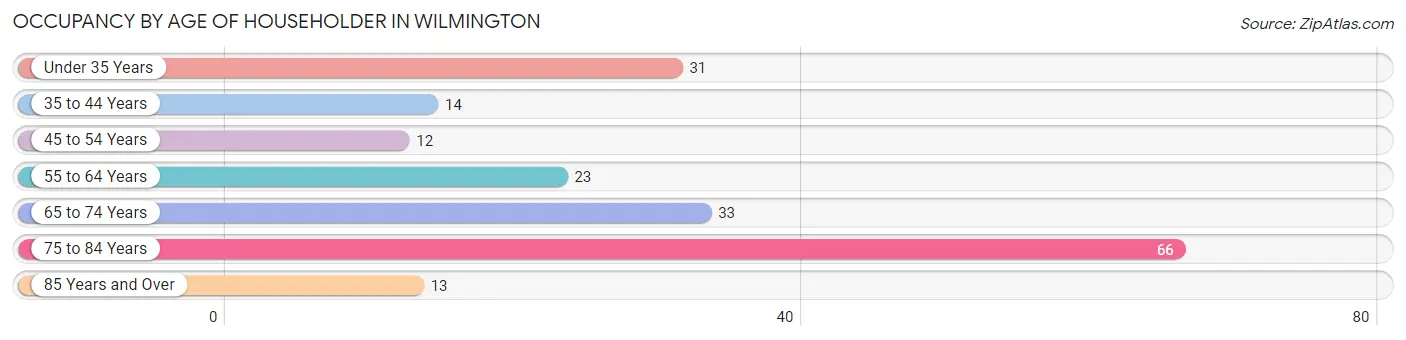
| Age Bracket | # Households | % Households |
| Under 35 Years | 31 | 16.2% |
| 35 to 44 Years | 14 | 7.3% |
| 45 to 54 Years | 12 | 6.2% |
| 55 to 64 Years | 23 | 12.0% |
| 65 to 74 Years | 33 | 17.2% |
| 75 to 84 Years | 66 | 34.4% |
| 85 Years and Over | 13 | 6.8% |
| Total | 192 | 100.0% |
Housing Finances in Wilmington
Median Income by Occupancy in Wilmington
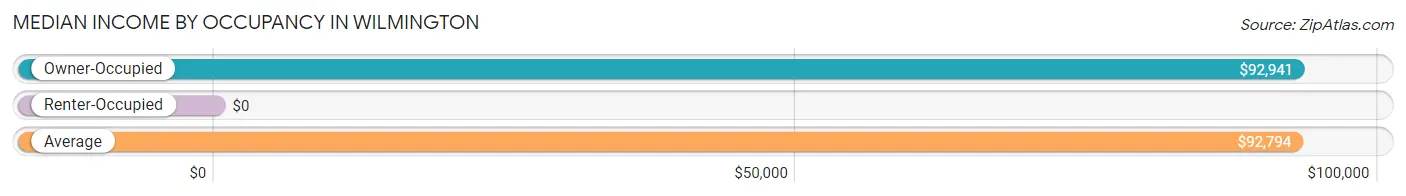
| Occupancy Type | # Households | Median Income |
| Owner-Occupied | 118 (61.5%) | $92,941 |
| Renter-Occupied | 74 (38.5%) | $0 |
| Average | 192 (100.0%) | $92,794 |
Occupancy by Householder Income Bracket in Wilmington
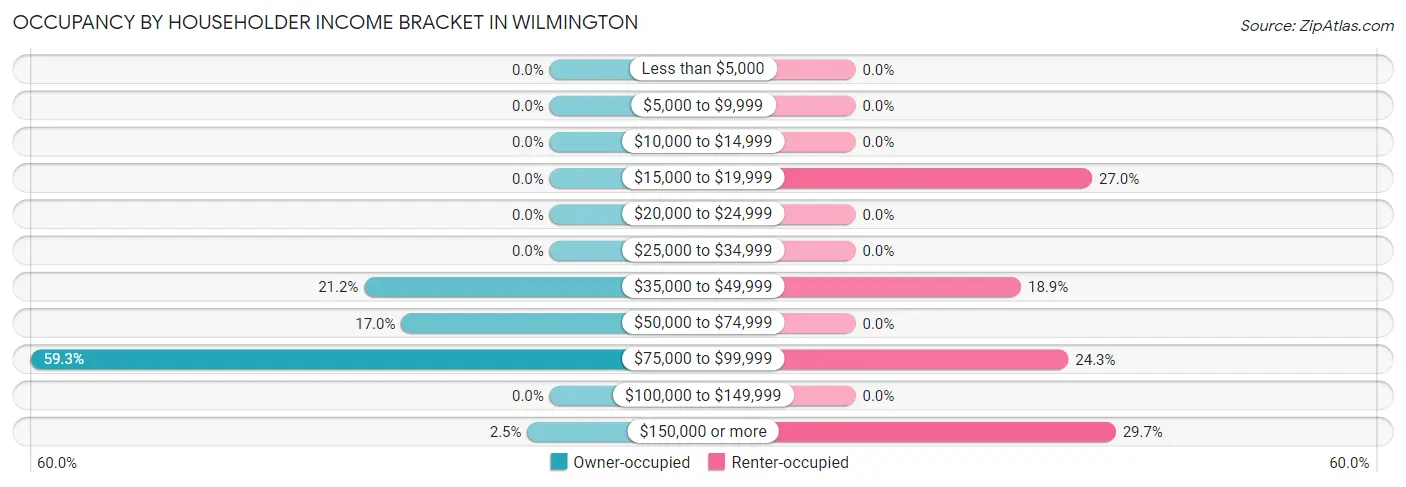
| Income Bracket | Owner-occupied | Renter-occupied |
| Less than $5,000 | 0 (0.0%) | 0 (0.0%) |
| $5,000 to $9,999 | 0 (0.0%) | 0 (0.0%) |
| $10,000 to $14,999 | 0 (0.0%) | 0 (0.0%) |
| $15,000 to $19,999 | 0 (0.0%) | 20 (27.0%) |
| $20,000 to $24,999 | 0 (0.0%) | 0 (0.0%) |
| $25,000 to $34,999 | 0 (0.0%) | 0 (0.0%) |
| $35,000 to $49,999 | 25 (21.2%) | 14 (18.9%) |
| $50,000 to $74,999 | 20 (17.0%) | 0 (0.0%) |
| $75,000 to $99,999 | 70 (59.3%) | 18 (24.3%) |
| $100,000 to $149,999 | 0 (0.0%) | 0 (0.0%) |
| $150,000 or more | 3 (2.5%) | 22 (29.7%) |
| Total | 118 (100.0%) | 74 (100.0%) |
Monthly Housing Cost Tiers in Wilmington
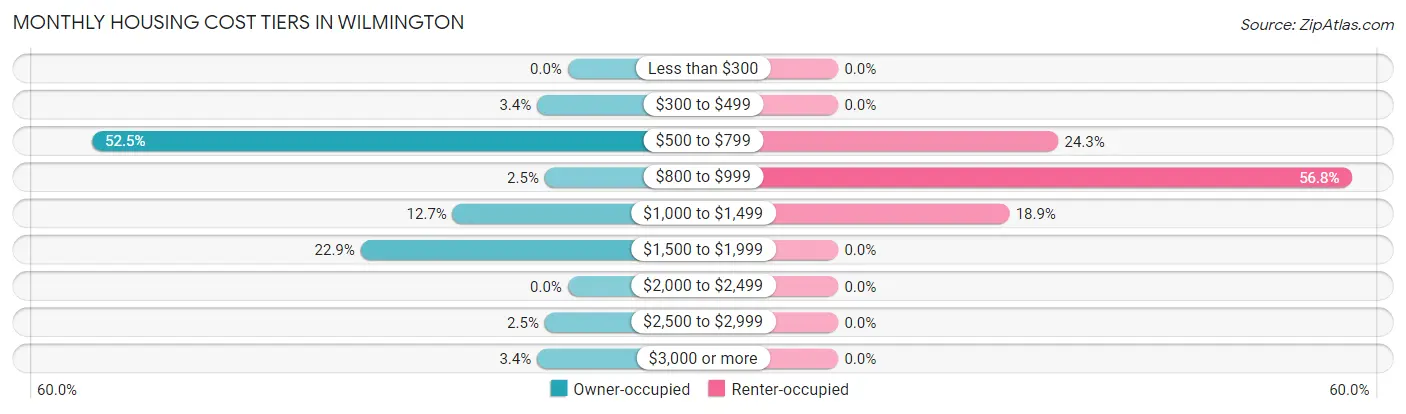
| Monthly Cost | Owner-occupied | Renter-occupied |
| Less than $300 | 0 (0.0%) | 0 (0.0%) |
| $300 to $499 | 4 (3.4%) | 0 (0.0%) |
| $500 to $799 | 62 (52.5%) | 18 (24.3%) |
| $800 to $999 | 3 (2.5%) | 42 (56.8%) |
| $1,000 to $1,499 | 15 (12.7%) | 14 (18.9%) |
| $1,500 to $1,999 | 27 (22.9%) | 0 (0.0%) |
| $2,000 to $2,499 | 0 (0.0%) | 0 (0.0%) |
| $2,500 to $2,999 | 3 (2.5%) | 0 (0.0%) |
| $3,000 or more | 4 (3.4%) | 0 (0.0%) |
| Total | 118 (100.0%) | 74 (100.0%) |
Physical Housing Characteristics in Wilmington
Housing Structures in Wilmington
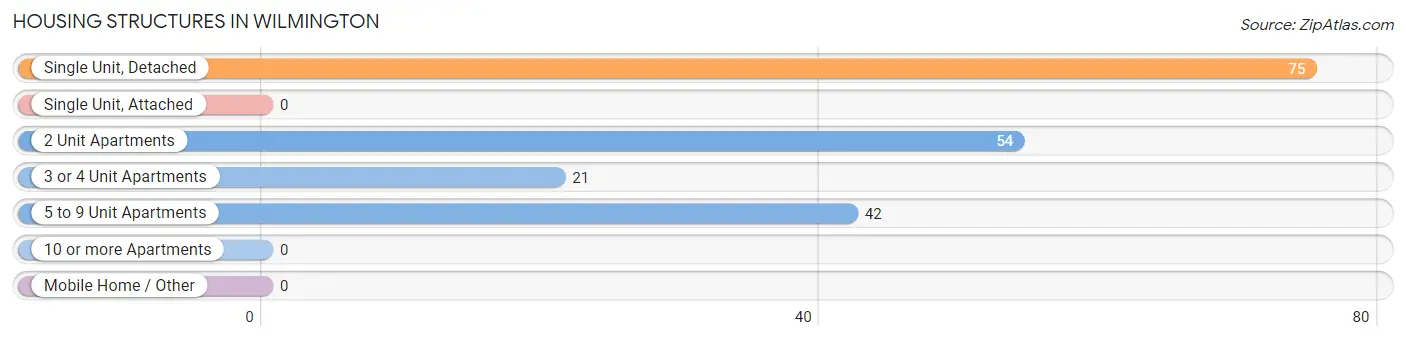
| Structure Type | # Housing Units | % Housing Units |
| Single Unit, Detached | 75 | 39.1% |
| Single Unit, Attached | 0 | 0.0% |
| 2 Unit Apartments | 54 | 28.1% |
| 3 or 4 Unit Apartments | 21 | 10.9% |
| 5 to 9 Unit Apartments | 42 | 21.9% |
| 10 or more Apartments | 0 | 0.0% |
| Mobile Home / Other | 0 | 0.0% |
| Total | 192 | 100.0% |
Housing Structures by Occupancy in Wilmington
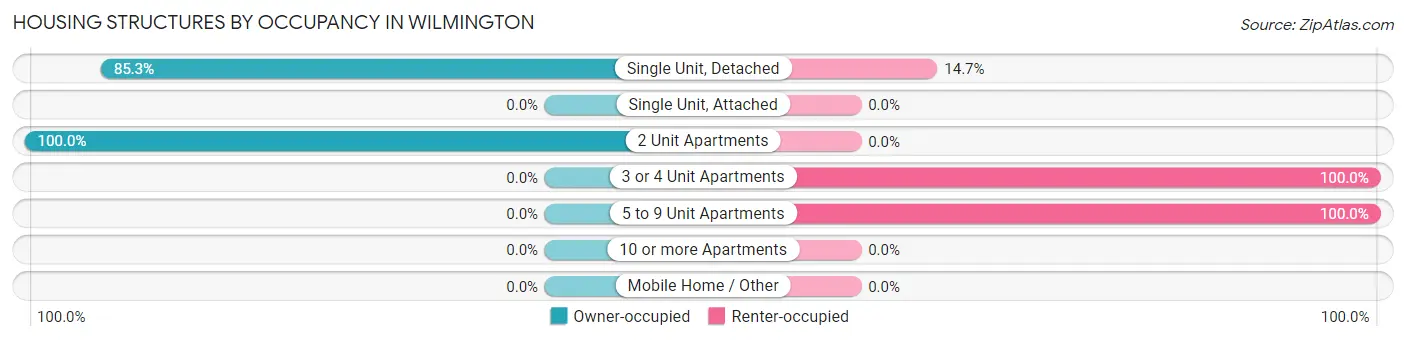
| Structure Type | Owner-occupied | Renter-occupied |
| Single Unit, Detached | 64 (85.3%) | 11 (14.7%) |
| Single Unit, Attached | 0 (0.0%) | 0 (0.0%) |
| 2 Unit Apartments | 54 (100.0%) | 0 (0.0%) |
| 3 or 4 Unit Apartments | 0 (0.0%) | 21 (100.0%) |
| 5 to 9 Unit Apartments | 0 (0.0%) | 42 (100.0%) |
| 10 or more Apartments | 0 (0.0%) | 0 (0.0%) |
| Mobile Home / Other | 0 (0.0%) | 0 (0.0%) |
| Total | 118 (61.5%) | 74 (38.5%) |
Housing Structures by Number of Rooms in Wilmington
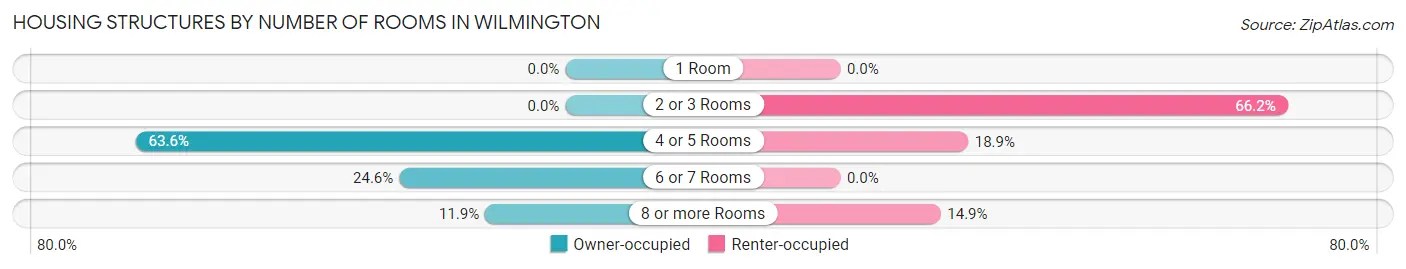
| Number of Rooms | Owner-occupied | Renter-occupied |
| 1 Room | 0 (0.0%) | 0 (0.0%) |
| 2 or 3 Rooms | 0 (0.0%) | 49 (66.2%) |
| 4 or 5 Rooms | 75 (63.6%) | 14 (18.9%) |
| 6 or 7 Rooms | 29 (24.6%) | 0 (0.0%) |
| 8 or more Rooms | 14 (11.9%) | 11 (14.9%) |
| Total | 118 (100.0%) | 74 (100.0%) |
Housing Structure by Heating Type in Wilmington
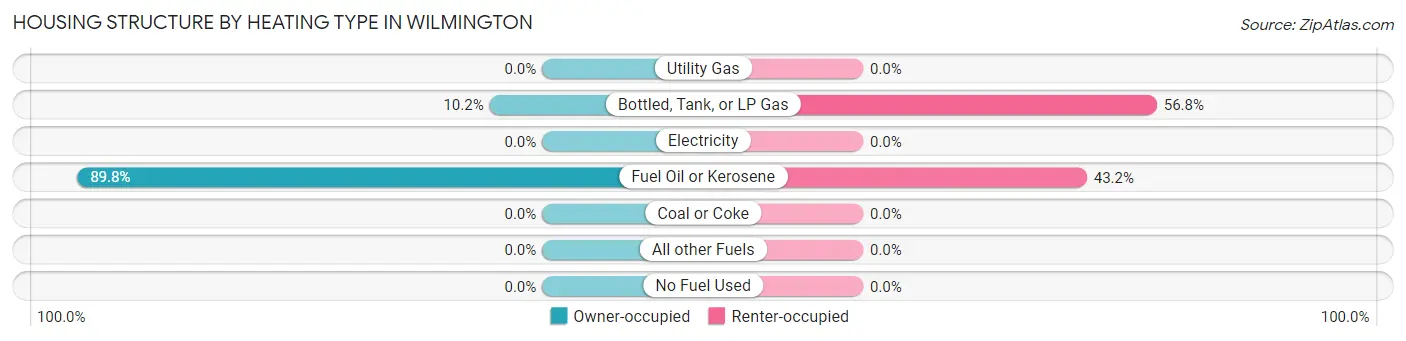
| Heating Type | Owner-occupied | Renter-occupied |
| Utility Gas | 0 (0.0%) | 0 (0.0%) |
| Bottled, Tank, or LP Gas | 12 (10.2%) | 42 (56.8%) |
| Electricity | 0 (0.0%) | 0 (0.0%) |
| Fuel Oil or Kerosene | 106 (89.8%) | 32 (43.2%) |
| Coal or Coke | 0 (0.0%) | 0 (0.0%) |
| All other Fuels | 0 (0.0%) | 0 (0.0%) |
| No Fuel Used | 0 (0.0%) | 0 (0.0%) |
| Total | 118 (100.0%) | 74 (100.0%) |
Household Vehicle Usage in Wilmington
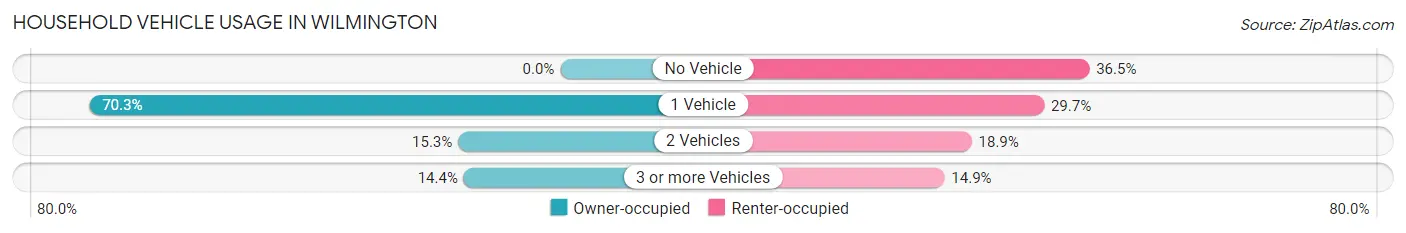
| Vehicles per Household | Owner-occupied | Renter-occupied |
| No Vehicle | 0 (0.0%) | 27 (36.5%) |
| 1 Vehicle | 83 (70.3%) | 22 (29.7%) |
| 2 Vehicles | 18 (15.2%) | 14 (18.9%) |
| 3 or more Vehicles | 17 (14.4%) | 11 (14.9%) |
| Total | 118 (100.0%) | 74 (100.0%) |
Real Estate & Mortgages in Wilmington
Real Estate and Mortgage Overview in Wilmington
| Characteristic | Without Mortgage | With Mortgage |
| Housing Units | 83 | 35 |
| Median Property Value | $266,200 | $255,000 |
| Median Household Income | $93,218 | $0 |
| Monthly Housing Costs | $760 | $4 |
| Real Estate Taxes | $4,605 | $0 |
Property Value by Mortgage Status in Wilmington
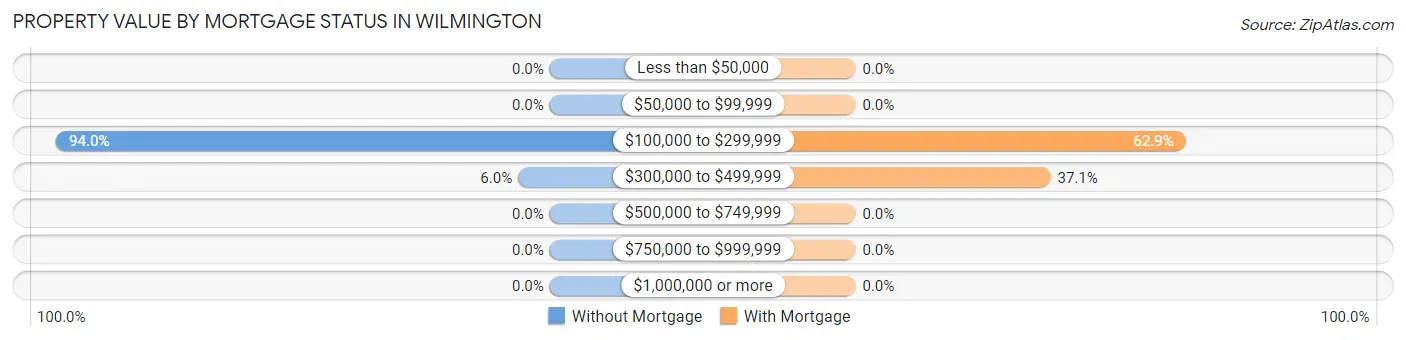
| Property Value | Without Mortgage | With Mortgage |
| Less than $50,000 | 0 (0.0%) | 0 (0.0%) |
| $50,000 to $99,999 | 0 (0.0%) | 0 (0.0%) |
| $100,000 to $299,999 | 78 (94.0%) | 22 (62.9%) |
| $300,000 to $499,999 | 5 (6.0%) | 13 (37.1%) |
| $500,000 to $749,999 | 0 (0.0%) | 0 (0.0%) |
| $750,000 to $999,999 | 0 (0.0%) | 0 (0.0%) |
| $1,000,000 or more | 0 (0.0%) | 0 (0.0%) |
| Total | 83 (100.0%) | 35 (100.0%) |
Household Income by Mortgage Status in Wilmington
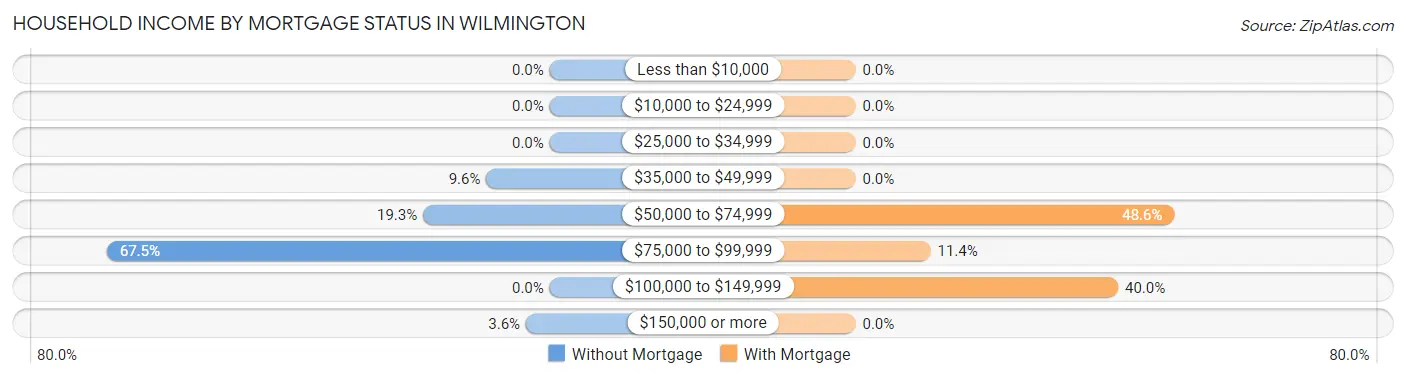
| Household Income | Without Mortgage | With Mortgage |
| Less than $10,000 | 0 (0.0%) | 0 (0.0%) |
| $10,000 to $24,999 | 0 (0.0%) | 0 (0.0%) |
| $25,000 to $34,999 | 0 (0.0%) | 0 (0.0%) |
| $35,000 to $49,999 | 8 (9.6%) | 0 (0.0%) |
| $50,000 to $74,999 | 16 (19.3%) | 17 (48.6%) |
| $75,000 to $99,999 | 56 (67.5%) | 4 (11.4%) |
| $100,000 to $149,999 | 0 (0.0%) | 14 (40.0%) |
| $150,000 or more | 3 (3.6%) | 0 (0.0%) |
| Total | 83 (100.0%) | 35 (100.0%) |
Property Value to Household Income Ratio in Wilmington
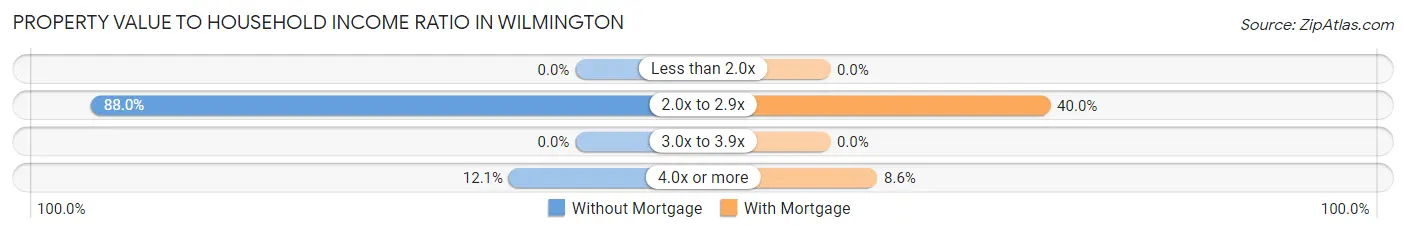
| Value-to-Income Ratio | Without Mortgage | With Mortgage |
| Less than 2.0x | 0 (0.0%) | 0 (0.0%) |
| 2.0x to 2.9x | 73 (87.9%) | 14 (40.0%) |
| 3.0x to 3.9x | 0 (0.0%) | 0 (0.0%) |
| 4.0x or more | 10 (12.0%) | 3 (8.6%) |
| Total | 83 (100.0%) | 35 (100.0%) |
Real Estate Taxes by Mortgage Status in Wilmington
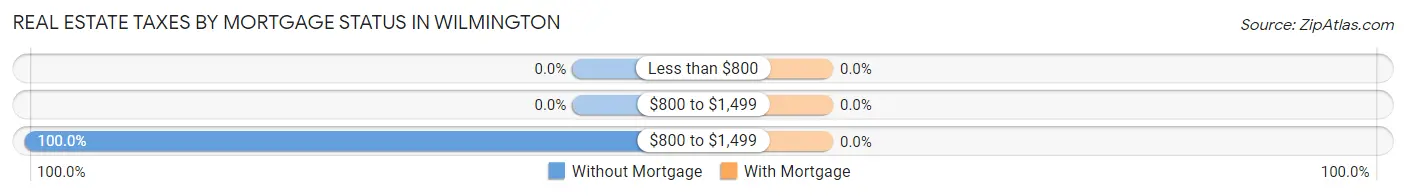
| Property Taxes | Without Mortgage | With Mortgage |
| Less than $800 | 0 (0.0%) | 0 (0.0%) |
| $800 to $1,499 | 0 (0.0%) | 0 (0.0%) |
| $800 to $1,499 | 83 (100.0%) | 0 (0.0%) |
| Total | 83 (100.0%) | 35 (100.0%) |
Health & Disability in Wilmington
Health Insurance Coverage by Age in Wilmington
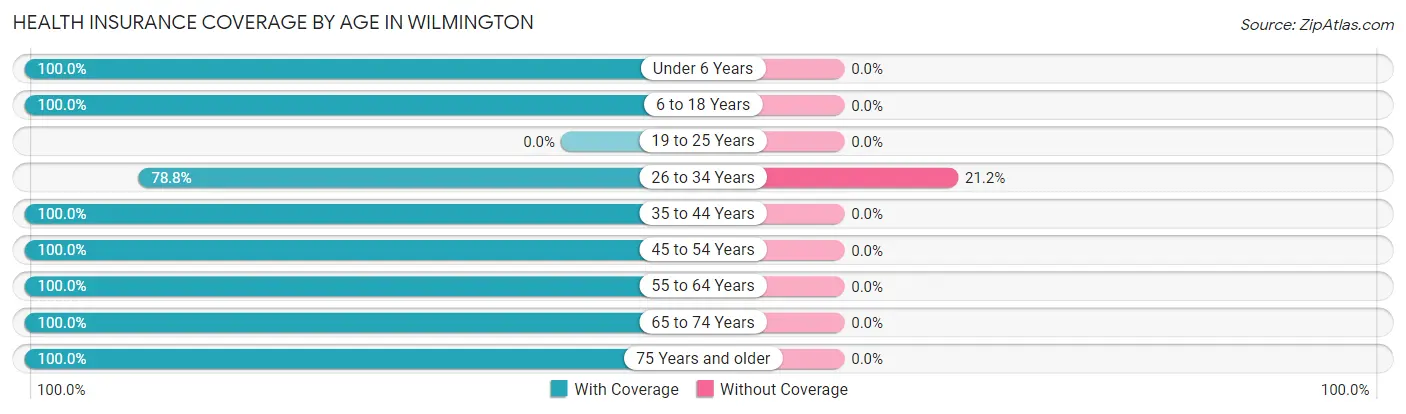
| Age Bracket | With Coverage | Without Coverage |
| Under 6 Years | 79 (100.0%) | 0 (0.0%) |
| 6 to 18 Years | 28 (100.0%) | 0 (0.0%) |
| 19 to 25 Years | 0 (0.0%) | 0 (0.0%) |
| 26 to 34 Years | 52 (78.8%) | 14 (21.2%) |
| 35 to 44 Years | 26 (100.0%) | 0 (0.0%) |
| 45 to 54 Years | 12 (100.0%) | 0 (0.0%) |
| 55 to 64 Years | 53 (100.0%) | 0 (0.0%) |
| 65 to 74 Years | 42 (100.0%) | 0 (0.0%) |
| 75 Years and older | 79 (100.0%) | 0 (0.0%) |
| Total | 371 (96.4%) | 14 (3.6%) |
Health Insurance Coverage by Citizenship Status in Wilmington
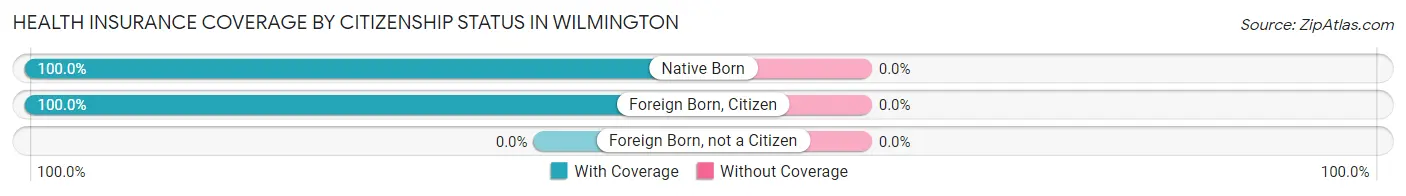
| Citizenship Status | With Coverage | Without Coverage |
| Native Born | 79 (100.0%) | 0 (0.0%) |
| Foreign Born, Citizen | 28 (100.0%) | 0 (0.0%) |
| Foreign Born, not a Citizen | 0 (0.0%) | 0 (0.0%) |
Health Insurance Coverage by Household Income in Wilmington
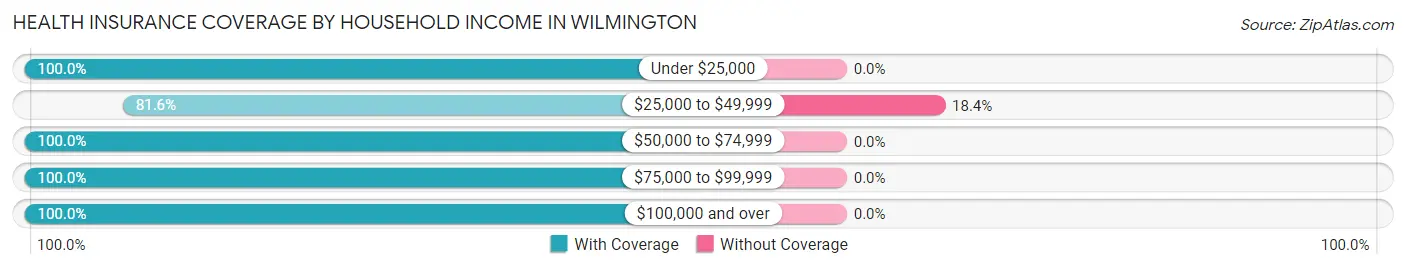
| Household Income | With Coverage | Without Coverage |
| Under $25,000 | 20 (100.0%) | 0 (0.0%) |
| $25,000 to $49,999 | 62 (81.6%) | 14 (18.4%) |
| $50,000 to $74,999 | 68 (100.0%) | 0 (0.0%) |
| $75,000 to $99,999 | 164 (100.0%) | 0 (0.0%) |
| $100,000 and over | 57 (100.0%) | 0 (0.0%) |
Public vs Private Health Insurance Coverage by Age in Wilmington
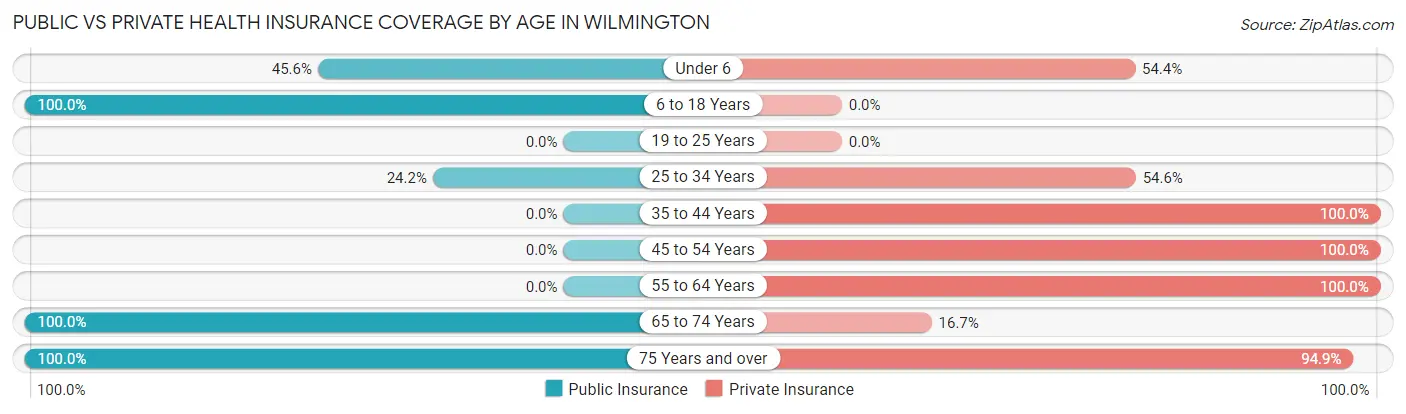
| Age Bracket | Public Insurance | Private Insurance |
| Under 6 | 36 (45.6%) | 43 (54.4%) |
| 6 to 18 Years | 28 (100.0%) | 0 (0.0%) |
| 19 to 25 Years | 0 (0.0%) | 0 (0.0%) |
| 25 to 34 Years | 16 (24.2%) | 36 (54.5%) |
| 35 to 44 Years | 0 (0.0%) | 26 (100.0%) |
| 45 to 54 Years | 0 (0.0%) | 12 (100.0%) |
| 55 to 64 Years | 0 (0.0%) | 53 (100.0%) |
| 65 to 74 Years | 42 (100.0%) | 7 (16.7%) |
| 75 Years and over | 79 (100.0%) | 75 (94.9%) |
| Total | 201 (52.2%) | 252 (65.4%) |
Disability Status by Sex by Age in Wilmington
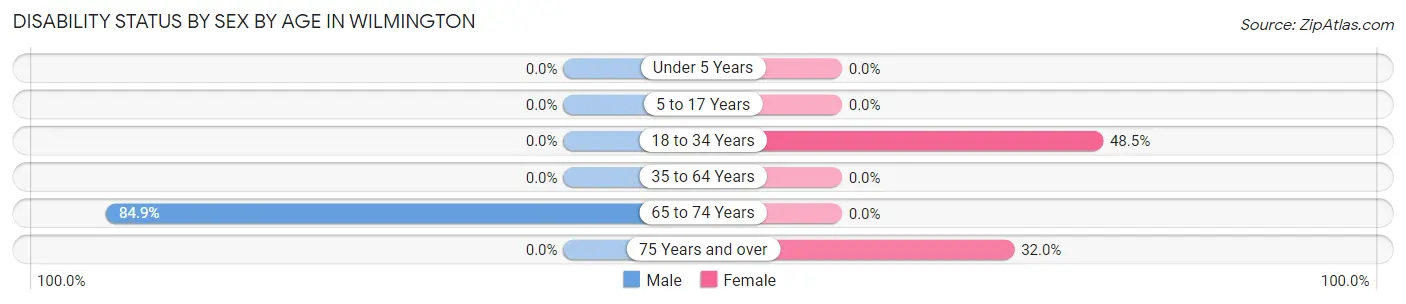
| Age Bracket | Male | Female |
| Under 5 Years | 0 (0.0%) | 0 (0.0%) |
| 5 to 17 Years | 0 (0.0%) | 0 (0.0%) |
| 18 to 34 Years | 0 (0.0%) | 16 (48.5%) |
| 35 to 64 Years | 0 (0.0%) | 0 (0.0%) |
| 65 to 74 Years | 28 (84.9%) | 0 (0.0%) |
| 75 Years and over | 0 (0.0%) | 8 (32.0%) |
Disability Class by Sex by Age in Wilmington
Disability Class: Hearing Difficulty
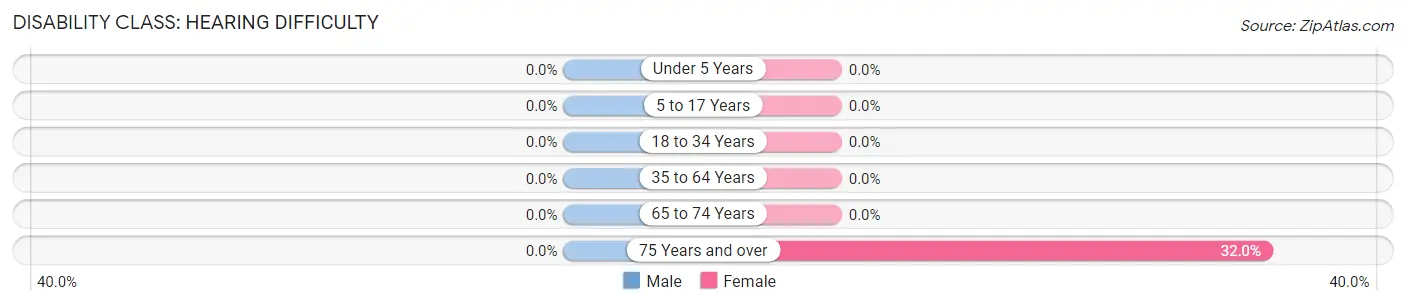
| Age Bracket | Male | Female |
| Under 5 Years | 0 (0.0%) | 0 (0.0%) |
| 5 to 17 Years | 0 (0.0%) | 0 (0.0%) |
| 18 to 34 Years | 0 (0.0%) | 0 (0.0%) |
| 35 to 64 Years | 0 (0.0%) | 0 (0.0%) |
| 65 to 74 Years | 0 (0.0%) | 0 (0.0%) |
| 75 Years and over | 0 (0.0%) | 8 (32.0%) |
Disability Class: Vision Difficulty
| Age Bracket | Male | Female |
| Under 5 Years | 0 (0.0%) | 0 (0.0%) |
| 5 to 17 Years | 0 (0.0%) | 0 (0.0%) |
| 18 to 34 Years | 0 (0.0%) | 0 (0.0%) |
| 35 to 64 Years | 0 (0.0%) | 0 (0.0%) |
| 65 to 74 Years | 0 (0.0%) | 0 (0.0%) |
| 75 Years and over | 0 (0.0%) | 0 (0.0%) |
Disability Class: Cognitive Difficulty
| Age Bracket | Male | Female |
| 5 to 17 Years | 0 (0.0%) | 0 (0.0%) |
| 18 to 34 Years | 0 (0.0%) | 0 (0.0%) |
| 35 to 64 Years | 0 (0.0%) | 0 (0.0%) |
| 65 to 74 Years | 0 (0.0%) | 0 (0.0%) |
| 75 Years and over | 0 (0.0%) | 0 (0.0%) |
Disability Class: Ambulatory Difficulty
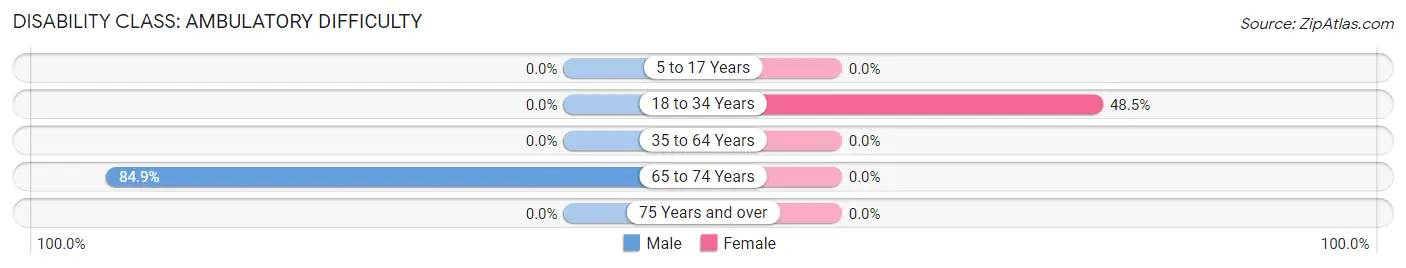
| Age Bracket | Male | Female |
| 5 to 17 Years | 0 (0.0%) | 0 (0.0%) |
| 18 to 34 Years | 0 (0.0%) | 16 (48.5%) |
| 35 to 64 Years | 0 (0.0%) | 0 (0.0%) |
| 65 to 74 Years | 28 (84.9%) | 0 (0.0%) |
| 75 Years and over | 0 (0.0%) | 0 (0.0%) |
Disability Class: Self-Care Difficulty
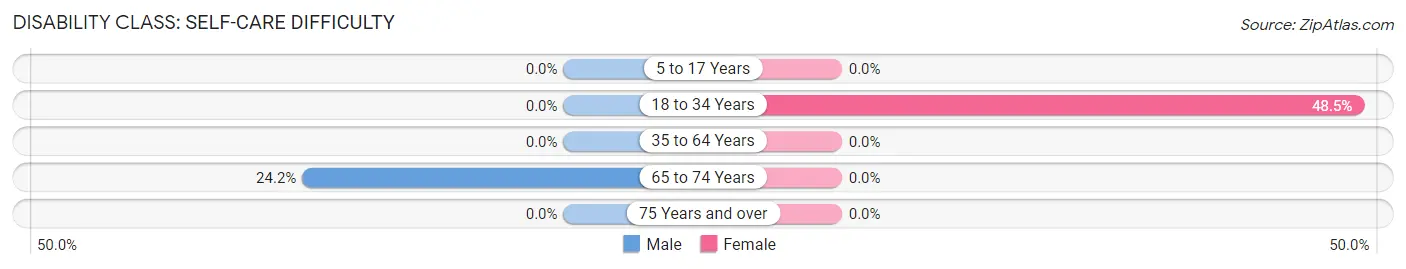
| Age Bracket | Male | Female |
| 5 to 17 Years | 0 (0.0%) | 0 (0.0%) |
| 18 to 34 Years | 0 (0.0%) | 16 (48.5%) |
| 35 to 64 Years | 0 (0.0%) | 0 (0.0%) |
| 65 to 74 Years | 8 (24.2%) | 0 (0.0%) |
| 75 Years and over | 0 (0.0%) | 0 (0.0%) |
Technology Access in Wilmington
Computing Device Access in Wilmington
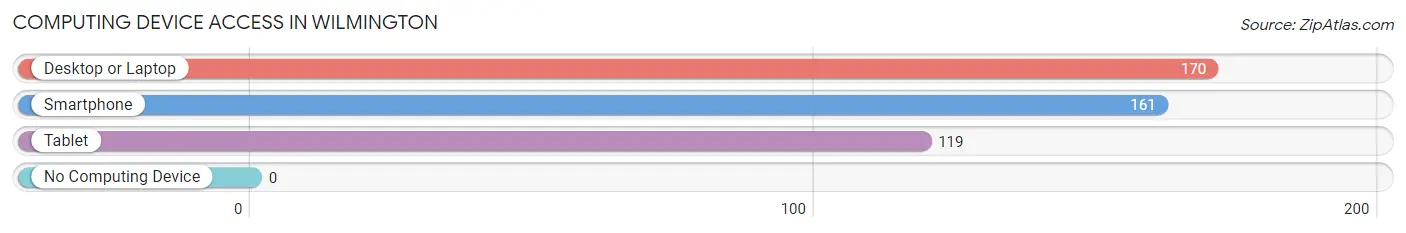
| Device Type | # Households | % Households |
| Desktop or Laptop | 170 | 88.5% |
| Smartphone | 161 | 83.9% |
| Tablet | 119 | 62.0% |
| No Computing Device | 0 | 0.0% |
| Total | 192 | 100.0% |
Internet Access in Wilmington
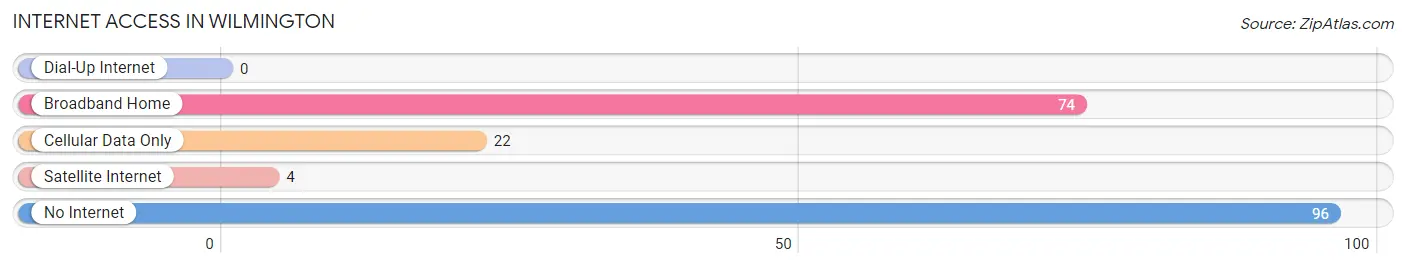
| Internet Type | # Households | % Households |
| Dial-Up Internet | 0 | 0.0% |
| Broadband Home | 74 | 38.5% |
| Cellular Data Only | 22 | 11.5% |
| Satellite Internet | 4 | 2.1% |
| No Internet | 96 | 50.0% |
| Total | 192 | 100.0% |
Wilmington Summary
Wilmington, Vermont is a small town located in the southwestern corner of the state, in the Green Mountains. It is bordered by the towns of Dover, Whitingham, Readsboro, and Halifax, and is part of the Deerfield Valley region. The town has a population of 1,072, according to the 2010 census, and is the smallest town in the state.
History
The town of Wilmington was first settled in 1763 by a group of settlers from Massachusetts. The town was originally called “New Marlborough”, after the town of Marlborough, Massachusetts. The town was renamed “Wilmington” in 1790, after the town of Wilmington, Massachusetts.
The town was an important stop on the stagecoach route between Bennington and Brattleboro, and was a popular destination for travelers. The town was also an important stop on the Vermont Central Railroad, which ran from Bellows Falls to Brattleboro.
The town was home to several mills, including a sawmill, gristmill, and a woolen mill. The town was also home to several small businesses, including a blacksmith shop, a general store, and a hotel.
Geography
Wilmington is located in the southwestern corner of Vermont, in the Green Mountains. The town is bordered by the towns of Dover, Whitingham, Readsboro, and Halifax. The town is part of the Deerfield Valley region, and is located in the Connecticut River watershed.
The town is located in a valley, surrounded by mountains. The highest point in the town is the summit of Haystack Mountain, at an elevation of 2,890 feet. The town is located in a temperate climate, with cold winters and warm summers.
Economy
The economy of Wilmington is largely based on tourism. The town is home to several ski resorts, including Mount Snow, Haystack Mountain, and Hermitage Club. The town is also home to several restaurants, shops, and lodging establishments.
The town is also home to several small businesses, including a general store, a hardware store, and a lumber yard. The town is also home to several farms, which produce dairy products, vegetables, and maple syrup.
Demographics
According to the 2010 census, the town of Wilmington has a population of 1,072. The population is predominantly white (97.2%), with a small minority population (2.8%). The median household income is $45,938, and the median age is 44.7 years.
The town is home to several churches, including the United Church of Christ, the Episcopal Church, and the Catholic Church. The town is also home to several schools, including the Wilmington Elementary School, the Twin Valley Middle School, and the Twin Valley High School.
Conclusion
Wilmington, Vermont is a small town located in the southwestern corner of the state, in the Green Mountains. The town has a population of 1,072, according to the 2010 census, and is the smallest town in the state. The economy of Wilmington is largely based on tourism, and the town is home to several ski resorts, restaurants, shops, and lodging establishments. The population is predominantly white (97.2%), with a small minority population (2.8%). The town is home to several churches, schools, and small businesses.
Common Questions
What is Per Capita Income in Wilmington?
Per Capita income in Wilmington is $43,448.
What is the Median Family Income in Wilmington?
Median Family Income in Wilmington is $85,000.
What is the Median Household income in Wilmington?
Median Household Income in Wilmington is $92,794.
What is Income or Wage Gap in Wilmington?
Income or Wage Gap in Wilmington is 68.1%.
Women in Wilmington earn 31.9 cents for every dollar earned by a man.
What is Inequality or Gini Index in Wilmington?
Inequality or Gini Index in Wilmington is 0.28.
What is the Total Population of Wilmington?
Total Population of Wilmington is 385.
What is the Total Male Population of Wilmington?
Total Male Population of Wilmington is 239.
What is the Total Female Population of Wilmington?
Total Female Population of Wilmington is 146.
What is the Ratio of Males per 100 Females in Wilmington?
There are 163.70 Males per 100 Females in Wilmington.
What is the Ratio of Females per 100 Males in Wilmington?
There are 61.09 Females per 100 Males in Wilmington.
What is the Median Population Age in Wilmington?
Median Population Age in Wilmington is 40.5 Years.
What is the Average Family Size in Wilmington
Average Family Size in Wilmington is 3.5 People.
What is the Average Household Size in Wilmington
Average Household Size in Wilmington is 2.0 People.
How Large is the Labor Force in Wilmington?
There are 138 People in the Labor Forcein in Wilmington.
What is the Percentage of People in the Labor Force in Wilmington?
49.6% of People are in the Labor Force in Wilmington.