Barnet, VT Map & Demographics
Barnet Map
Barnet Overview
$16,269
PER CAPITA INCOME
$36,667
AVG FAMILY INCOME
$36,667
AVG HOUSEHOLD INCOME
0.43
INEQUALITY / GINI INDEX
131
TOTAL POPULATION
31
MALE POPULATION
100
FEMALE POPULATION
31.00
MALES / 100 FEMALES
322.58
FEMALES / 100 MALES
64.9
MEDIAN AGE
2.8
AVG FAMILY SIZE
2.8
AVG HOUSEHOLD SIZE
31
LABOR FORCE [ PEOPLE ]
30.7%
PERCENT IN LABOR FORCE
Barnet Zip Codes
Barnet Area Codes
Income in Barnet
Income Overview in Barnet
Per Capita Income in Barnet is $16,269, while median incomes of families and households are $36,667 and $36,667 respectively.
| Characteristic | Number | Measure |
| Per Capita Income | 131 | $16,269 |
| Median Family Income | 30 | $36,667 |
| Mean Family Income | 30 | $56,967 |
| Median Household Income | 30 | $36,667 |
| Mean Household Income | 30 | $56,967 |
| Income Deficit | 30 | $0 |
| Wage / Income Gap (%) | 131 | 0.00% |
| Wage / Income Gap ($) | 131 | 100.00¢ per $1 |
| Gini / Inequality Index | 131 | 0.43 |
Earnings by Sex in Barnet

| Sex | Number | Average Earnings |
| Male | 13 (33.3%) | $41,250 |
| Female | 26 (66.7%) | $0 |
| Total | 39 (100.0%) | $0 |
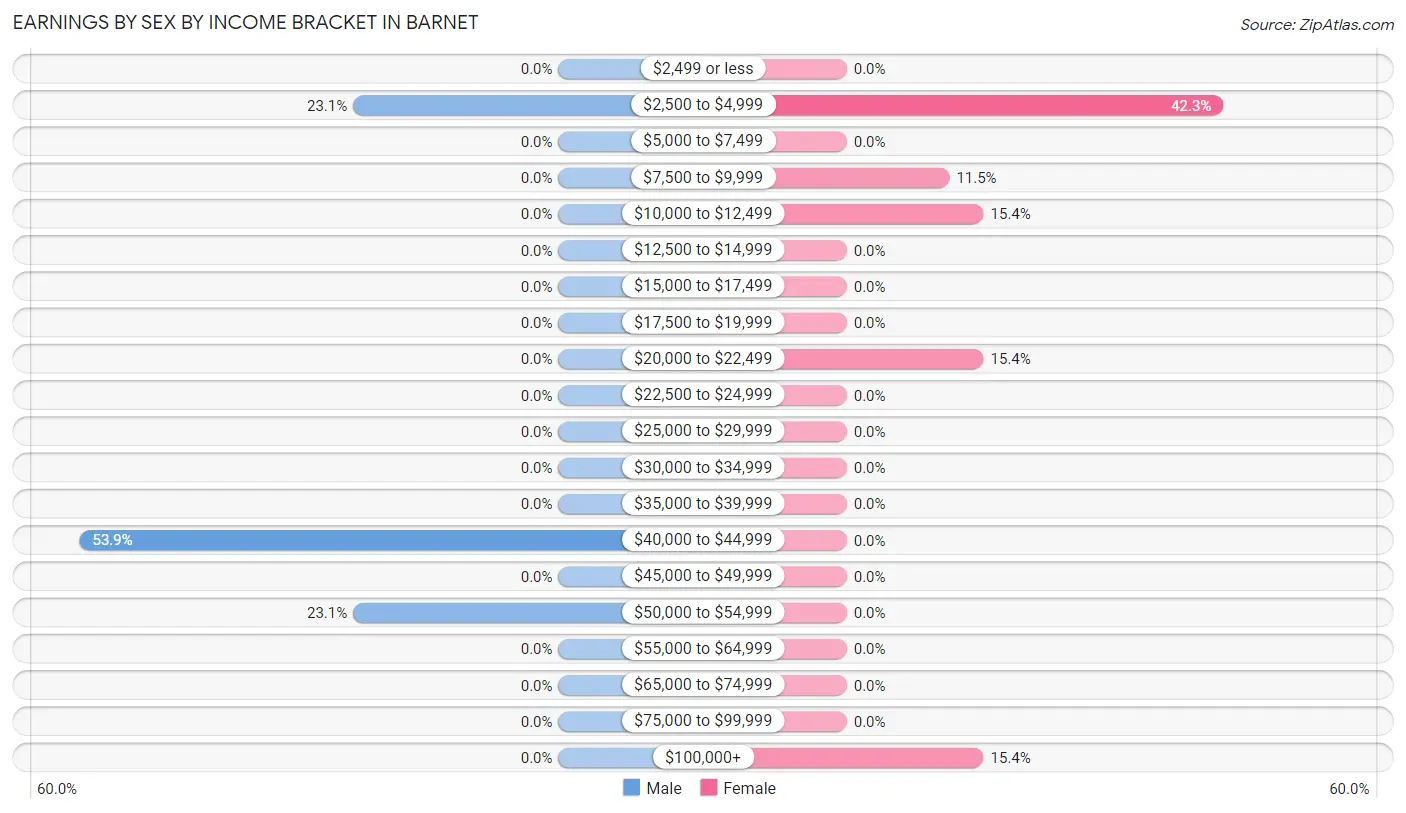
Earnings by Sex by Income Bracket in Barnet
The most common earnings brackets in Barnet are $40,000 to $44,999 for men (7 | 53.8%) and $2,500 to $4,999 for women (11 | 42.3%).
| Income | Male | Female |
| $2,499 or less | 0 (0.0%) | 0 (0.0%) |
| $2,500 to $4,999 | 3 (23.1%) | 11 (42.3%) |
| $5,000 to $7,499 | 0 (0.0%) | 0 (0.0%) |
| $7,500 to $9,999 | 0 (0.0%) | 3 (11.5%) |
| $10,000 to $12,499 | 0 (0.0%) | 4 (15.4%) |
| $12,500 to $14,999 | 0 (0.0%) | 0 (0.0%) |
| $15,000 to $17,499 | 0 (0.0%) | 0 (0.0%) |
| $17,500 to $19,999 | 0 (0.0%) | 0 (0.0%) |
| $20,000 to $22,499 | 0 (0.0%) | 4 (15.4%) |
| $22,500 to $24,999 | 0 (0.0%) | 0 (0.0%) |
| $25,000 to $29,999 | 0 (0.0%) | 0 (0.0%) |
| $30,000 to $34,999 | 0 (0.0%) | 0 (0.0%) |
| $35,000 to $39,999 | 0 (0.0%) | 0 (0.0%) |
| $40,000 to $44,999 | 7 (53.8%) | 0 (0.0%) |
| $45,000 to $49,999 | 0 (0.0%) | 0 (0.0%) |
| $50,000 to $54,999 | 3 (23.1%) | 0 (0.0%) |
| $55,000 to $64,999 | 0 (0.0%) | 0 (0.0%) |
| $65,000 to $74,999 | 0 (0.0%) | 0 (0.0%) |
| $75,000 to $99,999 | 0 (0.0%) | 0 (0.0%) |
| $100,000+ | 0 (0.0%) | 4 (15.4%) |
| Total | 13 (100.0%) | 26 (100.0%) |
Earnings by Sex by Educational Attainment in Barnet
| Educational Attainment | Male Income | Female Income |
| Less than High School | - | - |
| High School Diploma | - | - |
| College or Associate's Degree | - | - |
| Bachelor's Degree | - | - |
| Graduate Degree | - | - |
| Total | $41,250 | $0 |
Family Income in Barnet
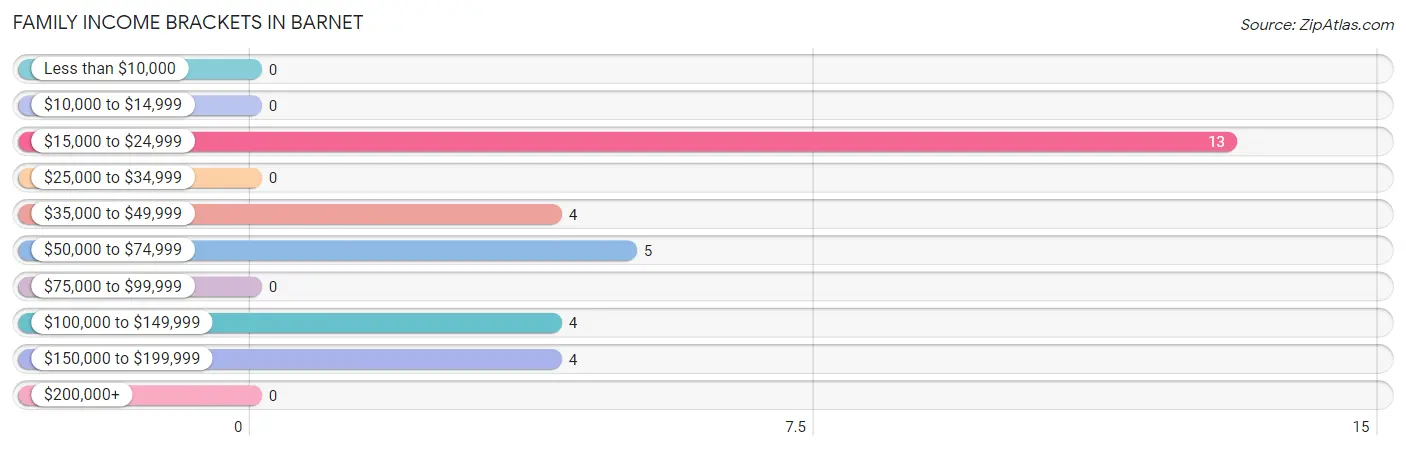
Family Income Brackets in Barnet
According to the Barnet family income data, there are 13 families falling into the $15,000 to $24,999 income range, which is the most common income bracket and makes up 43.3% of all families.
| Income Bracket | # Families | % Families |
| Less than $10,000 | 0 | 0.0% |
| $10,000 to $14,999 | 0 | 0.0% |
| $15,000 to $24,999 | 13 | 43.3% |
| $25,000 to $34,999 | 0 | 0.0% |
| $35,000 to $49,999 | 4 | 13.3% |
| $50,000 to $74,999 | 5 | 16.7% |
| $75,000 to $99,999 | 0 | 0.0% |
| $100,000 to $149,999 | 4 | 13.3% |
| $150,000 to $199,999 | 4 | 13.3% |
| $200,000+ | 0 | 0.0% |
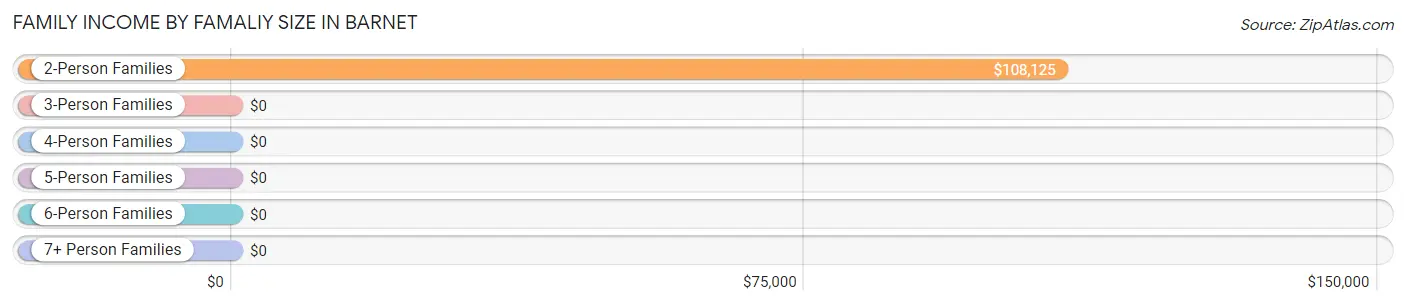
Family Income by Famaliy Size in Barnet
2-person families (14 | 46.7%) account for the highest median family income in Barnet with $108,125 per family, while 2-person families (14 | 46.7%) have the highest median income of $54,062 per family member.
| Income Bracket | # Families | Median Income |
| 2-Person Families | 14 (46.7%) | $108,125 |
| 3-Person Families | 13 (43.3%) | $0 |
| 4-Person Families | 0 (0.0%) | $0 |
| 5-Person Families | 0 (0.0%) | $0 |
| 6-Person Families | 3 (10.0%) | $0 |
| 7+ Person Families | 0 (0.0%) | $0 |
| Total | 30 (100.0%) | $36,667 |
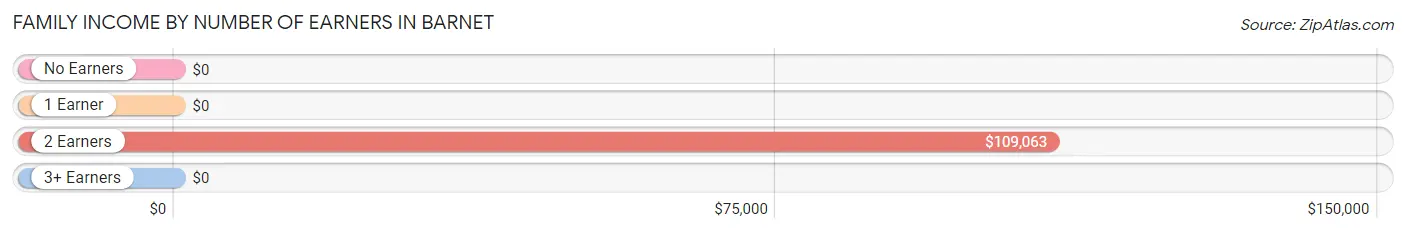
Family Income by Number of Earners in Barnet
| Number of Earners | # Families | Median Income |
| No Earners | 2 (6.7%) | $0 |
| 1 Earner | 17 (56.7%) | $0 |
| 2 Earners | 11 (36.7%) | $109,063 |
| 3+ Earners | 0 (0.0%) | $0 |
| Total | 30 (100.0%) | $36,667 |
Household Income in Barnet
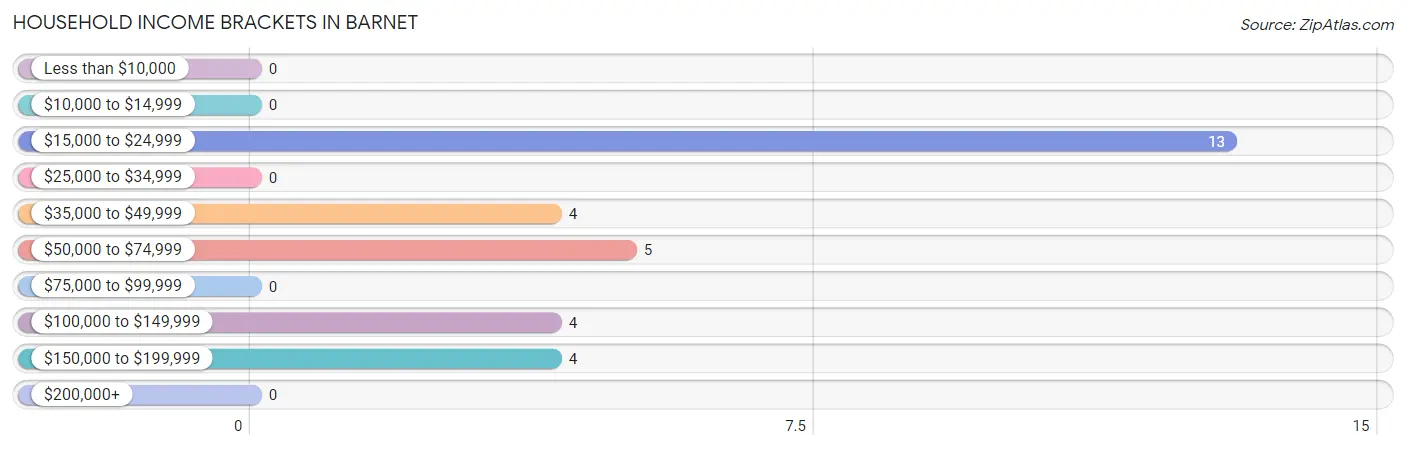
Household Income Brackets in Barnet
With 13 households falling in the category, the $15,000 to $24,999 income range is the most frequent in Barnet, accounting for 43.3% of all households.
| Income Bracket | # Households | % Households |
| Less than $10,000 | 0 | 0.0% |
| $10,000 to $14,999 | 0 | 0.0% |
| $15,000 to $24,999 | 13 | 43.3% |
| $25,000 to $34,999 | 0 | 0.0% |
| $35,000 to $49,999 | 4 | 13.3% |
| $50,000 to $74,999 | 5 | 16.7% |
| $75,000 to $99,999 | 0 | 0.0% |
| $100,000 to $149,999 | 4 | 13.3% |
| $150,000 to $199,999 | 4 | 13.3% |
| $200,000+ | 0 | 0.0% |
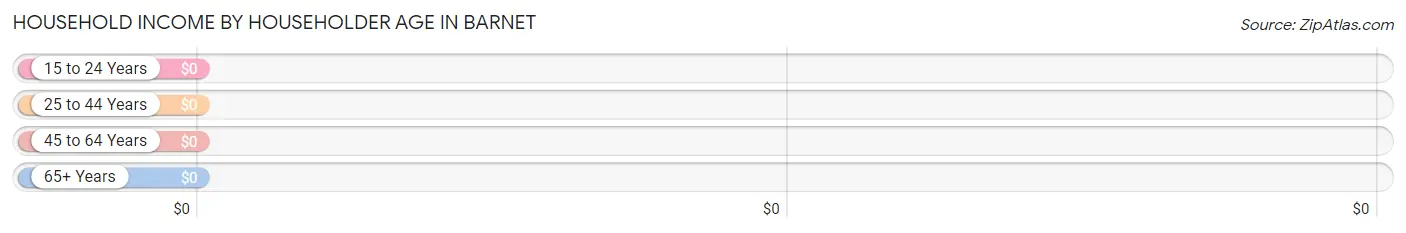
Household Income by Householder Age in Barnet
| Income Bracket | # Households | Median Income |
| 15 to 24 Years | 0 (0.0%) | $0 |
| 25 to 44 Years | 14 (46.7%) | $0 |
| 45 to 64 Years | 6 (20.0%) | $0 |
| 65+ Years | 10 (33.3%) | $0 |
| Total | 30 (100.0%) | $36,667 |
Poverty in Barnet
Income Below Poverty by Sex and Age in Barnet
With 22.6% poverty level for males and 76.0% for females among the residents of Barnet, 18 to 24 year old males and 12 to 14 year old females are the most vulnerable to poverty, with 3 males (100.0%) and 9 females (100.0%) in their respective age groups living below the poverty level.
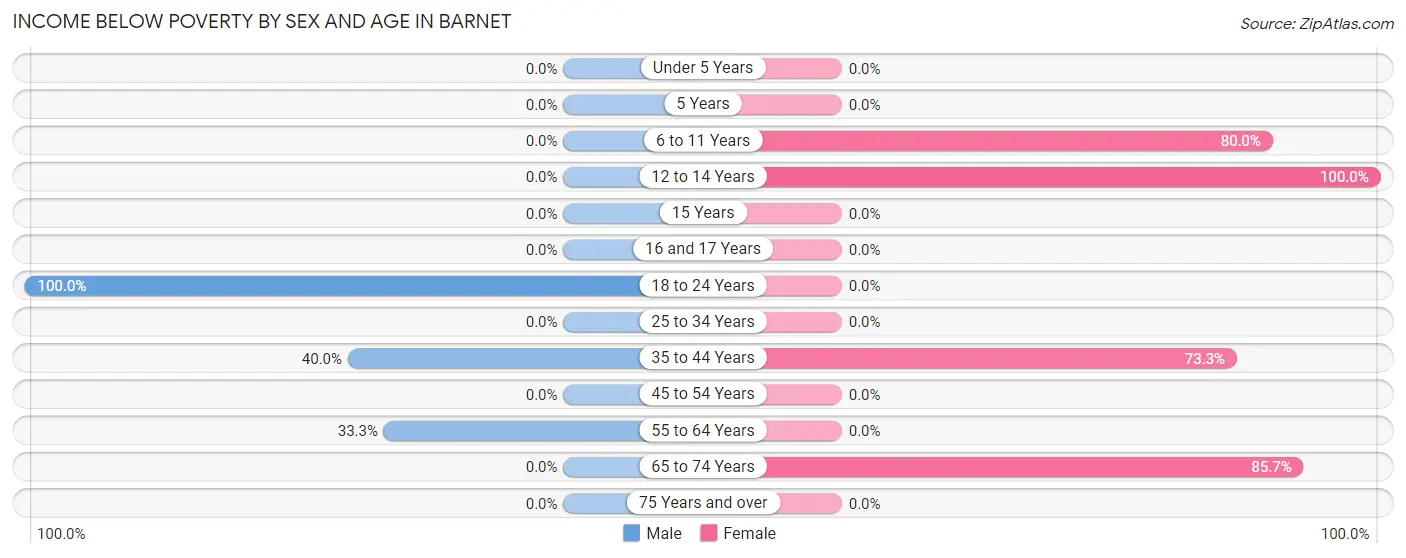
| Age Bracket | Male | Female |
| Under 5 Years | 0 (0.0%) | 0 (0.0%) |
| 5 Years | 0 (0.0%) | 0 (0.0%) |
| 6 to 11 Years | 0 (0.0%) | 8 (80.0%) |
| 12 to 14 Years | 0 (0.0%) | 9 (100.0%) |
| 15 Years | 0 (0.0%) | 0 (0.0%) |
| 16 and 17 Years | 0 (0.0%) | 0 (0.0%) |
| 18 to 24 Years | 3 (100.0%) | 0 (0.0%) |
| 25 to 34 Years | 0 (0.0%) | 0 (0.0%) |
| 35 to 44 Years | 2 (40.0%) | 11 (73.3%) |
| 45 to 54 Years | 0 (0.0%) | 0 (0.0%) |
| 55 to 64 Years | 2 (33.3%) | 0 (0.0%) |
| 65 to 74 Years | 0 (0.0%) | 48 (85.7%) |
| 75 Years and over | 0 (0.0%) | 0 (0.0%) |
| Total | 7 (22.6%) | 76 (76.0%) |
Income Above Poverty by Sex and Age in Barnet
According to the poverty statistics in Barnet, males aged under 5 years and females aged under 5 years are the age groups that are most secure financially, with 100.0% of males and 100.0% of females in these age groups living above the poverty line.
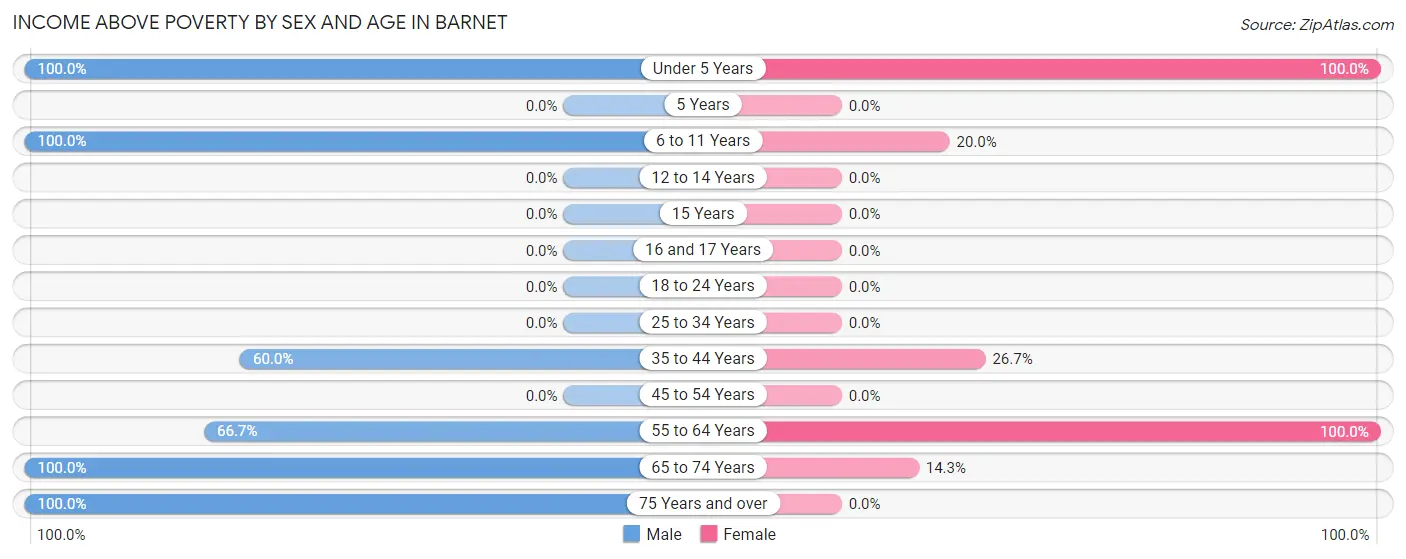
| Age Bracket | Male | Female |
| Under 5 Years | 4 (100.0%) | 3 (100.0%) |
| 5 Years | 0 (0.0%) | 0 (0.0%) |
| 6 to 11 Years | 4 (100.0%) | 2 (20.0%) |
| 12 to 14 Years | 0 (0.0%) | 0 (0.0%) |
| 15 Years | 0 (0.0%) | 0 (0.0%) |
| 16 and 17 Years | 0 (0.0%) | 0 (0.0%) |
| 18 to 24 Years | 0 (0.0%) | 0 (0.0%) |
| 25 to 34 Years | 0 (0.0%) | 0 (0.0%) |
| 35 to 44 Years | 3 (60.0%) | 4 (26.7%) |
| 45 to 54 Years | 0 (0.0%) | 0 (0.0%) |
| 55 to 64 Years | 4 (66.7%) | 7 (100.0%) |
| 65 to 74 Years | 6 (100.0%) | 8 (14.3%) |
| 75 Years and over | 3 (100.0%) | 0 (0.0%) |
| Total | 24 (77.4%) | 24 (24.0%) |
Income Below Poverty Among Married-Couple Families in Barnet
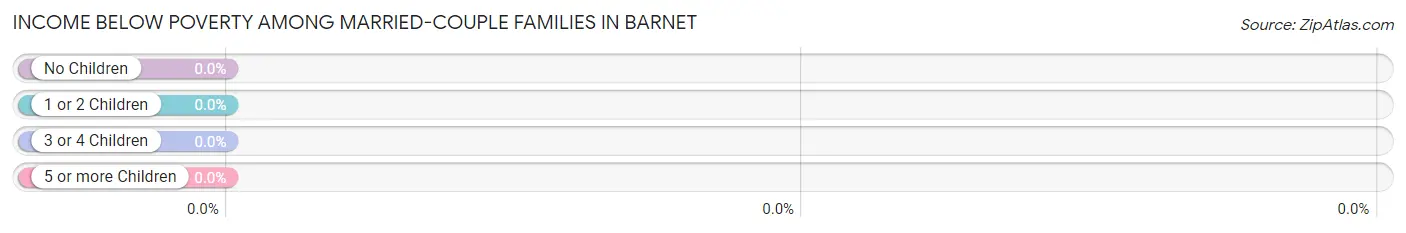
| Children | Above Poverty | Below Poverty |
| No Children | 14 (100.0%) | 0 (0.0%) |
| 1 or 2 Children | 0 (0.0%) | 0 (0.0%) |
| 3 or 4 Children | 3 (100.0%) | 0 (0.0%) |
| 5 or more Children | 0 (0.0%) | 0 (0.0%) |
| Total | 17 (100.0%) | 0 (0.0%) |
Income Below Poverty Among Single-Parent Households in Barnet
According to the poverty data in Barnet, 100.0% or 2 single-father households and 100.0% or 11 single-mother households are living below the poverty line. Among single-father households, those with no children have the highest poverty rate, with 2 households (100.0%) experiencing poverty. Likewise, among single-mother households, those with 1 or 2 children have the highest poverty rate, with 11 households (100.0%) falling below the poverty line.
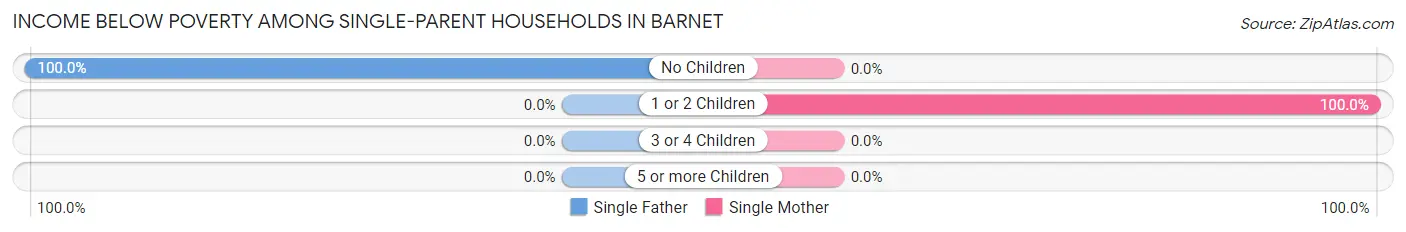
| Children | Single Father | Single Mother |
| No Children | 2 (100.0%) | 0 (0.0%) |
| 1 or 2 Children | 0 (0.0%) | 11 (100.0%) |
| 3 or 4 Children | 0 (0.0%) | 0 (0.0%) |
| 5 or more Children | 0 (0.0%) | 0 (0.0%) |
| Total | 2 (100.0%) | 11 (100.0%) |
Income Below Poverty Among Married-Couple vs Single-Parent Households in Barnet
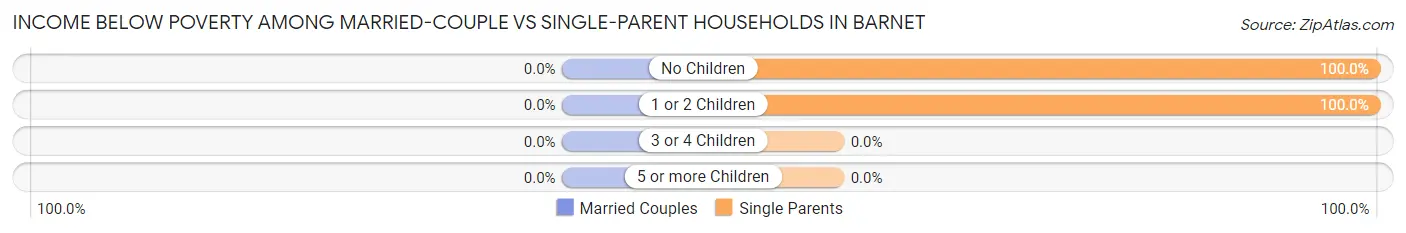
| Children | Married-Couple Families | Single-Parent Households |
| No Children | 0 (0.0%) | 2 (100.0%) |
| 1 or 2 Children | 0 (0.0%) | 11 (100.0%) |
| 3 or 4 Children | 0 (0.0%) | 0 (0.0%) |
| 5 or more Children | 0 (0.0%) | 0 (0.0%) |
| Total | 0 (0.0%) | 13 (100.0%) |
Race in Barnet
The most populous races in Barnet are White / Caucasian (83 | 63.4%), Black / African American (48 | 36.6%), and Hispanic or Latino (48 | 36.6%).
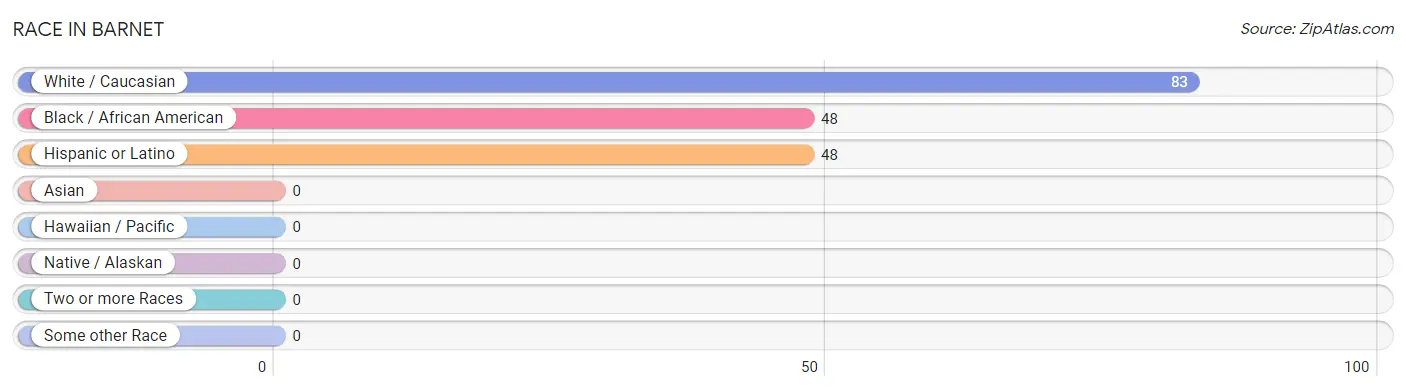
| Race | # Population | % Population |
| Asian | 0 | 0.0% |
| Black / African American | 48 | 36.6% |
| Hawaiian / Pacific | 0 | 0.0% |
| Hispanic or Latino | 48 | 36.6% |
| Native / Alaskan | 0 | 0.0% |
| White / Caucasian | 83 | 63.4% |
| Two or more Races | 0 | 0.0% |
| Some other Race | 0 | 0.0% |
| Total | 131 | 100.0% |
Ancestry in Barnet
The most populous ancestries reported in Barnet are Puerto Rican (48 | 36.6%), English (29 | 22.1%), German (23 | 17.6%), Italian (11 | 8.4%), and Swedish (11 | 8.4%), together accounting for 93.1% of all Barnet residents.
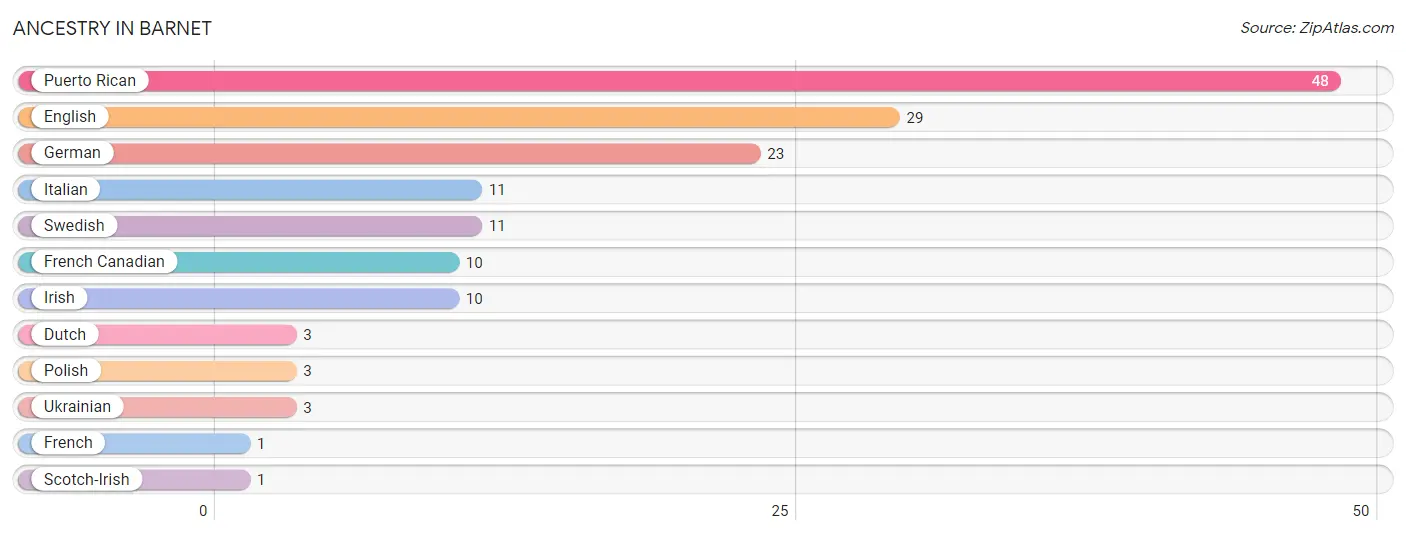
| Ancestry | # Population | % Population |
| Dutch | 3 | 2.3% |
| English | 29 | 22.1% |
| French | 1 | 0.8% |
| French Canadian | 10 | 7.6% |
| German | 23 | 17.6% |
| Irish | 10 | 7.6% |
| Italian | 11 | 8.4% |
| Polish | 3 | 2.3% |
| Puerto Rican | 48 | 36.6% |
| Scotch-Irish | 1 | 0.8% |
| Swedish | 11 | 8.4% |
| Ukrainian | 3 | 2.3% | View All 12 Rows |
Immigrants in Barnet
The most numerous immigrant groups reported in Barnet came from Eastern Europe (3 | 2.3%), Europe (3 | 2.3%), and Ukraine (3 | 2.3%), together accounting for 6.9% of all Barnet residents.
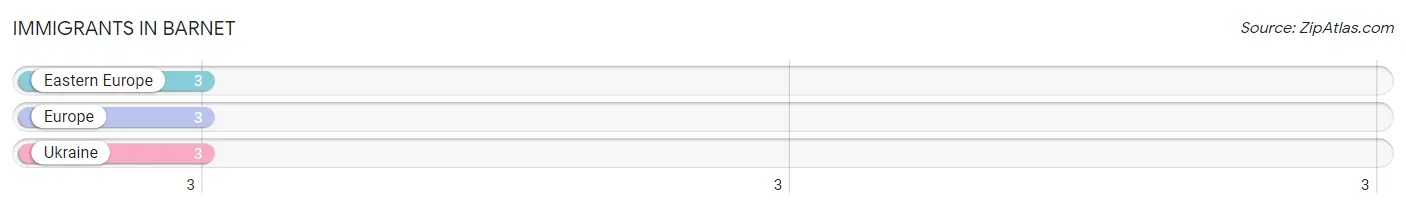
| Immigration Origin | # Population | % Population |
| Eastern Europe | 3 | 2.3% |
| Europe | 3 | 2.3% |
| Ukraine | 3 | 2.3% | View All 3 Rows |
Sex and Age in Barnet
Sex and Age in Barnet
The most populous age groups in Barnet are 60 to 64 Years (6 | 19.4%) for men and 70 to 74 Years (48 | 48.0%) for women.
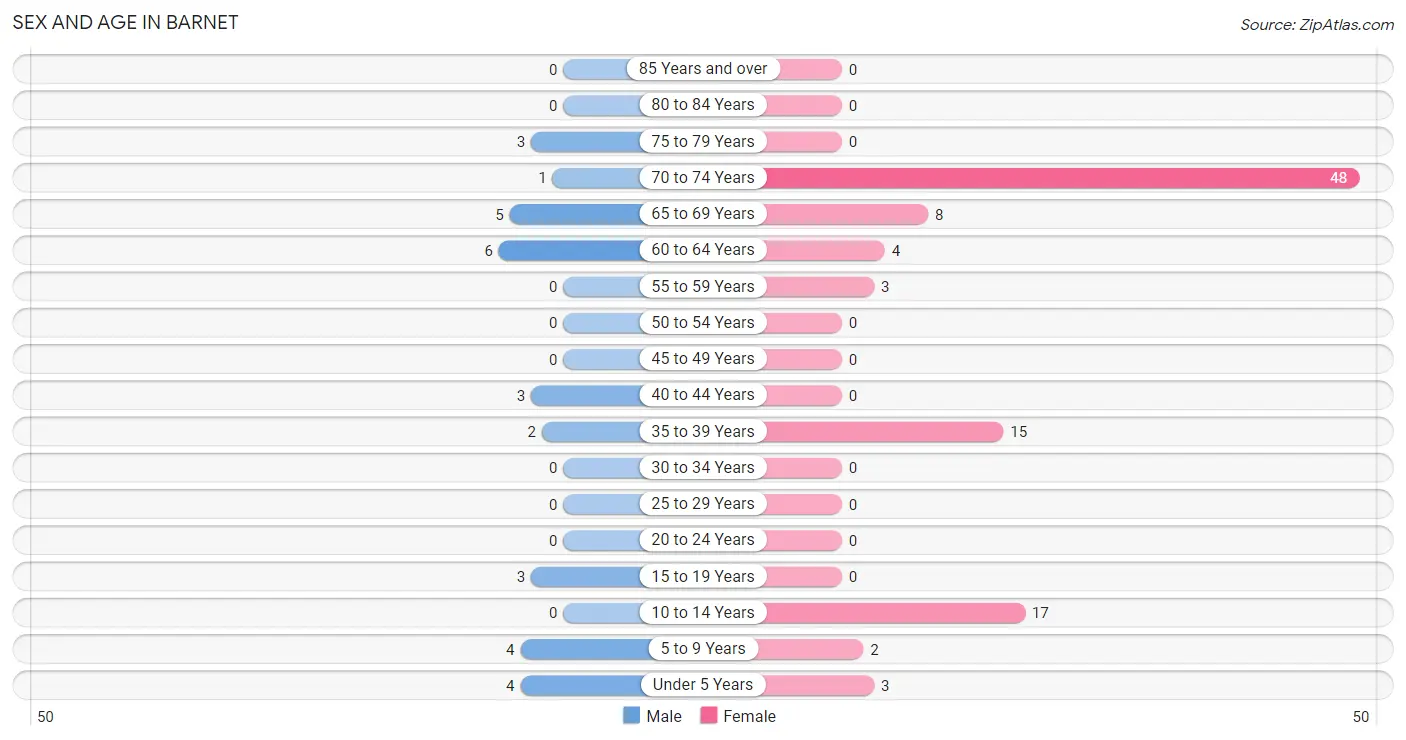
| Age Bracket | Male | Female |
| Under 5 Years | 4 (12.9%) | 3 (3.0%) |
| 5 to 9 Years | 4 (12.9%) | 2 (2.0%) |
| 10 to 14 Years | 0 (0.0%) | 17 (17.0%) |
| 15 to 19 Years | 3 (9.7%) | 0 (0.0%) |
| 20 to 24 Years | 0 (0.0%) | 0 (0.0%) |
| 25 to 29 Years | 0 (0.0%) | 0 (0.0%) |
| 30 to 34 Years | 0 (0.0%) | 0 (0.0%) |
| 35 to 39 Years | 2 (6.5%) | 15 (15.0%) |
| 40 to 44 Years | 3 (9.7%) | 0 (0.0%) |
| 45 to 49 Years | 0 (0.0%) | 0 (0.0%) |
| 50 to 54 Years | 0 (0.0%) | 0 (0.0%) |
| 55 to 59 Years | 0 (0.0%) | 3 (3.0%) |
| 60 to 64 Years | 6 (19.4%) | 4 (4.0%) |
| 65 to 69 Years | 5 (16.1%) | 8 (8.0%) |
| 70 to 74 Years | 1 (3.2%) | 48 (48.0%) |
| 75 to 79 Years | 3 (9.7%) | 0 (0.0%) |
| 80 to 84 Years | 0 (0.0%) | 0 (0.0%) |
| 85 Years and over | 0 (0.0%) | 0 (0.0%) |
| Total | 31 (100.0%) | 100 (100.0%) |
Families and Households in Barnet
Median Family Size in Barnet
The median family size in Barnet is 2.77 persons per family, with single male/father families (2 | 6.7%) accounting for the largest median family size of 3.5 persons per family. On the other hand, single female/mother families (11 | 36.7%) represent the smallest median family size with 2.55 persons per family.
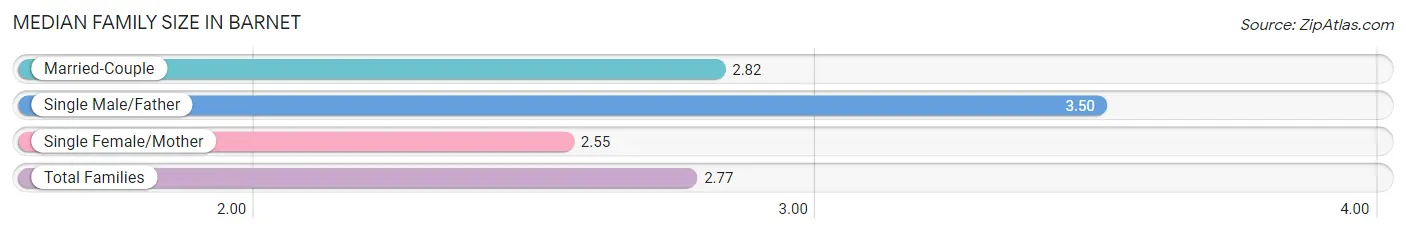
| Family Type | # Families | Family Size |
| Married-Couple | 17 (56.7%) | 2.82 |
| Single Male/Father | 2 (6.7%) | 3.50 |
| Single Female/Mother | 11 (36.7%) | 2.55 |
| Total Families | 30 (100.0%) | 2.77 |
Median Household Size in Barnet
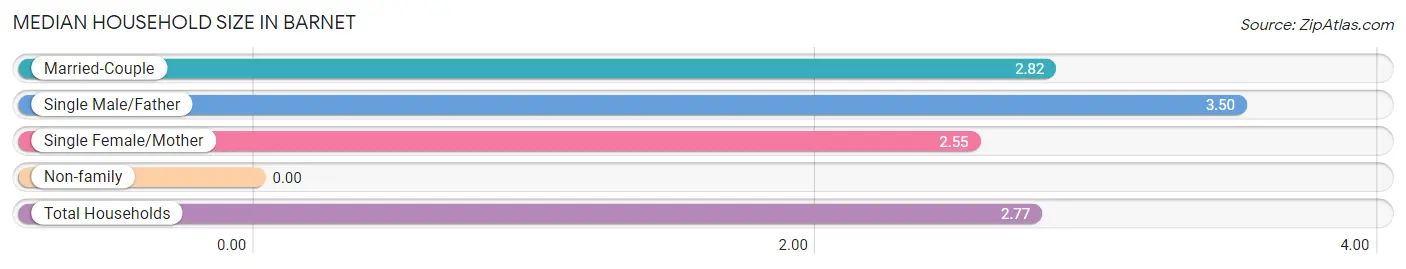
| Household Type | # Households | Household Size |
| Married-Couple | 17 (56.7%) | 2.82 |
| Single Male/Father | 2 (6.7%) | 3.50 |
| Single Female/Mother | 11 (36.7%) | 2.55 |
| Non-family | 0 (0.0%) | - |
| Total Households | 30 (100.0%) | 2.77 |
Household Size by Marriage Status in Barnet
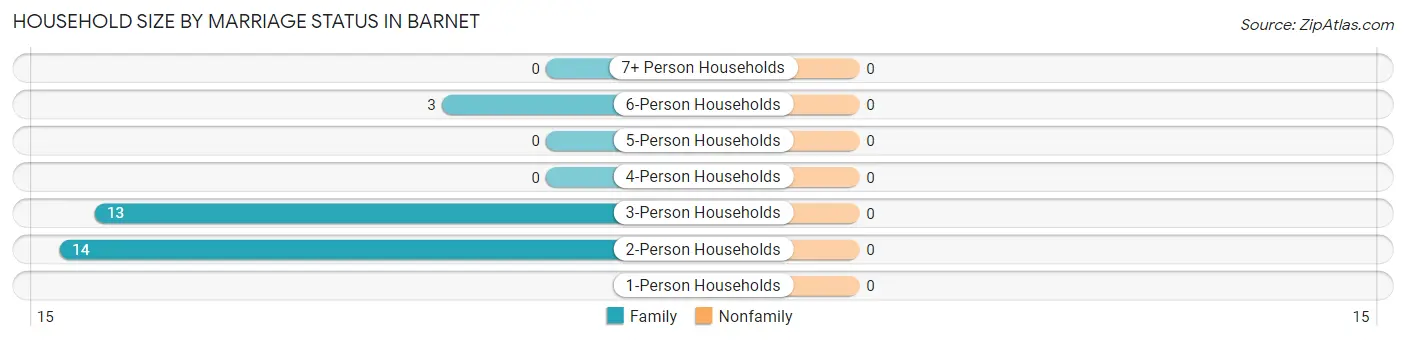
| Household Size | Family Households | Nonfamily Households |
| 1-Person Households | - | 0 (0.0%) |
| 2-Person Households | 14 (46.7%) | 0 (0.0%) |
| 3-Person Households | 13 (43.3%) | 0 (0.0%) |
| 4-Person Households | 0 (0.0%) | 0 (0.0%) |
| 5-Person Households | 0 (0.0%) | 0 (0.0%) |
| 6-Person Households | 3 (10.0%) | 0 (0.0%) |
| 7+ Person Households | 0 (0.0%) | 0 (0.0%) |
| Total | 30 (100.0%) | 0 (0.0%) |
Female Fertility in Barnet
Fertility by Age in Barnet
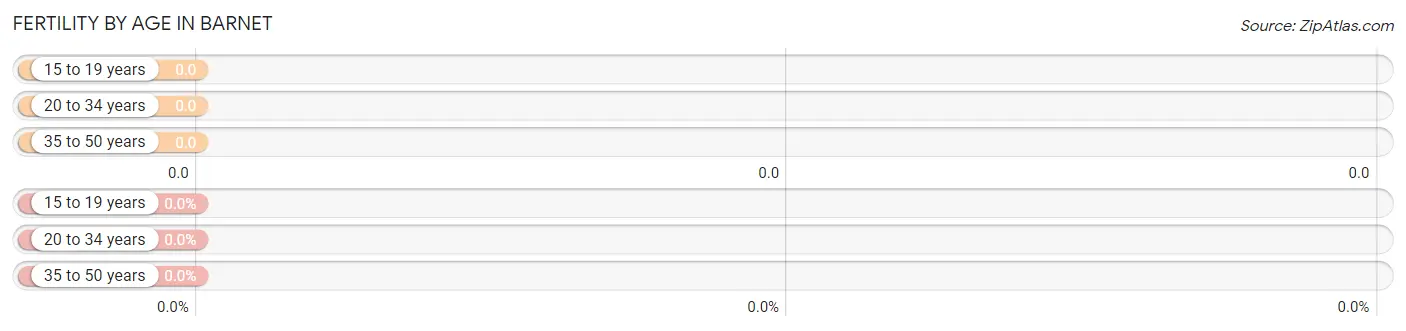
| Age Bracket | Women with Births | Births / 1,000 Women |
| 15 to 19 years | 0 (0.0%) | 0.0 |
| 20 to 34 years | 0 (0.0%) | 0.0 |
| 35 to 50 years | 0 (0.0%) | 0.0 |
| Total | 0 (0.0%) | 0.0 |
Fertility by Age by Marriage Status in Barnet
| Age Bracket | Married | Unmarried |
| 15 to 19 years | 0 (0.0%) | 0 (0.0%) |
| 20 to 34 years | 0 (0.0%) | 0 (0.0%) |
| 35 to 50 years | 0 (0.0%) | 0 (0.0%) |
| Total | 0 (0.0%) | 0 (0.0%) |
Fertility by Education in Barnet
| Educational Attainment | Women with Births | Births / 1,000 Women |
| Less than High School | 0 (0.0%) | 0.0 |
| High School Diploma | 0 (0.0%) | 0.0 |
| College or Associate's Degree | 0 (0.0%) | 0.0 |
| Bachelor's Degree | 0 (0.0%) | 0.0 |
| Graduate Degree | 0 (0.0%) | 0.0 |
| Total | 0 (0.0%) | 0.0 |
Fertility by Education by Marriage Status in Barnet
| Educational Attainment | Married | Unmarried |
| Less than High School | 0 (0.0%) | 0 (0.0%) |
| High School Diploma | 0 (0.0%) | 0 (0.0%) |
| College or Associate's Degree | 0 (0.0%) | 0 (0.0%) |
| Bachelor's Degree | 0 (0.0%) | 0 (0.0%) |
| Graduate Degree | 0 (0.0%) | 0 (0.0%) |
| Total | 0 (0.0%) | 0 (0.0%) |
Employment Characteristics in Barnet
Employment by Class of Employer in Barnet
Among the 31 employed individuals in Barnet, private company employees (14 | 45.2%), not-for-profit organizations (10 | 32.3%), and local government employees (7 | 22.6%) make up the most common classes of employment.
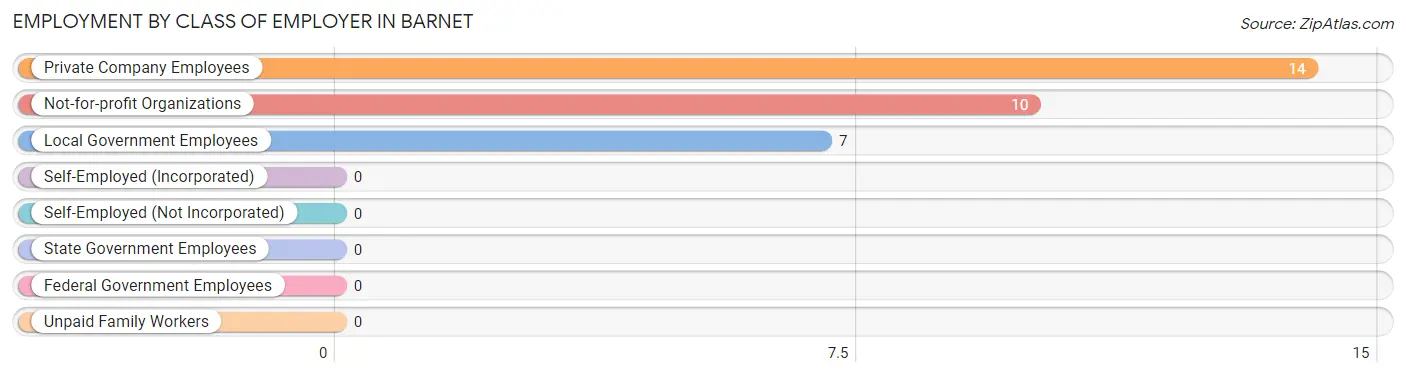
| Employer Class | # Employees | % Employees |
| Private Company Employees | 14 | 45.2% |
| Self-Employed (Incorporated) | 0 | 0.0% |
| Self-Employed (Not Incorporated) | 0 | 0.0% |
| Not-for-profit Organizations | 10 | 32.3% |
| Local Government Employees | 7 | 22.6% |
| State Government Employees | 0 | 0.0% |
| Federal Government Employees | 0 | 0.0% |
| Unpaid Family Workers | 0 | 0.0% |
| Total | 31 | 100.0% |
Employment Status by Age in Barnet
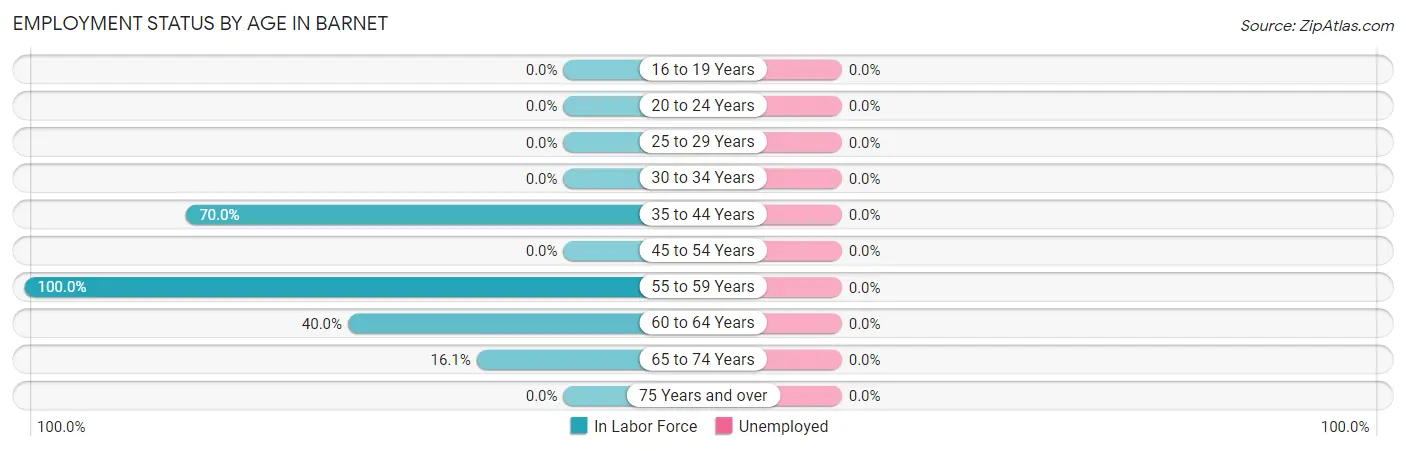
| Age Bracket | In Labor Force | Unemployed |
| 16 to 19 Years | 0 (0.0%) | 0 (0.0%) |
| 20 to 24 Years | 0 (0.0%) | 0 (0.0%) |
| 25 to 29 Years | 0 (0.0%) | 0 (0.0%) |
| 30 to 34 Years | 0 (0.0%) | 0 (0.0%) |
| 35 to 44 Years | 14 (70.0%) | 0 (0.0%) |
| 45 to 54 Years | 0 (0.0%) | 0 (0.0%) |
| 55 to 59 Years | 3 (100.0%) | 0 (0.0%) |
| 60 to 64 Years | 4 (40.0%) | 0 (0.0%) |
| 65 to 74 Years | 10 (16.1%) | 0 (0.0%) |
| 75 Years and over | 0 (0.0%) | 0 (0.0%) |
| Total | 31 (30.7%) | 0 (0.0%) |
Employment Status by Educational Attainment in Barnet
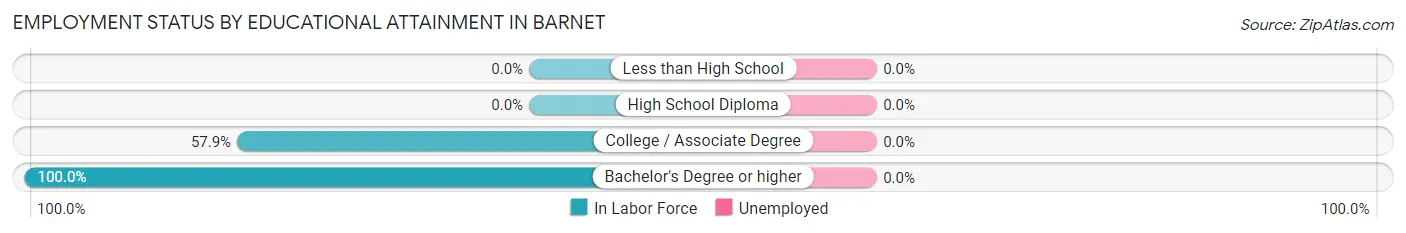
| Educational Attainment | In Labor Force | Unemployed |
| Less than High School | 0 (0.0%) | 0 (0.0%) |
| High School Diploma | 0 (0.0%) | 0 (0.0%) |
| College / Associate Degree | 11 (57.9%) | 0 (0.0%) |
| Bachelor's Degree or higher | 10 (100.0%) | 0 (0.0%) |
| Total | 21 (63.6%) | 0 (0.0%) |
Employment Occupations by Sex in Barnet
Management, Business, Science and Arts Occupations
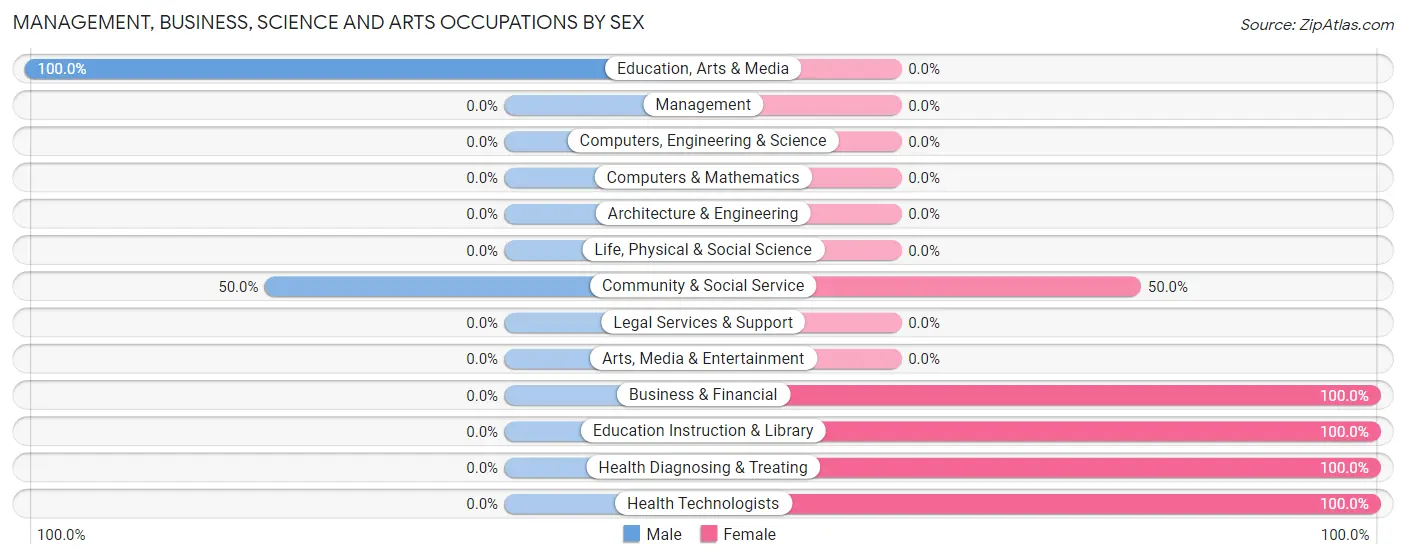
The most common Management, Business, Science and Arts occupations in Barnet are Community & Social Service (6 | 19.4%), Business & Financial (4 | 12.9%), Health Diagnosing & Treating (4 | 12.9%), Health Technologists (4 | 12.9%), and Education, Arts & Media (3 | 9.7%).
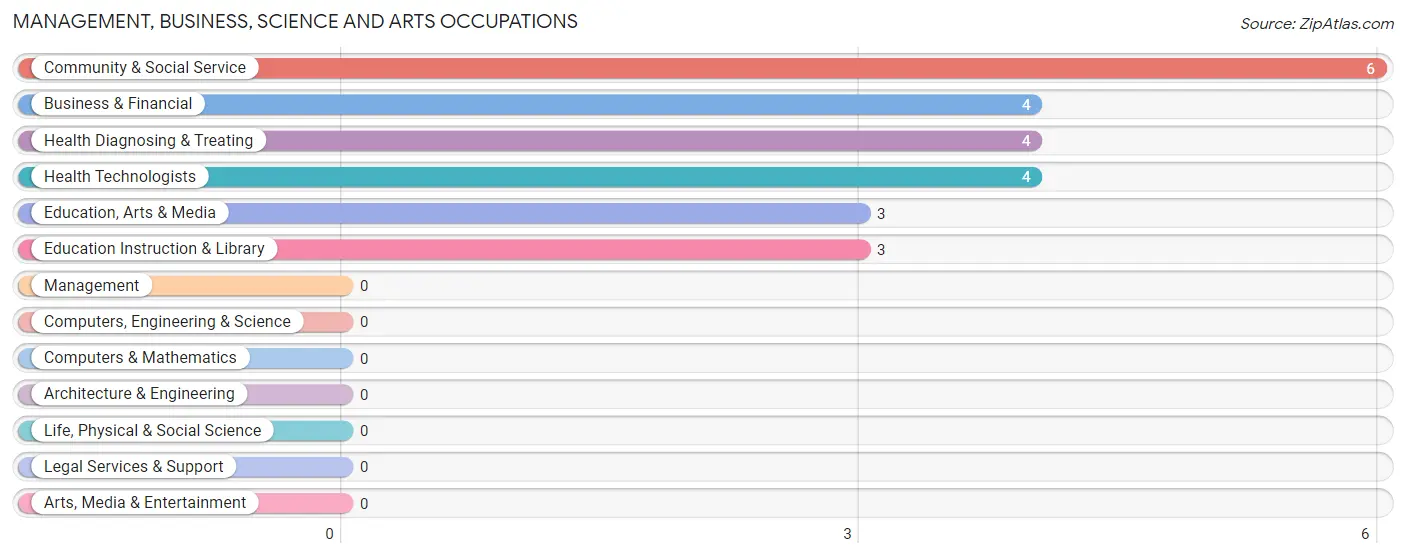
Management, Business, Science and Arts Occupations by Sex
Within the Management, Business, Science and Arts occupations in Barnet, the most male-oriented occupations are Education, Arts & Media (100.0%), and Community & Social Service (50.0%), while the most female-oriented occupations are Business & Financial (100.0%), Education Instruction & Library (100.0%), and Health Diagnosing & Treating (100.0%).
| Occupation | Male | Female |
| Management | 0 (0.0%) | 0 (0.0%) |
| Business & Financial | 0 (0.0%) | 4 (100.0%) |
| Computers, Engineering & Science | 0 (0.0%) | 0 (0.0%) |
| Computers & Mathematics | 0 (0.0%) | 0 (0.0%) |
| Architecture & Engineering | 0 (0.0%) | 0 (0.0%) |
| Life, Physical & Social Science | 0 (0.0%) | 0 (0.0%) |
| Community & Social Service | 3 (50.0%) | 3 (50.0%) |
| Education, Arts & Media | 3 (100.0%) | 0 (0.0%) |
| Legal Services & Support | 0 (0.0%) | 0 (0.0%) |
| Education Instruction & Library | 0 (0.0%) | 3 (100.0%) |
| Arts, Media & Entertainment | 0 (0.0%) | 0 (0.0%) |
| Health Diagnosing & Treating | 0 (0.0%) | 4 (100.0%) |
| Health Technologists | 0 (0.0%) | 4 (100.0%) |
| Total (Category) | 3 (21.4%) | 11 (78.6%) |
| Total (Overall) | 6 (19.4%) | 25 (80.6%) |
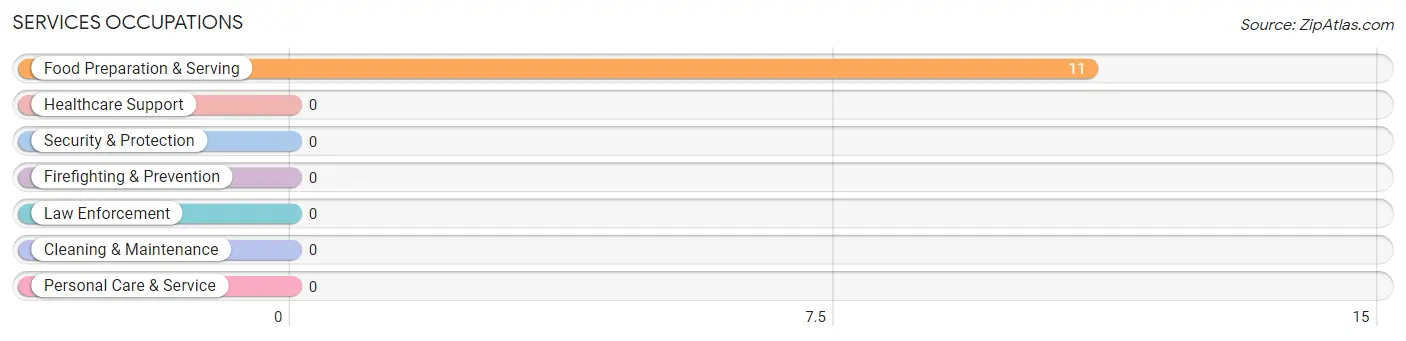
Services Occupations
The most common Services occupations in Barnet are , and Food Preparation & Serving (11 | 35.5%).
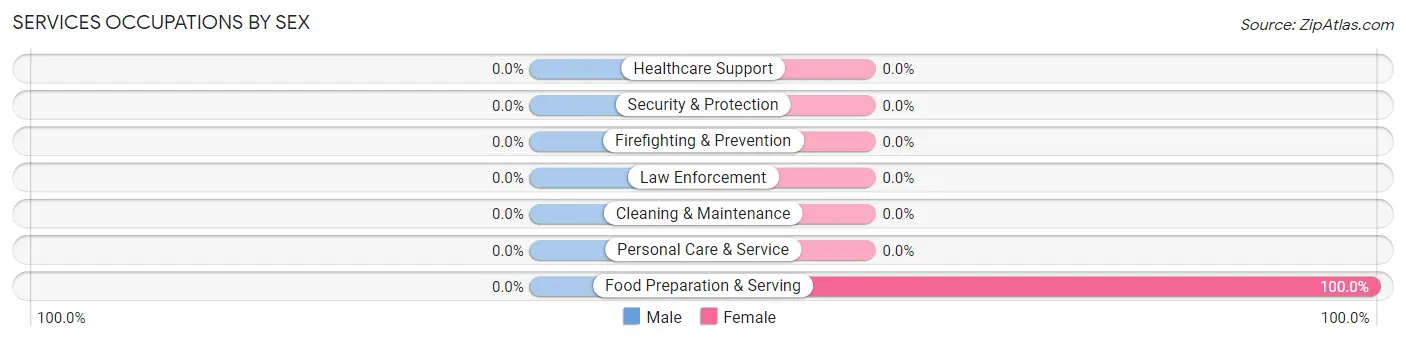
Services Occupations by Sex
| Occupation | Male | Female |
| Healthcare Support | 0 (0.0%) | 0 (0.0%) |
| Security & Protection | 0 (0.0%) | 0 (0.0%) |
| Firefighting & Prevention | 0 (0.0%) | 0 (0.0%) |
| Law Enforcement | 0 (0.0%) | 0 (0.0%) |
| Food Preparation & Serving | 0 (0.0%) | 11 (100.0%) |
| Cleaning & Maintenance | 0 (0.0%) | 0 (0.0%) |
| Personal Care & Service | 0 (0.0%) | 0 (0.0%) |
| Total (Category) | 0 (0.0%) | 11 (100.0%) |
| Total (Overall) | 6 (19.4%) | 25 (80.6%) |
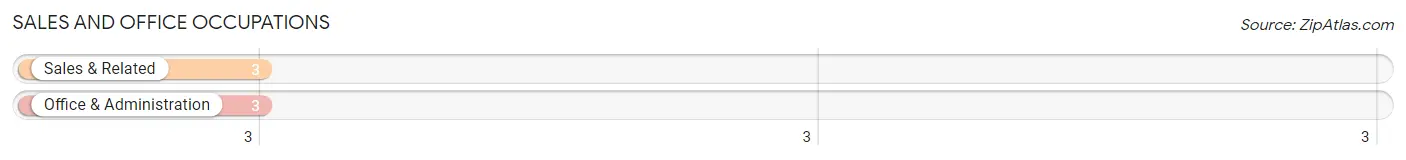
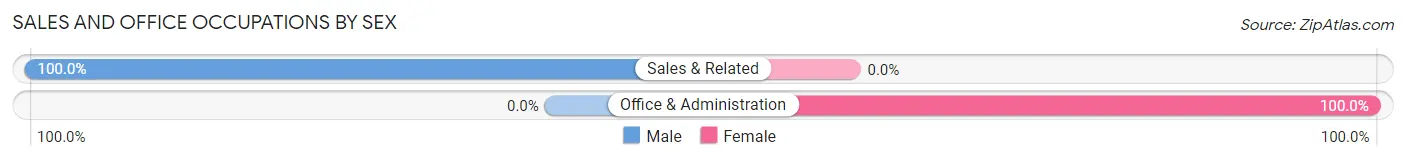
Sales and Office Occupations
The most common Sales and Office occupations in Barnet are Sales & Related (3 | 9.7%), and Office & Administration (3 | 9.7%).
Sales and Office Occupations by Sex
| Occupation | Male | Female |
| Sales & Related | 3 (100.0%) | 0 (0.0%) |
| Office & Administration | 0 (0.0%) | 3 (100.0%) |
| Total (Category) | 3 (50.0%) | 3 (50.0%) |
| Total (Overall) | 6 (19.4%) | 25 (80.6%) |
Natural Resources, Construction and Maintenance Occupations
Natural Resources, Construction and Maintenance Occupations by Sex
| Occupation | Male | Female |
| Farming, Fishing & Forestry | 0 (0.0%) | 0 (0.0%) |
| Construction & Extraction | 0 (0.0%) | 0 (0.0%) |
| Installation, Maintenance & Repair | 0 (0.0%) | 0 (0.0%) |
| Total (Category) | 0 (0.0%) | 0 (0.0%) |
| Total (Overall) | 6 (19.4%) | 25 (80.6%) |
Production, Transportation and Moving Occupations
Production, Transportation and Moving Occupations by Sex
| Occupation | Male | Female |
| Production | 0 (0.0%) | 0 (0.0%) |
| Transportation | 0 (0.0%) | 0 (0.0%) |
| Material Moving | 0 (0.0%) | 0 (0.0%) |
| Total (Category) | 0 (0.0%) | 0 (0.0%) |
| Total (Overall) | 6 (19.4%) | 25 (80.6%) |
Employment Industries by Sex in Barnet
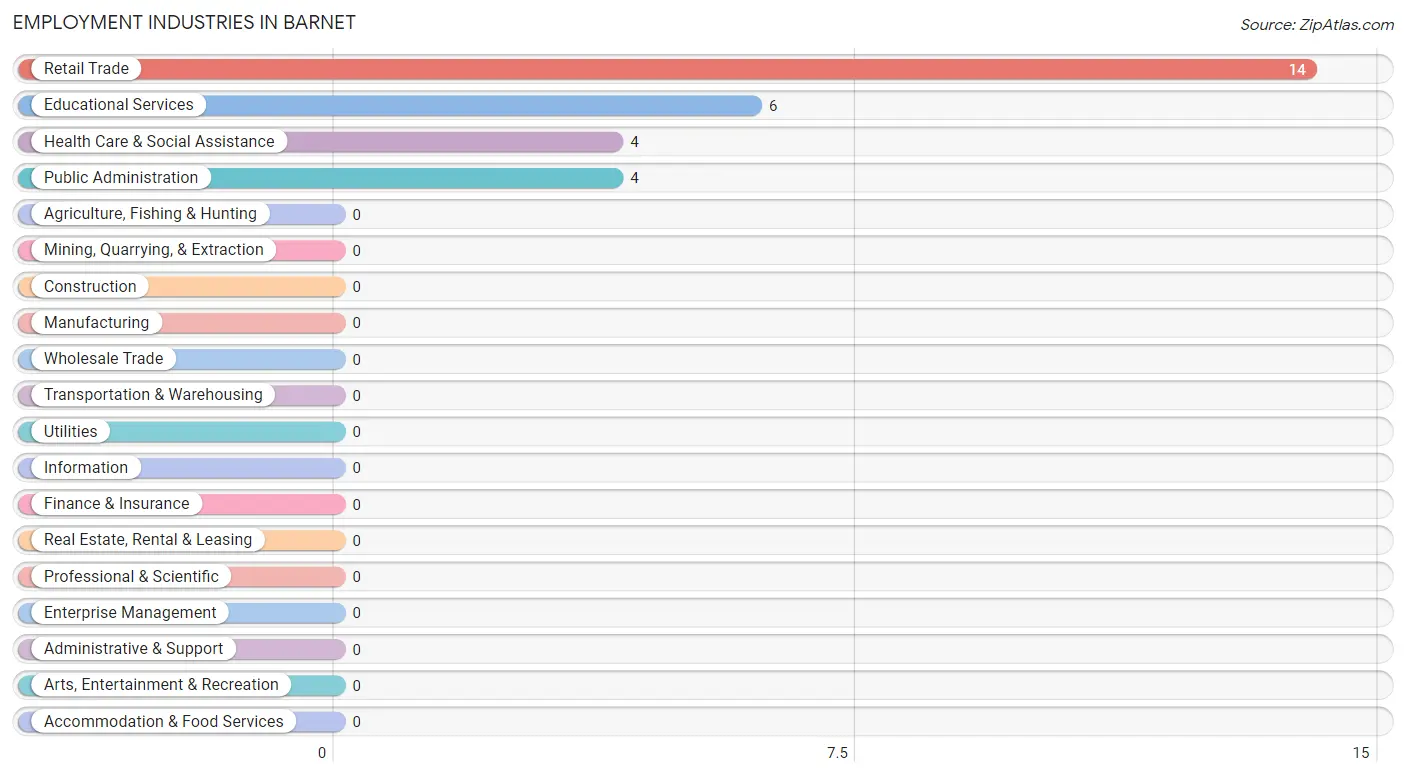
Employment Industries in Barnet
The major employment industries in Barnet include Retail Trade (14 | 45.2%), Educational Services (6 | 19.4%), Health Care & Social Assistance (4 | 12.9%), and Public Administration (4 | 12.9%).
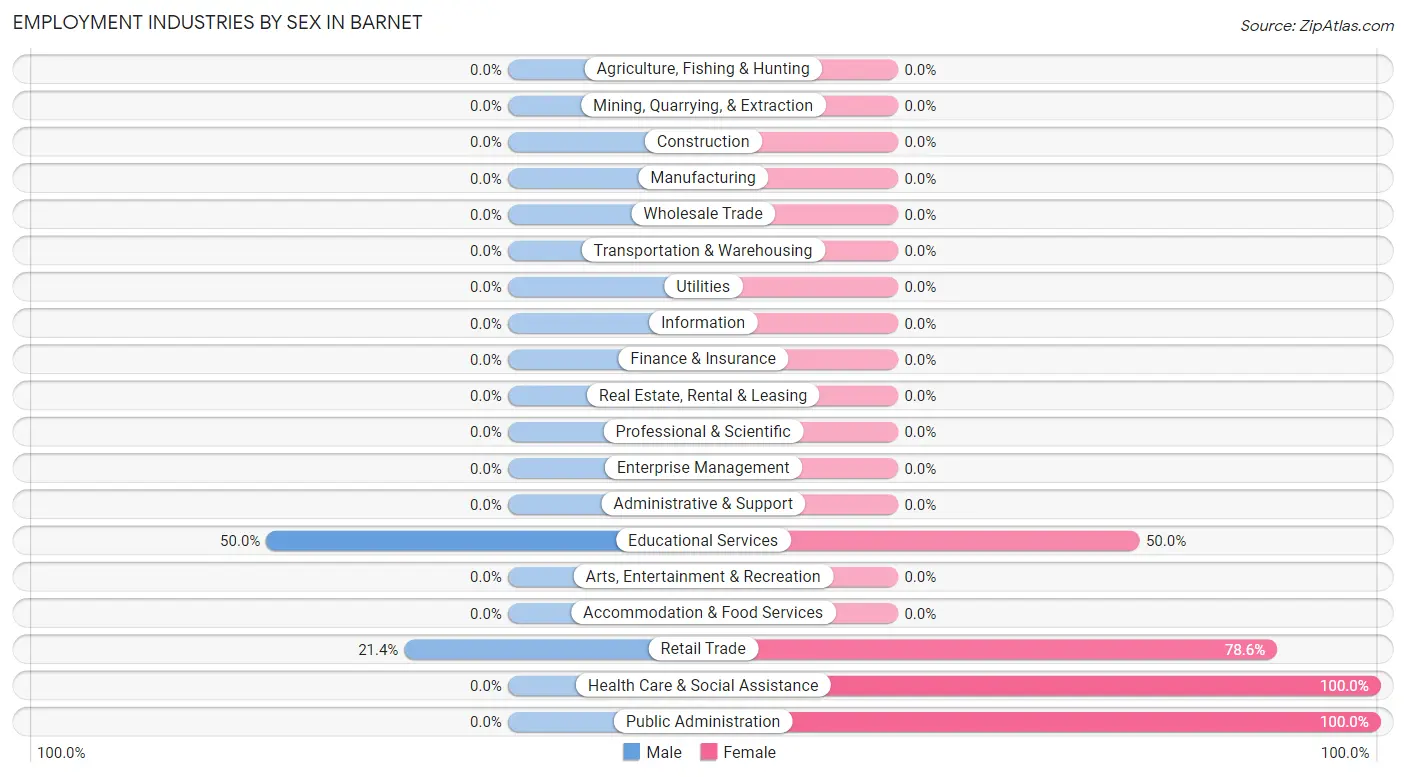
Employment Industries by Sex in Barnet
The Barnet industries that see more men than women are Educational Services (50.0%), and Retail Trade (21.4%), whereas the industries that tend to have a higher number of women are Health Care & Social Assistance (100.0%), Public Administration (100.0%), and Retail Trade (78.6%).
| Industry | Male | Female |
| Agriculture, Fishing & Hunting | 0 (0.0%) | 0 (0.0%) |
| Mining, Quarrying, & Extraction | 0 (0.0%) | 0 (0.0%) |
| Construction | 0 (0.0%) | 0 (0.0%) |
| Manufacturing | 0 (0.0%) | 0 (0.0%) |
| Wholesale Trade | 0 (0.0%) | 0 (0.0%) |
| Retail Trade | 3 (21.4%) | 11 (78.6%) |
| Transportation & Warehousing | 0 (0.0%) | 0 (0.0%) |
| Utilities | 0 (0.0%) | 0 (0.0%) |
| Information | 0 (0.0%) | 0 (0.0%) |
| Finance & Insurance | 0 (0.0%) | 0 (0.0%) |
| Real Estate, Rental & Leasing | 0 (0.0%) | 0 (0.0%) |
| Professional & Scientific | 0 (0.0%) | 0 (0.0%) |
| Enterprise Management | 0 (0.0%) | 0 (0.0%) |
| Administrative & Support | 0 (0.0%) | 0 (0.0%) |
| Educational Services | 3 (50.0%) | 3 (50.0%) |
| Health Care & Social Assistance | 0 (0.0%) | 4 (100.0%) |
| Arts, Entertainment & Recreation | 0 (0.0%) | 0 (0.0%) |
| Accommodation & Food Services | 0 (0.0%) | 0 (0.0%) |
| Public Administration | 0 (0.0%) | 4 (100.0%) |
| Total | 6 (19.4%) | 25 (80.6%) |
Education in Barnet
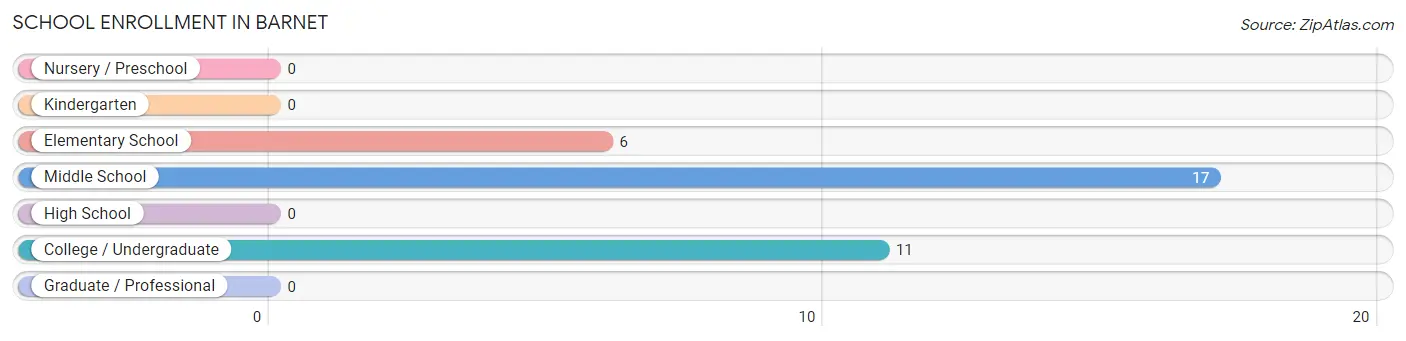
School Enrollment in Barnet
The most common levels of schooling among the 34 students in Barnet are middle school (17 | 50.0%), college / undergraduate (11 | 32.4%), and elementary school (6 | 17.6%).
| School Level | # Students | % Students |
| Nursery / Preschool | 0 | 0.0% |
| Kindergarten | 0 | 0.0% |
| Elementary School | 6 | 17.6% |
| Middle School | 17 | 50.0% |
| High School | 0 | 0.0% |
| College / Undergraduate | 11 | 32.4% |
| Graduate / Professional | 0 | 0.0% |
| Total | 34 | 100.0% |
School Enrollment by Age by Funding Source in Barnet
Out of a total of 34 students who are enrolled in schools in Barnet, 6 (17.6%) attend a private institution, while the remaining 28 (82.4%) are enrolled in public schools. The age group of 5 to 9 year old has the highest likelihood of being enrolled in private schools, with 6 (100.0% in the age bracket) enrolled. Conversely, the age group of 10 to 14 year olds has the lowest likelihood of being enrolled in a private school, with 17 (100.0% in the age bracket) attending a public institution.
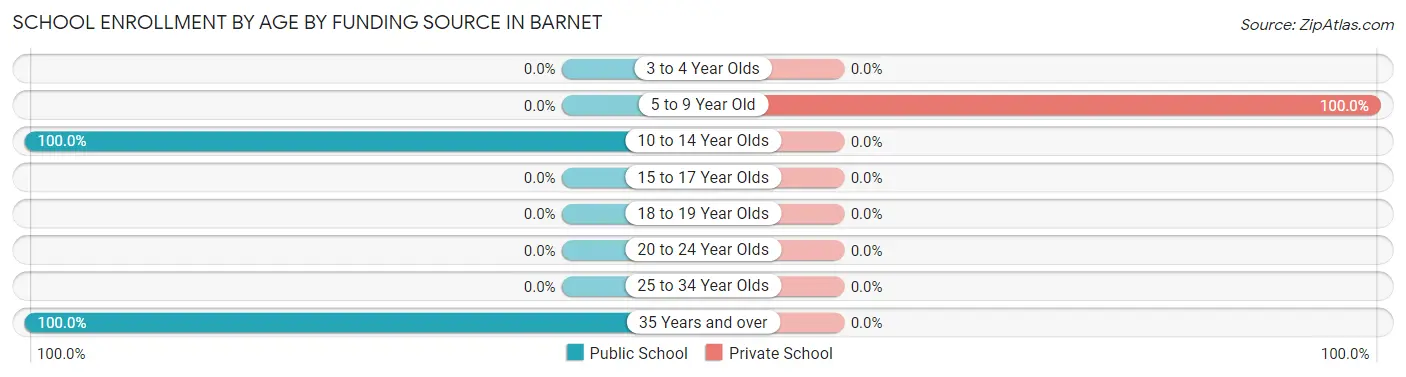
| Age Bracket | Public School | Private School |
| 3 to 4 Year Olds | 0 (0.0%) | 0 (0.0%) |
| 5 to 9 Year Old | 0 (0.0%) | 6 (100.0%) |
| 10 to 14 Year Olds | 17 (100.0%) | 0 (0.0%) |
| 15 to 17 Year Olds | 0 (0.0%) | 0 (0.0%) |
| 18 to 19 Year Olds | 0 (0.0%) | 0 (0.0%) |
| 20 to 24 Year Olds | 0 (0.0%) | 0 (0.0%) |
| 25 to 34 Year Olds | 0 (0.0%) | 0 (0.0%) |
| 35 Years and over | 11 (100.0%) | 0 (0.0%) |
| Total | 28 (82.4%) | 6 (17.6%) |
Educational Attainment by Field of Study in Barnet
Liberal arts & history (6 | 30.0%), science & technology (4 | 20.0%), psychology (3 | 15.0%), literature & languages (3 | 15.0%), and visual & performing arts (3 | 15.0%) are the most common fields of study among 20 individuals in Barnet who have obtained a bachelor's degree or higher.
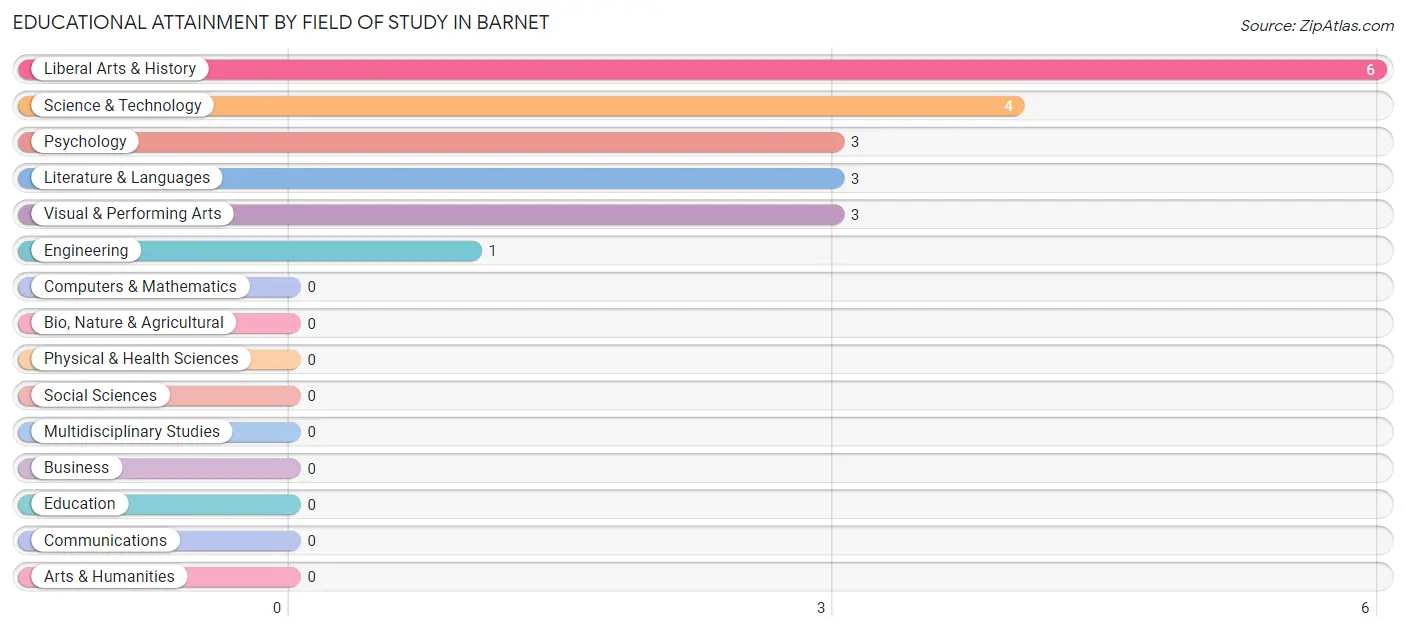
| Field of Study | # Graduates | % Graduates |
| Computers & Mathematics | 0 | 0.0% |
| Bio, Nature & Agricultural | 0 | 0.0% |
| Physical & Health Sciences | 0 | 0.0% |
| Psychology | 3 | 15.0% |
| Social Sciences | 0 | 0.0% |
| Engineering | 1 | 5.0% |
| Multidisciplinary Studies | 0 | 0.0% |
| Science & Technology | 4 | 20.0% |
| Business | 0 | 0.0% |
| Education | 0 | 0.0% |
| Literature & Languages | 3 | 15.0% |
| Liberal Arts & History | 6 | 30.0% |
| Visual & Performing Arts | 3 | 15.0% |
| Communications | 0 | 0.0% |
| Arts & Humanities | 0 | 0.0% |
| Total | 20 | 100.0% |
Transportation & Commute in Barnet
Vehicle Availability by Sex in Barnet
The most prevalent vehicle ownership categories in Barnet are males with 2 vehicles (3, accounting for 50.0%) and females with 2 vehicles (8, making up 12.0%).
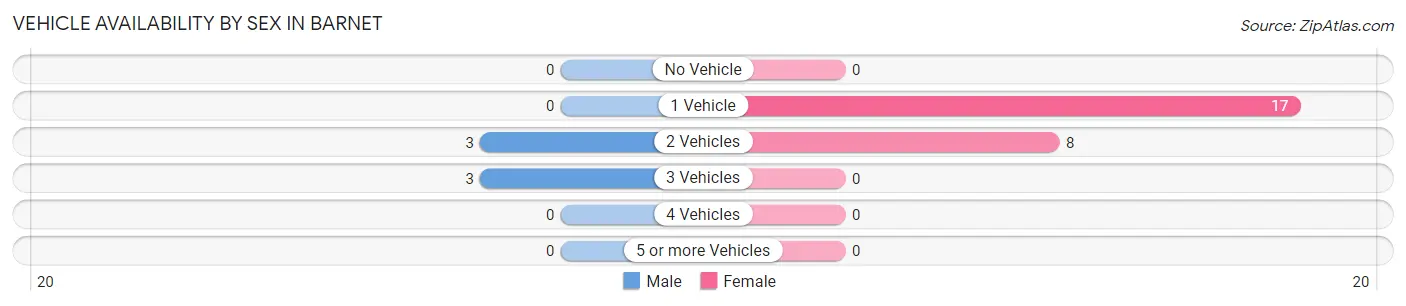
| Vehicles Available | Male | Female |
| No Vehicle | 0 (0.0%) | 0 (0.0%) |
| 1 Vehicle | 0 (0.0%) | 17 (68.0%) |
| 2 Vehicles | 3 (50.0%) | 8 (32.0%) |
| 3 Vehicles | 3 (50.0%) | 0 (0.0%) |
| 4 Vehicles | 0 (0.0%) | 0 (0.0%) |
| 5 or more Vehicles | 0 (0.0%) | 0 (0.0%) |
| Total | 6 (100.0%) | 25 (100.0%) |
Commute Time in Barnet
The most frequently occuring commute durations in Barnet are 30 to 34 minutes (14 commuters, 58.3%), 60 to 89 minutes (4 commuters, 16.7%), and 5 to 9 minutes (3 commuters, 12.5%).
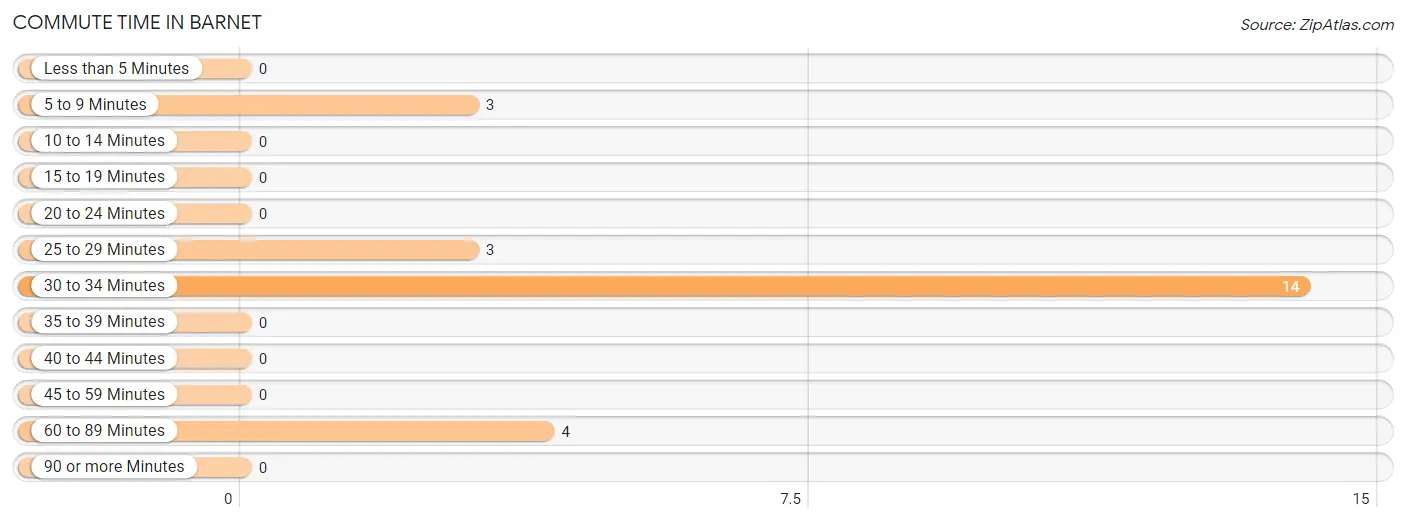
| Commute Time | # Commuters | % Commuters |
| Less than 5 Minutes | 0 | 0.0% |
| 5 to 9 Minutes | 3 | 12.5% |
| 10 to 14 Minutes | 0 | 0.0% |
| 15 to 19 Minutes | 0 | 0.0% |
| 20 to 24 Minutes | 0 | 0.0% |
| 25 to 29 Minutes | 3 | 12.5% |
| 30 to 34 Minutes | 14 | 58.3% |
| 35 to 39 Minutes | 0 | 0.0% |
| 40 to 44 Minutes | 0 | 0.0% |
| 45 to 59 Minutes | 0 | 0.0% |
| 60 to 89 Minutes | 4 | 16.7% |
| 90 or more Minutes | 0 | 0.0% |
Commute Time by Sex in Barnet
The most common commute times in Barnet are 5 to 9 minutes (3 commuters, 50.0%) for males and 30 to 34 minutes (14 commuters, 77.8%) for females.
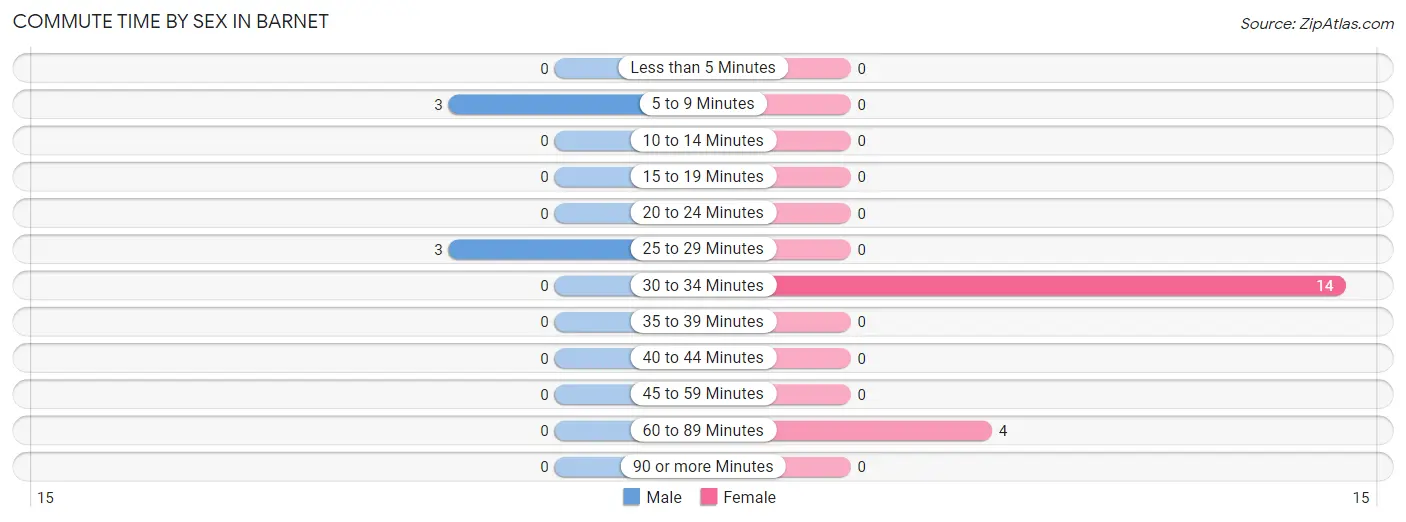
| Commute Time | Male | Female |
| Less than 5 Minutes | 0 (0.0%) | 0 (0.0%) |
| 5 to 9 Minutes | 3 (50.0%) | 0 (0.0%) |
| 10 to 14 Minutes | 0 (0.0%) | 0 (0.0%) |
| 15 to 19 Minutes | 0 (0.0%) | 0 (0.0%) |
| 20 to 24 Minutes | 0 (0.0%) | 0 (0.0%) |
| 25 to 29 Minutes | 3 (50.0%) | 0 (0.0%) |
| 30 to 34 Minutes | 0 (0.0%) | 14 (77.8%) |
| 35 to 39 Minutes | 0 (0.0%) | 0 (0.0%) |
| 40 to 44 Minutes | 0 (0.0%) | 0 (0.0%) |
| 45 to 59 Minutes | 0 (0.0%) | 0 (0.0%) |
| 60 to 89 Minutes | 0 (0.0%) | 4 (22.2%) |
| 90 or more Minutes | 0 (0.0%) | 0 (0.0%) |
Time of Departure to Work by Sex in Barnet
The most frequent times of departure to work in Barnet are 8:30 AM to 8:59 AM (3, 50.0%) for males and 10:00 AM to 10:59 AM (11, 61.1%) for females.
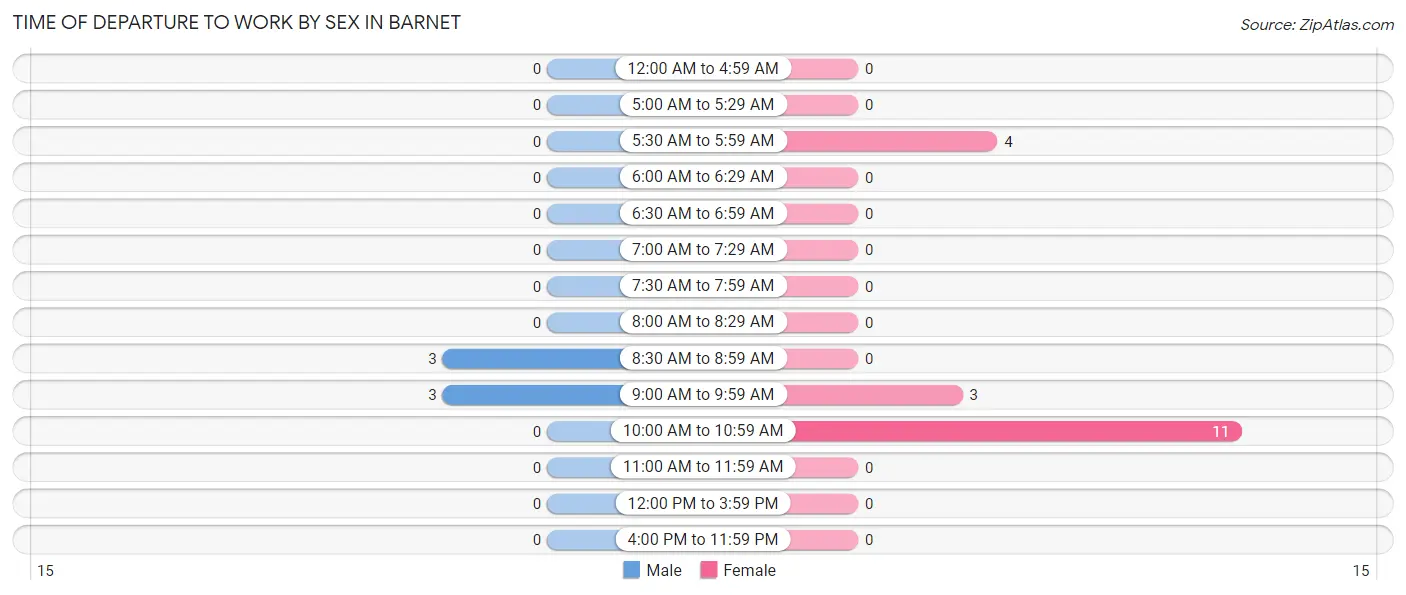
| Time of Departure | Male | Female |
| 12:00 AM to 4:59 AM | 0 (0.0%) | 0 (0.0%) |
| 5:00 AM to 5:29 AM | 0 (0.0%) | 0 (0.0%) |
| 5:30 AM to 5:59 AM | 0 (0.0%) | 4 (22.2%) |
| 6:00 AM to 6:29 AM | 0 (0.0%) | 0 (0.0%) |
| 6:30 AM to 6:59 AM | 0 (0.0%) | 0 (0.0%) |
| 7:00 AM to 7:29 AM | 0 (0.0%) | 0 (0.0%) |
| 7:30 AM to 7:59 AM | 0 (0.0%) | 0 (0.0%) |
| 8:00 AM to 8:29 AM | 0 (0.0%) | 0 (0.0%) |
| 8:30 AM to 8:59 AM | 3 (50.0%) | 0 (0.0%) |
| 9:00 AM to 9:59 AM | 3 (50.0%) | 3 (16.7%) |
| 10:00 AM to 10:59 AM | 0 (0.0%) | 11 (61.1%) |
| 11:00 AM to 11:59 AM | 0 (0.0%) | 0 (0.0%) |
| 12:00 PM to 3:59 PM | 0 (0.0%) | 0 (0.0%) |
| 4:00 PM to 11:59 PM | 0 (0.0%) | 0 (0.0%) |
| Total | 6 (100.0%) | 18 (100.0%) |
Housing Occupancy in Barnet
Occupancy by Ownership in Barnet
Of the total 30 dwellings in Barnet, owner-occupied units account for 19 (63.3%), while renter-occupied units make up 11 (36.7%).
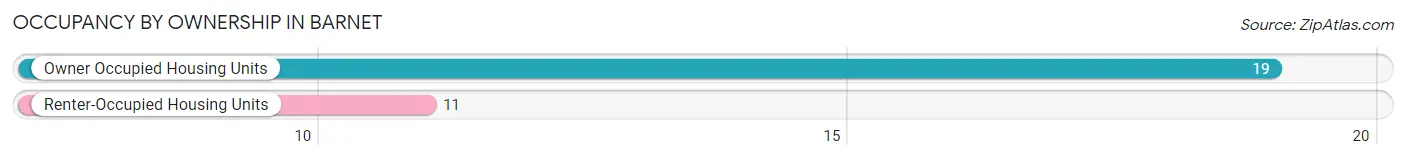
| Occupancy | # Housing Units | % Housing Units |
| Owner Occupied Housing Units | 19 | 63.3% |
| Renter-Occupied Housing Units | 11 | 36.7% |
| Total Occupied Housing Units | 30 | 100.0% |
Occupancy by Household Size in Barnet
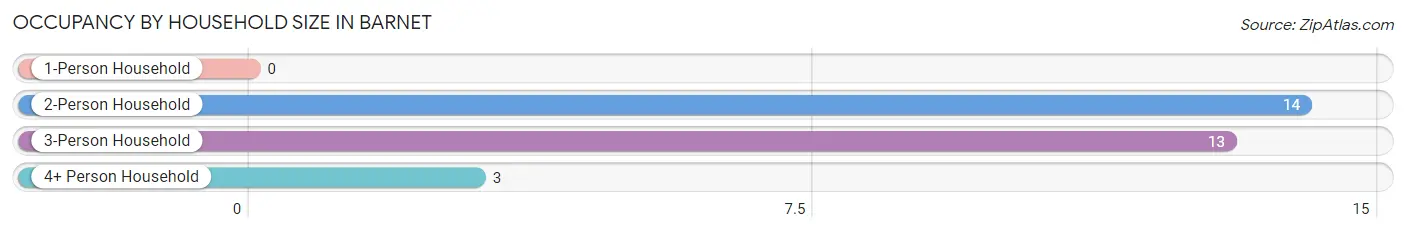
| Household Size | # Housing Units | % Housing Units |
| 1-Person Household | 0 | 0.0% |
| 2-Person Household | 14 | 46.7% |
| 3-Person Household | 13 | 43.3% |
| 4+ Person Household | 3 | 10.0% |
| Total Housing Units | 30 | 100.0% |
Occupancy by Ownership by Household Size in Barnet
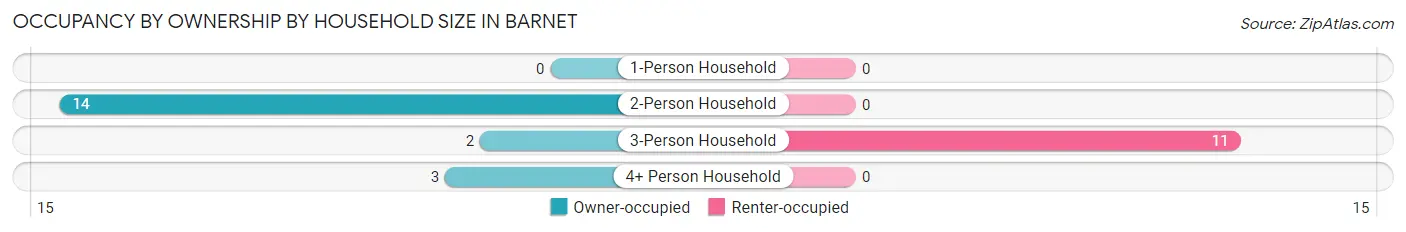
| Household Size | Owner-occupied | Renter-occupied |
| 1-Person Household | 0 (0.0%) | 0 (0.0%) |
| 2-Person Household | 14 (100.0%) | 0 (0.0%) |
| 3-Person Household | 2 (15.4%) | 11 (84.6%) |
| 4+ Person Household | 3 (100.0%) | 0 (0.0%) |
| Total Housing Units | 19 (63.3%) | 11 (36.7%) |
Occupancy by Educational Attainment in Barnet
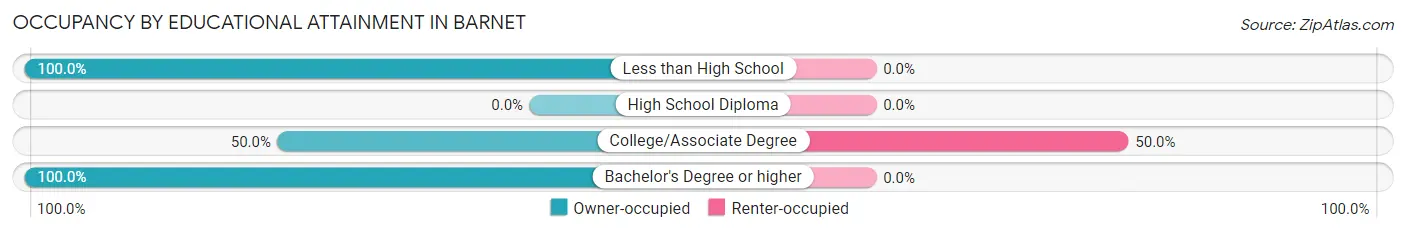
| Household Size | Owner-occupied | Renter-occupied |
| Less than High School | 2 (100.0%) | 0 (0.0%) |
| High School Diploma | 0 (0.0%) | 0 (0.0%) |
| College/Associate Degree | 11 (50.0%) | 11 (50.0%) |
| Bachelor's Degree or higher | 6 (100.0%) | 0 (0.0%) |
Occupancy by Age of Householder in Barnet
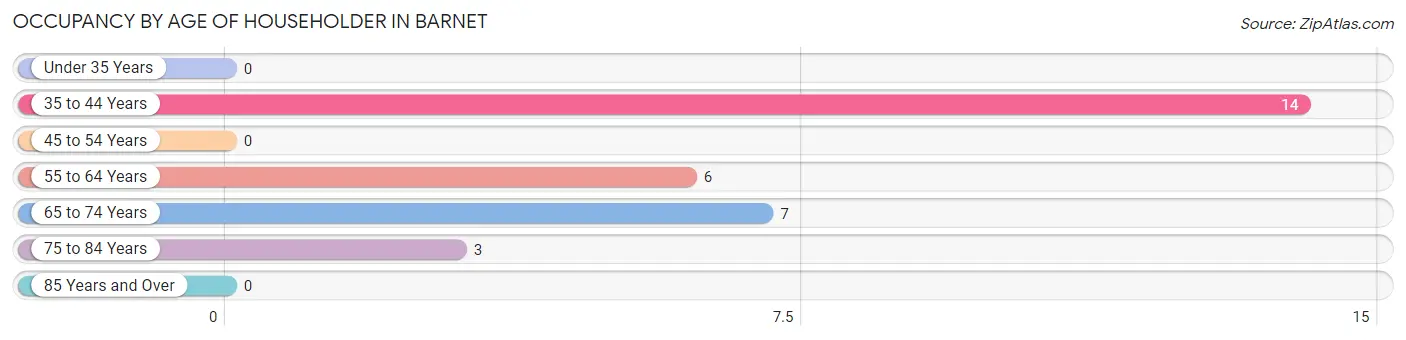
| Age Bracket | # Households | % Households |
| Under 35 Years | 0 | 0.0% |
| 35 to 44 Years | 14 | 46.7% |
| 45 to 54 Years | 0 | 0.0% |
| 55 to 64 Years | 6 | 20.0% |
| 65 to 74 Years | 7 | 23.3% |
| 75 to 84 Years | 3 | 10.0% |
| 85 Years and Over | 0 | 0.0% |
| Total | 30 | 100.0% |
Housing Finances in Barnet
Median Income by Occupancy in Barnet
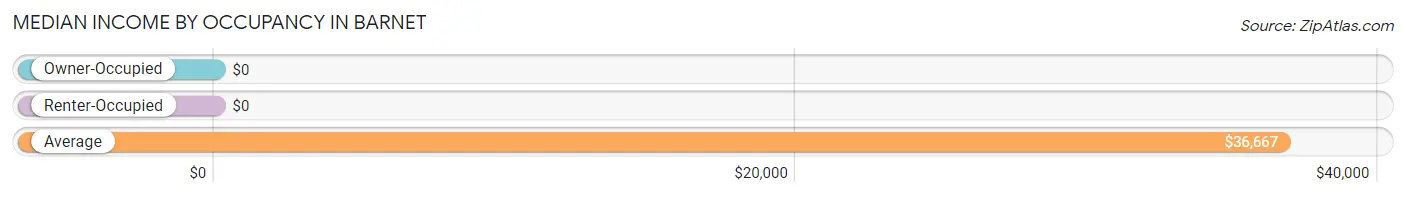
| Occupancy Type | # Households | Median Income |
| Owner-Occupied | 19 (63.3%) | $0 |
| Renter-Occupied | 11 (36.7%) | $0 |
| Average | 30 (100.0%) | $36,667 |
Occupancy by Householder Income Bracket in Barnet
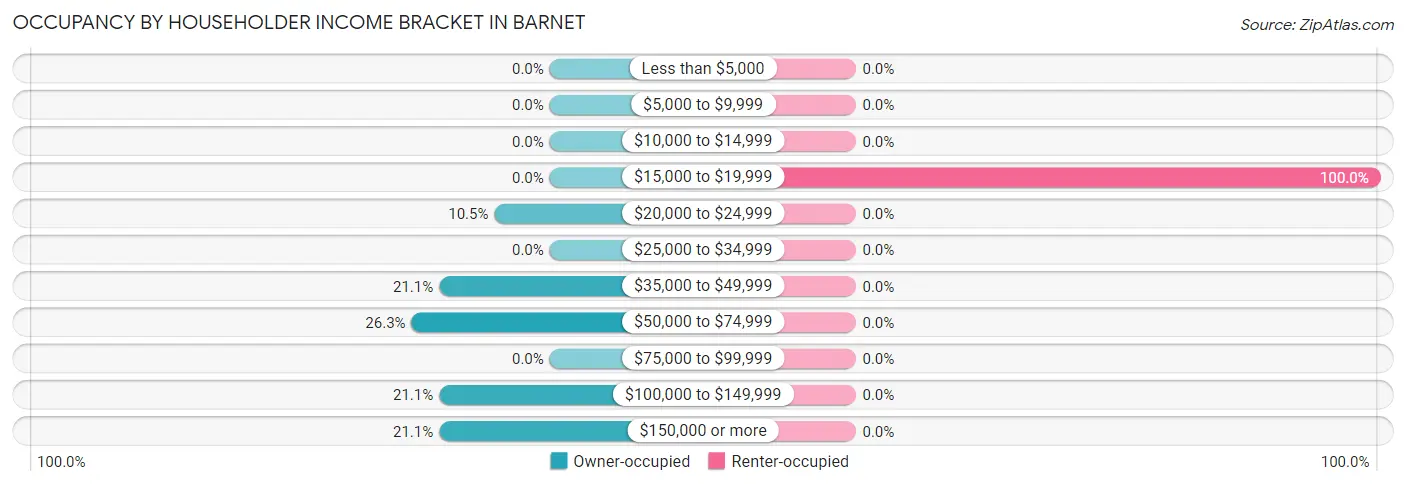
| Income Bracket | Owner-occupied | Renter-occupied |
| Less than $5,000 | 0 (0.0%) | 0 (0.0%) |
| $5,000 to $9,999 | 0 (0.0%) | 0 (0.0%) |
| $10,000 to $14,999 | 0 (0.0%) | 0 (0.0%) |
| $15,000 to $19,999 | 0 (0.0%) | 11 (100.0%) |
| $20,000 to $24,999 | 2 (10.5%) | 0 (0.0%) |
| $25,000 to $34,999 | 0 (0.0%) | 0 (0.0%) |
| $35,000 to $49,999 | 4 (21.0%) | 0 (0.0%) |
| $50,000 to $74,999 | 5 (26.3%) | 0 (0.0%) |
| $75,000 to $99,999 | 0 (0.0%) | 0 (0.0%) |
| $100,000 to $149,999 | 4 (21.0%) | 0 (0.0%) |
| $150,000 or more | 4 (21.0%) | 0 (0.0%) |
| Total | 19 (100.0%) | 11 (100.0%) |
Monthly Housing Cost Tiers in Barnet
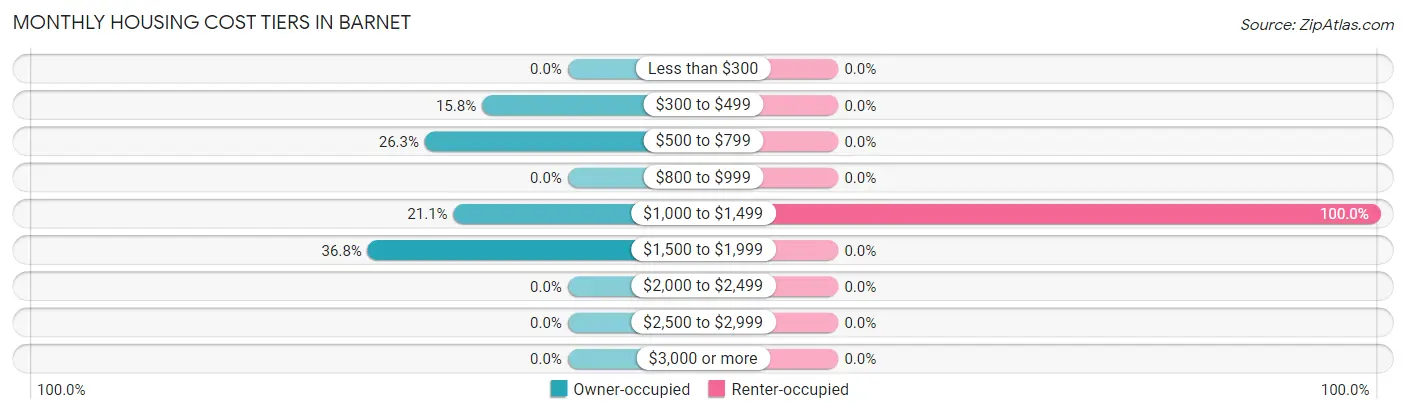
| Monthly Cost | Owner-occupied | Renter-occupied |
| Less than $300 | 0 (0.0%) | 0 (0.0%) |
| $300 to $499 | 3 (15.8%) | 0 (0.0%) |
| $500 to $799 | 5 (26.3%) | 0 (0.0%) |
| $800 to $999 | 0 (0.0%) | 0 (0.0%) |
| $1,000 to $1,499 | 4 (21.0%) | 11 (100.0%) |
| $1,500 to $1,999 | 7 (36.8%) | 0 (0.0%) |
| $2,000 to $2,499 | 0 (0.0%) | 0 (0.0%) |
| $2,500 to $2,999 | 0 (0.0%) | 0 (0.0%) |
| $3,000 or more | 0 (0.0%) | 0 (0.0%) |
| Total | 19 (100.0%) | 11 (100.0%) |
Physical Housing Characteristics in Barnet
Housing Structures in Barnet
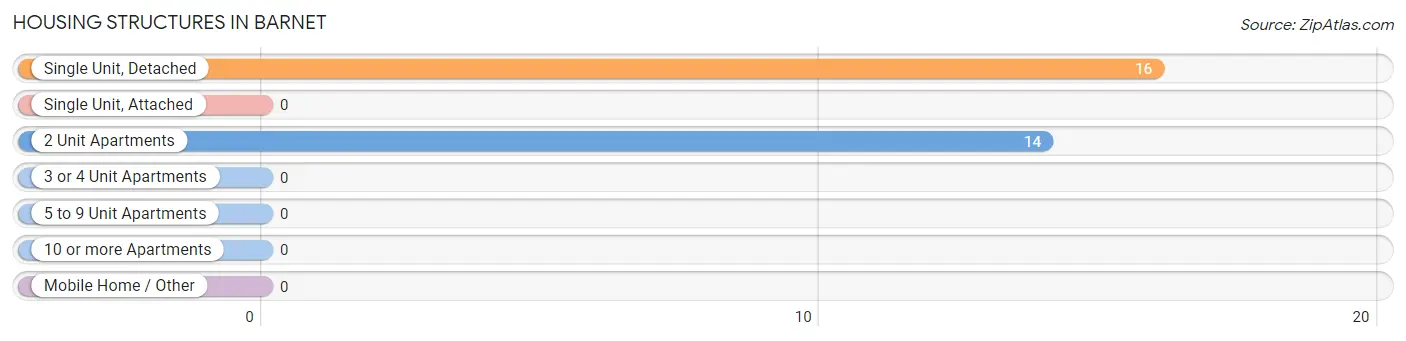
| Structure Type | # Housing Units | % Housing Units |
| Single Unit, Detached | 16 | 53.3% |
| Single Unit, Attached | 0 | 0.0% |
| 2 Unit Apartments | 14 | 46.7% |
| 3 or 4 Unit Apartments | 0 | 0.0% |
| 5 to 9 Unit Apartments | 0 | 0.0% |
| 10 or more Apartments | 0 | 0.0% |
| Mobile Home / Other | 0 | 0.0% |
| Total | 30 | 100.0% |
Housing Structures by Occupancy in Barnet
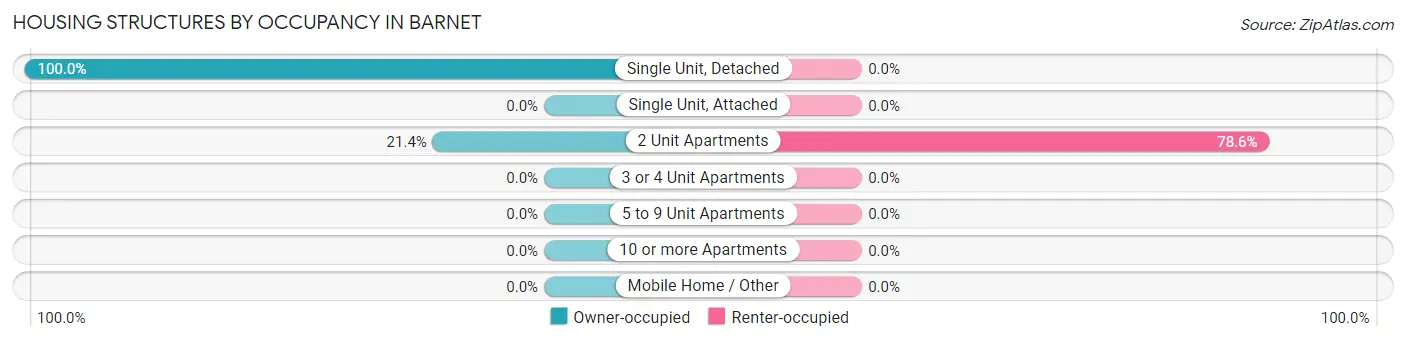
| Structure Type | Owner-occupied | Renter-occupied |
| Single Unit, Detached | 16 (100.0%) | 0 (0.0%) |
| Single Unit, Attached | 0 (0.0%) | 0 (0.0%) |
| 2 Unit Apartments | 3 (21.4%) | 11 (78.6%) |
| 3 or 4 Unit Apartments | 0 (0.0%) | 0 (0.0%) |
| 5 to 9 Unit Apartments | 0 (0.0%) | 0 (0.0%) |
| 10 or more Apartments | 0 (0.0%) | 0 (0.0%) |
| Mobile Home / Other | 0 (0.0%) | 0 (0.0%) |
| Total | 19 (63.3%) | 11 (36.7%) |
Housing Structures by Number of Rooms in Barnet
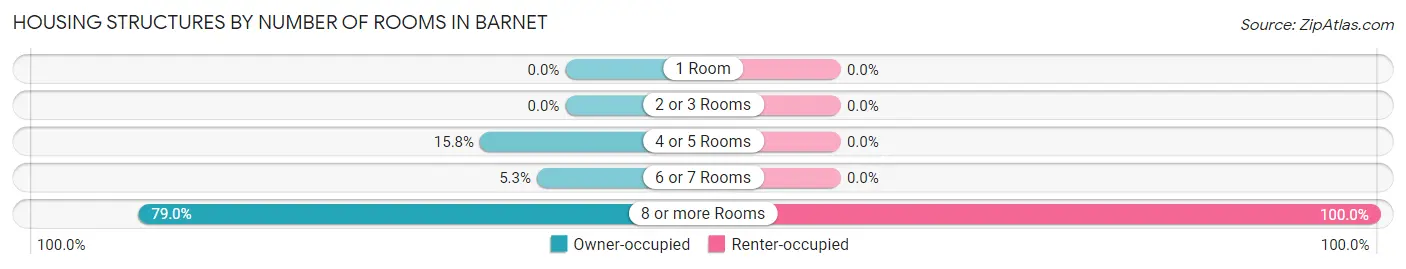
| Number of Rooms | Owner-occupied | Renter-occupied |
| 1 Room | 0 (0.0%) | 0 (0.0%) |
| 2 or 3 Rooms | 0 (0.0%) | 0 (0.0%) |
| 4 or 5 Rooms | 3 (15.8%) | 0 (0.0%) |
| 6 or 7 Rooms | 1 (5.3%) | 0 (0.0%) |
| 8 or more Rooms | 15 (78.9%) | 11 (100.0%) |
| Total | 19 (100.0%) | 11 (100.0%) |
Housing Structure by Heating Type in Barnet
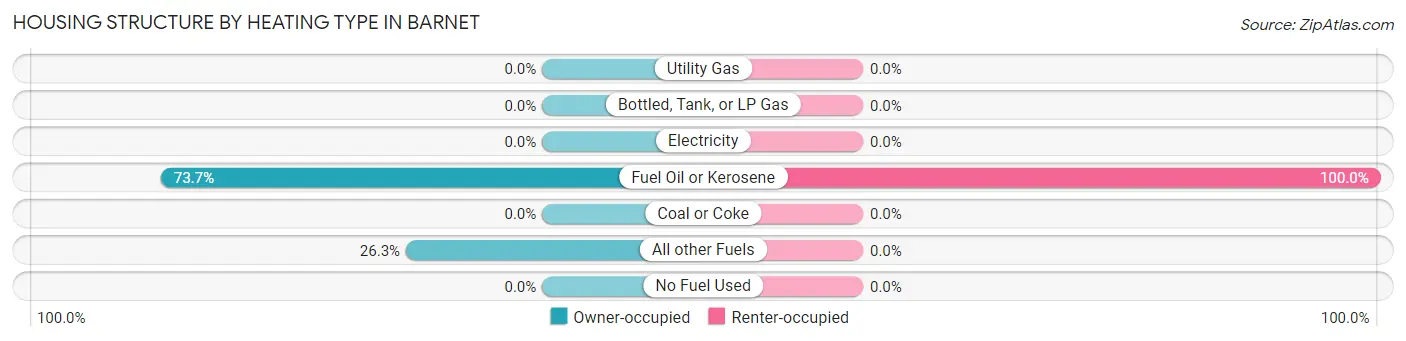
| Heating Type | Owner-occupied | Renter-occupied |
| Utility Gas | 0 (0.0%) | 0 (0.0%) |
| Bottled, Tank, or LP Gas | 0 (0.0%) | 0 (0.0%) |
| Electricity | 0 (0.0%) | 0 (0.0%) |
| Fuel Oil or Kerosene | 14 (73.7%) | 11 (100.0%) |
| Coal or Coke | 0 (0.0%) | 0 (0.0%) |
| All other Fuels | 5 (26.3%) | 0 (0.0%) |
| No Fuel Used | 0 (0.0%) | 0 (0.0%) |
| Total | 19 (100.0%) | 11 (100.0%) |
Household Vehicle Usage in Barnet
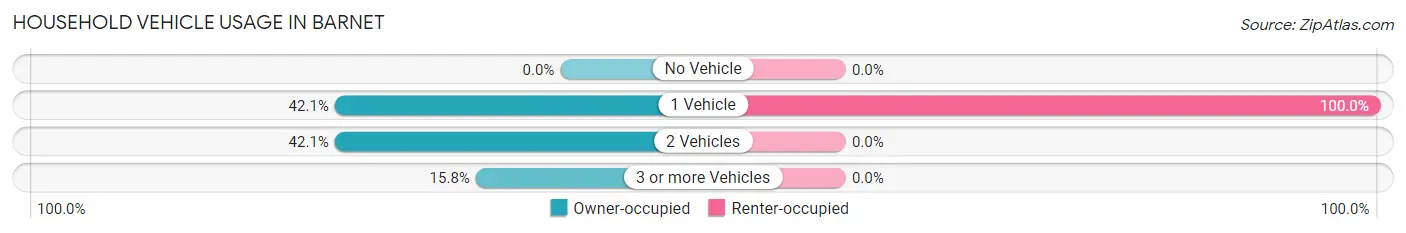
| Vehicles per Household | Owner-occupied | Renter-occupied |
| No Vehicle | 0 (0.0%) | 0 (0.0%) |
| 1 Vehicle | 8 (42.1%) | 11 (100.0%) |
| 2 Vehicles | 8 (42.1%) | 0 (0.0%) |
| 3 or more Vehicles | 3 (15.8%) | 0 (0.0%) |
| Total | 19 (100.0%) | 11 (100.0%) |
Real Estate & Mortgages in Barnet
Real Estate and Mortgage Overview in Barnet
| Characteristic | Without Mortgage | With Mortgage |
| Housing Units | 12 | 7 |
| Median Property Value | $200,000 | $0 |
| Median Household Income | - | - |
| Monthly Housing Costs | $733 | $0 |
| Real Estate Taxes | $3,500 | $0 |
Property Value by Mortgage Status in Barnet
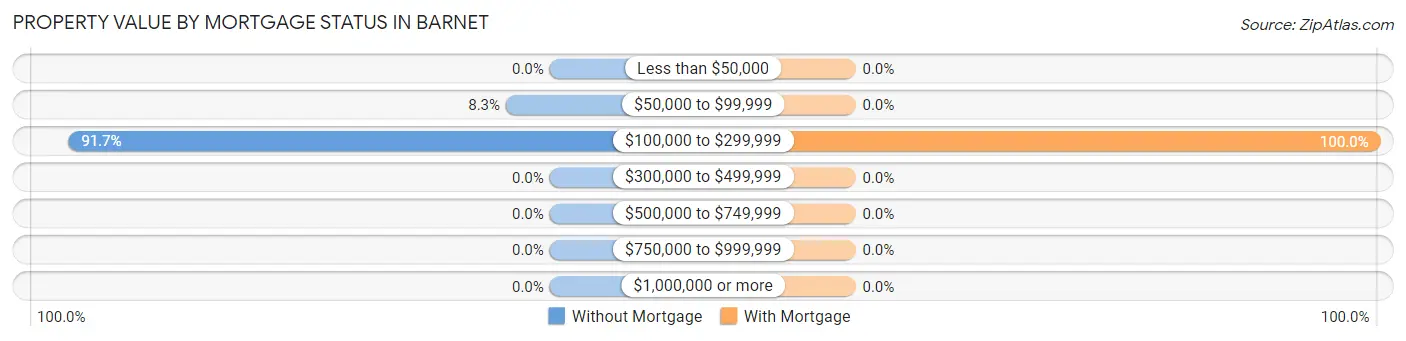
| Property Value | Without Mortgage | With Mortgage |
| Less than $50,000 | 0 (0.0%) | 0 (0.0%) |
| $50,000 to $99,999 | 1 (8.3%) | 0 (0.0%) |
| $100,000 to $299,999 | 11 (91.7%) | 7 (100.0%) |
| $300,000 to $499,999 | 0 (0.0%) | 0 (0.0%) |
| $500,000 to $749,999 | 0 (0.0%) | 0 (0.0%) |
| $750,000 to $999,999 | 0 (0.0%) | 0 (0.0%) |
| $1,000,000 or more | 0 (0.0%) | 0 (0.0%) |
| Total | 12 (100.0%) | 7 (100.0%) |
Household Income by Mortgage Status in Barnet
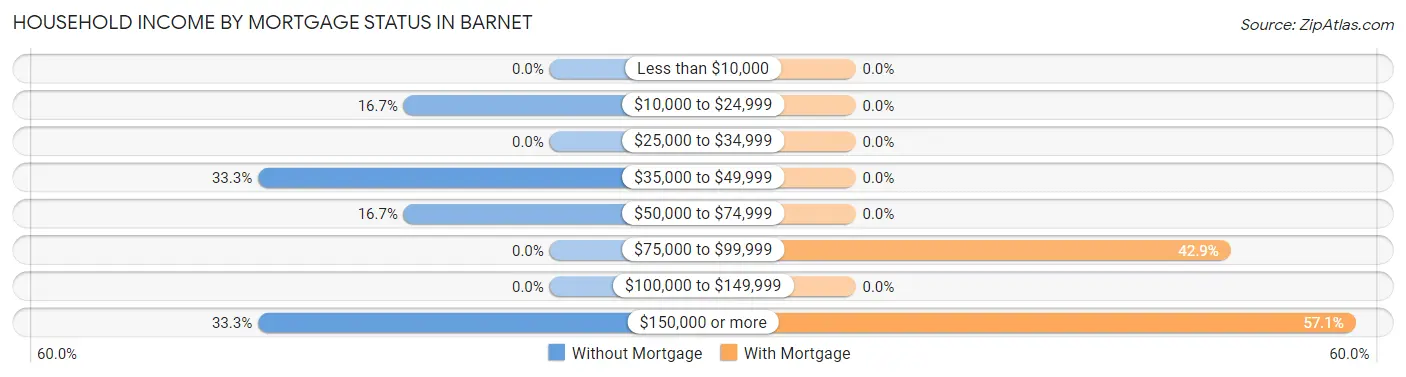
| Household Income | Without Mortgage | With Mortgage |
| Less than $10,000 | 0 (0.0%) | 0 (0.0%) |
| $10,000 to $24,999 | 2 (16.7%) | 0 (0.0%) |
| $25,000 to $34,999 | 0 (0.0%) | 0 (0.0%) |
| $35,000 to $49,999 | 4 (33.3%) | 0 (0.0%) |
| $50,000 to $74,999 | 2 (16.7%) | 0 (0.0%) |
| $75,000 to $99,999 | 0 (0.0%) | 3 (42.9%) |
| $100,000 to $149,999 | 0 (0.0%) | 0 (0.0%) |
| $150,000 or more | 4 (33.3%) | 4 (57.1%) |
| Total | 12 (100.0%) | 7 (100.0%) |
Property Value to Household Income Ratio in Barnet
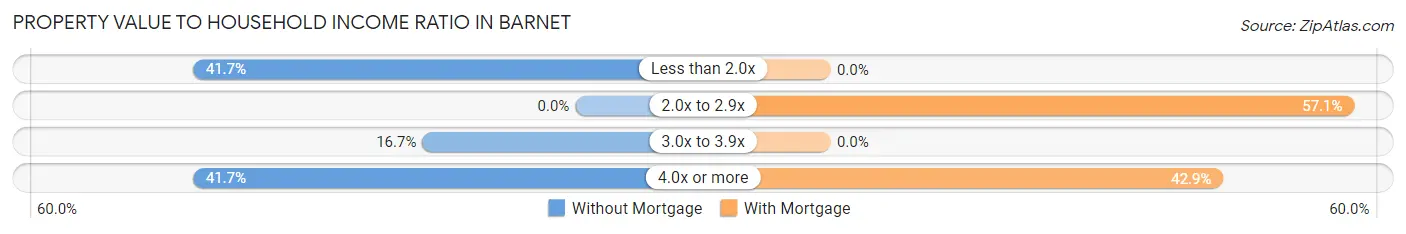
| Value-to-Income Ratio | Without Mortgage | With Mortgage |
| Less than 2.0x | 5 (41.7%) | 0 (0.0%) |
| 2.0x to 2.9x | 0 (0.0%) | 4 (57.1%) |
| 3.0x to 3.9x | 2 (16.7%) | 0 (0.0%) |
| 4.0x or more | 5 (41.7%) | 3 (42.9%) |
| Total | 12 (100.0%) | 7 (100.0%) |
Real Estate Taxes by Mortgage Status in Barnet
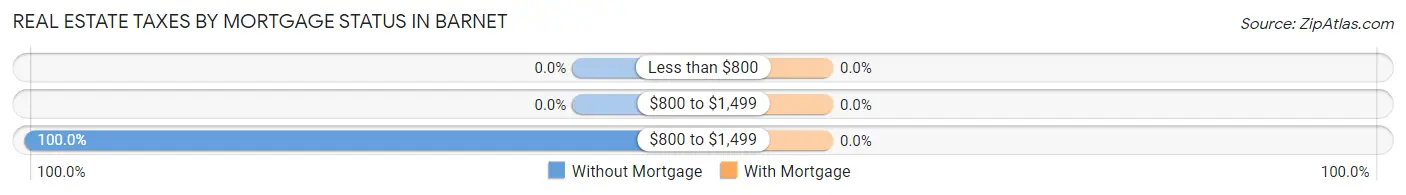
| Property Taxes | Without Mortgage | With Mortgage |
| Less than $800 | 0 (0.0%) | 0 (0.0%) |
| $800 to $1,499 | 0 (0.0%) | 0 (0.0%) |
| $800 to $1,499 | 12 (100.0%) | 0 (0.0%) |
| Total | 12 (100.0%) | 7 (100.0%) |
Health & Disability in Barnet
Health Insurance Coverage by Age in Barnet
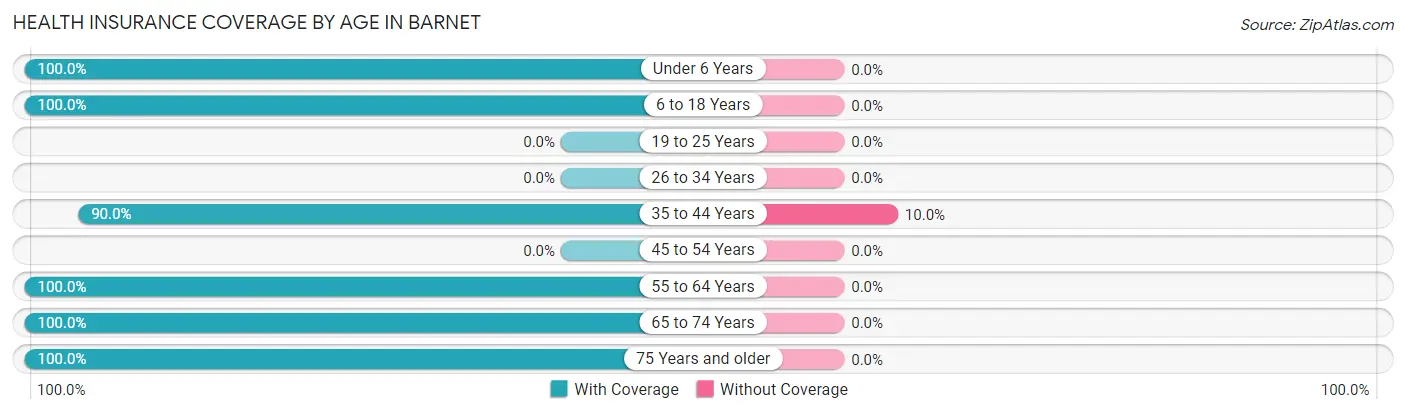
| Age Bracket | With Coverage | Without Coverage |
| Under 6 Years | 7 (100.0%) | 0 (0.0%) |
| 6 to 18 Years | 26 (100.0%) | 0 (0.0%) |
| 19 to 25 Years | 0 (0.0%) | 0 (0.0%) |
| 26 to 34 Years | 0 (0.0%) | 0 (0.0%) |
| 35 to 44 Years | 18 (90.0%) | 2 (10.0%) |
| 45 to 54 Years | 0 (0.0%) | 0 (0.0%) |
| 55 to 64 Years | 13 (100.0%) | 0 (0.0%) |
| 65 to 74 Years | 62 (100.0%) | 0 (0.0%) |
| 75 Years and older | 3 (100.0%) | 0 (0.0%) |
| Total | 129 (98.5%) | 2 (1.5%) |
Health Insurance Coverage by Citizenship Status in Barnet
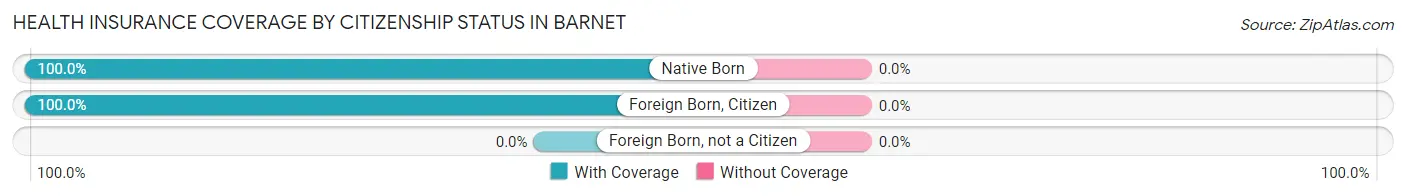
| Citizenship Status | With Coverage | Without Coverage |
| Native Born | 7 (100.0%) | 0 (0.0%) |
| Foreign Born, Citizen | 26 (100.0%) | 0 (0.0%) |
| Foreign Born, not a Citizen | 0 (0.0%) | 0 (0.0%) |
Health Insurance Coverage by Household Income in Barnet
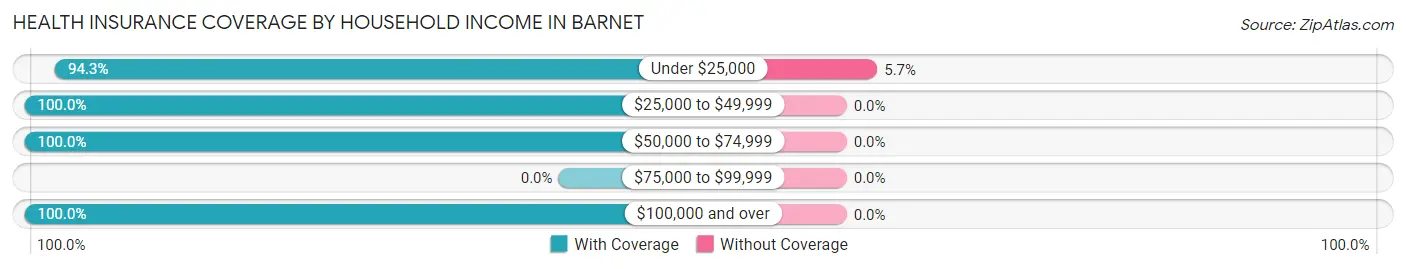
| Household Income | With Coverage | Without Coverage |
| Under $25,000 | 33 (94.3%) | 2 (5.7%) |
| $25,000 to $49,999 | 8 (100.0%) | 0 (0.0%) |
| $50,000 to $74,999 | 25 (100.0%) | 0 (0.0%) |
| $75,000 to $99,999 | 0 (0.0%) | 0 (0.0%) |
| $100,000 and over | 15 (100.0%) | 0 (0.0%) |
Public vs Private Health Insurance Coverage by Age in Barnet
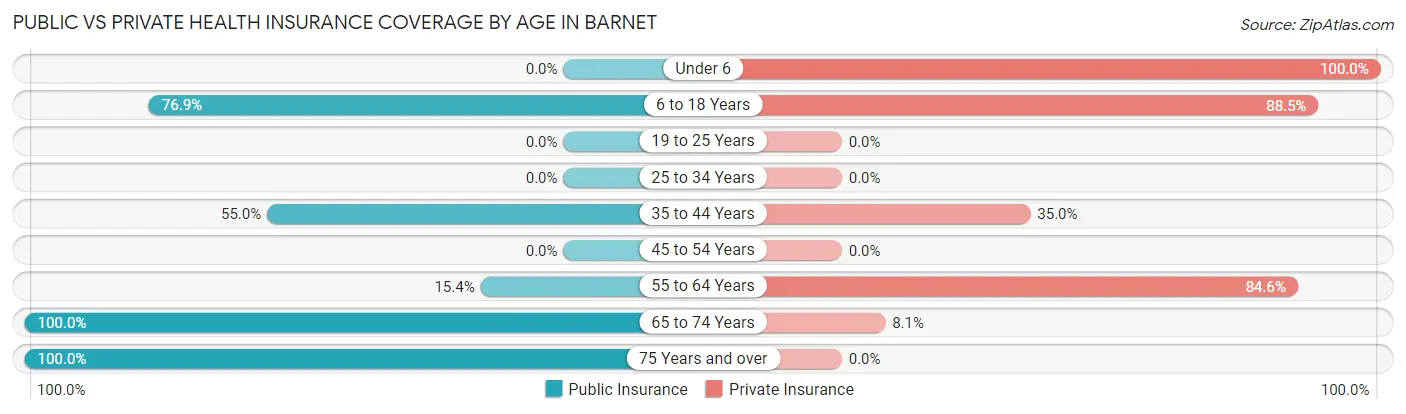
| Age Bracket | Public Insurance | Private Insurance |
| Under 6 | 0 (0.0%) | 7 (100.0%) |
| 6 to 18 Years | 20 (76.9%) | 23 (88.5%) |
| 19 to 25 Years | 0 (0.0%) | 0 (0.0%) |
| 25 to 34 Years | 0 (0.0%) | 0 (0.0%) |
| 35 to 44 Years | 11 (55.0%) | 7 (35.0%) |
| 45 to 54 Years | 0 (0.0%) | 0 (0.0%) |
| 55 to 64 Years | 2 (15.4%) | 11 (84.6%) |
| 65 to 74 Years | 62 (100.0%) | 5 (8.1%) |
| 75 Years and over | 3 (100.0%) | 0 (0.0%) |
| Total | 98 (74.8%) | 53 (40.5%) |
Disability Status by Sex by Age in Barnet
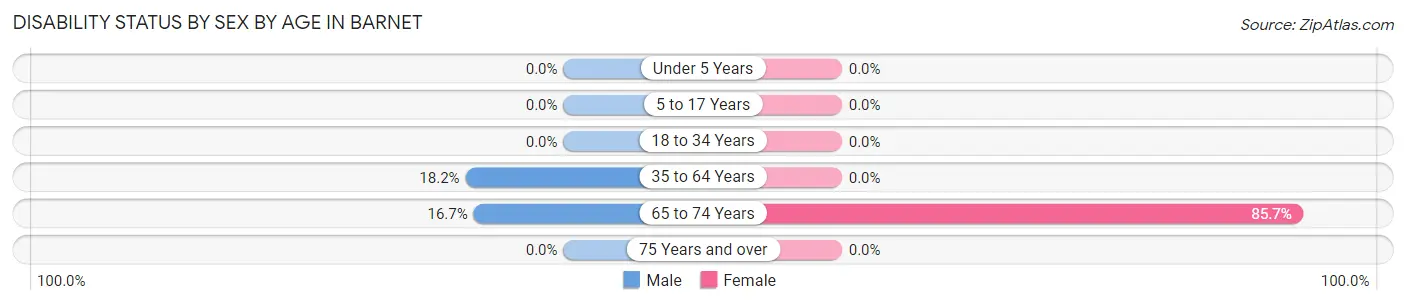
| Age Bracket | Male | Female |
| Under 5 Years | 0 (0.0%) | 0 (0.0%) |
| 5 to 17 Years | 0 (0.0%) | 0 (0.0%) |
| 18 to 34 Years | 0 (0.0%) | 0 (0.0%) |
| 35 to 64 Years | 2 (18.2%) | 0 (0.0%) |
| 65 to 74 Years | 1 (16.7%) | 48 (85.7%) |
| 75 Years and over | 0 (0.0%) | 0 (0.0%) |
Disability Class by Sex by Age in Barnet
Disability Class: Hearing Difficulty
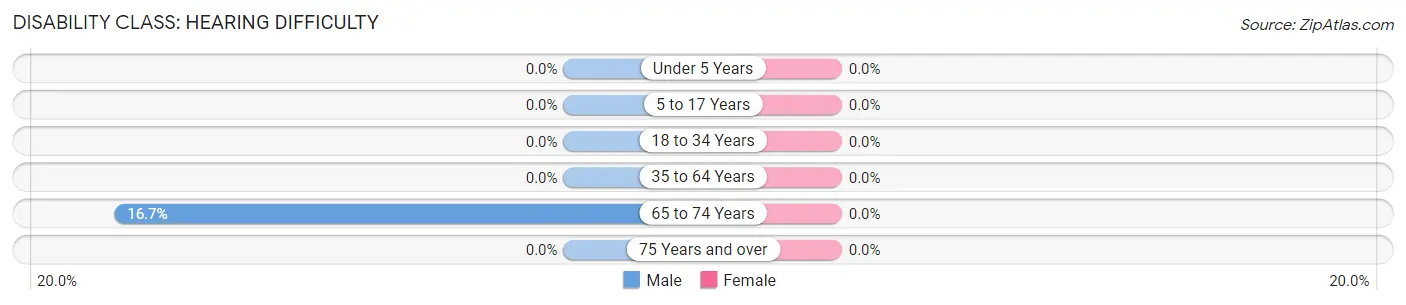
| Age Bracket | Male | Female |
| Under 5 Years | 0 (0.0%) | 0 (0.0%) |
| 5 to 17 Years | 0 (0.0%) | 0 (0.0%) |
| 18 to 34 Years | 0 (0.0%) | 0 (0.0%) |
| 35 to 64 Years | 0 (0.0%) | 0 (0.0%) |
| 65 to 74 Years | 1 (16.7%) | 0 (0.0%) |
| 75 Years and over | 0 (0.0%) | 0 (0.0%) |
Disability Class: Vision Difficulty
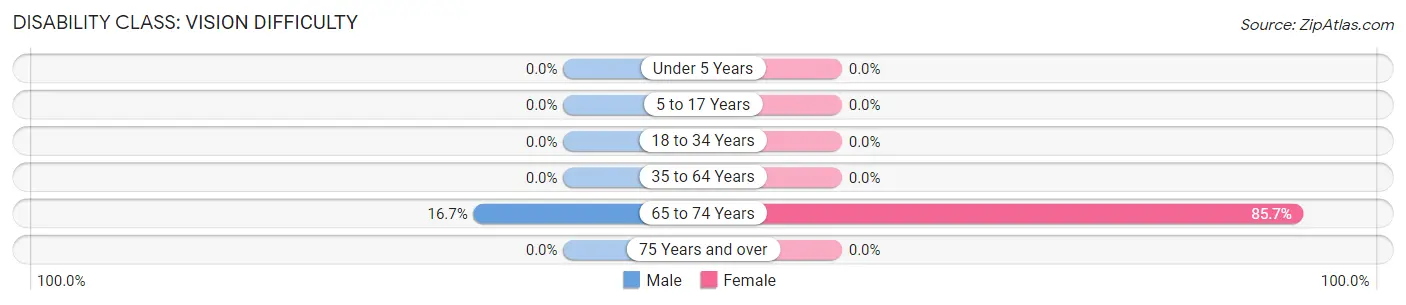
| Age Bracket | Male | Female |
| Under 5 Years | 0 (0.0%) | 0 (0.0%) |
| 5 to 17 Years | 0 (0.0%) | 0 (0.0%) |
| 18 to 34 Years | 0 (0.0%) | 0 (0.0%) |
| 35 to 64 Years | 0 (0.0%) | 0 (0.0%) |
| 65 to 74 Years | 1 (16.7%) | 48 (85.7%) |
| 75 Years and over | 0 (0.0%) | 0 (0.0%) |
Disability Class: Cognitive Difficulty
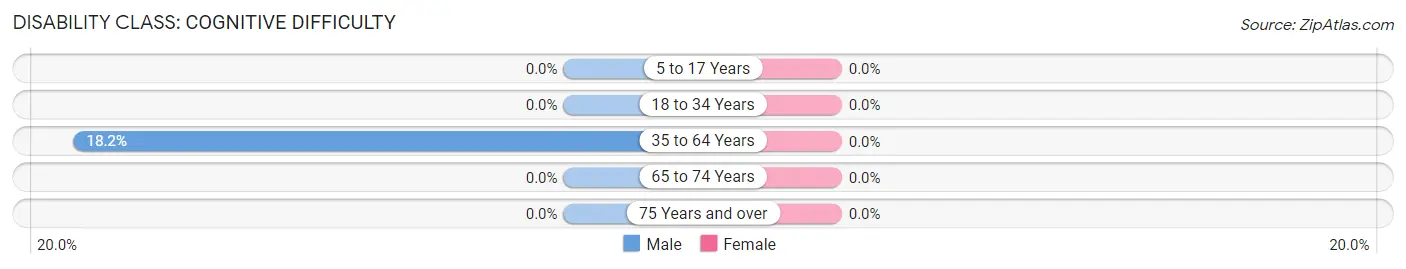
| Age Bracket | Male | Female |
| 5 to 17 Years | 0 (0.0%) | 0 (0.0%) |
| 18 to 34 Years | 0 (0.0%) | 0 (0.0%) |
| 35 to 64 Years | 2 (18.2%) | 0 (0.0%) |
| 65 to 74 Years | 0 (0.0%) | 0 (0.0%) |
| 75 Years and over | 0 (0.0%) | 0 (0.0%) |
Disability Class: Ambulatory Difficulty
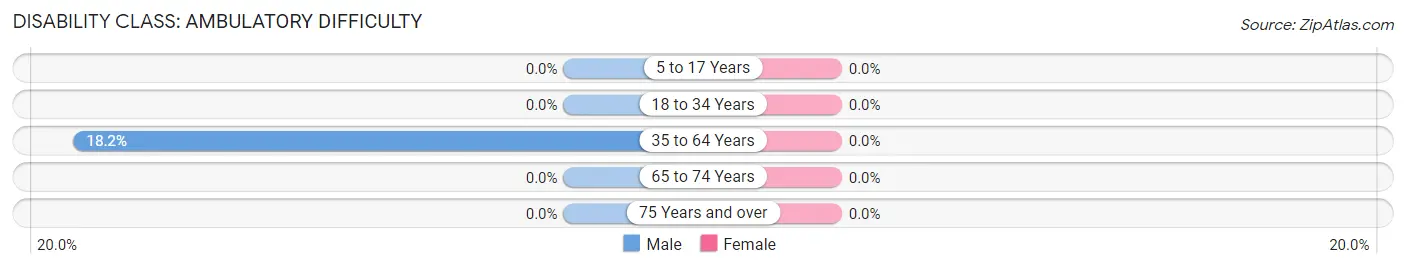
| Age Bracket | Male | Female |
| 5 to 17 Years | 0 (0.0%) | 0 (0.0%) |
| 18 to 34 Years | 0 (0.0%) | 0 (0.0%) |
| 35 to 64 Years | 2 (18.2%) | 0 (0.0%) |
| 65 to 74 Years | 0 (0.0%) | 0 (0.0%) |
| 75 Years and over | 0 (0.0%) | 0 (0.0%) |
Disability Class: Self-Care Difficulty
| Age Bracket | Male | Female |
| 5 to 17 Years | 0 (0.0%) | 0 (0.0%) |
| 18 to 34 Years | 0 (0.0%) | 0 (0.0%) |
| 35 to 64 Years | 0 (0.0%) | 0 (0.0%) |
| 65 to 74 Years | 0 (0.0%) | 0 (0.0%) |
| 75 Years and over | 0 (0.0%) | 0 (0.0%) |
Technology Access in Barnet
Computing Device Access in Barnet
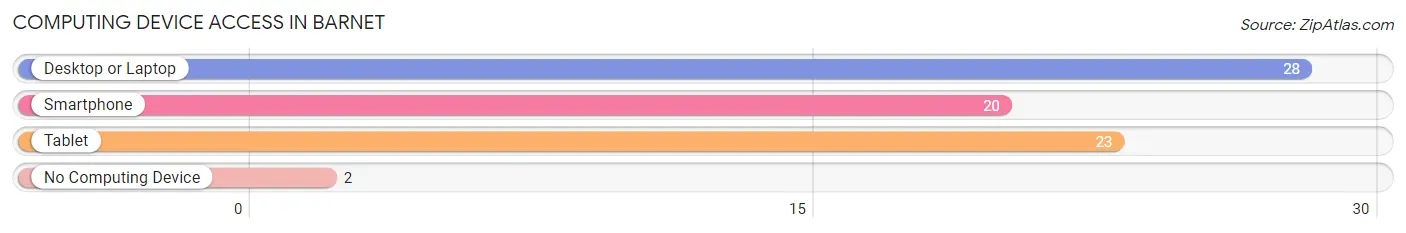
| Device Type | # Households | % Households |
| Desktop or Laptop | 28 | 93.3% |
| Smartphone | 20 | 66.7% |
| Tablet | 23 | 76.7% |
| No Computing Device | 2 | 6.7% |
| Total | 30 | 100.0% |
Internet Access in Barnet
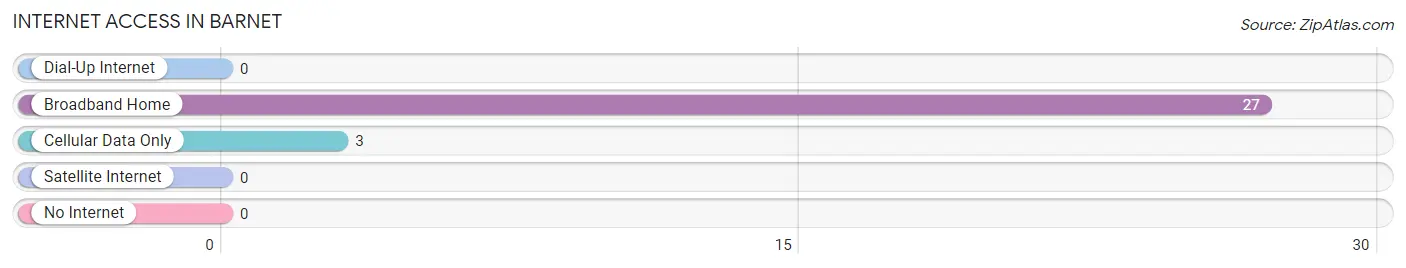
| Internet Type | # Households | % Households |
| Dial-Up Internet | 0 | 0.0% |
| Broadband Home | 27 | 90.0% |
| Cellular Data Only | 3 | 10.0% |
| Satellite Internet | 0 | 0.0% |
| No Internet | 0 | 0.0% |
| Total | 30 | 100.0% |
Barnet Summary
Barnet, Vermont is a small town located in the northeastern corner of the state, in Caledonia County. It is situated on the Connecticut River, and is bordered by the towns of Peacham, Ryegate, and Waterford. The town has a population of 1,619 people, according to the 2010 census.
History
The town of Barnet was first settled in 1763 by a group of settlers from Connecticut. The town was named after the town of Barnet in Hertfordshire, England. The town was incorporated in 1781, and the first town meeting was held in 1782.
The town was originally an agricultural community, with the main crops being wheat, corn, and potatoes. In the late 19th century, the town began to develop a small manufacturing industry, with the first sawmill being built in 1820. The town also had a gristmill, a tannery, and a woolen mill.
Geography
Barnet is located in the northeastern corner of Vermont, in Caledonia County. It is situated on the Connecticut River, and is bordered by the towns of Peacham, Ryegate, and Waterford. The town has a total area of 33.2 square miles, of which 32.9 square miles is land and 0.3 square miles is water.
The town is located in the Green Mountains, and is home to several mountains, including Mount Hor, Mount Hunger, and Mount Pisgah. The highest point in the town is the summit of Mount Hunger, which has an elevation of 2,890 feet.
Economy
The economy of Barnet is largely based on agriculture and tourism. The town is home to several farms, which produce a variety of crops, including corn, potatoes, hay, and apples. The town also has several small businesses, including a sawmill, a gristmill, and a tannery.
Tourism is also an important part of the town's economy. The town is home to several attractions, including the Barnet Historical Society Museum, the Barnet Town Hall, and the Barnet Town Common. The town also has several parks, including the Barnet Town Park, the Barnet Town Forest, and the Barnet Town Beach.
Demographics
According to the 2010 census, the town of Barnet has a population of 1,619 people. The racial makeup of the town is 97.3% White, 0.2% African American, 0.2% Native American, 0.4% Asian, 0.1% Pacific Islander, 0.4% from other races, and 1.4% from two or more races. The median household income in the town is $45,938, and the median family income is $51,250. The per capita income in the town is $21,945.
Common Questions
What is Per Capita Income in Barnet?
Per Capita income in Barnet is $16,269.
What is the Median Family Income in Barnet?
Median Family Income in Barnet is $36,667.
What is the Median Household income in Barnet?
Median Household Income in Barnet is $36,667.
What is Inequality or Gini Index in Barnet?
Inequality or Gini Index in Barnet is 0.43.
What is the Total Population of Barnet?
Total Population of Barnet is 131.
What is the Total Male Population of Barnet?
Total Male Population of Barnet is 31.
What is the Total Female Population of Barnet?
Total Female Population of Barnet is 100.
What is the Ratio of Males per 100 Females in Barnet?
There are 31.00 Males per 100 Females in Barnet.
What is the Ratio of Females per 100 Males in Barnet?
There are 322.58 Females per 100 Males in Barnet.
What is the Median Population Age in Barnet?
Median Population Age in Barnet is 64.9 Years.
What is the Average Family Size in Barnet
Average Family Size in Barnet is 2.8 People.
What is the Average Household Size in Barnet
Average Household Size in Barnet is 2.8 People.
How Large is the Labor Force in Barnet?
There are 31 People in the Labor Forcein in Barnet.
What is the Percentage of People in the Labor Force in Barnet?
30.7% of People are in the Labor Force in Barnet.