Derby Line, VT Map & Demographics
Derby Line Map
Derby Line Overview
$31,492
PER CAPITA INCOME
$82,639
AVG FAMILY INCOME
$64,018
AVG HOUSEHOLD INCOME
23.2%
WAGE / INCOME GAP [ % ]
76.8¢/ $1
WAGE / INCOME GAP [ $ ]
0.38
INEQUALITY / GINI INDEX
692
TOTAL POPULATION
298
MALE POPULATION
394
FEMALE POPULATION
75.63
MALES / 100 FEMALES
132.21
FEMALES / 100 MALES
38.3
MEDIAN AGE
2.9
AVG FAMILY SIZE
2.2
AVG HOUSEHOLD SIZE
300
LABOR FORCE [ PEOPLE ]
57.5%
PERCENT IN LABOR FORCE
3.0%
UNEMPLOYMENT RATE
Derby Line Zip Codes
Derby Line Area Codes
Income in Derby Line
Income Overview in Derby Line
Per Capita Income in Derby Line is $31,492, while median incomes of families and households are $82,639 and $64,018 respectively.
| Characteristic | Number | Measure |
| Per Capita Income | 692 | $31,492 |
| Median Family Income | 186 | $82,639 |
| Mean Family Income | 186 | $92,703 |
| Median Household Income | 315 | $64,018 |
| Mean Household Income | 315 | $69,550 |
| Income Deficit | 186 | $0 |
| Wage / Income Gap (%) | 692 | 23.22% |
| Wage / Income Gap ($) | 692 | 76.78¢ per $1 |
| Gini / Inequality Index | 692 | 0.38 |
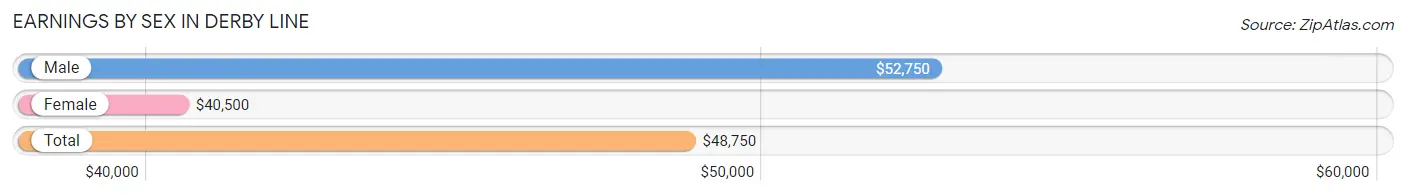
Earnings by Sex in Derby Line
Average Earnings in Derby Line are $48,750, $52,750 for men and $40,500 for women, a difference of 23.2%.
| Sex | Number | Average Earnings |
| Male | 156 (51.3%) | $52,750 |
| Female | 148 (48.7%) | $40,500 |
| Total | 304 (100.0%) | $48,750 |
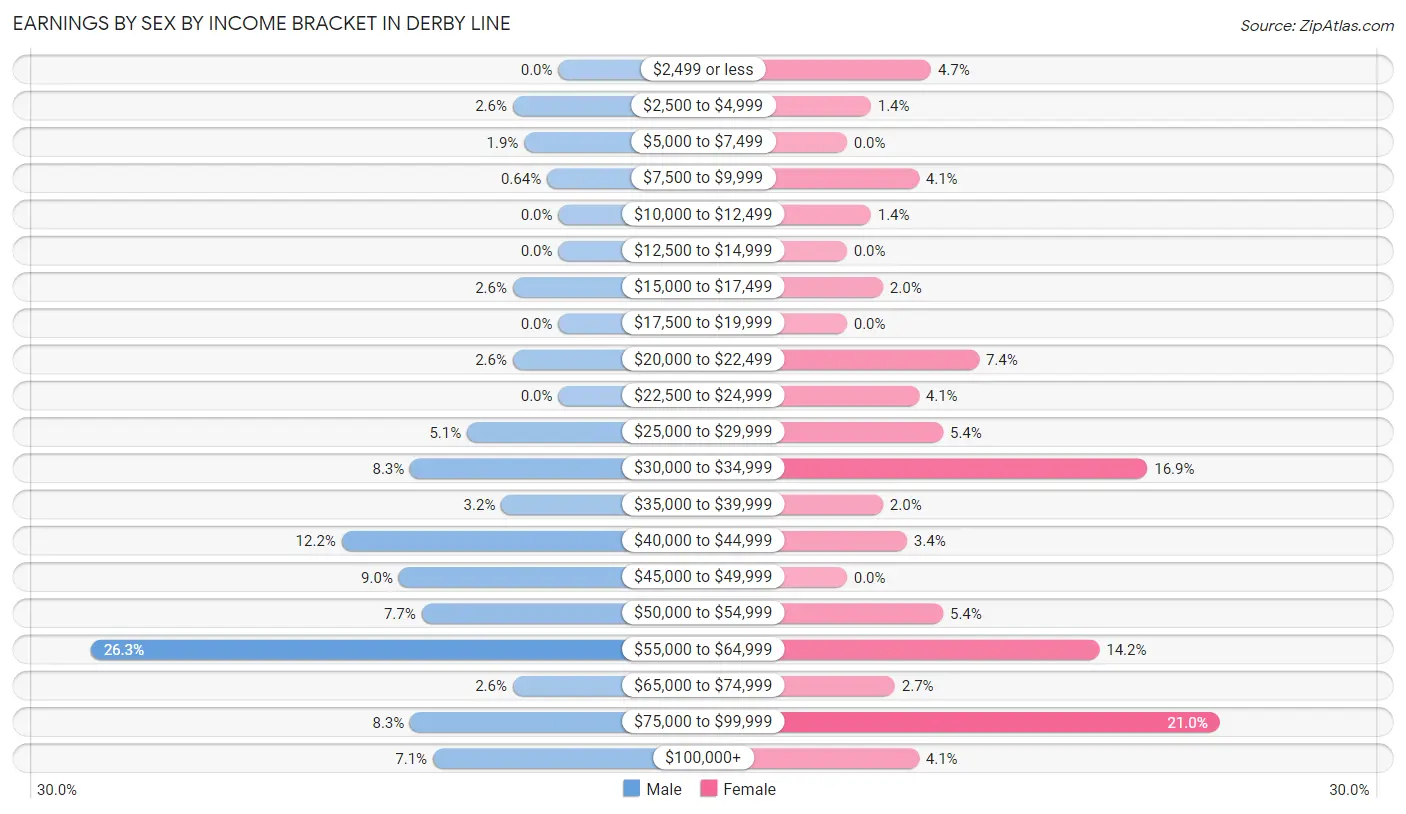
Earnings by Sex by Income Bracket in Derby Line
The most common earnings brackets in Derby Line are $55,000 to $64,999 for men (41 | 26.3%) and $75,000 to $99,999 for women (31 | 20.9%).
| Income | Male | Female |
| $2,499 or less | 0 (0.0%) | 7 (4.7%) |
| $2,500 to $4,999 | 4 (2.6%) | 2 (1.3%) |
| $5,000 to $7,499 | 3 (1.9%) | 0 (0.0%) |
| $7,500 to $9,999 | 1 (0.6%) | 6 (4.1%) |
| $10,000 to $12,499 | 0 (0.0%) | 2 (1.3%) |
| $12,500 to $14,999 | 0 (0.0%) | 0 (0.0%) |
| $15,000 to $17,499 | 4 (2.6%) | 3 (2.0%) |
| $17,500 to $19,999 | 0 (0.0%) | 0 (0.0%) |
| $20,000 to $22,499 | 4 (2.6%) | 11 (7.4%) |
| $22,500 to $24,999 | 0 (0.0%) | 6 (4.1%) |
| $25,000 to $29,999 | 8 (5.1%) | 8 (5.4%) |
| $30,000 to $34,999 | 13 (8.3%) | 25 (16.9%) |
| $35,000 to $39,999 | 5 (3.2%) | 3 (2.0%) |
| $40,000 to $44,999 | 19 (12.2%) | 5 (3.4%) |
| $45,000 to $49,999 | 14 (9.0%) | 0 (0.0%) |
| $50,000 to $54,999 | 12 (7.7%) | 8 (5.4%) |
| $55,000 to $64,999 | 41 (26.3%) | 21 (14.2%) |
| $65,000 to $74,999 | 4 (2.6%) | 4 (2.7%) |
| $75,000 to $99,999 | 13 (8.3%) | 31 (20.9%) |
| $100,000+ | 11 (7.0%) | 6 (4.1%) |
| Total | 156 (100.0%) | 148 (100.0%) |
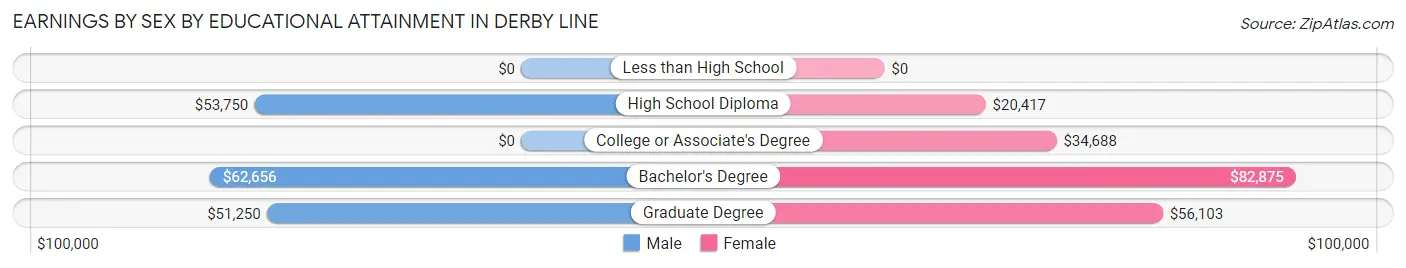
Earnings by Sex by Educational Attainment in Derby Line
Average earnings in Derby Line are $53,875 for men and $51,094 for women, a difference of 5.2%. Men with an educational attainment of bachelor's degree enjoy the highest average annual earnings of $62,656, while those with graduate degree education earn the least with $51,250. Women with an educational attainment of bachelor's degree earn the most with the average annual earnings of $82,875, while those with high school diploma education have the smallest earnings of $20,417.
| Educational Attainment | Male Income | Female Income |
| Less than High School | - | - |
| High School Diploma | $53,750 | $20,417 |
| College or Associate's Degree | - | - |
| Bachelor's Degree | $62,656 | $82,875 |
| Graduate Degree | $51,250 | $56,103 |
| Total | $53,875 | $51,094 |
Family Income in Derby Line
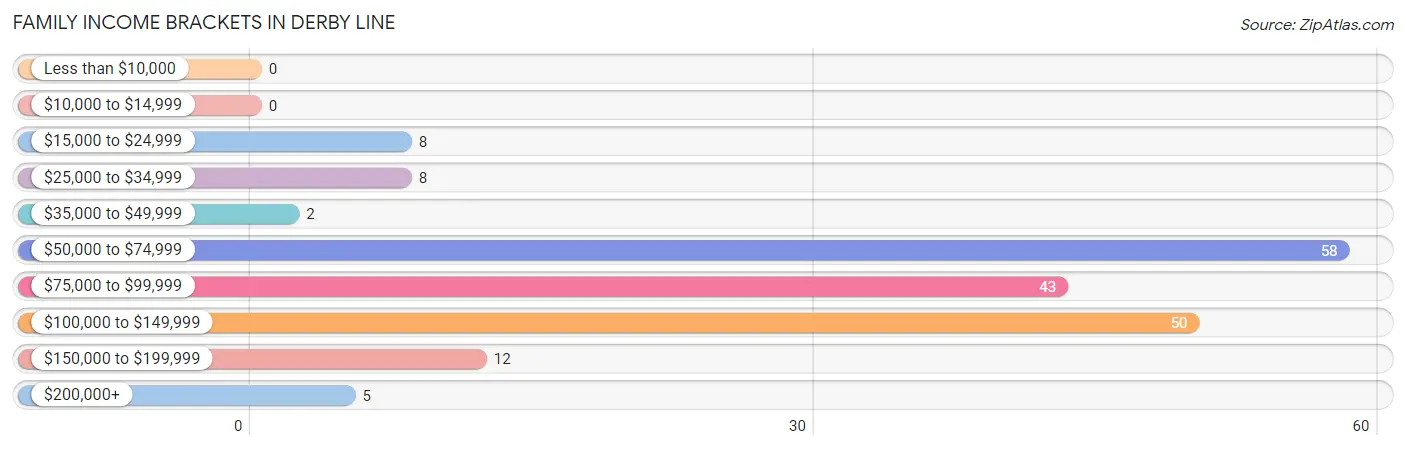
Family Income Brackets in Derby Line
According to the Derby Line family income data, there are 58 families falling into the $50,000 to $74,999 income range, which is the most common income bracket and makes up 31.2% of all families.
| Income Bracket | # Families | % Families |
| Less than $10,000 | 0 | 0.0% |
| $10,000 to $14,999 | 0 | 0.0% |
| $15,000 to $24,999 | 8 | 4.3% |
| $25,000 to $34,999 | 8 | 4.3% |
| $35,000 to $49,999 | 2 | 1.1% |
| $50,000 to $74,999 | 58 | 31.2% |
| $75,000 to $99,999 | 43 | 23.1% |
| $100,000 to $149,999 | 50 | 26.9% |
| $150,000 to $199,999 | 12 | 6.5% |
| $200,000+ | 5 | 2.7% |
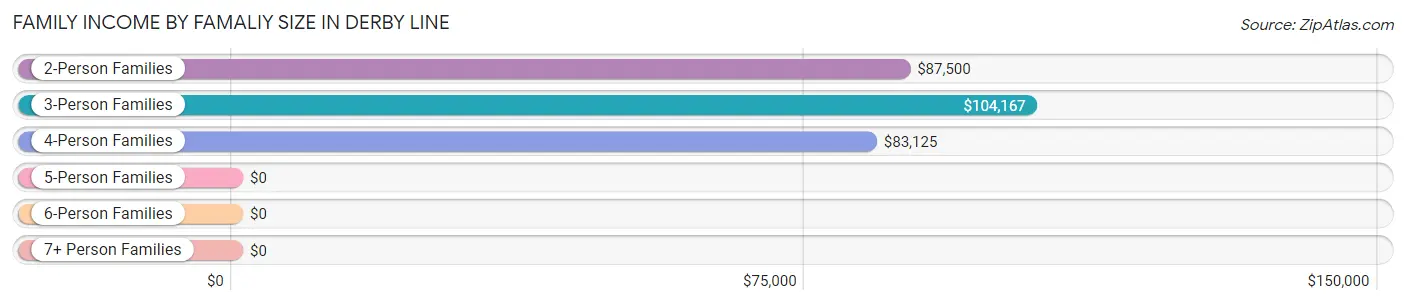
Family Income by Famaliy Size in Derby Line
3-person families (46 | 24.7%) account for the highest median family income in Derby Line with $104,167 per family, while 2-person families (98 | 52.7%) have the highest median income of $43,750 per family member.
| Income Bracket | # Families | Median Income |
| 2-Person Families | 98 (52.7%) | $87,500 |
| 3-Person Families | 46 (24.7%) | $104,167 |
| 4-Person Families | 24 (12.9%) | $83,125 |
| 5-Person Families | 6 (3.2%) | $0 |
| 6-Person Families | 12 (6.5%) | $0 |
| 7+ Person Families | 0 (0.0%) | $0 |
| Total | 186 (100.0%) | $82,639 |
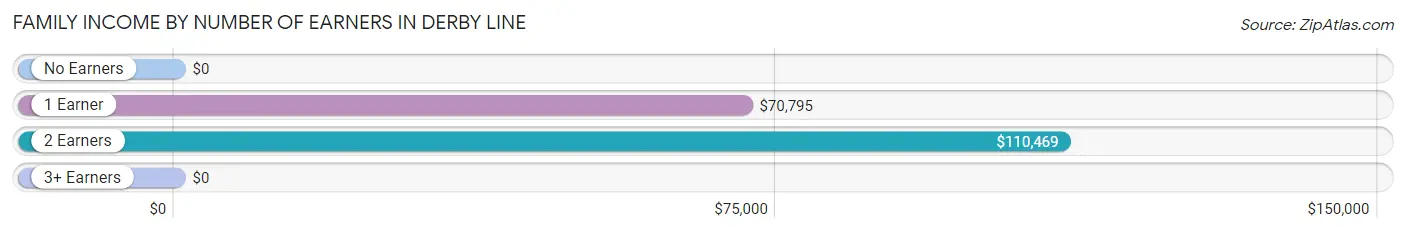
Family Income by Number of Earners in Derby Line
| Number of Earners | # Families | Median Income |
| No Earners | 18 (9.7%) | $0 |
| 1 Earner | 77 (41.4%) | $70,795 |
| 2 Earners | 87 (46.8%) | $110,469 |
| 3+ Earners | 4 (2.1%) | $0 |
| Total | 186 (100.0%) | $82,639 |
Household Income in Derby Line
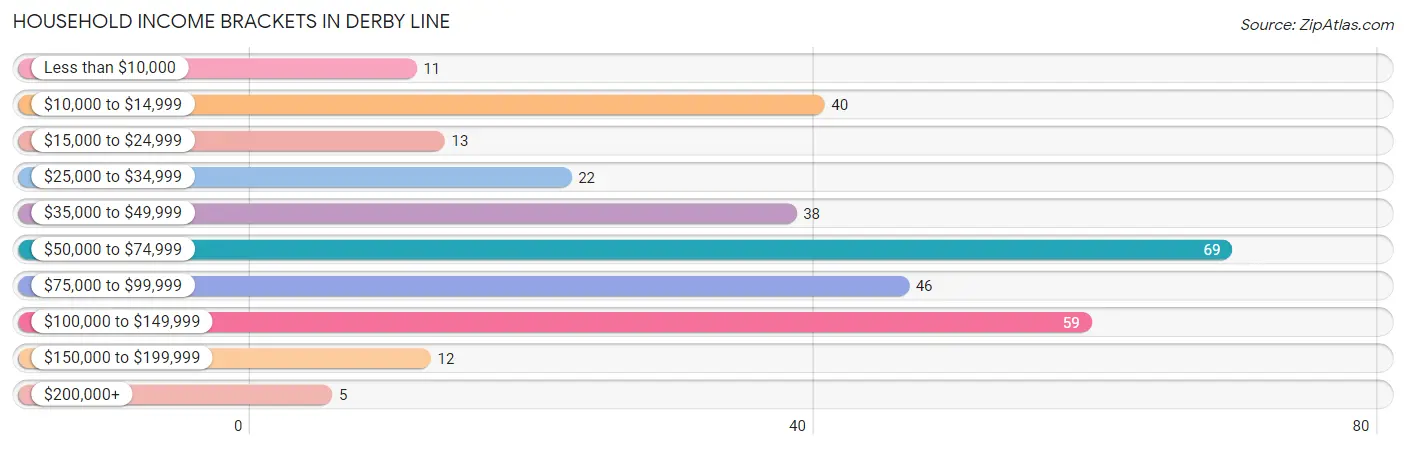
Household Income Brackets in Derby Line
With 69 households falling in the category, the $50,000 to $74,999 income range is the most frequent in Derby Line, accounting for 21.9% of all households. In contrast, only 5 households (1.6%) fall into the $200,000+ income bracket, making it the least populous group.
| Income Bracket | # Households | % Households |
| Less than $10,000 | 11 | 3.5% |
| $10,000 to $14,999 | 40 | 12.7% |
| $15,000 to $24,999 | 13 | 4.1% |
| $25,000 to $34,999 | 22 | 7.0% |
| $35,000 to $49,999 | 38 | 12.1% |
| $50,000 to $74,999 | 69 | 21.9% |
| $75,000 to $99,999 | 46 | 14.6% |
| $100,000 to $149,999 | 59 | 18.7% |
| $150,000 to $199,999 | 12 | 3.8% |
| $200,000+ | 5 | 1.6% |
Household Income by Householder Age in Derby Line
The median household income in Derby Line is $64,018, with the highest median household income of $90,250 found in the 45 to 64 years age bracket for the primary householder. A total of 59 households (18.7%) fall into this category. Meanwhile, the 15 to 24 years age bracket for the primary householder has the lowest median household income of $0, with 9 households (2.9%) in this group.
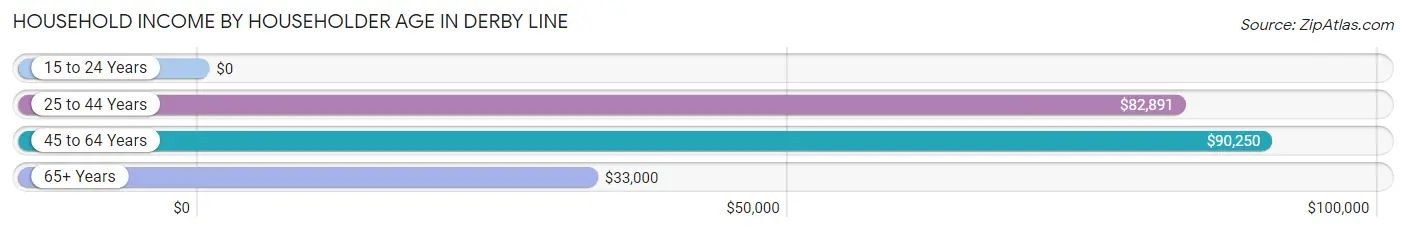
| Income Bracket | # Households | Median Income |
| 15 to 24 Years | 9 (2.9%) | $0 |
| 25 to 44 Years | 99 (31.4%) | $82,891 |
| 45 to 64 Years | 59 (18.7%) | $90,250 |
| 65+ Years | 148 (47.0%) | $33,000 |
| Total | 315 (100.0%) | $64,018 |
Poverty in Derby Line
Income Below Poverty by Sex and Age in Derby Line
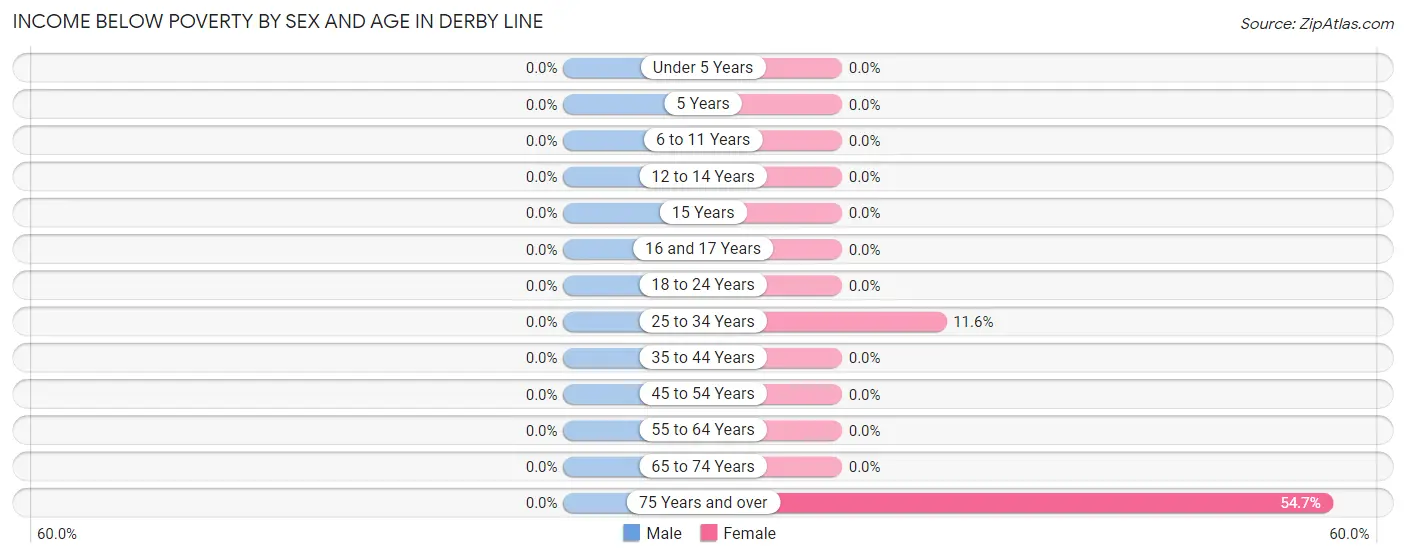
| Age Bracket | Male | Female |
| Under 5 Years | 0 (0.0%) | 0 (0.0%) |
| 5 Years | 0 (0.0%) | 0 (0.0%) |
| 6 to 11 Years | 0 (0.0%) | 0 (0.0%) |
| 12 to 14 Years | 0 (0.0%) | 0 (0.0%) |
| 15 Years | 0 (0.0%) | 0 (0.0%) |
| 16 and 17 Years | 0 (0.0%) | 0 (0.0%) |
| 18 to 24 Years | 0 (0.0%) | 0 (0.0%) |
| 25 to 34 Years | 0 (0.0%) | 5 (11.6%) |
| 35 to 44 Years | 0 (0.0%) | 0 (0.0%) |
| 45 to 54 Years | 0 (0.0%) | 0 (0.0%) |
| 55 to 64 Years | 0 (0.0%) | 0 (0.0%) |
| 65 to 74 Years | 0 (0.0%) | 0 (0.0%) |
| 75 Years and over | 0 (0.0%) | 47 (54.6%) |
| Total | 0 (0.0%) | 52 (13.3%) |
Income Above Poverty by Sex and Age in Derby Line
According to the poverty statistics in Derby Line, males aged under 5 years and females aged under 5 years are the age groups that are most secure financially, with 100.0% of males and 100.0% of females in these age groups living above the poverty line.
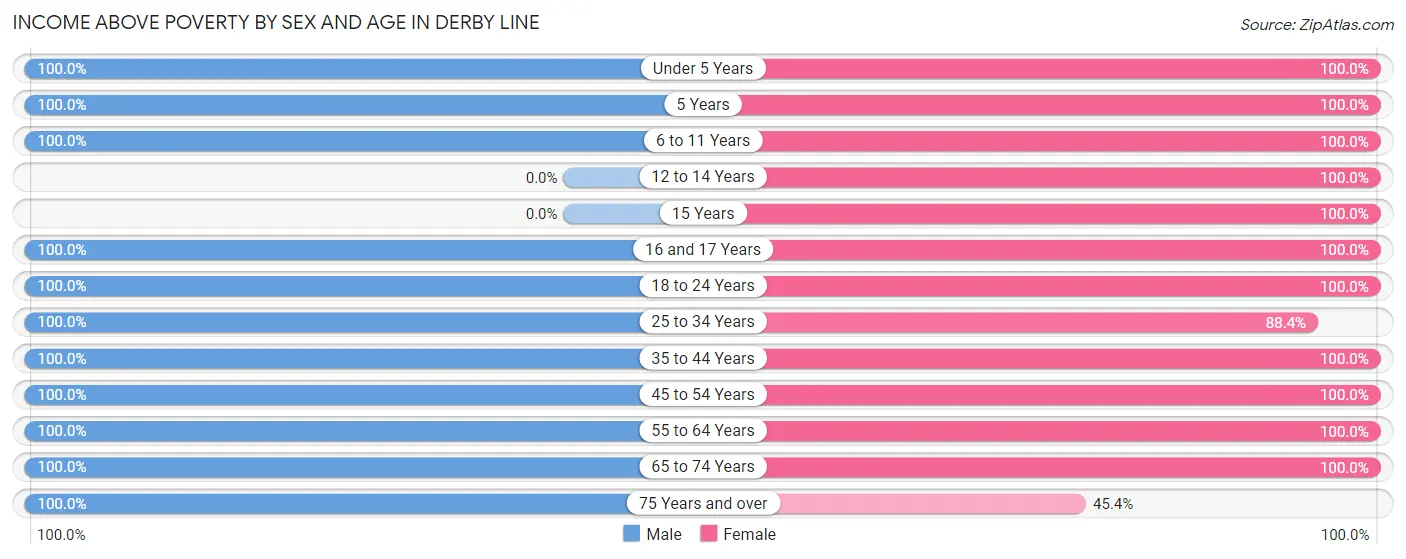
| Age Bracket | Male | Female |
| Under 5 Years | 19 (100.0%) | 41 (100.0%) |
| 5 Years | 9 (100.0%) | 8 (100.0%) |
| 6 to 11 Years | 42 (100.0%) | 25 (100.0%) |
| 12 to 14 Years | 0 (0.0%) | 12 (100.0%) |
| 15 Years | 0 (0.0%) | 10 (100.0%) |
| 16 and 17 Years | 8 (100.0%) | 17 (100.0%) |
| 18 to 24 Years | 10 (100.0%) | 15 (100.0%) |
| 25 to 34 Years | 50 (100.0%) | 38 (88.4%) |
| 35 to 44 Years | 24 (100.0%) | 52 (100.0%) |
| 45 to 54 Years | 24 (100.0%) | 23 (100.0%) |
| 55 to 64 Years | 35 (100.0%) | 19 (100.0%) |
| 65 to 74 Years | 45 (100.0%) | 39 (100.0%) |
| 75 Years and over | 32 (100.0%) | 39 (45.4%) |
| Total | 298 (100.0%) | 338 (86.7%) |
Income Below Poverty Among Married-Couple Families in Derby Line
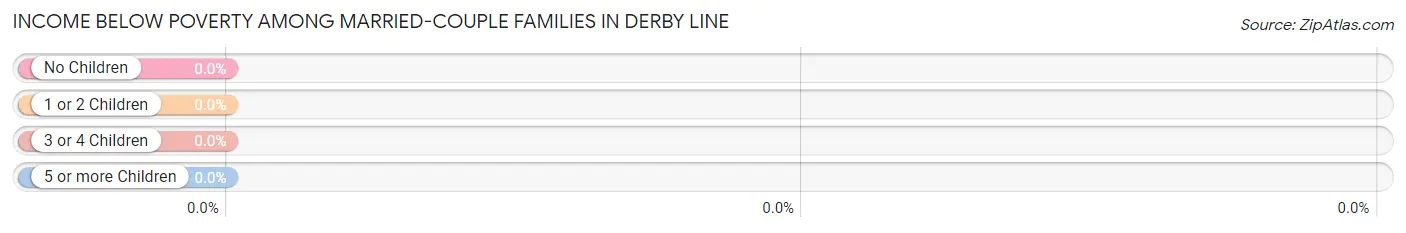
| Children | Above Poverty | Below Poverty |
| No Children | 91 (100.0%) | 0 (0.0%) |
| 1 or 2 Children | 49 (100.0%) | 0 (0.0%) |
| 3 or 4 Children | 18 (100.0%) | 0 (0.0%) |
| 5 or more Children | 0 (0.0%) | 0 (0.0%) |
| Total | 158 (100.0%) | 0 (0.0%) |
Income Below Poverty Among Single-Parent Households in Derby Line
| Children | Single Father | Single Mother |
| No Children | 0 (0.0%) | 0 (0.0%) |
| 1 or 2 Children | 0 (0.0%) | 0 (0.0%) |
| 3 or 4 Children | 0 (0.0%) | 0 (0.0%) |
| 5 or more Children | 0 (0.0%) | 0 (0.0%) |
| Total | 0 (0.0%) | 0 (0.0%) |
Income Below Poverty Among Married-Couple vs Single-Parent Households in Derby Line
| Children | Married-Couple Families | Single-Parent Households |
| No Children | 0 (0.0%) | 0 (0.0%) |
| 1 or 2 Children | 0 (0.0%) | 0 (0.0%) |
| 3 or 4 Children | 0 (0.0%) | 0 (0.0%) |
| 5 or more Children | 0 (0.0%) | 0 (0.0%) |
| Total | 0 (0.0%) | 0 (0.0%) |
Race in Derby Line
The most populous races in Derby Line are White / Caucasian (677 | 97.8%), Two or more Races (15 | 2.2%), and Hispanic or Latino (7 | 1.0%).
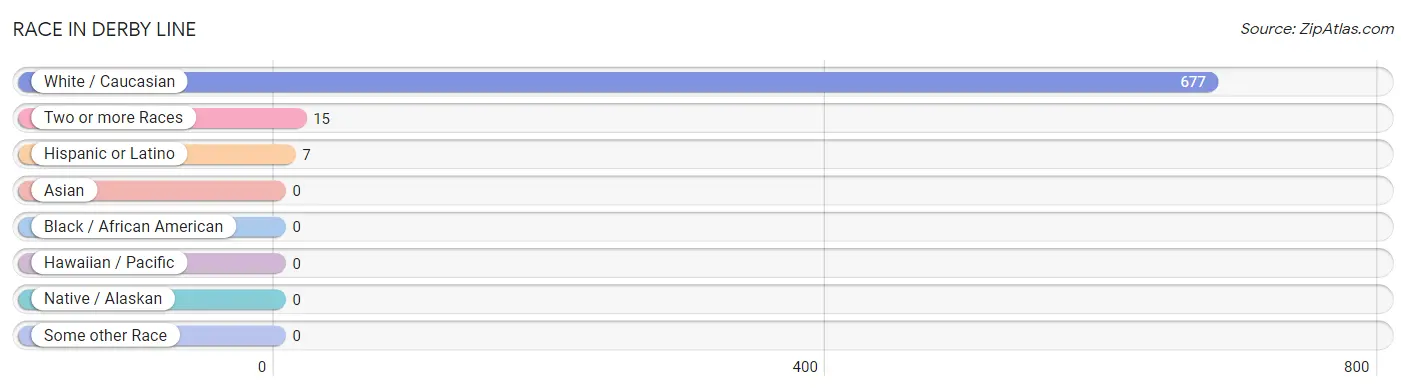
| Race | # Population | % Population |
| Asian | 0 | 0.0% |
| Black / African American | 0 | 0.0% |
| Hawaiian / Pacific | 0 | 0.0% |
| Hispanic or Latino | 7 | 1.0% |
| Native / Alaskan | 0 | 0.0% |
| White / Caucasian | 677 | 97.8% |
| Two or more Races | 15 | 2.2% |
| Some other Race | 0 | 0.0% |
| Total | 692 | 100.0% |
Ancestry in Derby Line
The most populous ancestries reported in Derby Line are German (163 | 23.5%), French Canadian (127 | 18.3%), English (98 | 14.2%), French (88 | 12.7%), and Irish (74 | 10.7%), together accounting for 79.5% of all Derby Line residents.
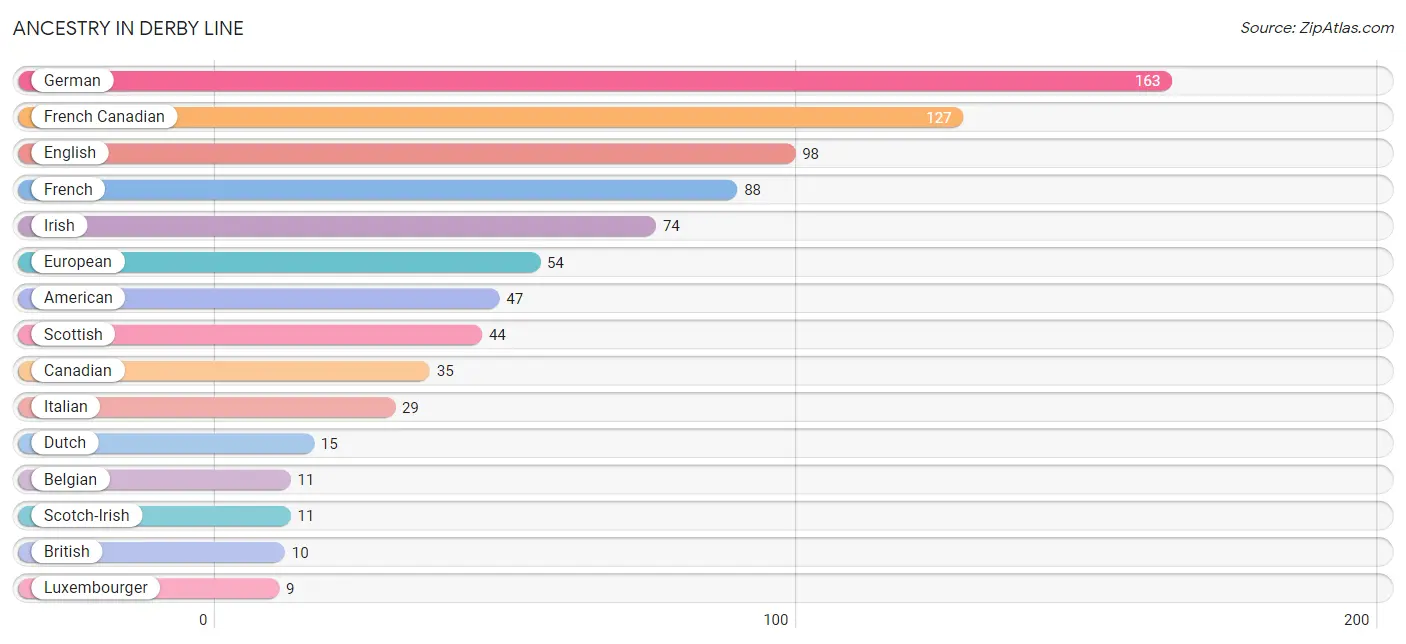
| Ancestry | # Population | % Population |
| American | 47 | 6.8% |
| Belgian | 11 | 1.6% |
| British | 10 | 1.5% |
| Canadian | 35 | 5.1% |
| Dutch | 15 | 2.2% |
| English | 98 | 14.2% |
| European | 54 | 7.8% |
| French | 88 | 12.7% |
| French American Indian | 1 | 0.1% |
| French Canadian | 127 | 18.3% |
| German | 163 | 23.5% |
| Irish | 74 | 10.7% |
| Italian | 29 | 4.2% |
| Korean | 5 | 0.7% |
| Luxembourger | 9 | 1.3% |
| Norwegian | 6 | 0.9% |
| Polish | 7 | 1.0% |
| Puerto Rican | 7 | 1.0% |
| Scotch-Irish | 11 | 1.6% |
| Scottish | 44 | 6.4% |
| Swedish | 1 | 0.1% |
| Swiss | 9 | 1.3% |
| Welsh | 4 | 0.6% | View All 23 Rows |
Immigrants in Derby Line
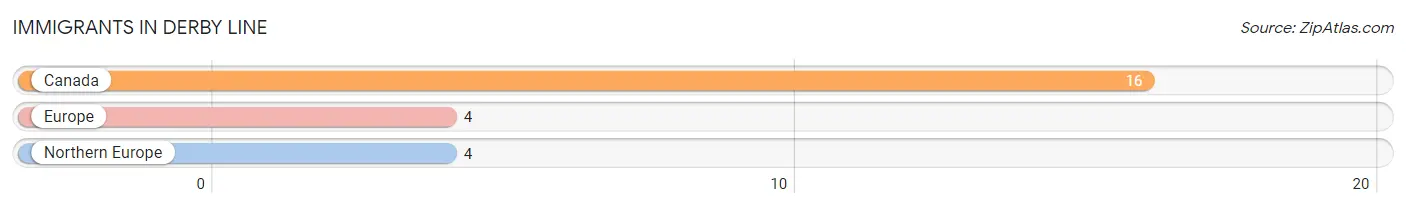
The most numerous immigrant groups reported in Derby Line came from Canada (16 | 2.3%), Europe (4 | 0.6%), and Northern Europe (4 | 0.6%), together accounting for 3.5% of all Derby Line residents.
| Immigration Origin | # Population | % Population |
| Canada | 16 | 2.3% |
| Europe | 4 | 0.6% |
| Northern Europe | 4 | 0.6% | View All 3 Rows |
Sex and Age in Derby Line
Sex and Age in Derby Line
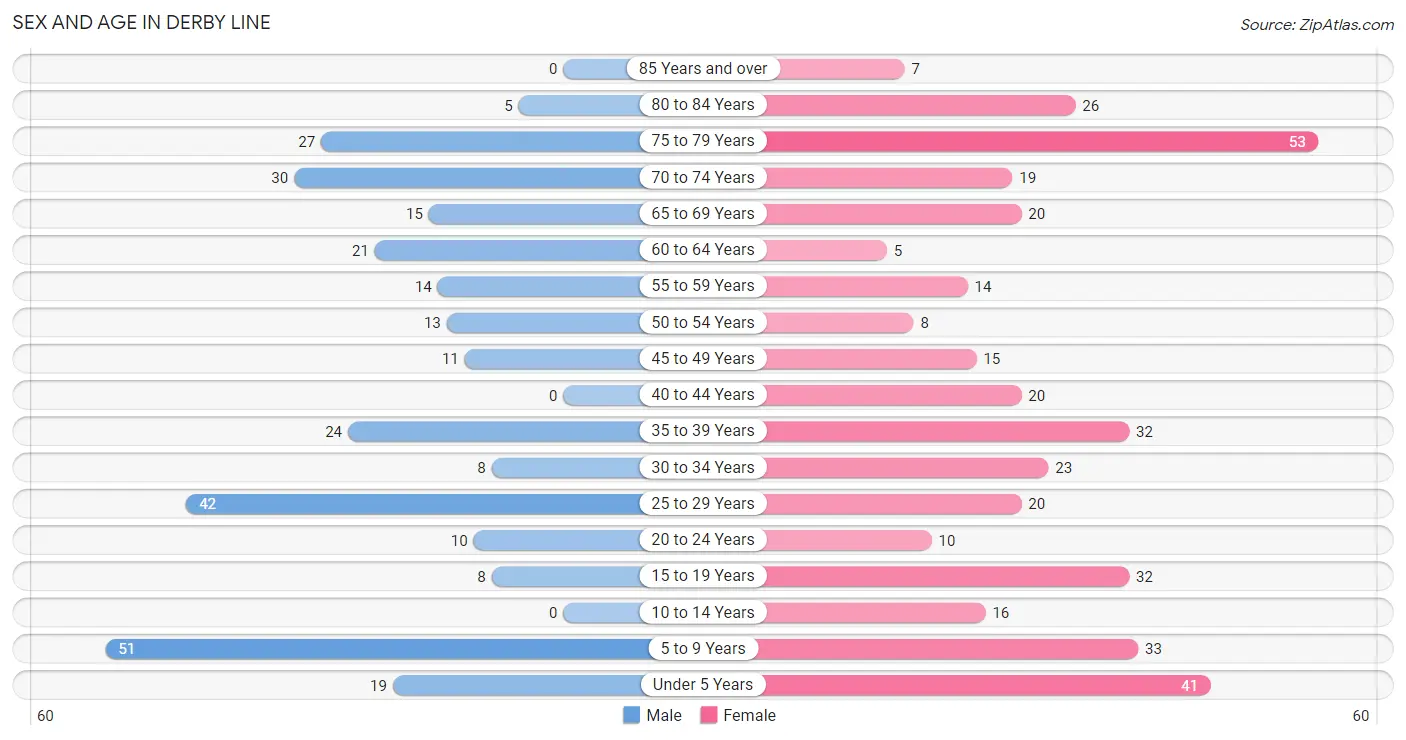
The most populous age groups in Derby Line are 5 to 9 Years (51 | 17.1%) for men and 75 to 79 Years (53 | 13.5%) for women.
| Age Bracket | Male | Female |
| Under 5 Years | 19 (6.4%) | 41 (10.4%) |
| 5 to 9 Years | 51 (17.1%) | 33 (8.4%) |
| 10 to 14 Years | 0 (0.0%) | 16 (4.1%) |
| 15 to 19 Years | 8 (2.7%) | 32 (8.1%) |
| 20 to 24 Years | 10 (3.4%) | 10 (2.5%) |
| 25 to 29 Years | 42 (14.1%) | 20 (5.1%) |
| 30 to 34 Years | 8 (2.7%) | 23 (5.8%) |
| 35 to 39 Years | 24 (8.1%) | 32 (8.1%) |
| 40 to 44 Years | 0 (0.0%) | 20 (5.1%) |
| 45 to 49 Years | 11 (3.7%) | 15 (3.8%) |
| 50 to 54 Years | 13 (4.4%) | 8 (2.0%) |
| 55 to 59 Years | 14 (4.7%) | 14 (3.5%) |
| 60 to 64 Years | 21 (7.0%) | 5 (1.3%) |
| 65 to 69 Years | 15 (5.0%) | 20 (5.1%) |
| 70 to 74 Years | 30 (10.1%) | 19 (4.8%) |
| 75 to 79 Years | 27 (9.1%) | 53 (13.5%) |
| 80 to 84 Years | 5 (1.7%) | 26 (6.6%) |
| 85 Years and over | 0 (0.0%) | 7 (1.8%) |
| Total | 298 (100.0%) | 394 (100.0%) |
Families and Households in Derby Line
Median Family Size in Derby Line
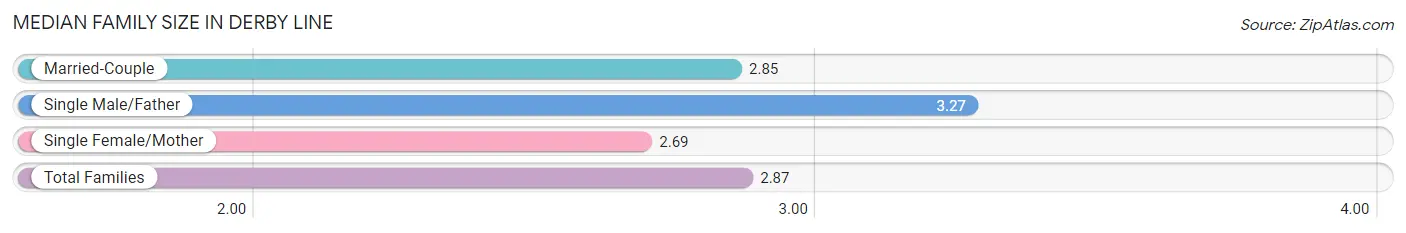
The median family size in Derby Line is 2.87 persons per family, with single male/father families (15 | 8.1%) accounting for the largest median family size of 3.27 persons per family. On the other hand, single female/mother families (13 | 7.0%) represent the smallest median family size with 2.69 persons per family.
| Family Type | # Families | Family Size |
| Married-Couple | 158 (85.0%) | 2.85 |
| Single Male/Father | 15 (8.1%) | 3.27 |
| Single Female/Mother | 13 (7.0%) | 2.69 |
| Total Families | 186 (100.0%) | 2.87 |
Median Household Size in Derby Line
The median household size in Derby Line is 2.20 persons per household, with single male/father households (15 | 4.8%) accounting for the largest median household size of 3.8 persons per household. non-family households (129 | 40.9%) represent the smallest median household size with 1.16 persons per household.

| Household Type | # Households | Household Size |
| Married-Couple | 158 (50.2%) | 2.85 |
| Single Male/Father | 15 (4.8%) | 3.80 |
| Single Female/Mother | 13 (4.1%) | 2.69 |
| Non-family | 129 (40.9%) | 1.16 |
| Total Households | 315 (100.0%) | 2.20 |
Household Size by Marriage Status in Derby Line
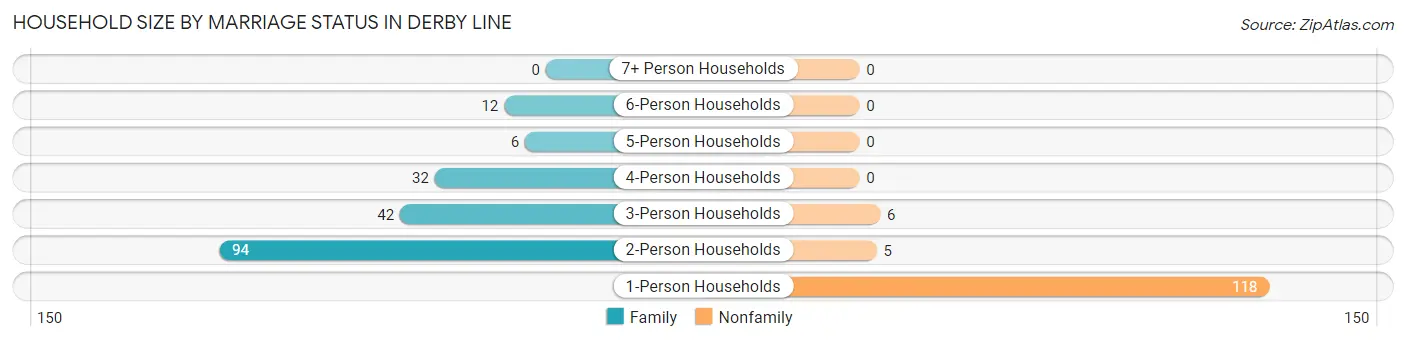
Out of a total of 315 households in Derby Line, 186 (59.1%) are family households, while 129 (40.9%) are nonfamily households. The most numerous type of family households are 2-person households, comprising 94, and the most common type of nonfamily households are 1-person households, comprising 118.
| Household Size | Family Households | Nonfamily Households |
| 1-Person Households | - | 118 (37.5%) |
| 2-Person Households | 94 (29.8%) | 5 (1.6%) |
| 3-Person Households | 42 (13.3%) | 6 (1.9%) |
| 4-Person Households | 32 (10.2%) | 0 (0.0%) |
| 5-Person Households | 6 (1.9%) | 0 (0.0%) |
| 6-Person Households | 12 (3.8%) | 0 (0.0%) |
| 7+ Person Households | 0 (0.0%) | 0 (0.0%) |
| Total | 186 (59.1%) | 129 (40.9%) |
Female Fertility in Derby Line
Fertility by Age in Derby Line
| Age Bracket | Women with Births | Births / 1,000 Women |
| 15 to 19 years | 0 (0.0%) | 0.0 |
| 20 to 34 years | 0 (0.0%) | 0.0 |
| 35 to 50 years | 0 (0.0%) | 0.0 |
| Total | 0 (0.0%) | 0.0 |
Fertility by Age by Marriage Status in Derby Line
| Age Bracket | Married | Unmarried |
| 15 to 19 years | 0 (0.0%) | 0 (0.0%) |
| 20 to 34 years | 0 (0.0%) | 0 (0.0%) |
| 35 to 50 years | 0 (0.0%) | 0 (0.0%) |
| Total | 0 (0.0%) | 0 (0.0%) |
Fertility by Education in Derby Line
| Educational Attainment | Women with Births | Births / 1,000 Women |
| Less than High School | 0 (0.0%) | 0.0 |
| High School Diploma | 0 (0.0%) | 0.0 |
| College or Associate's Degree | 0 (0.0%) | 0.0 |
| Bachelor's Degree | 0 (0.0%) | 0.0 |
| Graduate Degree | 0 (0.0%) | 0.0 |
| Total | 0 (0.0%) | 0.0 |
Fertility by Education by Marriage Status in Derby Line
| Educational Attainment | Married | Unmarried |
| Less than High School | 0 (0.0%) | 0 (0.0%) |
| High School Diploma | 0 (0.0%) | 0 (0.0%) |
| College or Associate's Degree | 0 (0.0%) | 0 (0.0%) |
| Bachelor's Degree | 0 (0.0%) | 0 (0.0%) |
| Graduate Degree | 0 (0.0%) | 0 (0.0%) |
| Total | 0 (0.0%) | 0 (0.0%) |
Employment Characteristics in Derby Line
Employment by Class of Employer in Derby Line
Among the 285 employed individuals in Derby Line, private company employees (167 | 58.6%), state government employees (48 | 16.8%), and not-for-profit organizations (27 | 9.5%) make up the most common classes of employment.
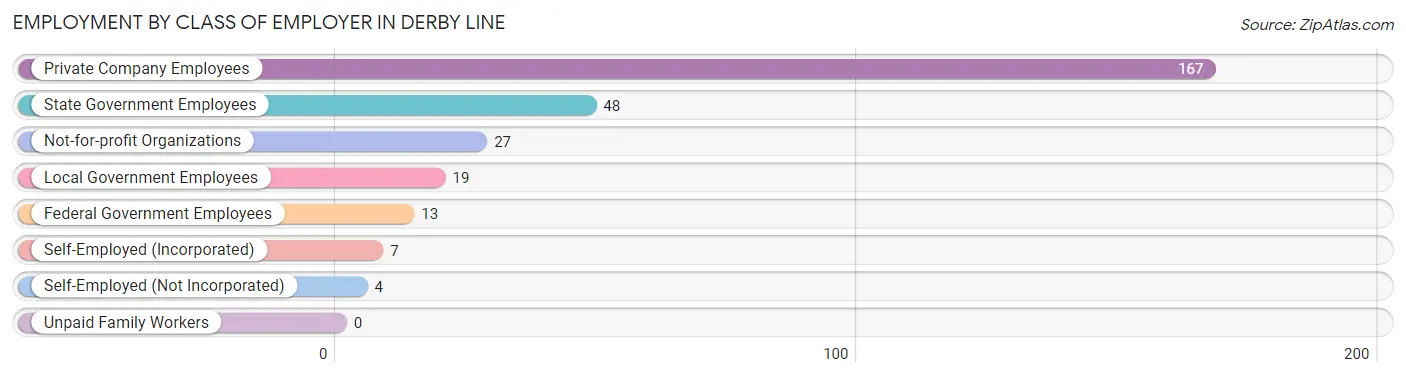
| Employer Class | # Employees | % Employees |
| Private Company Employees | 167 | 58.6% |
| Self-Employed (Incorporated) | 7 | 2.5% |
| Self-Employed (Not Incorporated) | 4 | 1.4% |
| Not-for-profit Organizations | 27 | 9.5% |
| Local Government Employees | 19 | 6.7% |
| State Government Employees | 48 | 16.8% |
| Federal Government Employees | 13 | 4.6% |
| Unpaid Family Workers | 0 | 0.0% |
| Total | 285 | 100.0% |
Employment Status by Age in Derby Line
According to the labor force statistics for Derby Line, out of the total population over 16 years of age (522), 57.5% or 300 individuals are in the labor force, with 3.0% or 9 of them unemployed. The age group with the highest labor force participation rate is 45 to 54 years, with 100.0% or 47 individuals in the labor force. Within the labor force, the 60 to 64 years age range has the highest percentage of unemployed individuals, with 42.9% or 9 of them being unemployed.
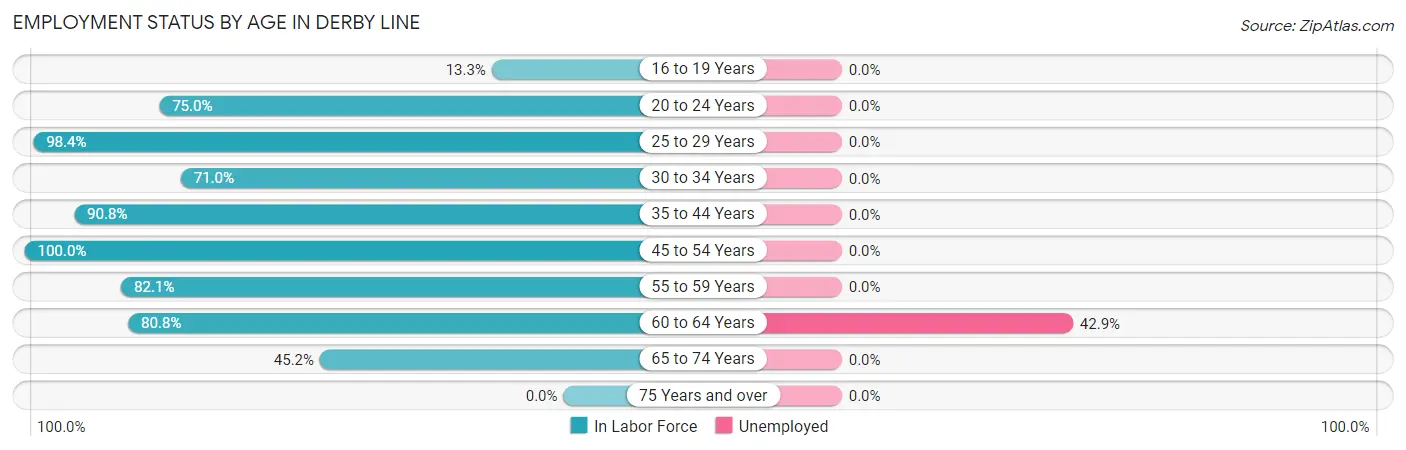
| Age Bracket | In Labor Force | Unemployed |
| 16 to 19 Years | 4 (13.3%) | 0 (0.0%) |
| 20 to 24 Years | 15 (75.0%) | 0 (0.0%) |
| 25 to 29 Years | 61 (98.4%) | 0 (0.0%) |
| 30 to 34 Years | 22 (71.0%) | 0 (0.0%) |
| 35 to 44 Years | 69 (90.8%) | 0 (0.0%) |
| 45 to 54 Years | 47 (100.0%) | 0 (0.0%) |
| 55 to 59 Years | 23 (82.1%) | 0 (0.0%) |
| 60 to 64 Years | 21 (80.8%) | 9 (42.9%) |
| 65 to 74 Years | 38 (45.2%) | 0 (0.0%) |
| 75 Years and over | 0 (0.0%) | 0 (0.0%) |
| Total | 300 (57.5%) | 9 (3.0%) |
Employment Status by Educational Attainment in Derby Line
According to labor force statistics for Derby Line, 90.0% of individuals (243) out of the total population between 25 and 64 years of age (270) are in the labor force, with 3.7% or 9 of them being unemployed. The group with the highest labor force participation rate are those with the educational attainment of less than high school, with 100.0% or 16 individuals in the labor force. Within the labor force, individuals with bachelor's degree or higher education have the highest percentage of unemployment, with 6.6% or 9 of them being unemployed.
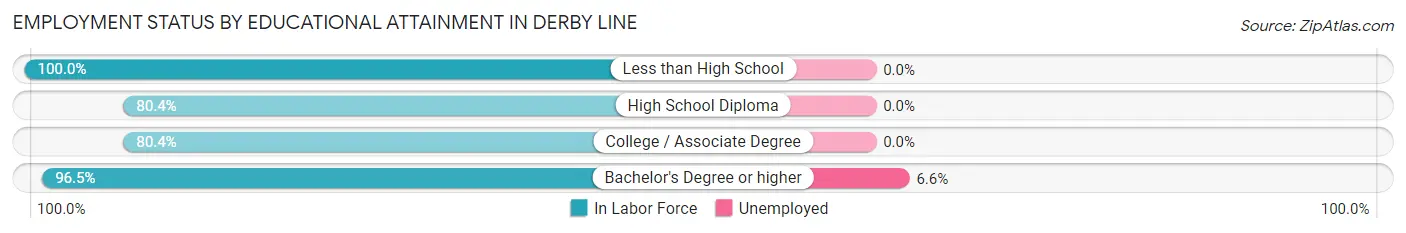
| Educational Attainment | In Labor Force | Unemployed |
| Less than High School | 16 (100.0%) | 0 (0.0%) |
| High School Diploma | 45 (80.4%) | 0 (0.0%) |
| College / Associate Degree | 45 (80.4%) | 0 (0.0%) |
| Bachelor's Degree or higher | 137 (96.5%) | 9 (6.6%) |
| Total | 243 (90.0%) | 10 (3.7%) |
Employment Occupations by Sex in Derby Line
Management, Business, Science and Arts Occupations
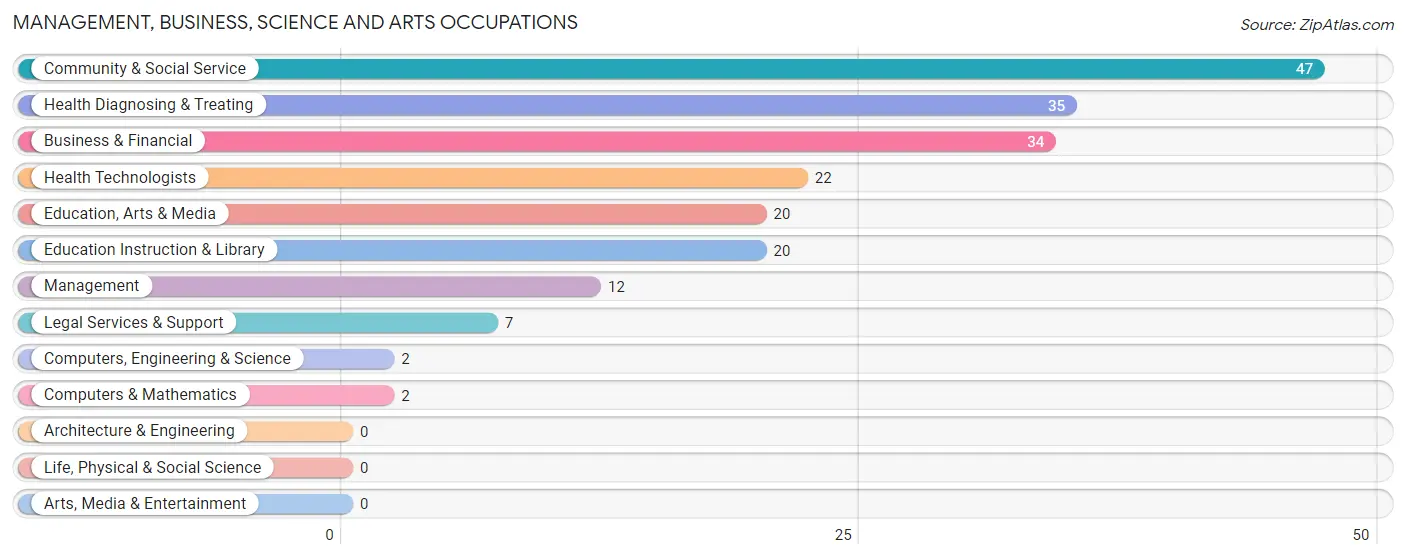
The most common Management, Business, Science and Arts occupations in Derby Line are Community & Social Service (47 | 16.2%), Health Diagnosing & Treating (35 | 12.0%), Business & Financial (34 | 11.7%), Health Technologists (22 | 7.6%), and Education, Arts & Media (20 | 6.9%).
Management, Business, Science and Arts Occupations by Sex
Within the Management, Business, Science and Arts occupations in Derby Line, the most male-oriented occupations are Legal Services & Support (100.0%), Management (41.7%), and Health Technologists (36.4%), while the most female-oriented occupations are Computers, Engineering & Science (100.0%), Computers & Mathematics (100.0%), and Education, Arts & Media (100.0%).
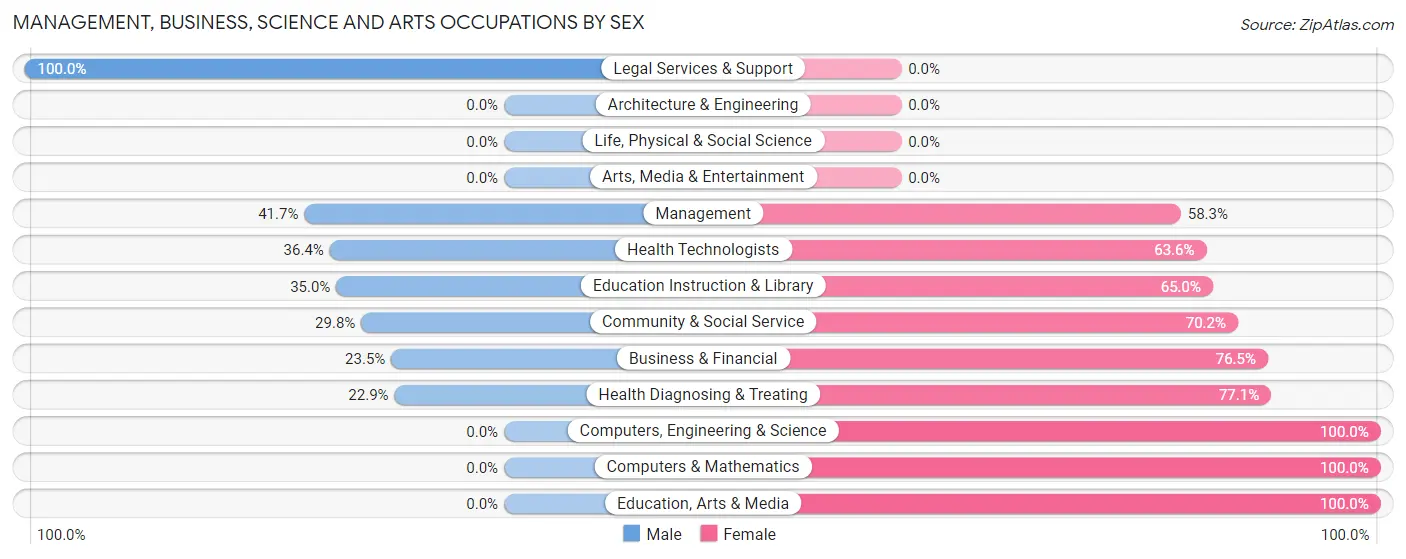
| Occupation | Male | Female |
| Management | 5 (41.7%) | 7 (58.3%) |
| Business & Financial | 8 (23.5%) | 26 (76.5%) |
| Computers, Engineering & Science | 0 (0.0%) | 2 (100.0%) |
| Computers & Mathematics | 0 (0.0%) | 2 (100.0%) |
| Architecture & Engineering | 0 (0.0%) | 0 (0.0%) |
| Life, Physical & Social Science | 0 (0.0%) | 0 (0.0%) |
| Community & Social Service | 14 (29.8%) | 33 (70.2%) |
| Education, Arts & Media | 0 (0.0%) | 20 (100.0%) |
| Legal Services & Support | 7 (100.0%) | 0 (0.0%) |
| Education Instruction & Library | 7 (35.0%) | 13 (65.0%) |
| Arts, Media & Entertainment | 0 (0.0%) | 0 (0.0%) |
| Health Diagnosing & Treating | 8 (22.9%) | 27 (77.1%) |
| Health Technologists | 8 (36.4%) | 14 (63.6%) |
| Total (Category) | 35 (26.9%) | 95 (73.1%) |
| Total (Overall) | 152 (52.2%) | 139 (47.8%) |
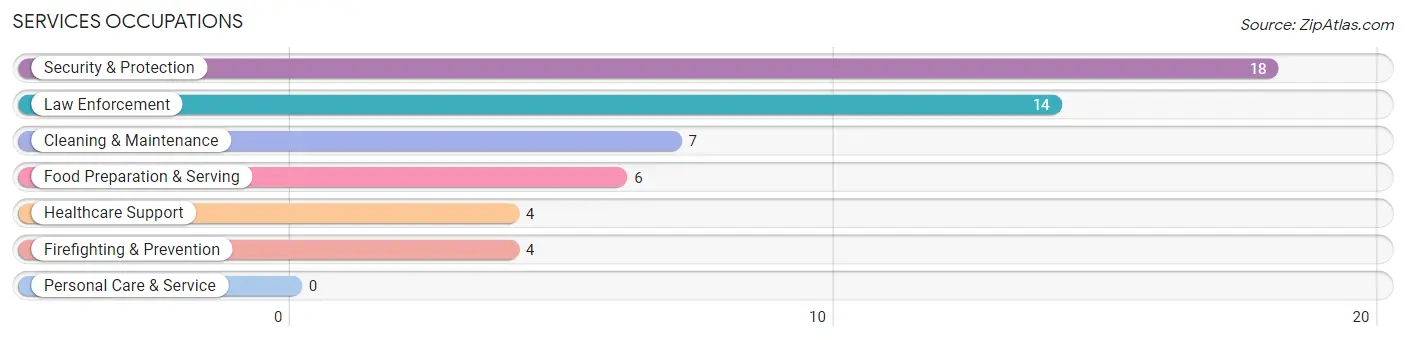
Services Occupations
The most common Services occupations in Derby Line are Security & Protection (18 | 6.2%), Law Enforcement (14 | 4.8%), Cleaning & Maintenance (7 | 2.4%), Food Preparation & Serving (6 | 2.1%), and Healthcare Support (4 | 1.4%).
Services Occupations by Sex
Within the Services occupations in Derby Line, the most male-oriented occupations are Law Enforcement (100.0%), Food Preparation & Serving (100.0%), and Security & Protection (77.8%), while the most female-oriented occupations are Healthcare Support (100.0%), Firefighting & Prevention (100.0%), and Cleaning & Maintenance (100.0%).
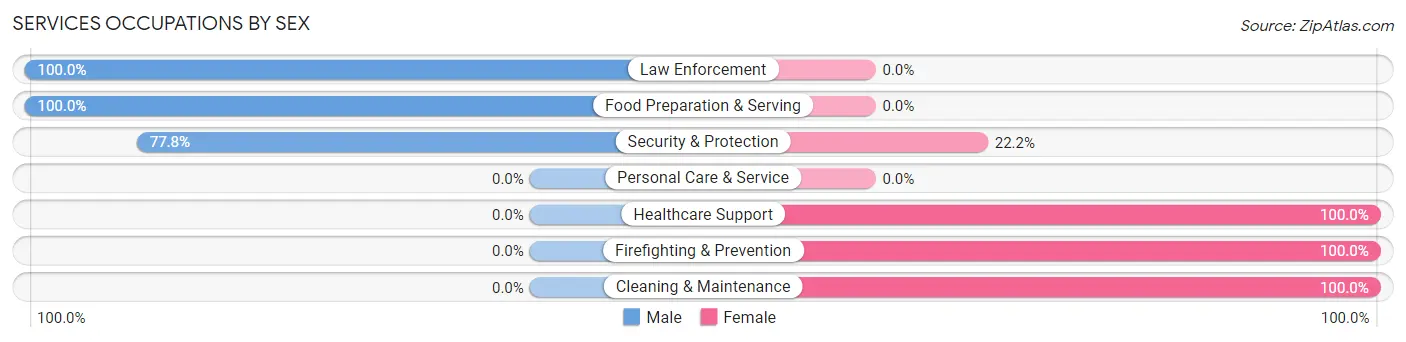
| Occupation | Male | Female |
| Healthcare Support | 0 (0.0%) | 4 (100.0%) |
| Security & Protection | 14 (77.8%) | 4 (22.2%) |
| Firefighting & Prevention | 0 (0.0%) | 4 (100.0%) |
| Law Enforcement | 14 (100.0%) | 0 (0.0%) |
| Food Preparation & Serving | 6 (100.0%) | 0 (0.0%) |
| Cleaning & Maintenance | 0 (0.0%) | 7 (100.0%) |
| Personal Care & Service | 0 (0.0%) | 0 (0.0%) |
| Total (Category) | 20 (57.1%) | 15 (42.9%) |
| Total (Overall) | 152 (52.2%) | 139 (47.8%) |
Sales and Office Occupations
The most common Sales and Office occupations in Derby Line are Sales & Related (31 | 10.6%), and Office & Administration (31 | 10.6%).
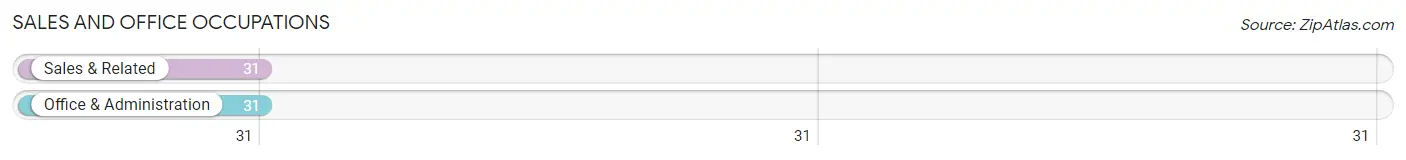
Sales and Office Occupations by Sex
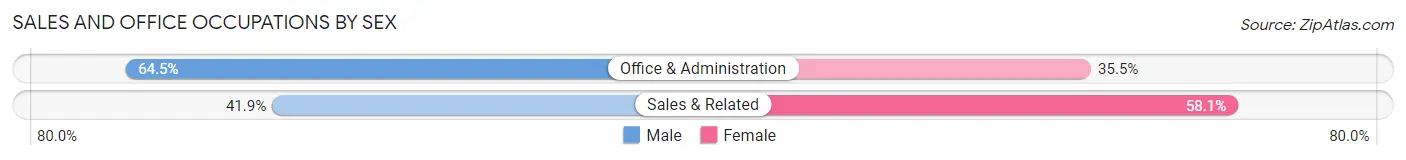
| Occupation | Male | Female |
| Sales & Related | 13 (41.9%) | 18 (58.1%) |
| Office & Administration | 20 (64.5%) | 11 (35.5%) |
| Total (Category) | 33 (53.2%) | 29 (46.8%) |
| Total (Overall) | 152 (52.2%) | 139 (47.8%) |
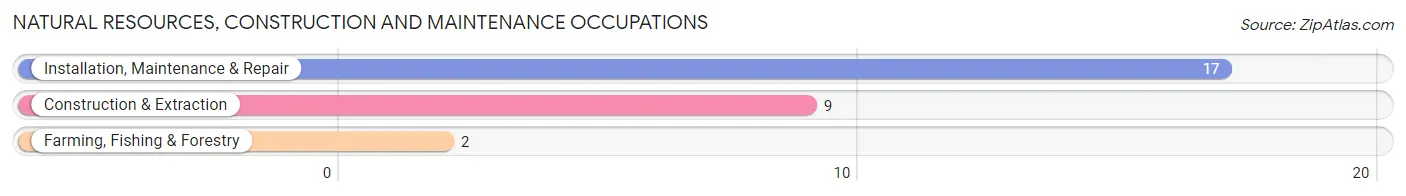
Natural Resources, Construction and Maintenance Occupations
The most common Natural Resources, Construction and Maintenance occupations in Derby Line are Installation, Maintenance & Repair (17 | 5.8%), Construction & Extraction (9 | 3.1%), and Farming, Fishing & Forestry (2 | 0.7%).
Natural Resources, Construction and Maintenance Occupations by Sex
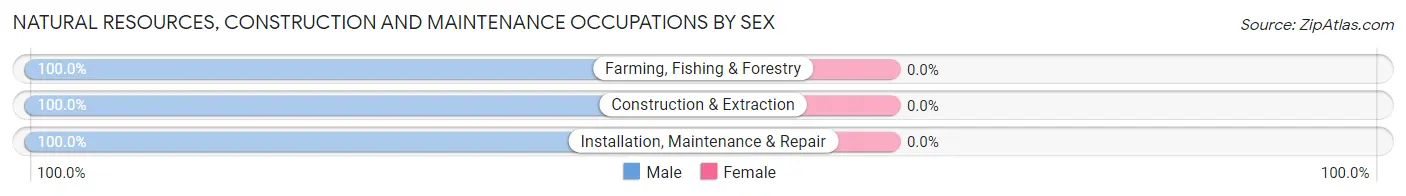
| Occupation | Male | Female |
| Farming, Fishing & Forestry | 2 (100.0%) | 0 (0.0%) |
| Construction & Extraction | 9 (100.0%) | 0 (0.0%) |
| Installation, Maintenance & Repair | 17 (100.0%) | 0 (0.0%) |
| Total (Category) | 28 (100.0%) | 0 (0.0%) |
| Total (Overall) | 152 (52.2%) | 139 (47.8%) |
Production, Transportation and Moving Occupations
The most common Production, Transportation and Moving occupations in Derby Line are Production (26 | 8.9%), Material Moving (7 | 2.4%), and Transportation (3 | 1.0%).
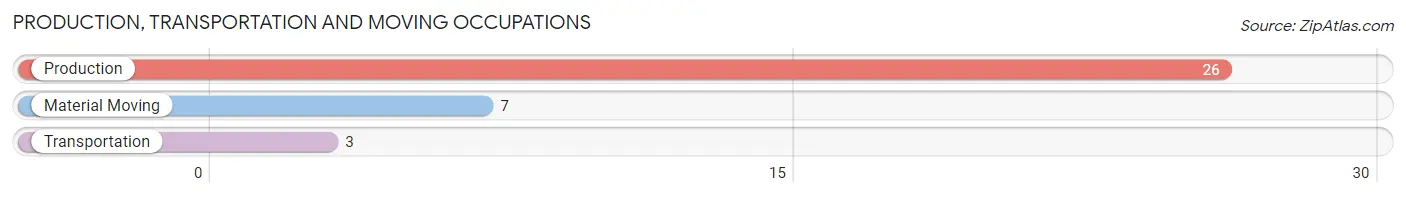
Production, Transportation and Moving Occupations by Sex
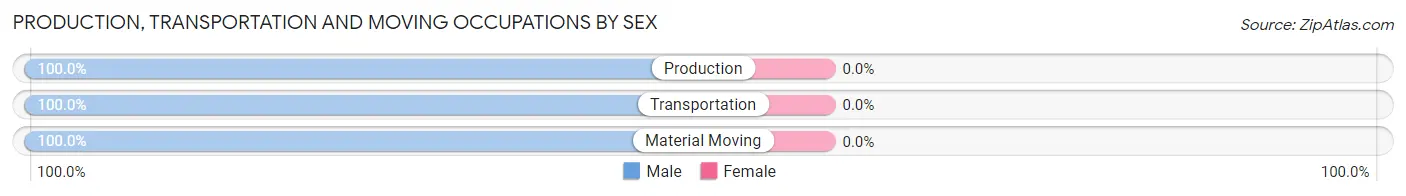
| Occupation | Male | Female |
| Production | 26 (100.0%) | 0 (0.0%) |
| Transportation | 3 (100.0%) | 0 (0.0%) |
| Material Moving | 7 (100.0%) | 0 (0.0%) |
| Total (Category) | 36 (100.0%) | 0 (0.0%) |
| Total (Overall) | 152 (52.2%) | 139 (47.8%) |
Employment Industries by Sex in Derby Line
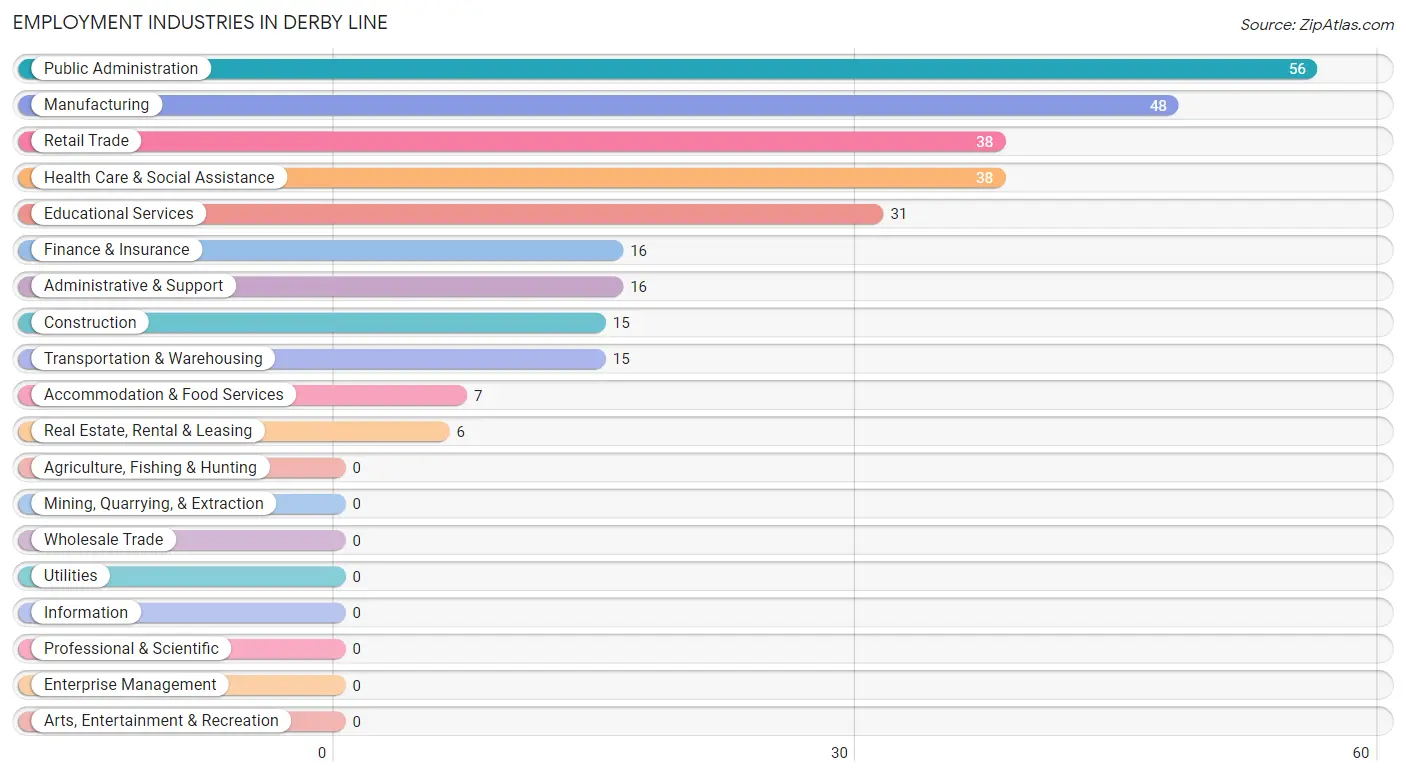
Employment Industries in Derby Line
The major employment industries in Derby Line include Public Administration (56 | 19.2%), Manufacturing (48 | 16.5%), Retail Trade (38 | 13.1%), Health Care & Social Assistance (38 | 13.1%), and Educational Services (31 | 10.6%).
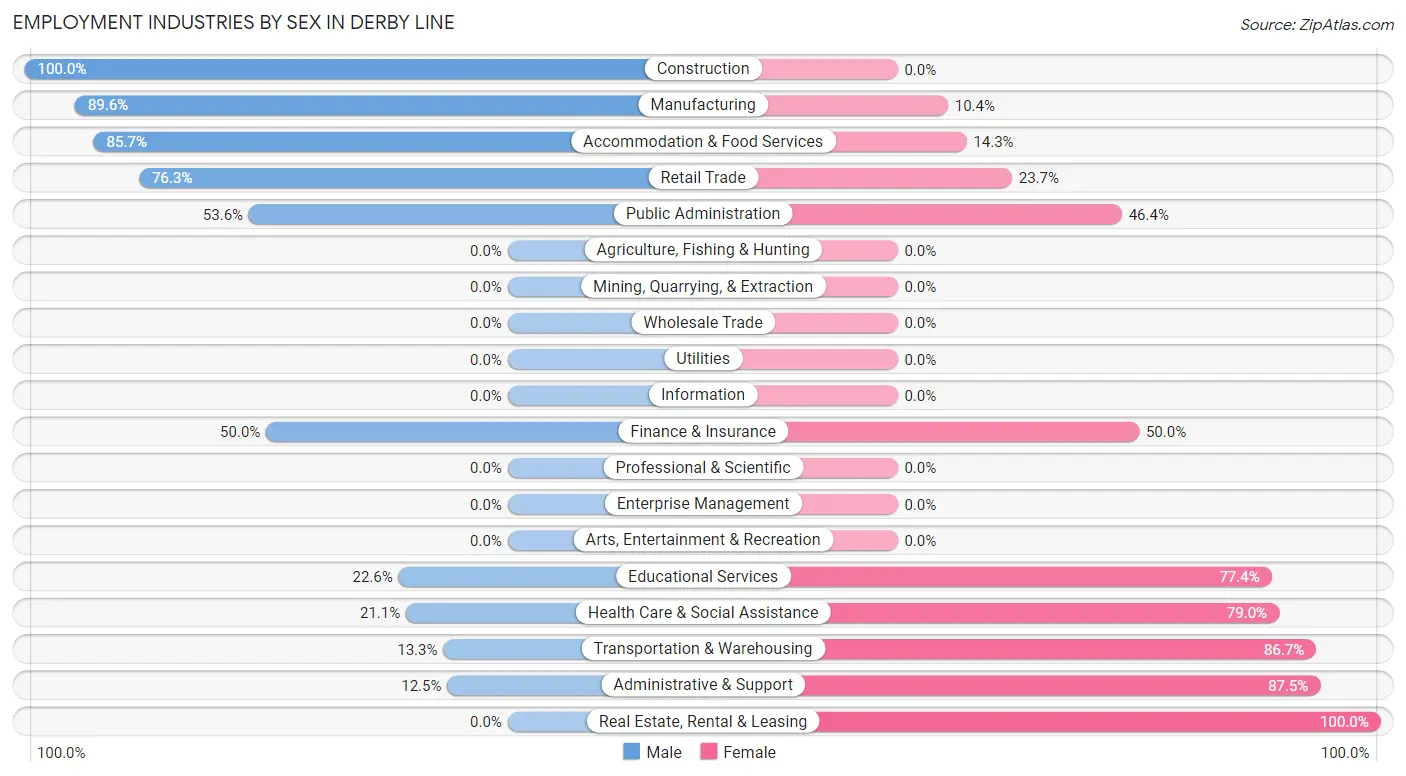
Employment Industries by Sex in Derby Line
The Derby Line industries that see more men than women are Construction (100.0%), Manufacturing (89.6%), and Accommodation & Food Services (85.7%), whereas the industries that tend to have a higher number of women are Real Estate, Rental & Leasing (100.0%), Administrative & Support (87.5%), and Transportation & Warehousing (86.7%).
| Industry | Male | Female |
| Agriculture, Fishing & Hunting | 0 (0.0%) | 0 (0.0%) |
| Mining, Quarrying, & Extraction | 0 (0.0%) | 0 (0.0%) |
| Construction | 15 (100.0%) | 0 (0.0%) |
| Manufacturing | 43 (89.6%) | 5 (10.4%) |
| Wholesale Trade | 0 (0.0%) | 0 (0.0%) |
| Retail Trade | 29 (76.3%) | 9 (23.7%) |
| Transportation & Warehousing | 2 (13.3%) | 13 (86.7%) |
| Utilities | 0 (0.0%) | 0 (0.0%) |
| Information | 0 (0.0%) | 0 (0.0%) |
| Finance & Insurance | 8 (50.0%) | 8 (50.0%) |
| Real Estate, Rental & Leasing | 0 (0.0%) | 6 (100.0%) |
| Professional & Scientific | 0 (0.0%) | 0 (0.0%) |
| Enterprise Management | 0 (0.0%) | 0 (0.0%) |
| Administrative & Support | 2 (12.5%) | 14 (87.5%) |
| Educational Services | 7 (22.6%) | 24 (77.4%) |
| Health Care & Social Assistance | 8 (21.0%) | 30 (78.9%) |
| Arts, Entertainment & Recreation | 0 (0.0%) | 0 (0.0%) |
| Accommodation & Food Services | 6 (85.7%) | 1 (14.3%) |
| Public Administration | 30 (53.6%) | 26 (46.4%) |
| Total | 152 (52.2%) | 139 (47.8%) |
Education in Derby Line
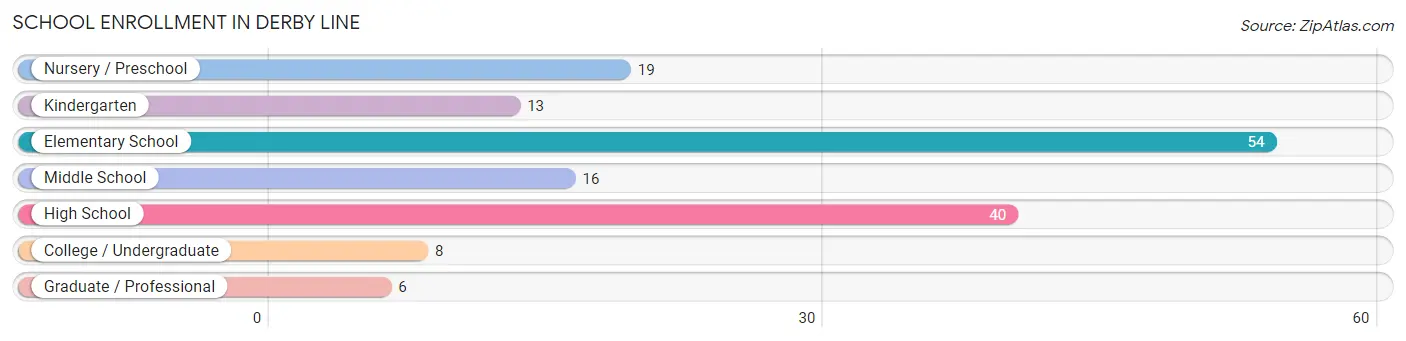
School Enrollment in Derby Line
The most common levels of schooling among the 156 students in Derby Line are elementary school (54 | 34.6%), high school (40 | 25.6%), and nursery / preschool (19 | 12.2%).
| School Level | # Students | % Students |
| Nursery / Preschool | 19 | 12.2% |
| Kindergarten | 13 | 8.3% |
| Elementary School | 54 | 34.6% |
| Middle School | 16 | 10.3% |
| High School | 40 | 25.6% |
| College / Undergraduate | 8 | 5.1% |
| Graduate / Professional | 6 | 3.8% |
| Total | 156 | 100.0% |
School Enrollment by Age by Funding Source in Derby Line
Out of a total of 156 students who are enrolled in schools in Derby Line, 24 (15.4%) attend a private institution, while the remaining 132 (84.6%) are enrolled in public schools. The age group of 25 to 34 year olds has the highest likelihood of being enrolled in private schools, with 6 (100.0% in the age bracket) enrolled. Conversely, the age group of 3 to 4 year olds has the lowest likelihood of being enrolled in a private school, with 7 (100.0% in the age bracket) attending a public institution.
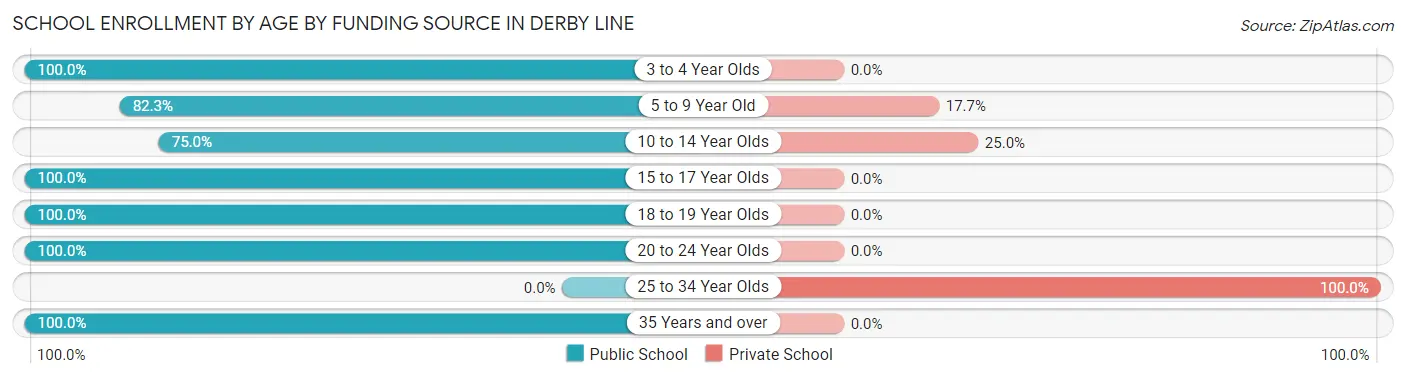
| Age Bracket | Public School | Private School |
| 3 to 4 Year Olds | 7 (100.0%) | 0 (0.0%) |
| 5 to 9 Year Old | 65 (82.3%) | 14 (17.7%) |
| 10 to 14 Year Olds | 12 (75.0%) | 4 (25.0%) |
| 15 to 17 Year Olds | 35 (100.0%) | 0 (0.0%) |
| 18 to 19 Year Olds | 5 (100.0%) | 0 (0.0%) |
| 20 to 24 Year Olds | 4 (100.0%) | 0 (0.0%) |
| 25 to 34 Year Olds | 0 (0.0%) | 6 (100.0%) |
| 35 Years and over | 4 (100.0%) | 0 (0.0%) |
| Total | 132 (84.6%) | 24 (15.4%) |
Educational Attainment by Field of Study in Derby Line
Bio, nature & agricultural (38 | 17.6%), education (28 | 13.0%), visual & performing arts (22 | 10.2%), psychology (19 | 8.8%), and literature & languages (18 | 8.3%) are the most common fields of study among 216 individuals in Derby Line who have obtained a bachelor's degree or higher.
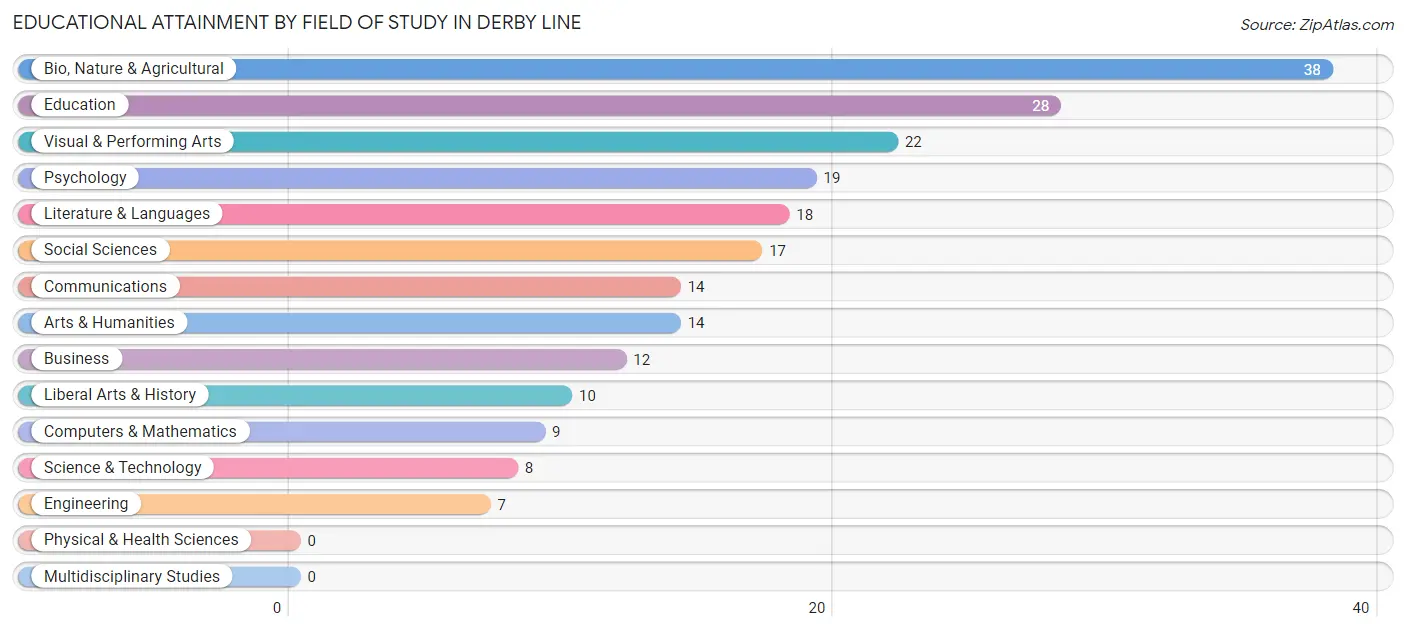
| Field of Study | # Graduates | % Graduates |
| Computers & Mathematics | 9 | 4.2% |
| Bio, Nature & Agricultural | 38 | 17.6% |
| Physical & Health Sciences | 0 | 0.0% |
| Psychology | 19 | 8.8% |
| Social Sciences | 17 | 7.9% |
| Engineering | 7 | 3.2% |
| Multidisciplinary Studies | 0 | 0.0% |
| Science & Technology | 8 | 3.7% |
| Business | 12 | 5.6% |
| Education | 28 | 13.0% |
| Literature & Languages | 18 | 8.3% |
| Liberal Arts & History | 10 | 4.6% |
| Visual & Performing Arts | 22 | 10.2% |
| Communications | 14 | 6.5% |
| Arts & Humanities | 14 | 6.5% |
| Total | 216 | 100.0% |
Transportation & Commute in Derby Line
Vehicle Availability by Sex in Derby Line
The most prevalent vehicle ownership categories in Derby Line are males with 2 vehicles (79, accounting for 52.0%) and females with 2 vehicles (65, making up 59.4%).
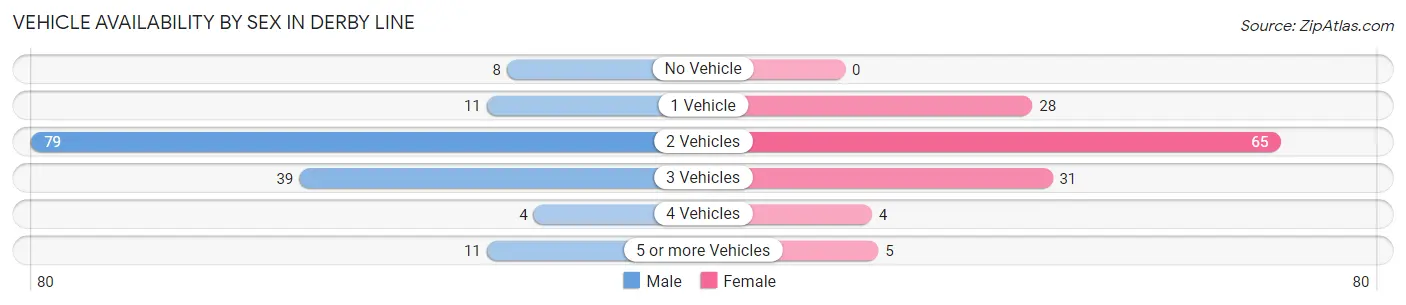
| Vehicles Available | Male | Female |
| No Vehicle | 8 (5.3%) | 0 (0.0%) |
| 1 Vehicle | 11 (7.2%) | 28 (21.0%) |
| 2 Vehicles | 79 (52.0%) | 65 (48.9%) |
| 3 Vehicles | 39 (25.7%) | 31 (23.3%) |
| 4 Vehicles | 4 (2.6%) | 4 (3.0%) |
| 5 or more Vehicles | 11 (7.2%) | 5 (3.8%) |
| Total | 152 (100.0%) | 133 (100.0%) |
Commute Time in Derby Line
The most frequently occuring commute durations in Derby Line are 15 to 19 minutes (81 commuters, 32.9%), 10 to 14 minutes (48 commuters, 19.5%), and less than 5 minutes (39 commuters, 15.9%).
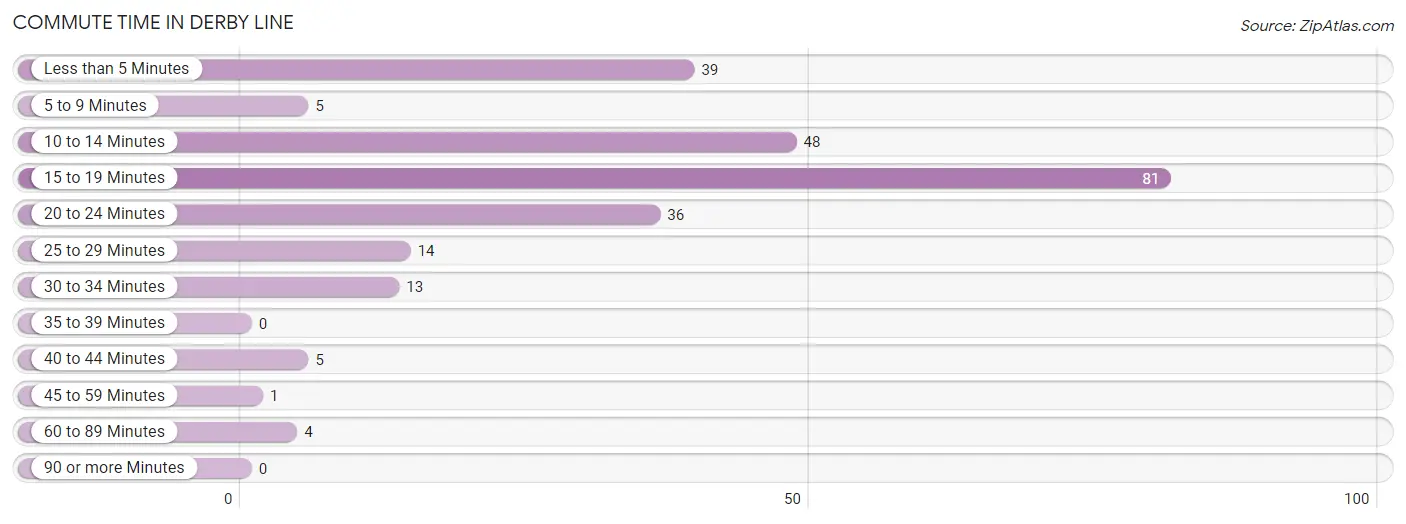
| Commute Time | # Commuters | % Commuters |
| Less than 5 Minutes | 39 | 15.9% |
| 5 to 9 Minutes | 5 | 2.0% |
| 10 to 14 Minutes | 48 | 19.5% |
| 15 to 19 Minutes | 81 | 32.9% |
| 20 to 24 Minutes | 36 | 14.6% |
| 25 to 29 Minutes | 14 | 5.7% |
| 30 to 34 Minutes | 13 | 5.3% |
| 35 to 39 Minutes | 0 | 0.0% |
| 40 to 44 Minutes | 5 | 2.0% |
| 45 to 59 Minutes | 1 | 0.4% |
| 60 to 89 Minutes | 4 | 1.6% |
| 90 or more Minutes | 0 | 0.0% |
Commute Time by Sex in Derby Line
The most common commute times in Derby Line are 10 to 14 minutes (46 commuters, 30.5%) for males and 15 to 19 minutes (47 commuters, 49.5%) for females.
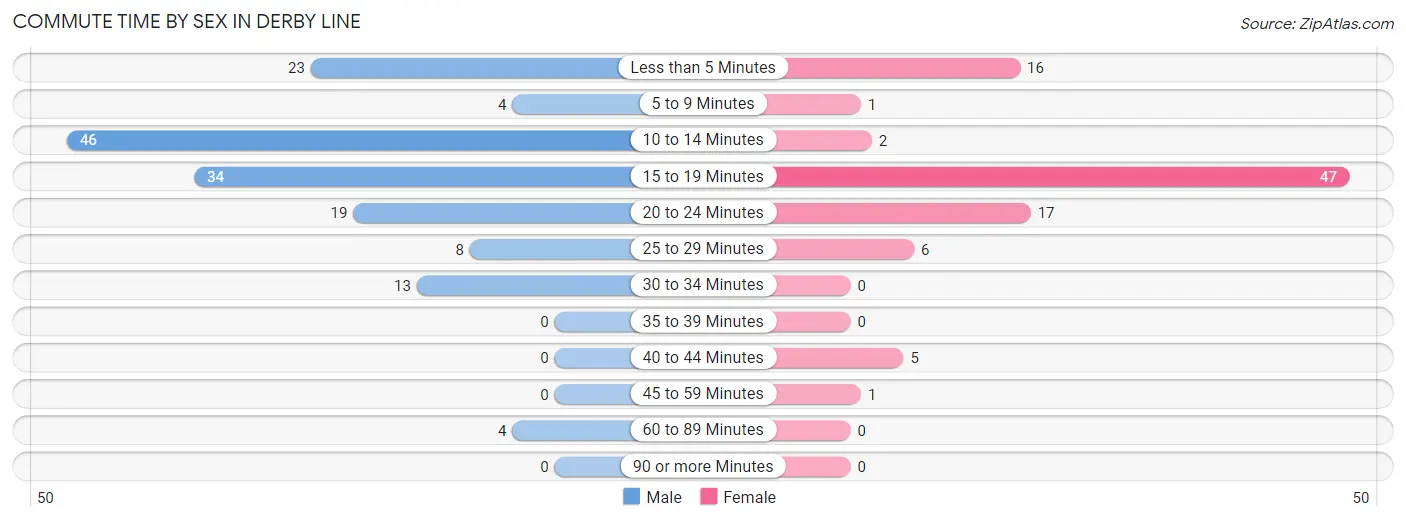
| Commute Time | Male | Female |
| Less than 5 Minutes | 23 (15.2%) | 16 (16.8%) |
| 5 to 9 Minutes | 4 (2.6%) | 1 (1.1%) |
| 10 to 14 Minutes | 46 (30.5%) | 2 (2.1%) |
| 15 to 19 Minutes | 34 (22.5%) | 47 (49.5%) |
| 20 to 24 Minutes | 19 (12.6%) | 17 (17.9%) |
| 25 to 29 Minutes | 8 (5.3%) | 6 (6.3%) |
| 30 to 34 Minutes | 13 (8.6%) | 0 (0.0%) |
| 35 to 39 Minutes | 0 (0.0%) | 0 (0.0%) |
| 40 to 44 Minutes | 0 (0.0%) | 5 (5.3%) |
| 45 to 59 Minutes | 0 (0.0%) | 1 (1.1%) |
| 60 to 89 Minutes | 4 (2.6%) | 0 (0.0%) |
| 90 or more Minutes | 0 (0.0%) | 0 (0.0%) |
Time of Departure to Work by Sex in Derby Line
The most frequent times of departure to work in Derby Line are 6:30 AM to 6:59 AM (59, 39.1%) for males and 7:30 AM to 7:59 AM (25, 26.3%) for females.
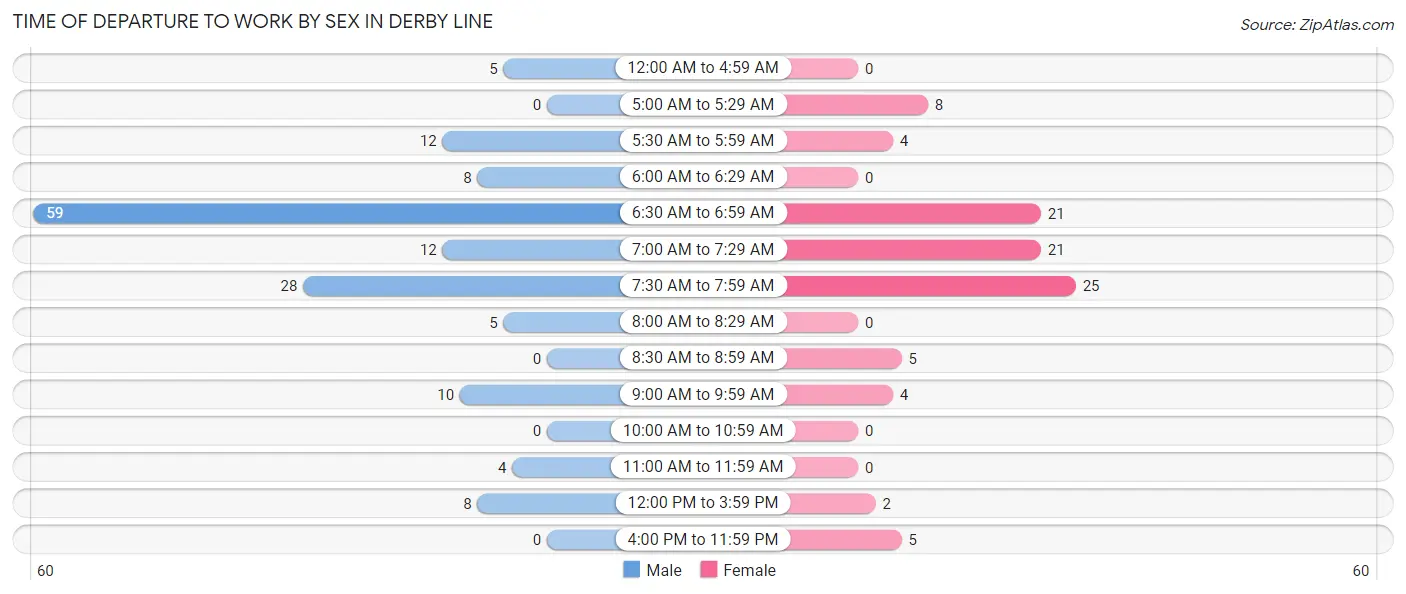
| Time of Departure | Male | Female |
| 12:00 AM to 4:59 AM | 5 (3.3%) | 0 (0.0%) |
| 5:00 AM to 5:29 AM | 0 (0.0%) | 8 (8.4%) |
| 5:30 AM to 5:59 AM | 12 (8.0%) | 4 (4.2%) |
| 6:00 AM to 6:29 AM | 8 (5.3%) | 0 (0.0%) |
| 6:30 AM to 6:59 AM | 59 (39.1%) | 21 (22.1%) |
| 7:00 AM to 7:29 AM | 12 (8.0%) | 21 (22.1%) |
| 7:30 AM to 7:59 AM | 28 (18.5%) | 25 (26.3%) |
| 8:00 AM to 8:29 AM | 5 (3.3%) | 0 (0.0%) |
| 8:30 AM to 8:59 AM | 0 (0.0%) | 5 (5.3%) |
| 9:00 AM to 9:59 AM | 10 (6.6%) | 4 (4.2%) |
| 10:00 AM to 10:59 AM | 0 (0.0%) | 0 (0.0%) |
| 11:00 AM to 11:59 AM | 4 (2.6%) | 0 (0.0%) |
| 12:00 PM to 3:59 PM | 8 (5.3%) | 2 (2.1%) |
| 4:00 PM to 11:59 PM | 0 (0.0%) | 5 (5.3%) |
| Total | 151 (100.0%) | 95 (100.0%) |
Housing Occupancy in Derby Line
Occupancy by Ownership in Derby Line
Of the total 315 dwellings in Derby Line, owner-occupied units account for 272 (86.4%), while renter-occupied units make up 43 (13.7%).
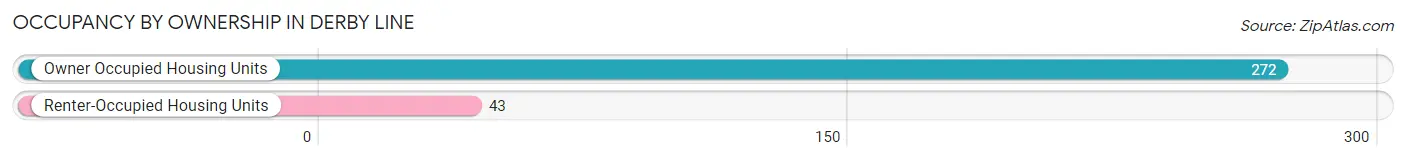
| Occupancy | # Housing Units | % Housing Units |
| Owner Occupied Housing Units | 272 | 86.4% |
| Renter-Occupied Housing Units | 43 | 13.7% |
| Total Occupied Housing Units | 315 | 100.0% |
Occupancy by Household Size in Derby Line
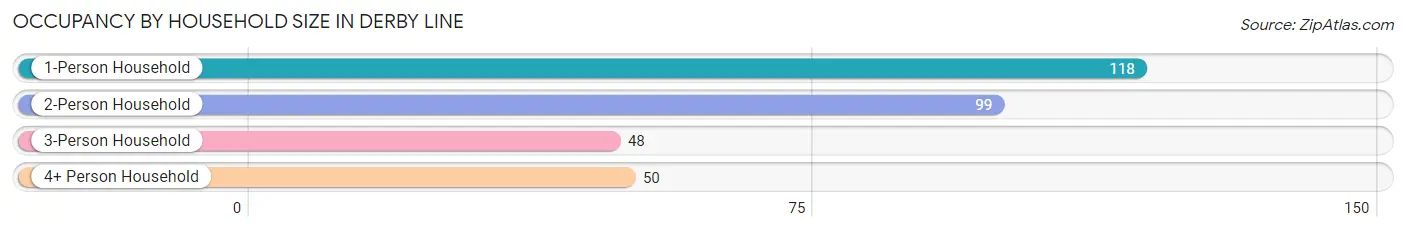
| Household Size | # Housing Units | % Housing Units |
| 1-Person Household | 118 | 37.5% |
| 2-Person Household | 99 | 31.4% |
| 3-Person Household | 48 | 15.2% |
| 4+ Person Household | 50 | 15.9% |
| Total Housing Units | 315 | 100.0% |
Occupancy by Ownership by Household Size in Derby Line
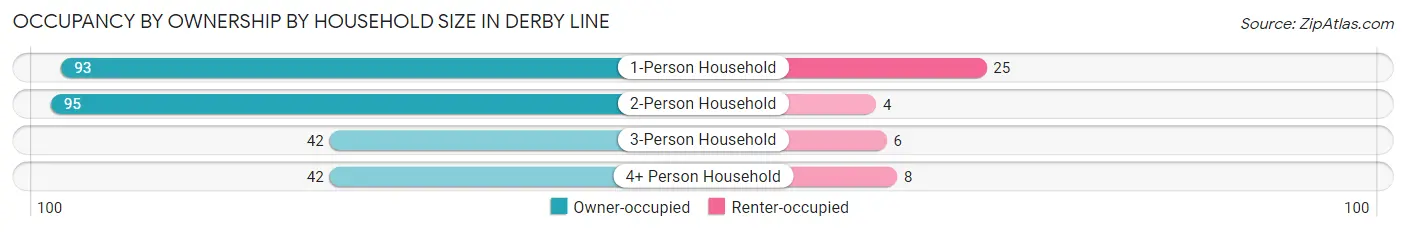
| Household Size | Owner-occupied | Renter-occupied |
| 1-Person Household | 93 (78.8%) | 25 (21.2%) |
| 2-Person Household | 95 (96.0%) | 4 (4.0%) |
| 3-Person Household | 42 (87.5%) | 6 (12.5%) |
| 4+ Person Household | 42 (84.0%) | 8 (16.0%) |
| Total Housing Units | 272 (86.4%) | 43 (13.7%) |
Occupancy by Educational Attainment in Derby Line
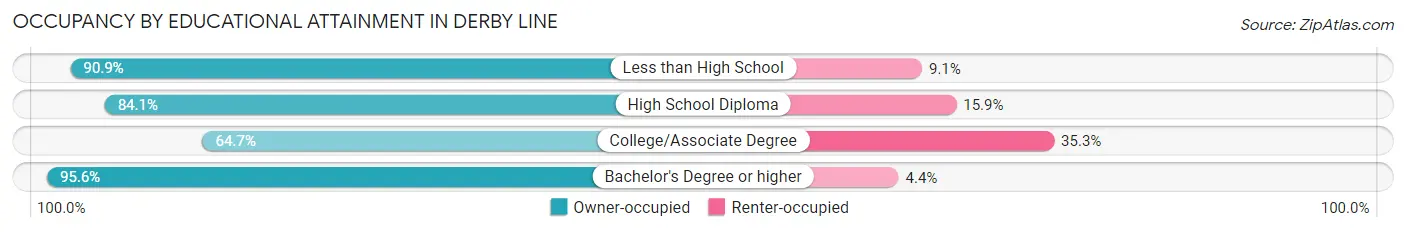
| Household Size | Owner-occupied | Renter-occupied |
| Less than High School | 20 (90.9%) | 2 (9.1%) |
| High School Diploma | 90 (84.1%) | 17 (15.9%) |
| College/Associate Degree | 33 (64.7%) | 18 (35.3%) |
| Bachelor's Degree or higher | 129 (95.6%) | 6 (4.4%) |
Occupancy by Age of Householder in Derby Line
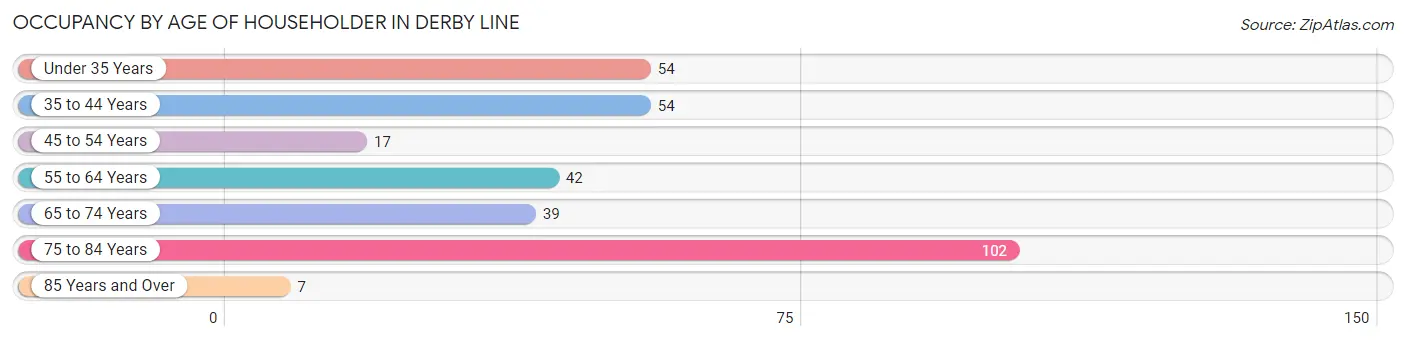
| Age Bracket | # Households | % Households |
| Under 35 Years | 54 | 17.1% |
| 35 to 44 Years | 54 | 17.1% |
| 45 to 54 Years | 17 | 5.4% |
| 55 to 64 Years | 42 | 13.3% |
| 65 to 74 Years | 39 | 12.4% |
| 75 to 84 Years | 102 | 32.4% |
| 85 Years and Over | 7 | 2.2% |
| Total | 315 | 100.0% |
Housing Finances in Derby Line
Median Income by Occupancy in Derby Line
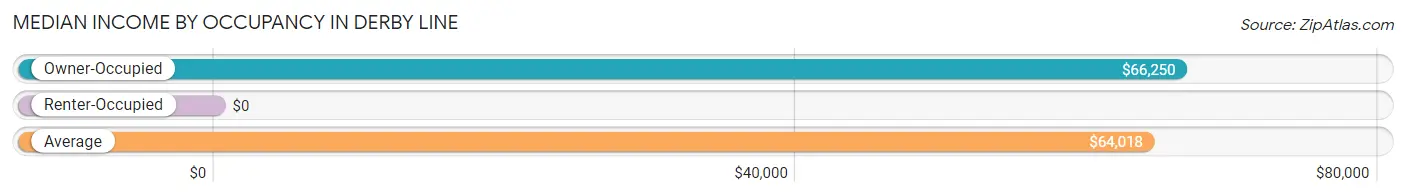
| Occupancy Type | # Households | Median Income |
| Owner-Occupied | 272 (86.4%) | $66,250 |
| Renter-Occupied | 43 (13.7%) | $0 |
| Average | 315 (100.0%) | $64,018 |
Occupancy by Householder Income Bracket in Derby Line
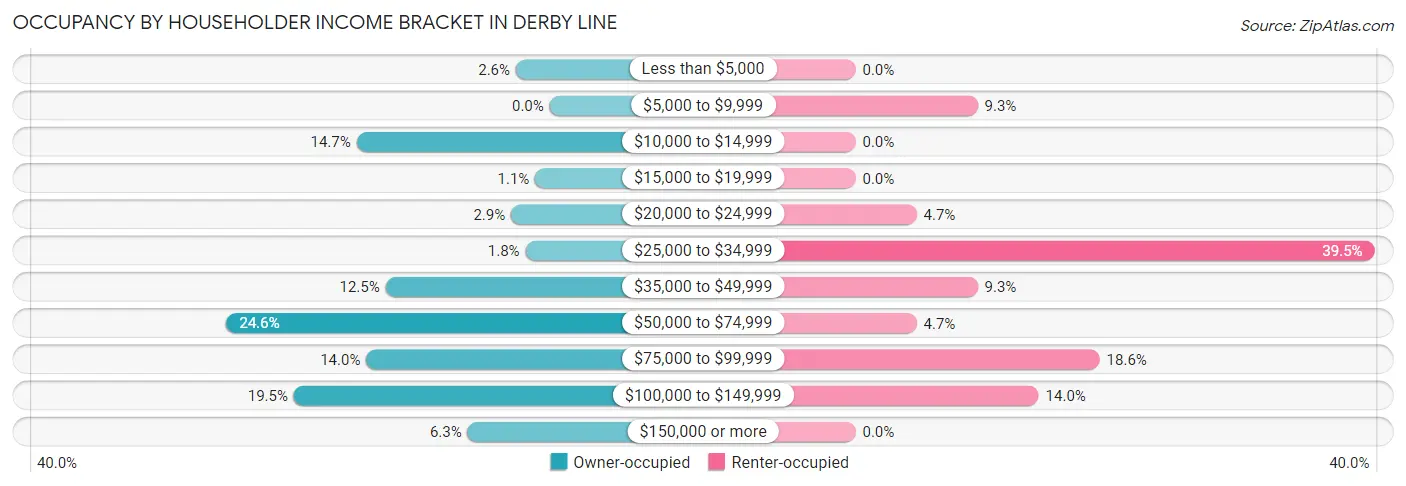
| Income Bracket | Owner-occupied | Renter-occupied |
| Less than $5,000 | 7 (2.6%) | 0 (0.0%) |
| $5,000 to $9,999 | 0 (0.0%) | 4 (9.3%) |
| $10,000 to $14,999 | 40 (14.7%) | 0 (0.0%) |
| $15,000 to $19,999 | 3 (1.1%) | 0 (0.0%) |
| $20,000 to $24,999 | 8 (2.9%) | 2 (4.6%) |
| $25,000 to $34,999 | 5 (1.8%) | 17 (39.5%) |
| $35,000 to $49,999 | 34 (12.5%) | 4 (9.3%) |
| $50,000 to $74,999 | 67 (24.6%) | 2 (4.6%) |
| $75,000 to $99,999 | 38 (14.0%) | 8 (18.6%) |
| $100,000 to $149,999 | 53 (19.5%) | 6 (14.0%) |
| $150,000 or more | 17 (6.2%) | 0 (0.0%) |
| Total | 272 (100.0%) | 43 (100.0%) |
Monthly Housing Cost Tiers in Derby Line
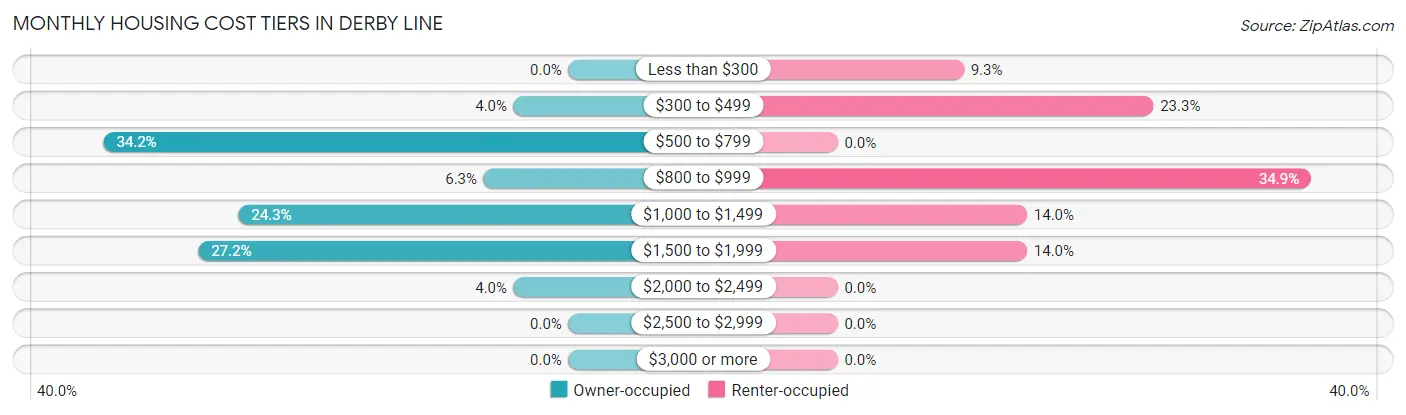
| Monthly Cost | Owner-occupied | Renter-occupied |
| Less than $300 | 0 (0.0%) | 4 (9.3%) |
| $300 to $499 | 11 (4.0%) | 10 (23.3%) |
| $500 to $799 | 93 (34.2%) | 0 (0.0%) |
| $800 to $999 | 17 (6.2%) | 15 (34.9%) |
| $1,000 to $1,499 | 66 (24.3%) | 6 (14.0%) |
| $1,500 to $1,999 | 74 (27.2%) | 6 (14.0%) |
| $2,000 to $2,499 | 11 (4.0%) | 0 (0.0%) |
| $2,500 to $2,999 | 0 (0.0%) | 0 (0.0%) |
| $3,000 or more | 0 (0.0%) | 0 (0.0%) |
| Total | 272 (100.0%) | 43 (100.0%) |
Physical Housing Characteristics in Derby Line
Housing Structures in Derby Line
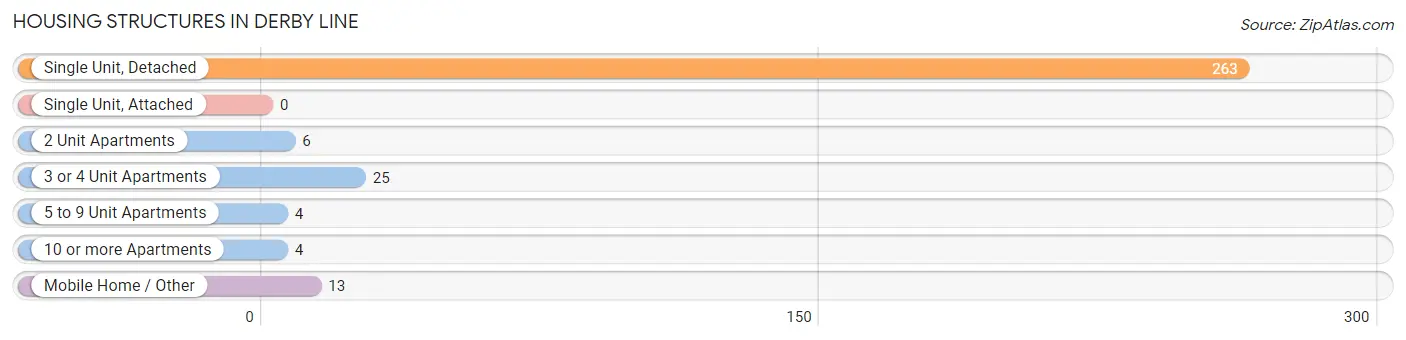
| Structure Type | # Housing Units | % Housing Units |
| Single Unit, Detached | 263 | 83.5% |
| Single Unit, Attached | 0 | 0.0% |
| 2 Unit Apartments | 6 | 1.9% |
| 3 or 4 Unit Apartments | 25 | 7.9% |
| 5 to 9 Unit Apartments | 4 | 1.3% |
| 10 or more Apartments | 4 | 1.3% |
| Mobile Home / Other | 13 | 4.1% |
| Total | 315 | 100.0% |
Housing Structures by Occupancy in Derby Line
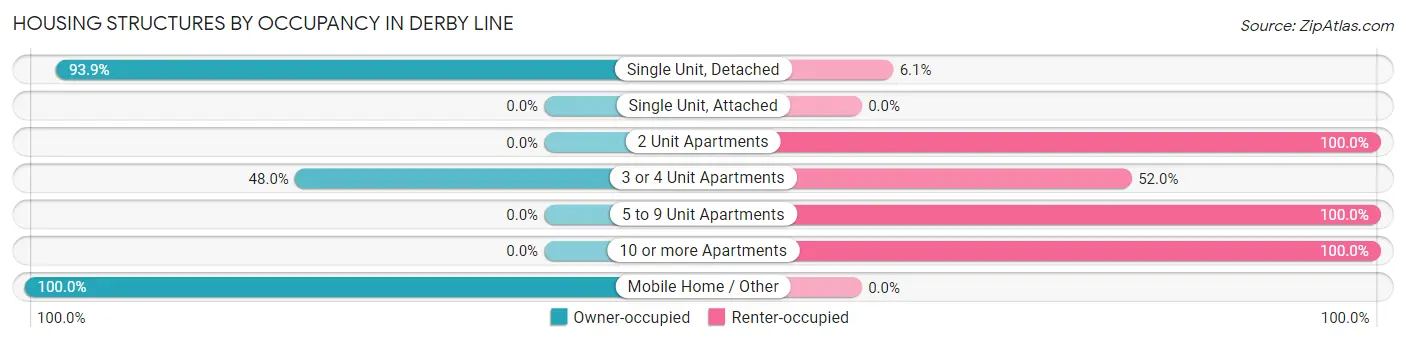
| Structure Type | Owner-occupied | Renter-occupied |
| Single Unit, Detached | 247 (93.9%) | 16 (6.1%) |
| Single Unit, Attached | 0 (0.0%) | 0 (0.0%) |
| 2 Unit Apartments | 0 (0.0%) | 6 (100.0%) |
| 3 or 4 Unit Apartments | 12 (48.0%) | 13 (52.0%) |
| 5 to 9 Unit Apartments | 0 (0.0%) | 4 (100.0%) |
| 10 or more Apartments | 0 (0.0%) | 4 (100.0%) |
| Mobile Home / Other | 13 (100.0%) | 0 (0.0%) |
| Total | 272 (86.4%) | 43 (13.7%) |
Housing Structures by Number of Rooms in Derby Line
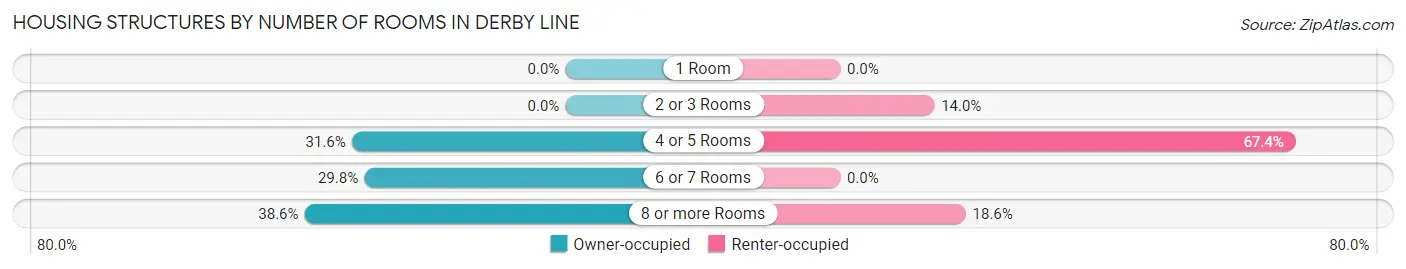
| Number of Rooms | Owner-occupied | Renter-occupied |
| 1 Room | 0 (0.0%) | 0 (0.0%) |
| 2 or 3 Rooms | 0 (0.0%) | 6 (14.0%) |
| 4 or 5 Rooms | 86 (31.6%) | 29 (67.4%) |
| 6 or 7 Rooms | 81 (29.8%) | 0 (0.0%) |
| 8 or more Rooms | 105 (38.6%) | 8 (18.6%) |
| Total | 272 (100.0%) | 43 (100.0%) |
Housing Structure by Heating Type in Derby Line
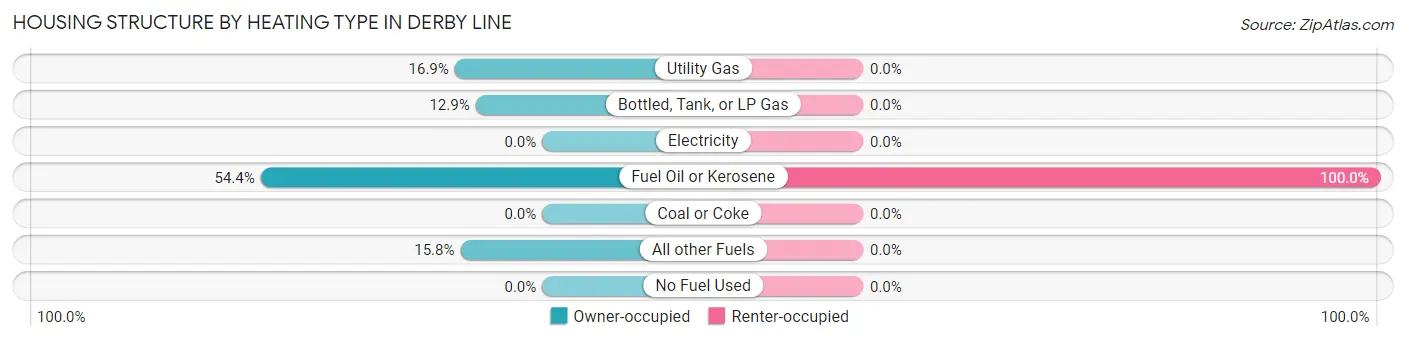
| Heating Type | Owner-occupied | Renter-occupied |
| Utility Gas | 46 (16.9%) | 0 (0.0%) |
| Bottled, Tank, or LP Gas | 35 (12.9%) | 0 (0.0%) |
| Electricity | 0 (0.0%) | 0 (0.0%) |
| Fuel Oil or Kerosene | 148 (54.4%) | 43 (100.0%) |
| Coal or Coke | 0 (0.0%) | 0 (0.0%) |
| All other Fuels | 43 (15.8%) | 0 (0.0%) |
| No Fuel Used | 0 (0.0%) | 0 (0.0%) |
| Total | 272 (100.0%) | 43 (100.0%) |
Household Vehicle Usage in Derby Line
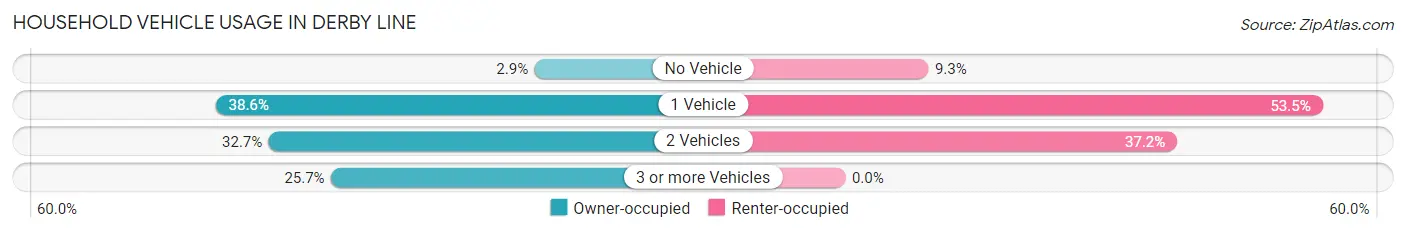
| Vehicles per Household | Owner-occupied | Renter-occupied |
| No Vehicle | 8 (2.9%) | 4 (9.3%) |
| 1 Vehicle | 105 (38.6%) | 23 (53.5%) |
| 2 Vehicles | 89 (32.7%) | 16 (37.2%) |
| 3 or more Vehicles | 70 (25.7%) | 0 (0.0%) |
| Total | 272 (100.0%) | 43 (100.0%) |
Real Estate & Mortgages in Derby Line
Real Estate and Mortgage Overview in Derby Line
| Characteristic | Without Mortgage | With Mortgage |
| Housing Units | 125 | 147 |
| Median Property Value | $180,200 | $157,300 |
| Median Household Income | - | - |
| Monthly Housing Costs | $715 | $0 |
| Real Estate Taxes | $3,310 | $0 |
Property Value by Mortgage Status in Derby Line
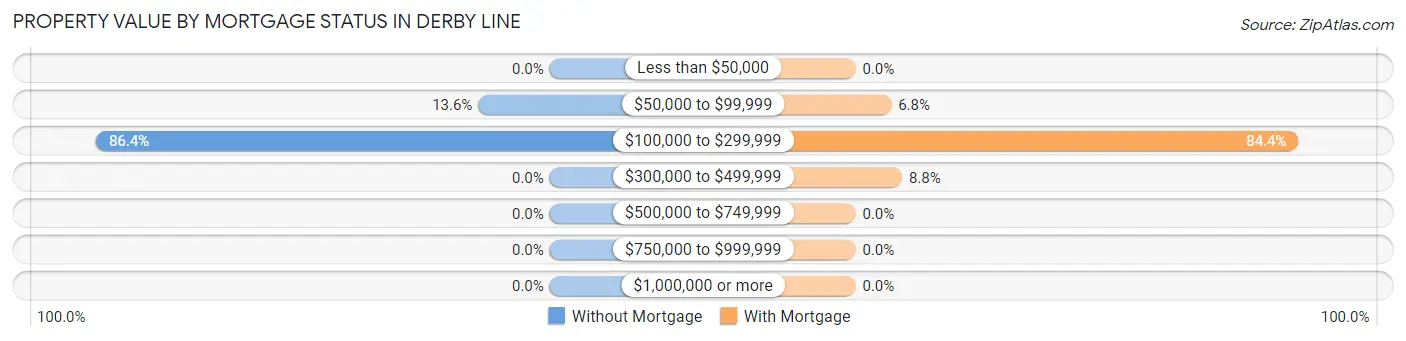
| Property Value | Without Mortgage | With Mortgage |
| Less than $50,000 | 0 (0.0%) | 0 (0.0%) |
| $50,000 to $99,999 | 17 (13.6%) | 10 (6.8%) |
| $100,000 to $299,999 | 108 (86.4%) | 124 (84.4%) |
| $300,000 to $499,999 | 0 (0.0%) | 13 (8.8%) |
| $500,000 to $749,999 | 0 (0.0%) | 0 (0.0%) |
| $750,000 to $999,999 | 0 (0.0%) | 0 (0.0%) |
| $1,000,000 or more | 0 (0.0%) | 0 (0.0%) |
| Total | 125 (100.0%) | 147 (100.0%) |
Household Income by Mortgage Status in Derby Line
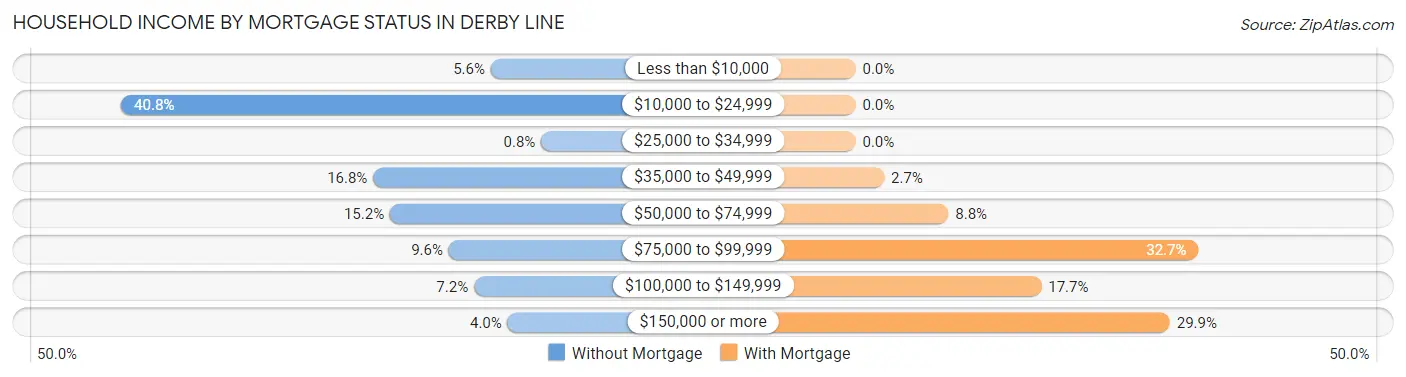
| Household Income | Without Mortgage | With Mortgage |
| Less than $10,000 | 7 (5.6%) | 0 (0.0%) |
| $10,000 to $24,999 | 51 (40.8%) | 0 (0.0%) |
| $25,000 to $34,999 | 1 (0.8%) | 0 (0.0%) |
| $35,000 to $49,999 | 21 (16.8%) | 4 (2.7%) |
| $50,000 to $74,999 | 19 (15.2%) | 13 (8.8%) |
| $75,000 to $99,999 | 12 (9.6%) | 48 (32.7%) |
| $100,000 to $149,999 | 9 (7.2%) | 26 (17.7%) |
| $150,000 or more | 5 (4.0%) | 44 (29.9%) |
| Total | 125 (100.0%) | 147 (100.0%) |
Property Value to Household Income Ratio in Derby Line
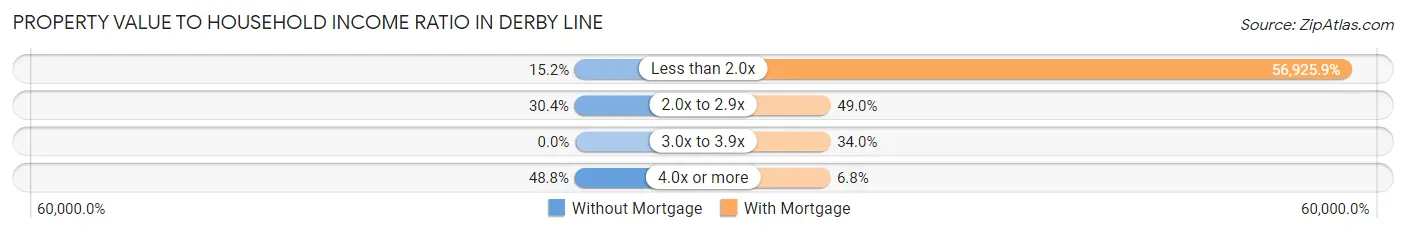
| Value-to-Income Ratio | Without Mortgage | With Mortgage |
| Less than 2.0x | 19 (15.2%) | 83,681 (56,925.9%) |
| 2.0x to 2.9x | 38 (30.4%) | 72 (49.0%) |
| 3.0x to 3.9x | 0 (0.0%) | 50 (34.0%) |
| 4.0x or more | 61 (48.8%) | 10 (6.8%) |
| Total | 125 (100.0%) | 147 (100.0%) |
Real Estate Taxes by Mortgage Status in Derby Line
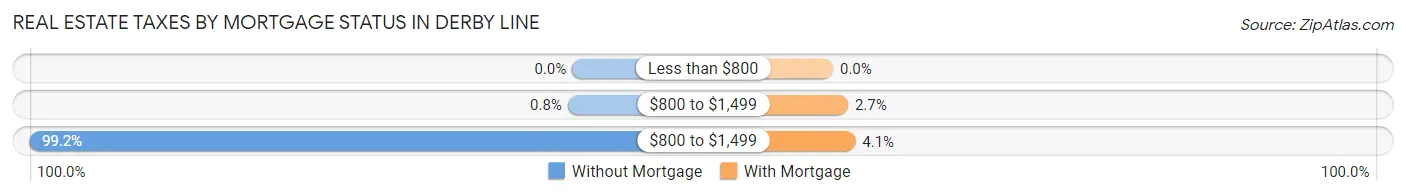
| Property Taxes | Without Mortgage | With Mortgage |
| Less than $800 | 0 (0.0%) | 0 (0.0%) |
| $800 to $1,499 | 1 (0.8%) | 4 (2.7%) |
| $800 to $1,499 | 124 (99.2%) | 6 (4.1%) |
| Total | 125 (100.0%) | 147 (100.0%) |
Health & Disability in Derby Line
Health Insurance Coverage by Age in Derby Line
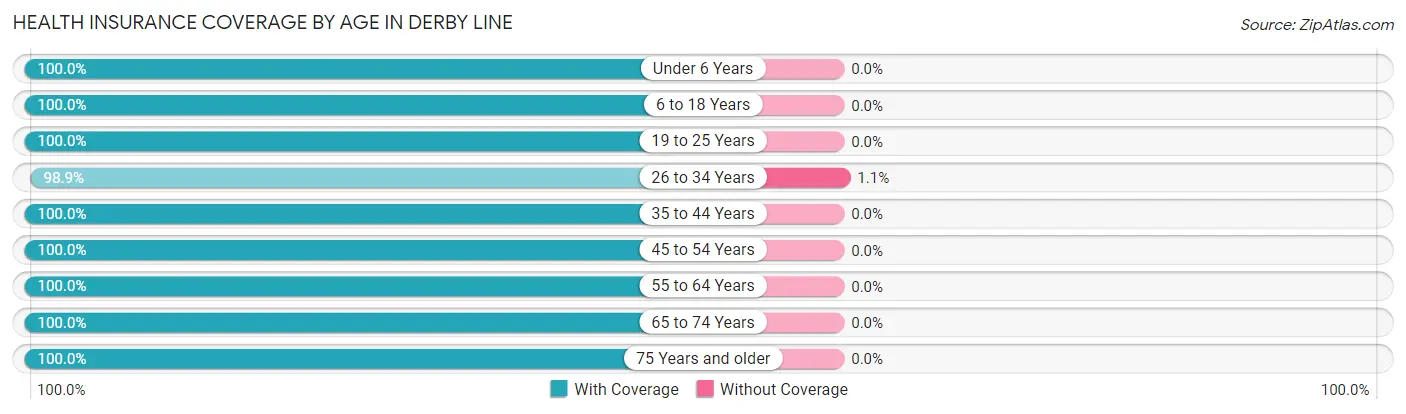
| Age Bracket | With Coverage | Without Coverage |
| Under 6 Years | 77 (100.0%) | 0 (0.0%) |
| 6 to 18 Years | 123 (100.0%) | 0 (0.0%) |
| 19 to 25 Years | 25 (100.0%) | 0 (0.0%) |
| 26 to 34 Years | 87 (98.9%) | 1 (1.1%) |
| 35 to 44 Years | 76 (100.0%) | 0 (0.0%) |
| 45 to 54 Years | 47 (100.0%) | 0 (0.0%) |
| 55 to 64 Years | 54 (100.0%) | 0 (0.0%) |
| 65 to 74 Years | 84 (100.0%) | 0 (0.0%) |
| 75 Years and older | 118 (100.0%) | 0 (0.0%) |
| Total | 691 (99.9%) | 1 (0.1%) |
Health Insurance Coverage by Citizenship Status in Derby Line
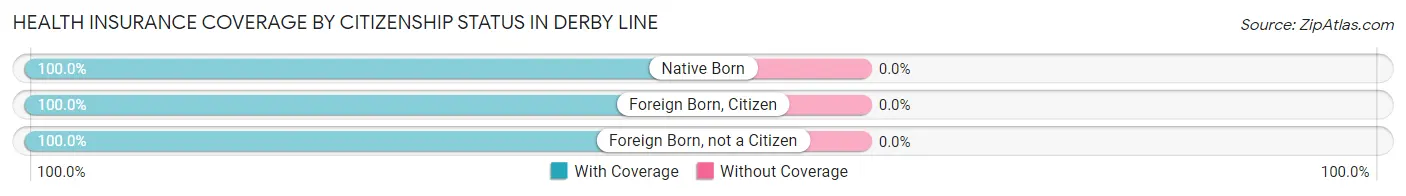
| Citizenship Status | With Coverage | Without Coverage |
| Native Born | 77 (100.0%) | 0 (0.0%) |
| Foreign Born, Citizen | 123 (100.0%) | 0 (0.0%) |
| Foreign Born, not a Citizen | 25 (100.0%) | 0 (0.0%) |
Health Insurance Coverage by Household Income in Derby Line
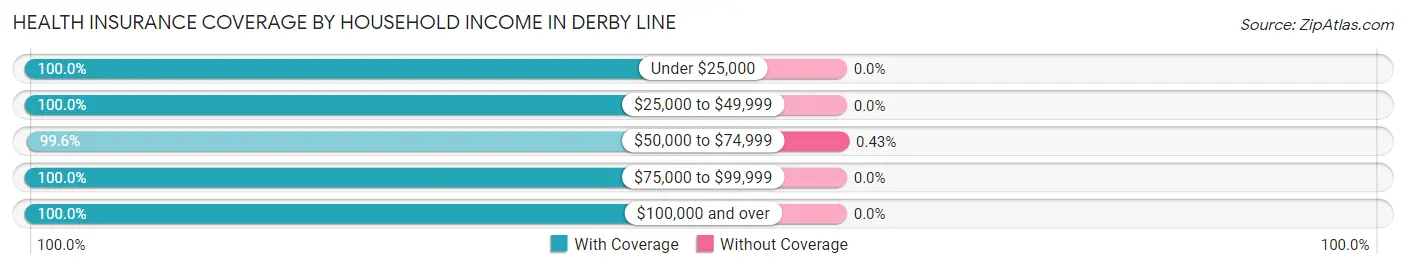
| Household Income | With Coverage | Without Coverage |
| Under $25,000 | 70 (100.0%) | 0 (0.0%) |
| $25,000 to $49,999 | 76 (100.0%) | 0 (0.0%) |
| $50,000 to $74,999 | 232 (99.6%) | 1 (0.4%) |
| $75,000 to $99,999 | 129 (100.0%) | 0 (0.0%) |
| $100,000 and over | 184 (100.0%) | 0 (0.0%) |
Public vs Private Health Insurance Coverage by Age in Derby Line
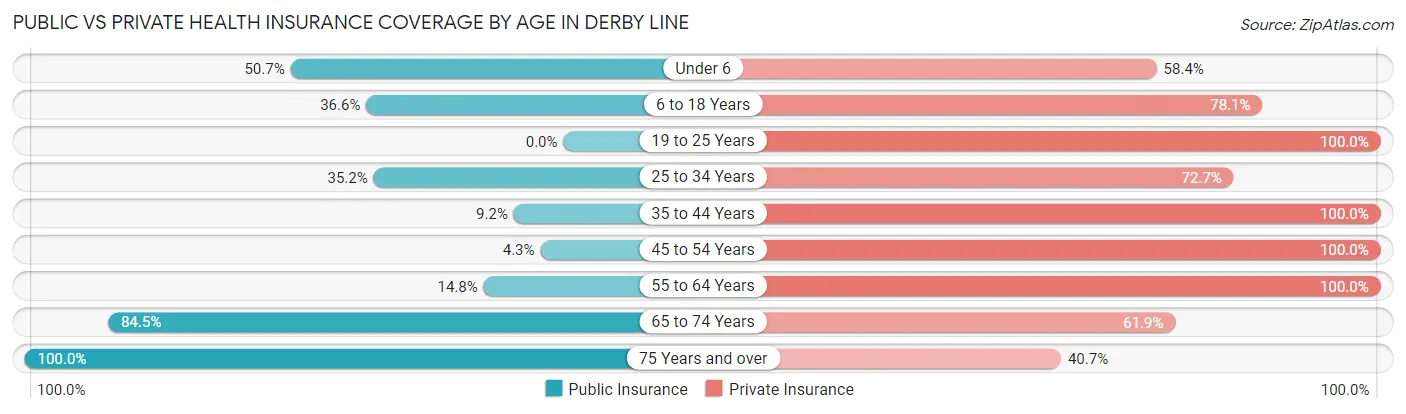
| Age Bracket | Public Insurance | Private Insurance |
| Under 6 | 39 (50.6%) | 45 (58.4%) |
| 6 to 18 Years | 45 (36.6%) | 96 (78.0%) |
| 19 to 25 Years | 0 (0.0%) | 25 (100.0%) |
| 25 to 34 Years | 31 (35.2%) | 64 (72.7%) |
| 35 to 44 Years | 7 (9.2%) | 76 (100.0%) |
| 45 to 54 Years | 2 (4.3%) | 47 (100.0%) |
| 55 to 64 Years | 8 (14.8%) | 54 (100.0%) |
| 65 to 74 Years | 71 (84.5%) | 52 (61.9%) |
| 75 Years and over | 118 (100.0%) | 48 (40.7%) |
| Total | 321 (46.4%) | 507 (73.3%) |
Disability Status by Sex by Age in Derby Line
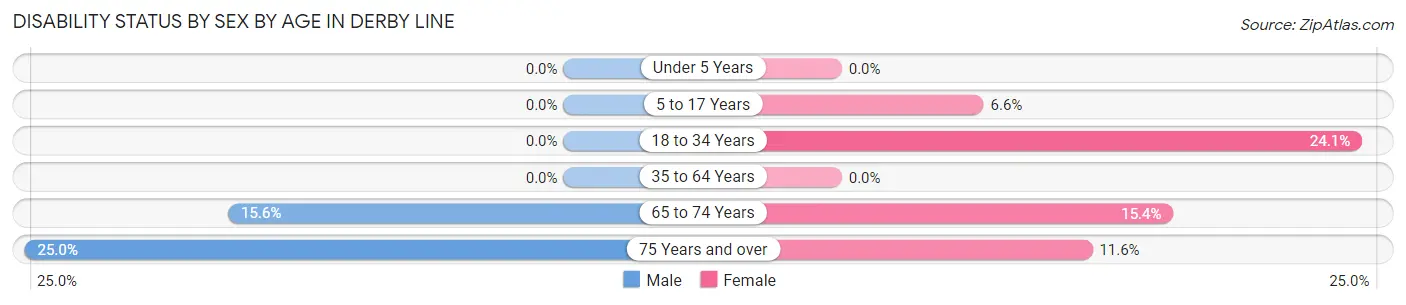
| Age Bracket | Male | Female |
| Under 5 Years | 0 (0.0%) | 0 (0.0%) |
| 5 to 17 Years | 0 (0.0%) | 5 (6.6%) |
| 18 to 34 Years | 0 (0.0%) | 14 (24.1%) |
| 35 to 64 Years | 0 (0.0%) | 0 (0.0%) |
| 65 to 74 Years | 7 (15.6%) | 6 (15.4%) |
| 75 Years and over | 8 (25.0%) | 10 (11.6%) |
Disability Class by Sex by Age in Derby Line
Disability Class: Hearing Difficulty
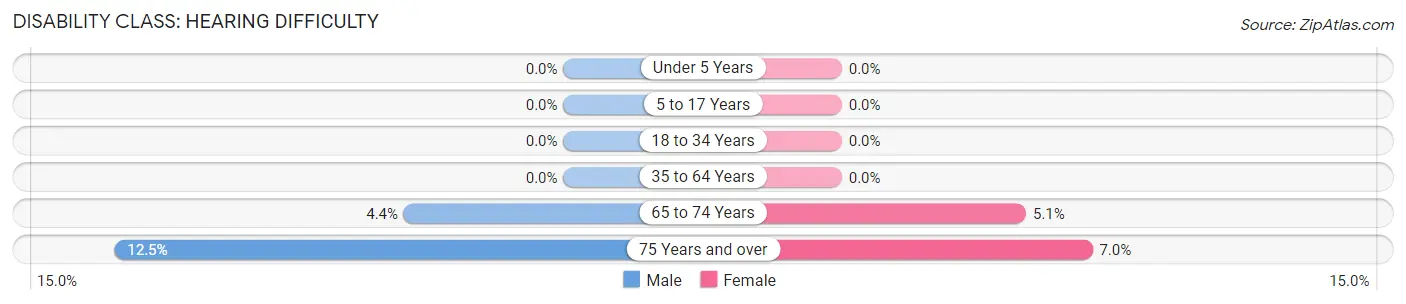
| Age Bracket | Male | Female |
| Under 5 Years | 0 (0.0%) | 0 (0.0%) |
| 5 to 17 Years | 0 (0.0%) | 0 (0.0%) |
| 18 to 34 Years | 0 (0.0%) | 0 (0.0%) |
| 35 to 64 Years | 0 (0.0%) | 0 (0.0%) |
| 65 to 74 Years | 2 (4.4%) | 2 (5.1%) |
| 75 Years and over | 4 (12.5%) | 6 (7.0%) |
Disability Class: Vision Difficulty
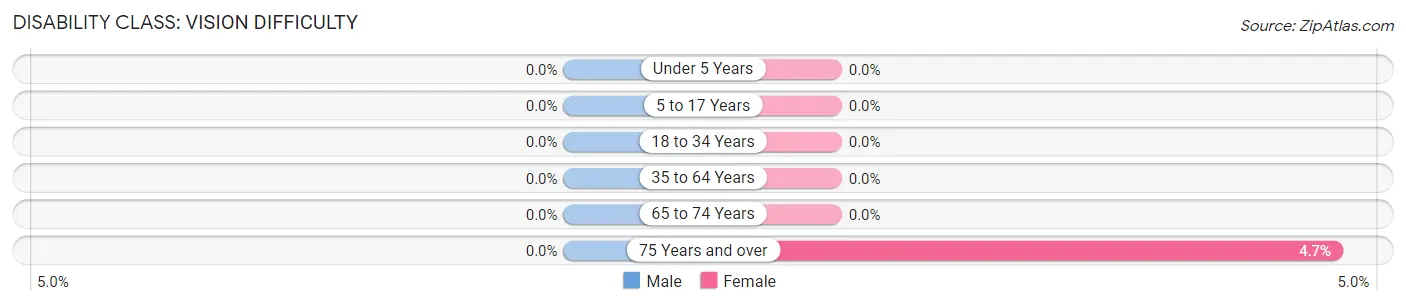
| Age Bracket | Male | Female |
| Under 5 Years | 0 (0.0%) | 0 (0.0%) |
| 5 to 17 Years | 0 (0.0%) | 0 (0.0%) |
| 18 to 34 Years | 0 (0.0%) | 0 (0.0%) |
| 35 to 64 Years | 0 (0.0%) | 0 (0.0%) |
| 65 to 74 Years | 0 (0.0%) | 0 (0.0%) |
| 75 Years and over | 0 (0.0%) | 4 (4.6%) |
Disability Class: Cognitive Difficulty
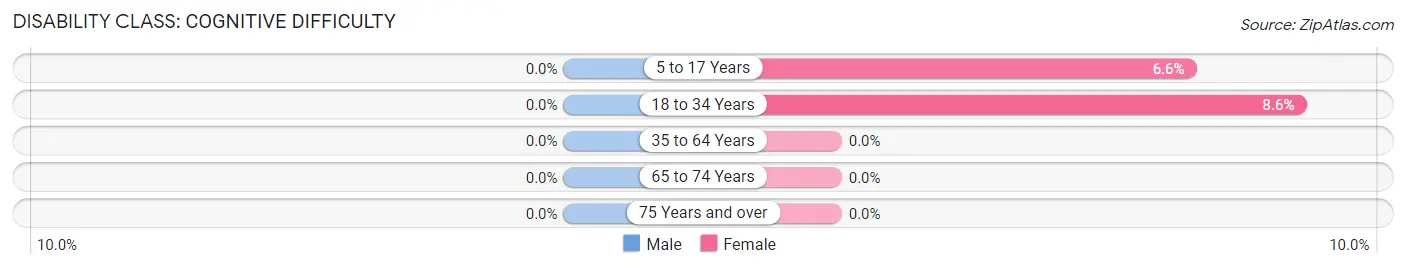
| Age Bracket | Male | Female |
| 5 to 17 Years | 0 (0.0%) | 5 (6.6%) |
| 18 to 34 Years | 0 (0.0%) | 5 (8.6%) |
| 35 to 64 Years | 0 (0.0%) | 0 (0.0%) |
| 65 to 74 Years | 0 (0.0%) | 0 (0.0%) |
| 75 Years and over | 0 (0.0%) | 0 (0.0%) |
Disability Class: Ambulatory Difficulty
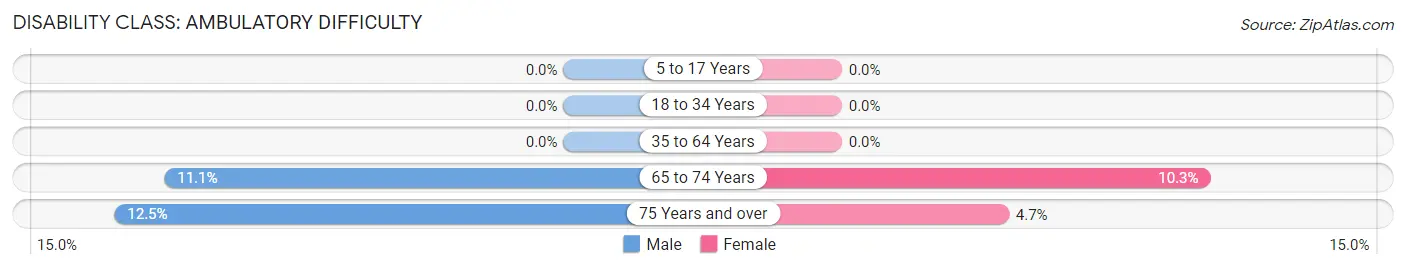
| Age Bracket | Male | Female |
| 5 to 17 Years | 0 (0.0%) | 0 (0.0%) |
| 18 to 34 Years | 0 (0.0%) | 0 (0.0%) |
| 35 to 64 Years | 0 (0.0%) | 0 (0.0%) |
| 65 to 74 Years | 5 (11.1%) | 4 (10.3%) |
| 75 Years and over | 4 (12.5%) | 4 (4.6%) |
Disability Class: Self-Care Difficulty
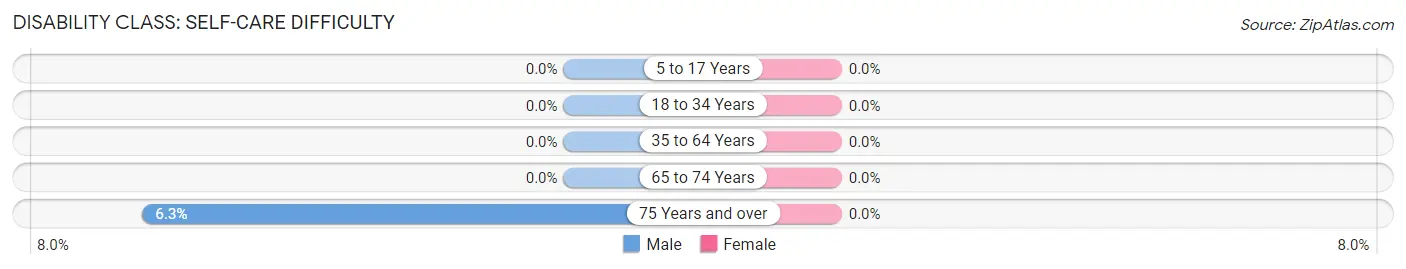
| Age Bracket | Male | Female |
| 5 to 17 Years | 0 (0.0%) | 0 (0.0%) |
| 18 to 34 Years | 0 (0.0%) | 0 (0.0%) |
| 35 to 64 Years | 0 (0.0%) | 0 (0.0%) |
| 65 to 74 Years | 0 (0.0%) | 0 (0.0%) |
| 75 Years and over | 2 (6.2%) | 0 (0.0%) |
Technology Access in Derby Line
Computing Device Access in Derby Line
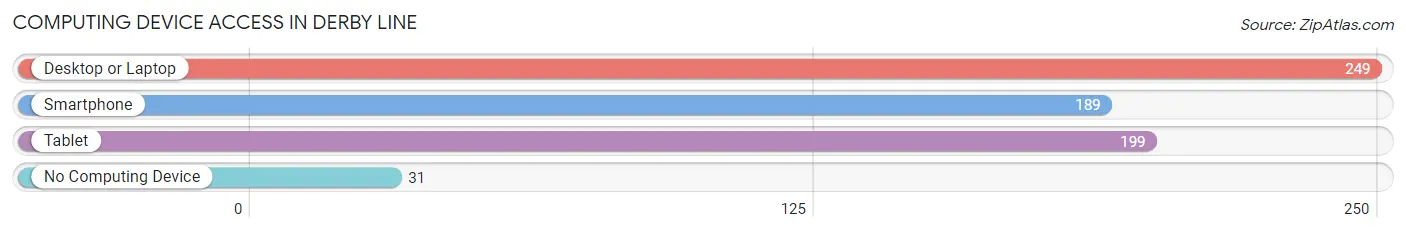
| Device Type | # Households | % Households |
| Desktop or Laptop | 249 | 79.0% |
| Smartphone | 189 | 60.0% |
| Tablet | 199 | 63.2% |
| No Computing Device | 31 | 9.8% |
| Total | 315 | 100.0% |
Internet Access in Derby Line
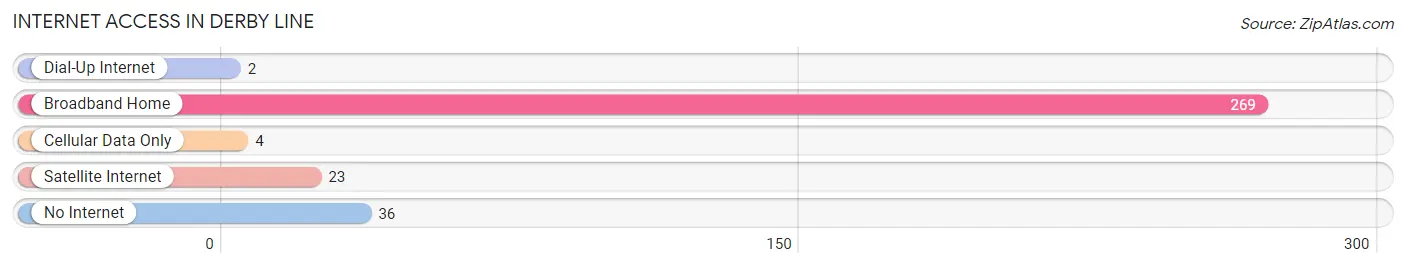
| Internet Type | # Households | % Households |
| Dial-Up Internet | 2 | 0.6% |
| Broadband Home | 269 | 85.4% |
| Cellular Data Only | 4 | 1.3% |
| Satellite Internet | 23 | 7.3% |
| No Internet | 36 | 11.4% |
| Total | 315 | 100.0% |
Derby Line Summary
Derby Line, Vermont is a small town located in the northeastern corner of the state, near the Canadian border. It is part of the larger town of Derby, which is located in Orleans County. The town has a population of 1,205 as of the 2010 census, and is home to the Haskell Free Library and Opera House, a unique building that straddles the international border between the United States and Canada.
Geography
Derby Line is located in the northeastern corner of Vermont, near the Canadian border. It is part of the larger town of Derby, which is located in Orleans County. The town is situated on the banks of the Trout River, which flows into Lake Memphremagog. The town is bordered by the towns of Stanstead, Quebec to the north, and Newport, Vermont to the south. The town is located approximately 25 miles from the city of Montpelier, the state capital.
The town has a total area of 4.2 square miles, all of which is land. The terrain is mostly flat, with some rolling hills. The climate is humid continental, with cold winters and warm summers.
History
Derby Line was first settled in 1798 by settlers from Massachusetts and Connecticut. The town was originally part of the town of Stanstead, Quebec, but was annexed by the United States in 1819. The town was named after the town of Derby, England.
The town was an important stop on the Underground Railroad, and was home to several abolitionists. The Haskell Free Library and Opera House was built in 1904, and straddles the international border between the United States and Canada. The building is unique in that it is the only library in the world that is located in two countries.
Economy
The economy of Derby Line is largely based on tourism. The town is home to the Haskell Free Library and Opera House, which attracts visitors from both the United States and Canada. The town is also home to several small businesses, including a grocery store, a hardware store, and a restaurant.
Demographics
As of the 2010 census, the population of Derby Line was 1,205. The racial makeup of the town was 97.3% White, 0.3% African American, 0.2% Native American, 0.3% Asian, 0.2% from other races, and 1.7% from two or more races. Hispanic or Latino of any race were 0.7% of the population.
The median household income in the town was $41,250, and the median family income was $48,750. The per capita income for the town was $20,945. About 8.3% of families and 10.3% of the population were below the poverty line, including 14.3% of those under age 18 and 5.3% of those age 65 or over.
Common Questions
What is Per Capita Income in Derby Line?
Per Capita income in Derby Line is $31,492.
What is the Median Family Income in Derby Line?
Median Family Income in Derby Line is $82,639.
What is the Median Household income in Derby Line?
Median Household Income in Derby Line is $64,018.
What is Income or Wage Gap in Derby Line?
Income or Wage Gap in Derby Line is 23.2%.
Women in Derby Line earn 76.8 cents for every dollar earned by a man.
What is Inequality or Gini Index in Derby Line?
Inequality or Gini Index in Derby Line is 0.38.
What is the Total Population of Derby Line?
Total Population of Derby Line is 692.
What is the Total Male Population of Derby Line?
Total Male Population of Derby Line is 298.
What is the Total Female Population of Derby Line?
Total Female Population of Derby Line is 394.
What is the Ratio of Males per 100 Females in Derby Line?
There are 75.63 Males per 100 Females in Derby Line.
What is the Ratio of Females per 100 Males in Derby Line?
There are 132.21 Females per 100 Males in Derby Line.
What is the Median Population Age in Derby Line?
Median Population Age in Derby Line is 38.3 Years.
What is the Average Family Size in Derby Line
Average Family Size in Derby Line is 2.9 People.
What is the Average Household Size in Derby Line
Average Household Size in Derby Line is 2.2 People.
How Large is the Labor Force in Derby Line?
There are 300 People in the Labor Forcein in Derby Line.
What is the Percentage of People in the Labor Force in Derby Line?
57.5% of People are in the Labor Force in Derby Line.
What is the Unemployment Rate in Derby Line?
Unemployment Rate in Derby Line is 3.0%.