Richford, VT Map & Demographics
Richford Map
Richford Overview
$22,846
PER CAPITA INCOME
$61,094
AVG FAMILY INCOME
$52,679
AVG HOUSEHOLD INCOME
23.4%
WAGE / INCOME GAP [ % ]
76.6¢/ $1
WAGE / INCOME GAP [ $ ]
$11,069
FAMILY INCOME DEFICIT
0.37
INEQUALITY / GINI INDEX
1,636
TOTAL POPULATION
901
MALE POPULATION
735
FEMALE POPULATION
122.59
MALES / 100 FEMALES
81.58
FEMALES / 100 MALES
39.2
MEDIAN AGE
3.2
AVG FAMILY SIZE
2.6
AVG HOUSEHOLD SIZE
653
LABOR FORCE [ PEOPLE ]
49.9%
PERCENT IN LABOR FORCE
8.0%
UNEMPLOYMENT RATE
Richford Zip Codes
Richford Area Codes
Income in Richford
Income Overview in Richford
Per Capita Income in Richford is $22,846, while median incomes of families and households are $61,094 and $52,679 respectively.
| Characteristic | Number | Measure |
| Per Capita Income | 1,636 | $22,846 |
| Median Family Income | 381 | $61,094 |
| Mean Family Income | 381 | $64,335 |
| Median Household Income | 615 | $52,679 |
| Mean Household Income | 615 | $56,555 |
| Income Deficit | 381 | $11,069 |
| Wage / Income Gap (%) | 1,636 | 23.43% |
| Wage / Income Gap ($) | 1,636 | 76.57¢ per $1 |
| Gini / Inequality Index | 1,636 | 0.37 |
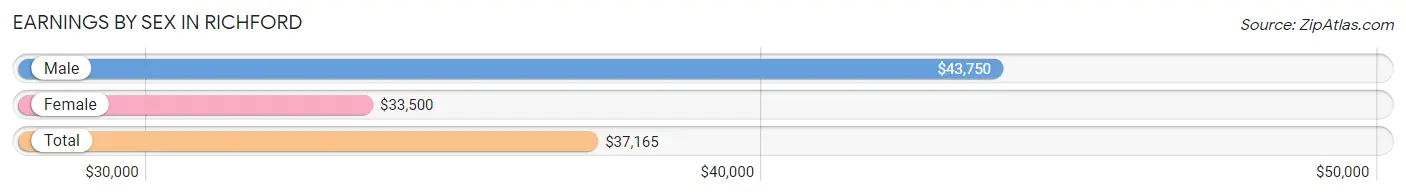
Earnings by Sex in Richford
Average Earnings in Richford are $37,165, $43,750 for men and $33,500 for women, a difference of 23.4%.
| Sex | Number | Average Earnings |
| Male | 404 (58.9%) | $43,750 |
| Female | 282 (41.1%) | $33,500 |
| Total | 686 (100.0%) | $37,165 |
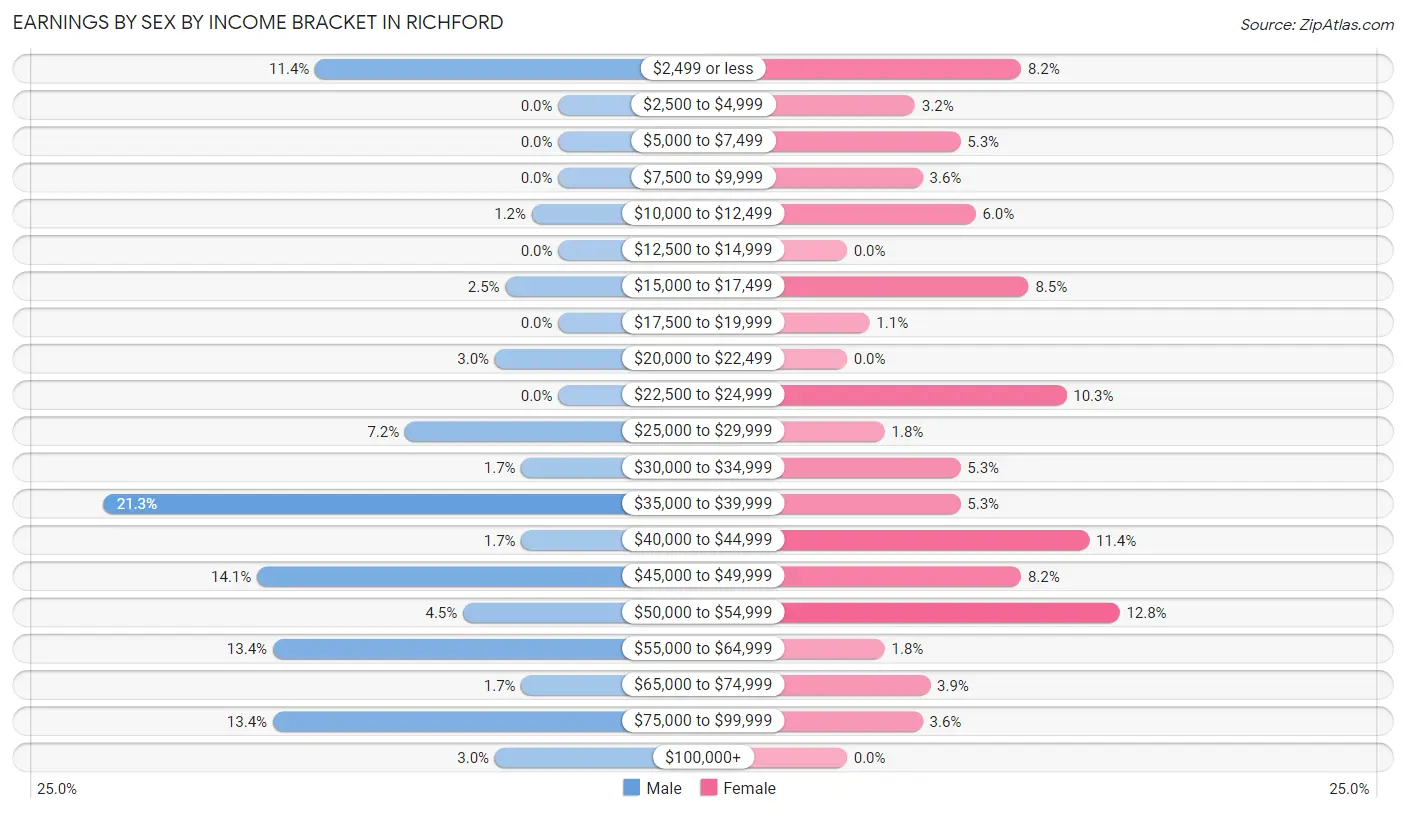
Earnings by Sex by Income Bracket in Richford
The most common earnings brackets in Richford are $35,000 to $39,999 for men (86 | 21.3%) and $50,000 to $54,999 for women (36 | 12.8%).
| Income | Male | Female |
| $2,499 or less | 46 (11.4%) | 23 (8.2%) |
| $2,500 to $4,999 | 0 (0.0%) | 9 (3.2%) |
| $5,000 to $7,499 | 0 (0.0%) | 15 (5.3%) |
| $7,500 to $9,999 | 0 (0.0%) | 10 (3.5%) |
| $10,000 to $12,499 | 5 (1.2%) | 17 (6.0%) |
| $12,500 to $14,999 | 0 (0.0%) | 0 (0.0%) |
| $15,000 to $17,499 | 10 (2.5%) | 24 (8.5%) |
| $17,500 to $19,999 | 0 (0.0%) | 3 (1.1%) |
| $20,000 to $22,499 | 12 (3.0%) | 0 (0.0%) |
| $22,500 to $24,999 | 0 (0.0%) | 29 (10.3%) |
| $25,000 to $29,999 | 29 (7.2%) | 5 (1.8%) |
| $30,000 to $34,999 | 7 (1.7%) | 15 (5.3%) |
| $35,000 to $39,999 | 86 (21.3%) | 15 (5.3%) |
| $40,000 to $44,999 | 7 (1.7%) | 32 (11.4%) |
| $45,000 to $49,999 | 57 (14.1%) | 23 (8.2%) |
| $50,000 to $54,999 | 18 (4.5%) | 36 (12.8%) |
| $55,000 to $64,999 | 54 (13.4%) | 5 (1.8%) |
| $65,000 to $74,999 | 7 (1.7%) | 11 (3.9%) |
| $75,000 to $99,999 | 54 (13.4%) | 10 (3.5%) |
| $100,000+ | 12 (3.0%) | 0 (0.0%) |
| Total | 404 (100.0%) | 282 (100.0%) |
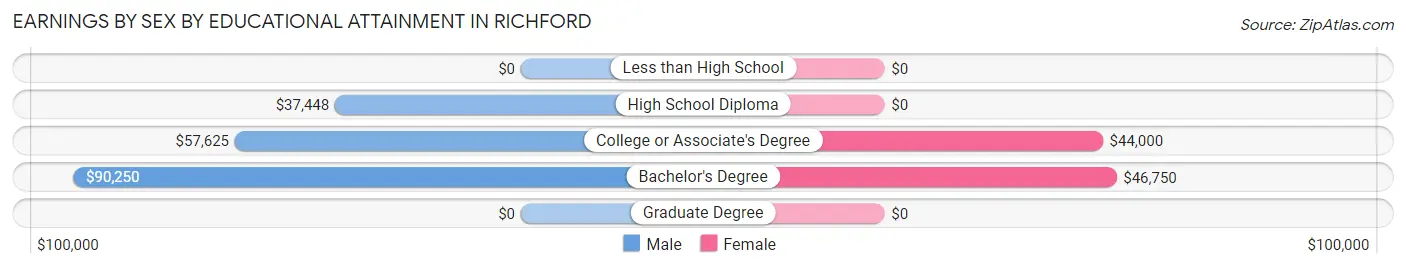
Earnings by Sex by Educational Attainment in Richford
Average earnings in Richford are $45,924 for men and $40,956 for women, a difference of 10.8%. Men with an educational attainment of bachelor's degree enjoy the highest average annual earnings of $90,250, while those with high school diploma education earn the least with $37,448. Women with an educational attainment of bachelor's degree earn the most with the average annual earnings of $46,750, while those with college or associate's degree education have the smallest earnings of $44,000.
| Educational Attainment | Male Income | Female Income |
| Less than High School | - | - |
| High School Diploma | $37,448 | $0 |
| College or Associate's Degree | $57,625 | $44,000 |
| Bachelor's Degree | $90,250 | $46,750 |
| Graduate Degree | - | - |
| Total | $45,924 | $40,956 |
Family Income in Richford
Family Income Brackets in Richford
According to the Richford family income data, there are 95 families falling into the $50,000 to $74,999 income range, which is the most common income bracket and makes up 24.9% of all families.
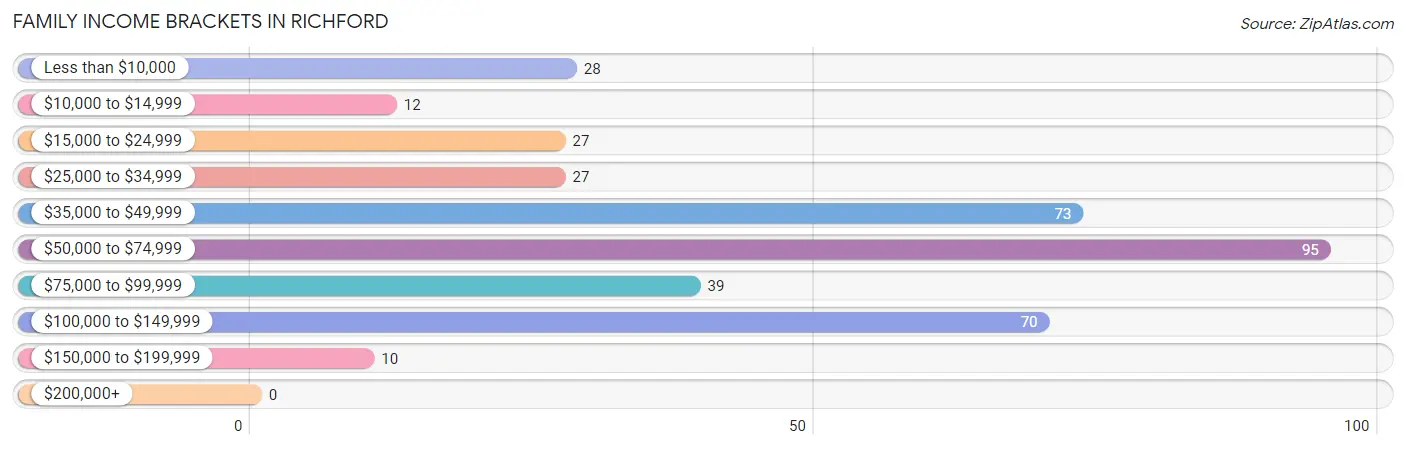
| Income Bracket | # Families | % Families |
| Less than $10,000 | 28 | 7.3% |
| $10,000 to $14,999 | 12 | 3.1% |
| $15,000 to $24,999 | 27 | 7.1% |
| $25,000 to $34,999 | 27 | 7.1% |
| $35,000 to $49,999 | 73 | 19.2% |
| $50,000 to $74,999 | 95 | 24.9% |
| $75,000 to $99,999 | 39 | 10.2% |
| $100,000 to $149,999 | 70 | 18.4% |
| $150,000 to $199,999 | 10 | 2.6% |
| $200,000+ | 0 | 0.0% |
Family Income by Famaliy Size in Richford
3-person families (59 | 15.5%) account for the highest median family income in Richford with $68,648 per family, while 3-person families (59 | 15.5%) have the highest median income of $22,883 per family member.
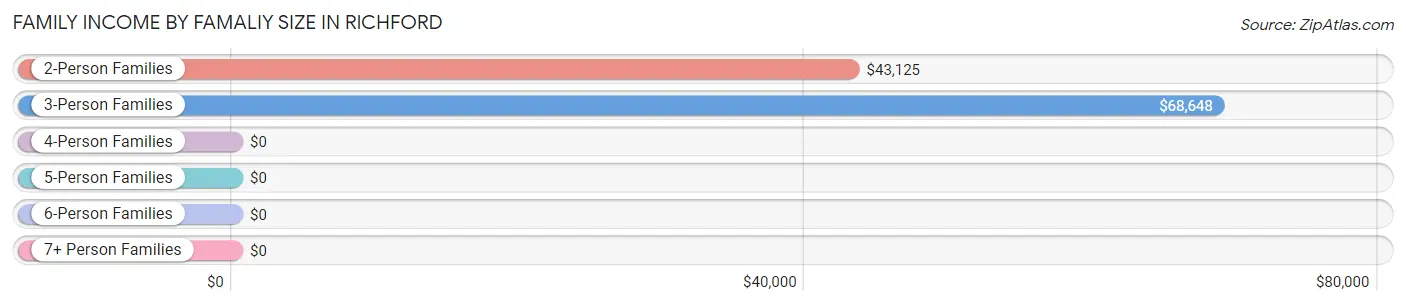
| Income Bracket | # Families | Median Income |
| 2-Person Families | 197 (51.7%) | $43,125 |
| 3-Person Families | 59 (15.5%) | $68,648 |
| 4-Person Families | 66 (17.3%) | $0 |
| 5-Person Families | 55 (14.4%) | $0 |
| 6-Person Families | 0 (0.0%) | $0 |
| 7+ Person Families | 4 (1.1%) | $0 |
| Total | 381 (100.0%) | $61,094 |
Family Income by Number of Earners in Richford
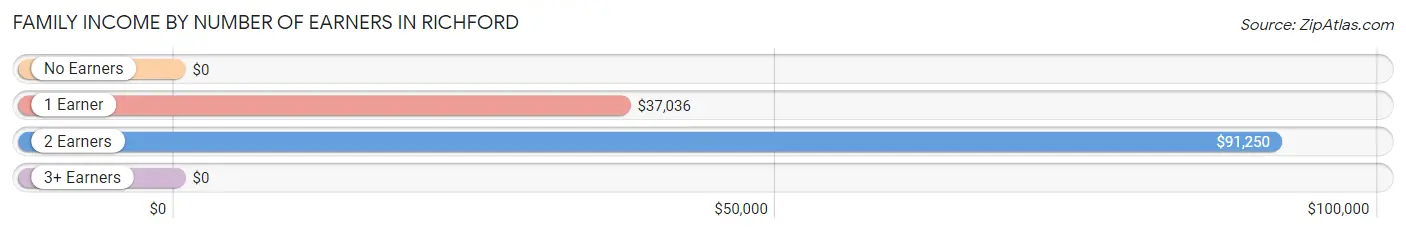
| Number of Earners | # Families | Median Income |
| No Earners | 62 (16.3%) | $0 |
| 1 Earner | 157 (41.2%) | $37,036 |
| 2 Earners | 157 (41.2%) | $91,250 |
| 3+ Earners | 5 (1.3%) | $0 |
| Total | 381 (100.0%) | $61,094 |
Household Income in Richford
Household Income Brackets in Richford
With 165 households falling in the category, the $50,000 to $74,999 income range is the most frequent in Richford, accounting for 26.8% of all households.
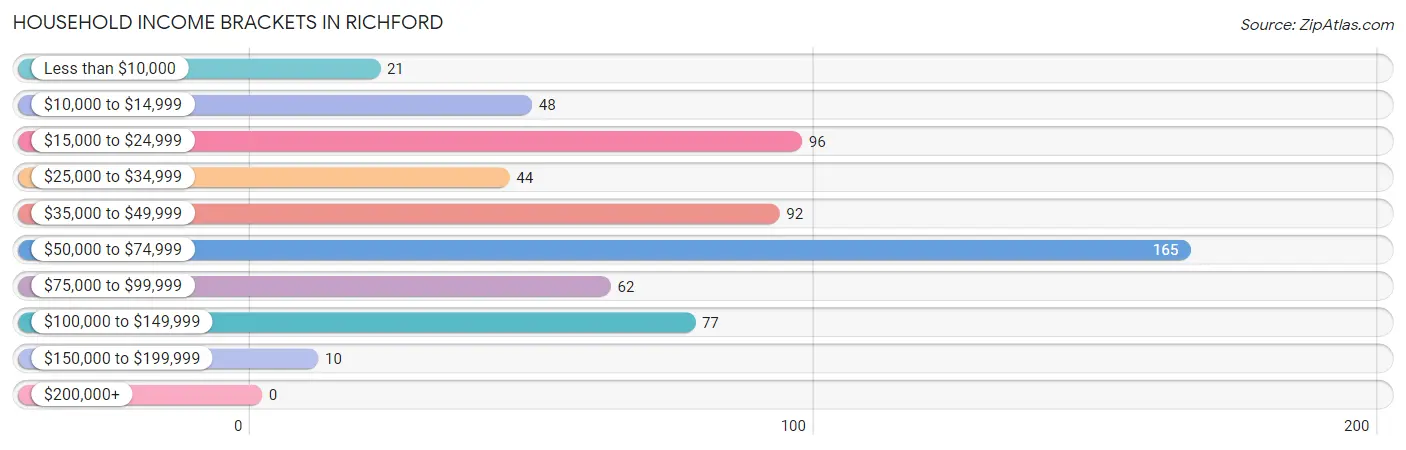
| Income Bracket | # Households | % Households |
| Less than $10,000 | 21 | 3.4% |
| $10,000 to $14,999 | 48 | 7.8% |
| $15,000 to $24,999 | 96 | 15.6% |
| $25,000 to $34,999 | 44 | 7.2% |
| $35,000 to $49,999 | 92 | 15.0% |
| $50,000 to $74,999 | 165 | 26.8% |
| $75,000 to $99,999 | 62 | 10.1% |
| $100,000 to $149,999 | 77 | 12.5% |
| $150,000 to $199,999 | 10 | 1.6% |
| $200,000+ | 0 | 0.0% |
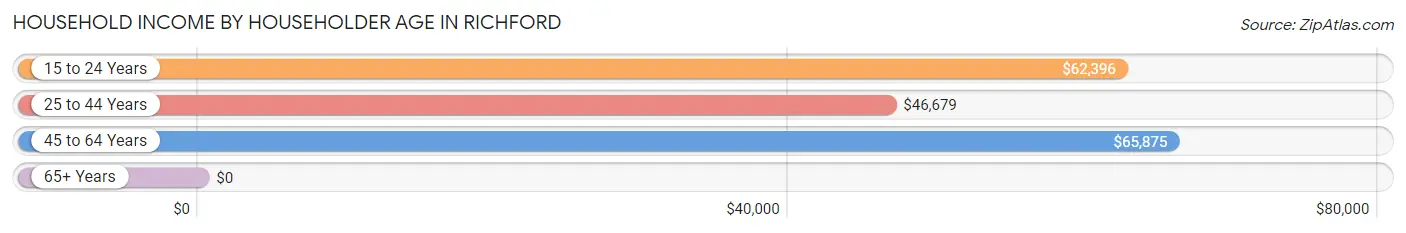
Household Income by Householder Age in Richford
The median household income in Richford is $52,679, with the highest median household income of $65,875 found in the 45 to 64 years age bracket for the primary householder. A total of 221 households (35.9%) fall into this category. Meanwhile, the 65+ years age bracket for the primary householder has the lowest median household income of $0, with 160 households (26.0%) in this group.
| Income Bracket | # Households | Median Income |
| 15 to 24 Years | 59 (9.6%) | $62,396 |
| 25 to 44 Years | 175 (28.5%) | $46,679 |
| 45 to 64 Years | 221 (35.9%) | $65,875 |
| 65+ Years | 160 (26.0%) | $0 |
| Total | 615 (100.0%) | $52,679 |
Poverty in Richford
Income Below Poverty by Sex and Age in Richford
With 22.0% poverty level for males and 23.9% for females among the residents of Richford, 75 year old and over males and 6 to 11 year old females are the most vulnerable to poverty, with 9 males (52.9%) and 22 females (45.8%) in their respective age groups living below the poverty level.
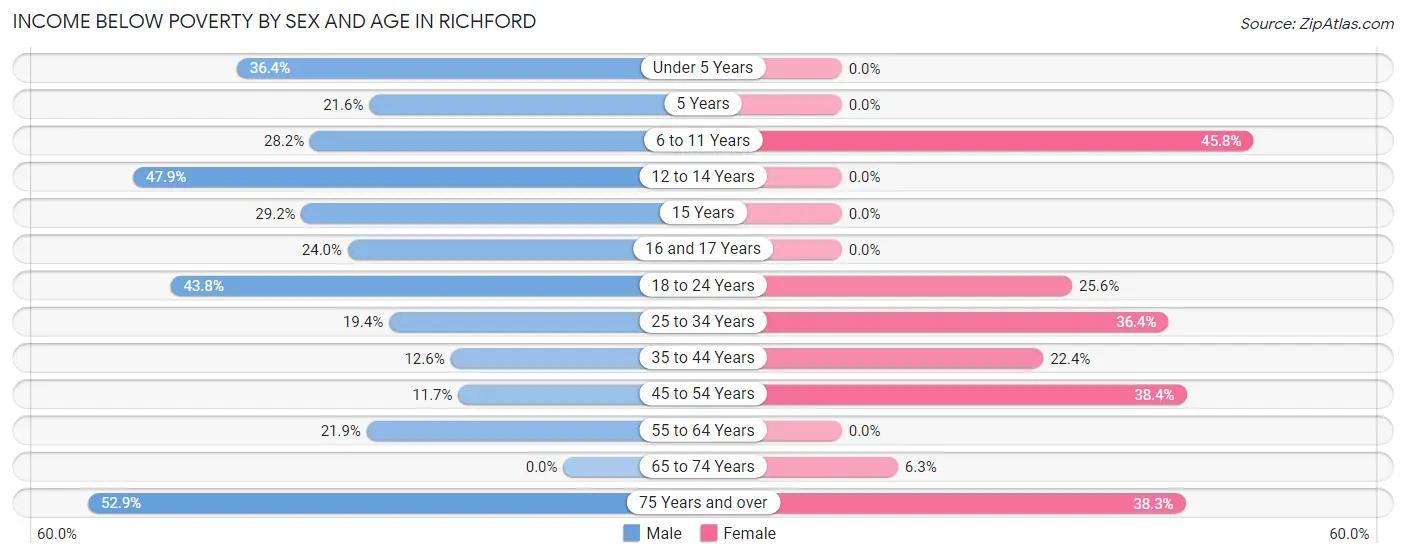
| Age Bracket | Male | Female |
| Under 5 Years | 24 (36.4%) | 0 (0.0%) |
| 5 Years | 8 (21.6%) | 0 (0.0%) |
| 6 to 11 Years | 22 (28.2%) | 22 (45.8%) |
| 12 to 14 Years | 23 (47.9%) | 0 (0.0%) |
| 15 Years | 7 (29.2%) | 0 (0.0%) |
| 16 and 17 Years | 18 (24.0%) | 0 (0.0%) |
| 18 to 24 Years | 14 (43.8%) | 30 (25.6%) |
| 25 to 34 Years | 20 (19.4%) | 24 (36.4%) |
| 35 to 44 Years | 21 (12.6%) | 24 (22.4%) |
| 45 to 54 Years | 9 (11.7%) | 38 (38.4%) |
| 55 to 64 Years | 23 (21.9%) | 0 (0.0%) |
| 65 to 74 Years | 0 (0.0%) | 5 (6.2%) |
| 75 Years and over | 9 (52.9%) | 31 (38.3%) |
| Total | 198 (22.0%) | 174 (23.9%) |
Income Above Poverty by Sex and Age in Richford
According to the poverty statistics in Richford, males aged 65 to 74 years and females aged 12 to 14 years are the age groups that are most secure financially, with 100.0% of males and 100.0% of females in these age groups living above the poverty line.
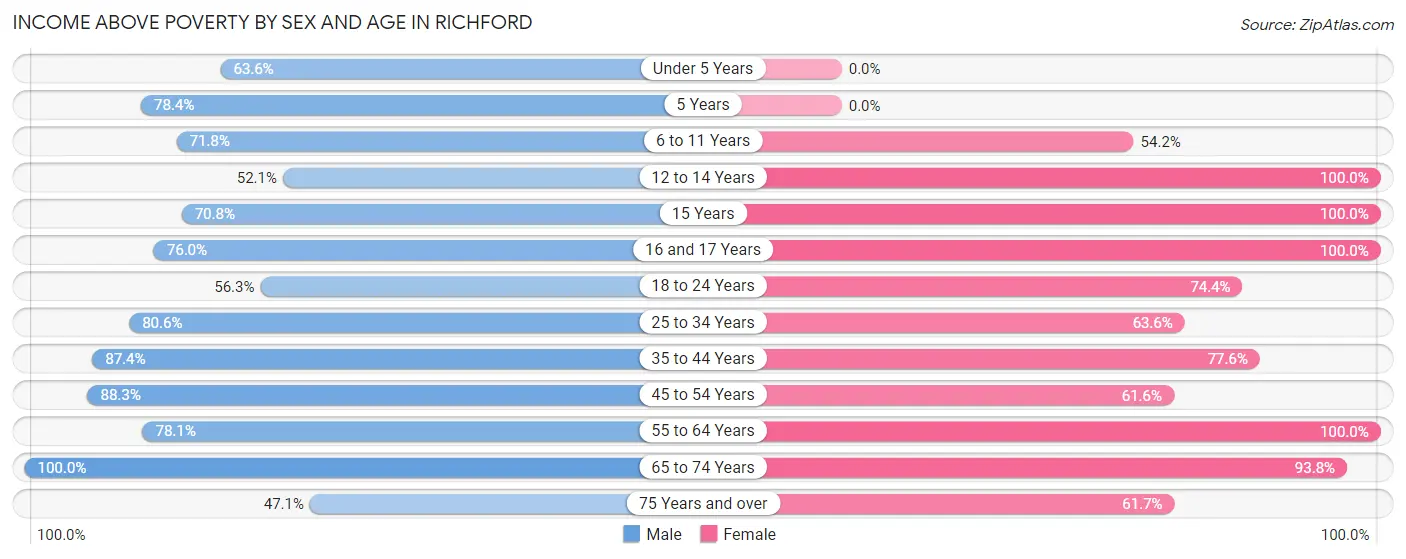
| Age Bracket | Male | Female |
| Under 5 Years | 42 (63.6%) | 0 (0.0%) |
| 5 Years | 29 (78.4%) | 0 (0.0%) |
| 6 to 11 Years | 56 (71.8%) | 26 (54.2%) |
| 12 to 14 Years | 25 (52.1%) | 17 (100.0%) |
| 15 Years | 17 (70.8%) | 10 (100.0%) |
| 16 and 17 Years | 57 (76.0%) | 11 (100.0%) |
| 18 to 24 Years | 18 (56.2%) | 87 (74.4%) |
| 25 to 34 Years | 83 (80.6%) | 42 (63.6%) |
| 35 to 44 Years | 146 (87.4%) | 83 (77.6%) |
| 45 to 54 Years | 68 (88.3%) | 61 (61.6%) |
| 55 to 64 Years | 82 (78.1%) | 92 (100.0%) |
| 65 to 74 Years | 72 (100.0%) | 75 (93.8%) |
| 75 Years and over | 8 (47.1%) | 50 (61.7%) |
| Total | 703 (78.0%) | 554 (76.1%) |
Income Below Poverty Among Married-Couple Families in Richford
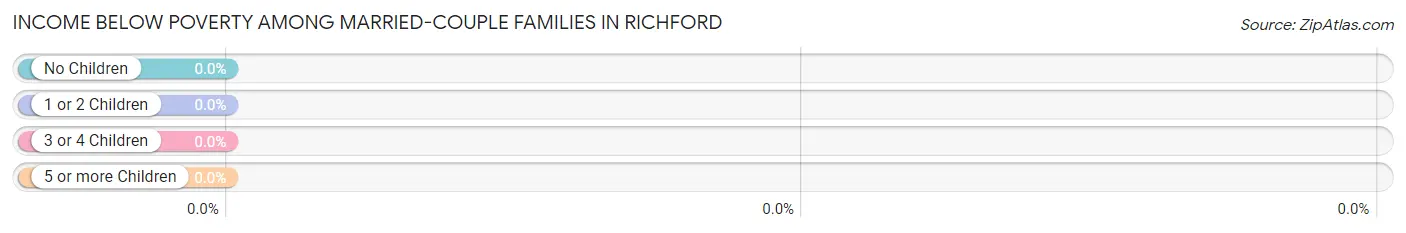
| Children | Above Poverty | Below Poverty |
| No Children | 130 (100.0%) | 0 (0.0%) |
| 1 or 2 Children | 107 (100.0%) | 0 (0.0%) |
| 3 or 4 Children | 22 (100.0%) | 0 (0.0%) |
| 5 or more Children | 0 (0.0%) | 0 (0.0%) |
| Total | 259 (100.0%) | 0 (0.0%) |
Income Below Poverty Among Single-Parent Households in Richford
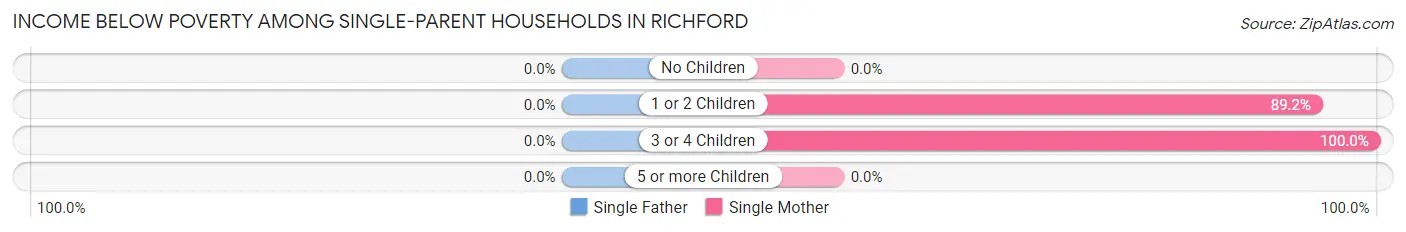
| Children | Single Father | Single Mother |
| No Children | 0 (0.0%) | 0 (0.0%) |
| 1 or 2 Children | 0 (0.0%) | 58 (89.2%) |
| 3 or 4 Children | 0 (0.0%) | 17 (100.0%) |
| 5 or more Children | 0 (0.0%) | 0 (0.0%) |
| Total | 0 (0.0%) | 75 (78.9%) |
Income Below Poverty Among Married-Couple vs Single-Parent Households in Richford
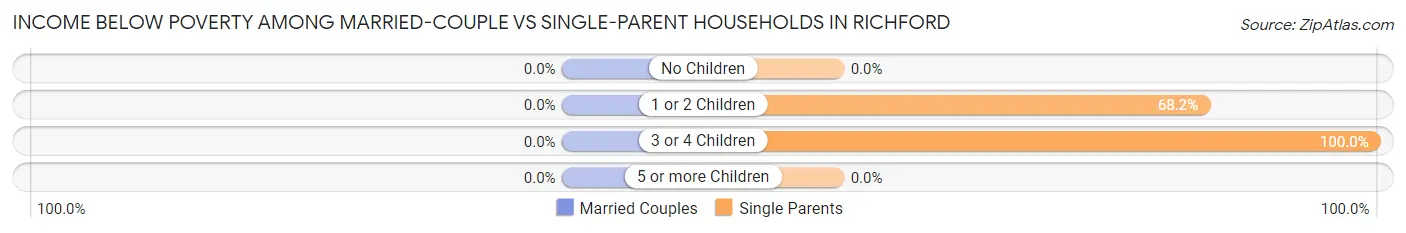
| Children | Married-Couple Families | Single-Parent Households |
| No Children | 0 (0.0%) | 0 (0.0%) |
| 1 or 2 Children | 0 (0.0%) | 58 (68.2%) |
| 3 or 4 Children | 0 (0.0%) | 17 (100.0%) |
| 5 or more Children | 0 (0.0%) | 0 (0.0%) |
| Total | 0 (0.0%) | 75 (61.5%) |
Race in Richford
The most populous races in Richford are White / Caucasian (1,503 | 91.9%), Two or more Races (98 | 6.0%), and Hispanic or Latino (93 | 5.7%).
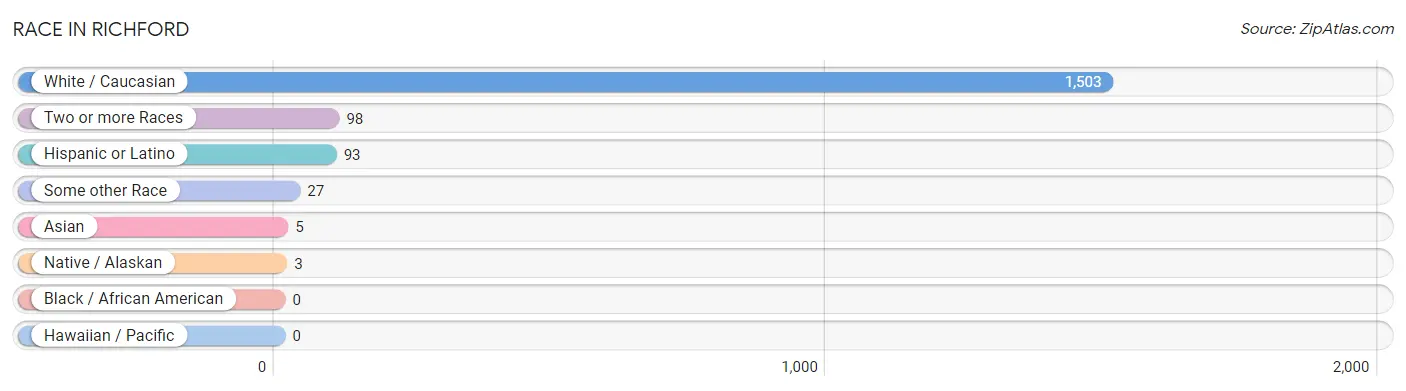
| Race | # Population | % Population |
| Asian | 5 | 0.3% |
| Black / African American | 0 | 0.0% |
| Hawaiian / Pacific | 0 | 0.0% |
| Hispanic or Latino | 93 | 5.7% |
| Native / Alaskan | 3 | 0.2% |
| White / Caucasian | 1,503 | 91.9% |
| Two or more Races | 98 | 6.0% |
| Some other Race | 27 | 1.7% |
| Total | 1,636 | 100.0% |
Ancestry in Richford
The most populous ancestries reported in Richford are American (440 | 26.9%), French (304 | 18.6%), Irish (143 | 8.7%), French Canadian (131 | 8.0%), and English (124 | 7.6%), together accounting for 69.8% of all Richford residents.
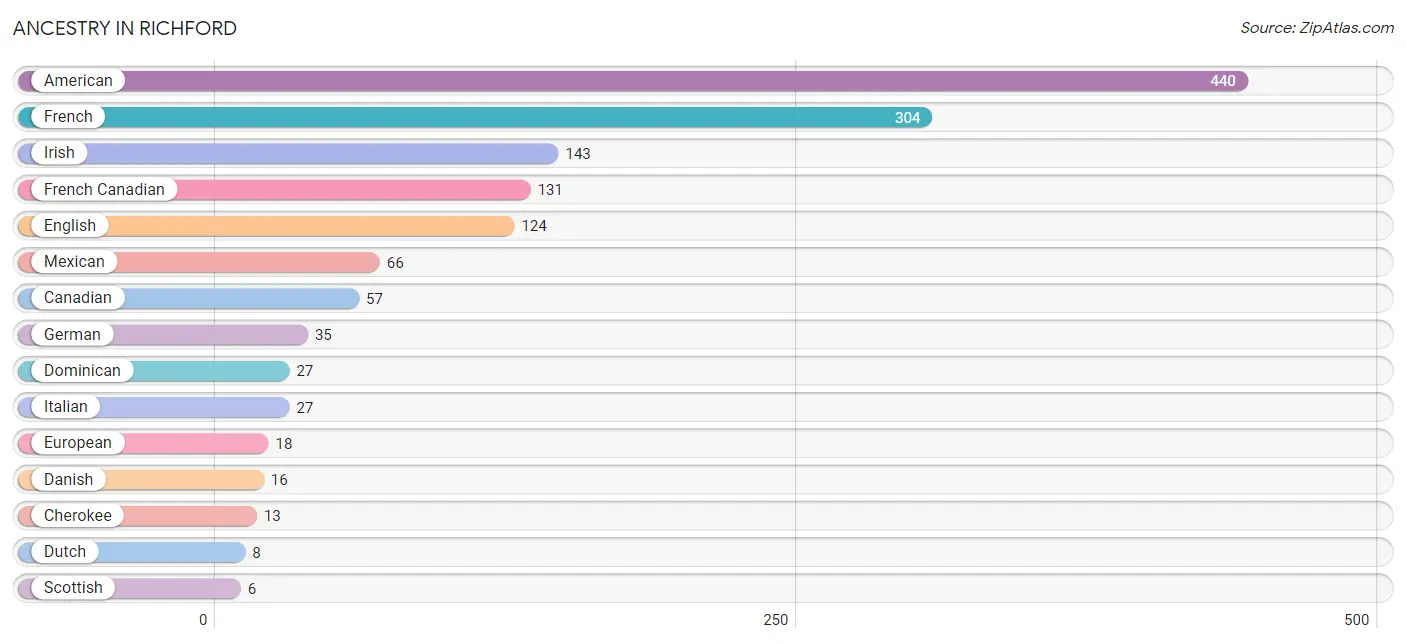
| Ancestry | # Population | % Population |
| American | 440 | 26.9% |
| Canadian | 57 | 3.5% |
| Cherokee | 13 | 0.8% |
| Danish | 16 | 1.0% |
| Dominican | 27 | 1.7% |
| Dutch | 8 | 0.5% |
| English | 124 | 7.6% |
| European | 18 | 1.1% |
| French | 304 | 18.6% |
| French Canadian | 131 | 8.0% |
| German | 35 | 2.1% |
| Irish | 143 | 8.7% |
| Italian | 27 | 1.7% |
| Mexican | 66 | 4.0% |
| Potawatomi | 3 | 0.2% |
| Scotch-Irish | 2 | 0.1% |
| Scottish | 6 | 0.4% |
| Thai | 5 | 0.3% | View All 18 Rows |
Immigrants in Richford
The most numerous immigrant groups reported in Richford came from Canada (20 | 1.2%), Asia (5 | 0.3%), India (5 | 0.3%), and South Central Asia (5 | 0.3%), together accounting for 2.1% of all Richford residents.
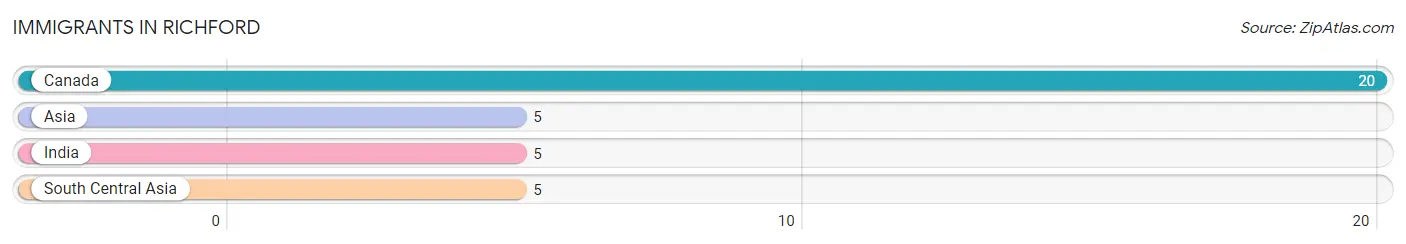
| Immigration Origin | # Population | % Population |
| Asia | 5 | 0.3% |
| Canada | 20 | 1.2% |
| India | 5 | 0.3% |
| South Central Asia | 5 | 0.3% | View All 4 Rows |
Sex and Age in Richford
Sex and Age in Richford
The most populous age groups in Richford are 5 to 9 Years (108 | 12.0%) for men and 45 to 49 Years (79 | 10.7%) for women.
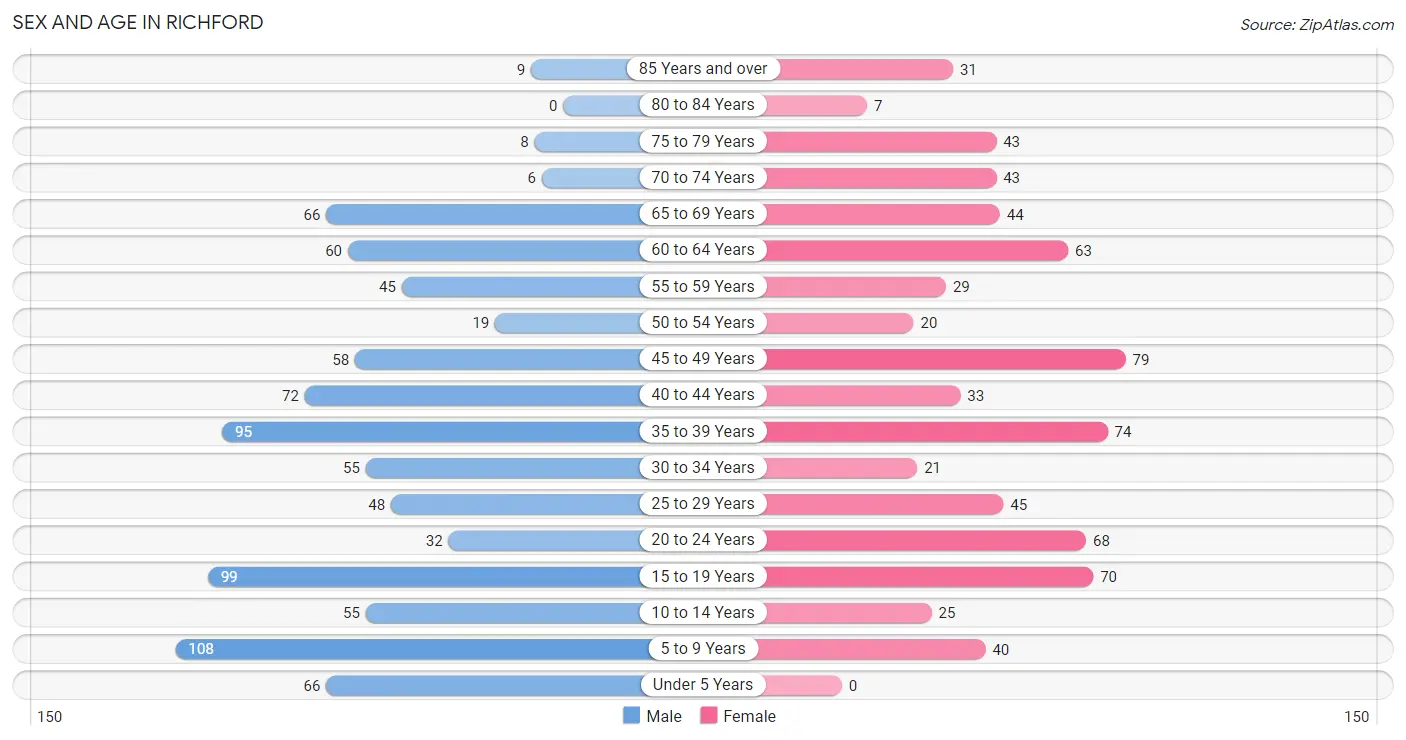
| Age Bracket | Male | Female |
| Under 5 Years | 66 (7.3%) | 0 (0.0%) |
| 5 to 9 Years | 108 (12.0%) | 40 (5.4%) |
| 10 to 14 Years | 55 (6.1%) | 25 (3.4%) |
| 15 to 19 Years | 99 (11.0%) | 70 (9.5%) |
| 20 to 24 Years | 32 (3.5%) | 68 (9.2%) |
| 25 to 29 Years | 48 (5.3%) | 45 (6.1%) |
| 30 to 34 Years | 55 (6.1%) | 21 (2.9%) |
| 35 to 39 Years | 95 (10.5%) | 74 (10.1%) |
| 40 to 44 Years | 72 (8.0%) | 33 (4.5%) |
| 45 to 49 Years | 58 (6.4%) | 79 (10.7%) |
| 50 to 54 Years | 19 (2.1%) | 20 (2.7%) |
| 55 to 59 Years | 45 (5.0%) | 29 (4.0%) |
| 60 to 64 Years | 60 (6.7%) | 63 (8.6%) |
| 65 to 69 Years | 66 (7.3%) | 44 (6.0%) |
| 70 to 74 Years | 6 (0.7%) | 43 (5.9%) |
| 75 to 79 Years | 8 (0.9%) | 43 (5.9%) |
| 80 to 84 Years | 0 (0.0%) | 7 (0.9%) |
| 85 Years and over | 9 (1.0%) | 31 (4.2%) |
| Total | 901 (100.0%) | 735 (100.0%) |
Families and Households in Richford
Median Family Size in Richford
The median family size in Richford is 3.23 persons per family, with married-couple families (259 | 68.0%) accounting for the largest median family size of 3.42 persons per family. On the other hand, single male/father families (27 | 7.1%) represent the smallest median family size with 2.59 persons per family.
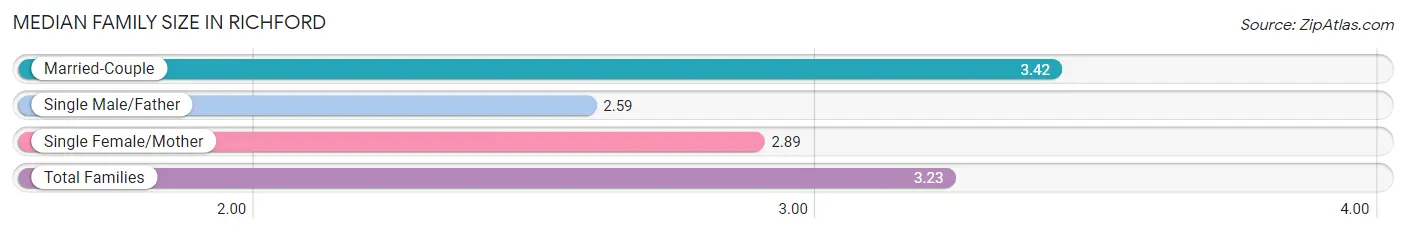
| Family Type | # Families | Family Size |
| Married-Couple | 259 (68.0%) | 3.42 |
| Single Male/Father | 27 (7.1%) | 2.59 |
| Single Female/Mother | 95 (24.9%) | 2.89 |
| Total Families | 381 (100.0%) | 3.23 |
Median Household Size in Richford
The median household size in Richford is 2.62 persons per household, with married-couple households (259 | 42.1%) accounting for the largest median household size of 3.59 persons per household. non-family households (234 | 38.1%) represent the smallest median household size with 1.16 persons per household.
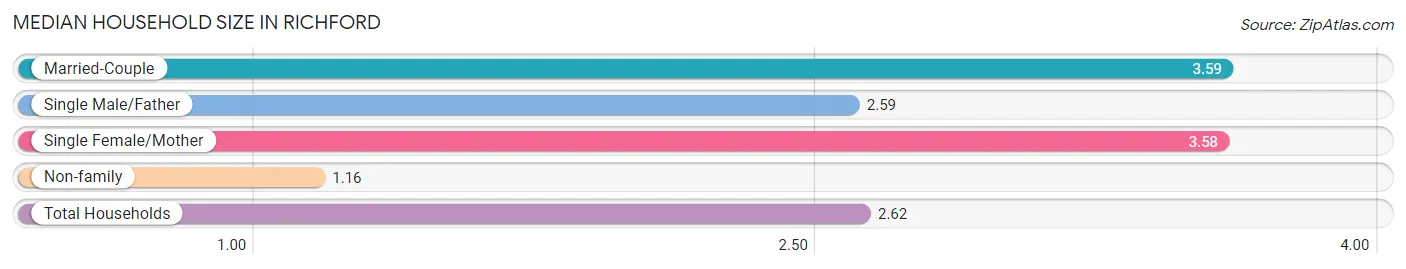
| Household Type | # Households | Household Size |
| Married-Couple | 259 (42.1%) | 3.59 |
| Single Male/Father | 27 (4.4%) | 2.59 |
| Single Female/Mother | 95 (15.4%) | 3.58 |
| Non-family | 234 (38.1%) | 1.16 |
| Total Households | 615 (100.0%) | 2.62 |
Household Size by Marriage Status in Richford
Out of a total of 615 households in Richford, 381 (62.0%) are family households, while 234 (38.1%) are nonfamily households. The most numerous type of family households are 3-person households, comprising 127, and the most common type of nonfamily households are 1-person households, comprising 209.
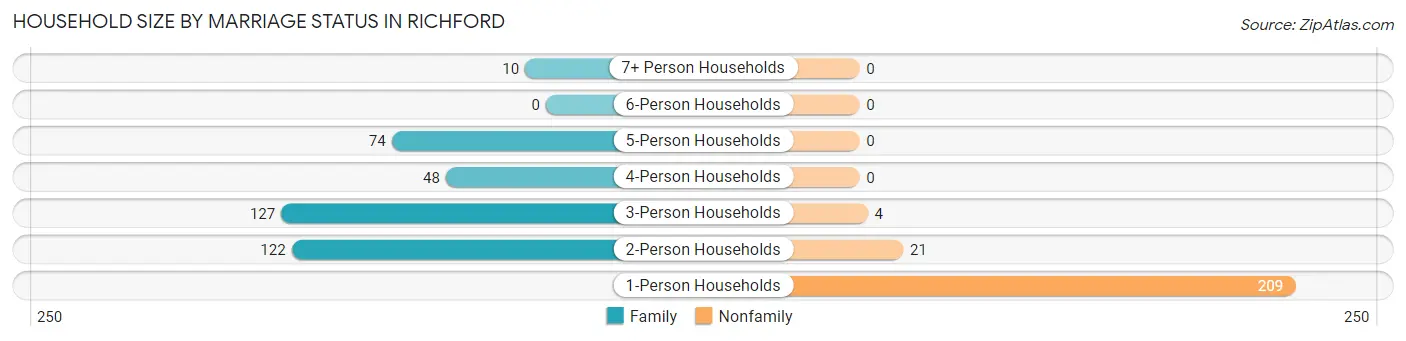
| Household Size | Family Households | Nonfamily Households |
| 1-Person Households | - | 209 (34.0%) |
| 2-Person Households | 122 (19.8%) | 21 (3.4%) |
| 3-Person Households | 127 (20.6%) | 4 (0.6%) |
| 4-Person Households | 48 (7.8%) | 0 (0.0%) |
| 5-Person Households | 74 (12.0%) | 0 (0.0%) |
| 6-Person Households | 0 (0.0%) | 0 (0.0%) |
| 7+ Person Households | 10 (1.6%) | 0 (0.0%) |
| Total | 381 (62.0%) | 234 (38.1%) |
Female Fertility in Richford
Fertility by Age in Richford
Average fertility rate in Richford is 31.0 births per 1,000 women. Women in the age bracket of 20 to 34 years have the highest fertility rate with 90.0 births per 1,000 women. Women in the age bracket of 20 to 34 years acount for 100.0% of all women with births.
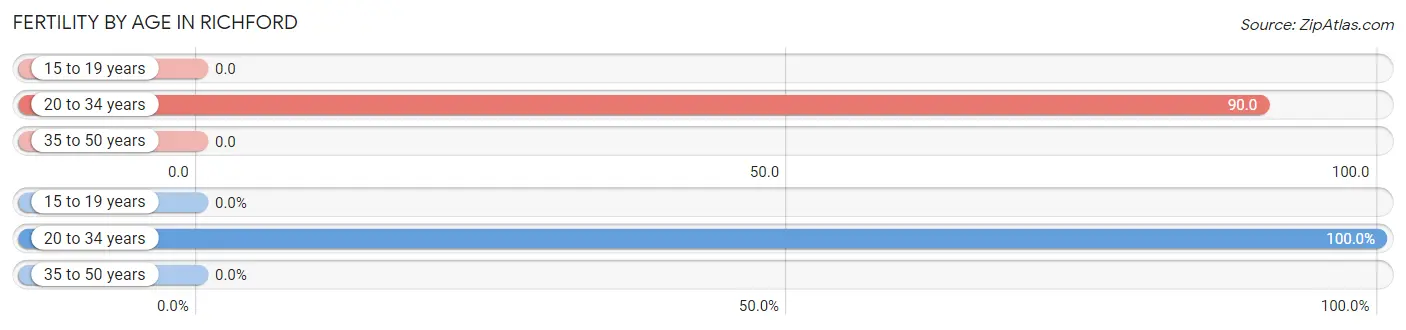
| Age Bracket | Women with Births | Births / 1,000 Women |
| 15 to 19 years | 0 (0.0%) | 0.0 |
| 20 to 34 years | 12 (100.0%) | 90.0 |
| 35 to 50 years | 0 (0.0%) | 0.0 |
| Total | 12 (100.0%) | 31.0 |
Fertility by Age by Marriage Status in Richford
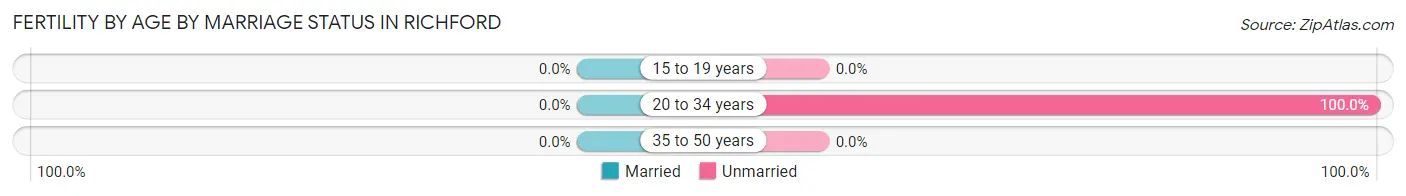
| Age Bracket | Married | Unmarried |
| 15 to 19 years | 0 (0.0%) | 0 (0.0%) |
| 20 to 34 years | 0 (0.0%) | 12 (100.0%) |
| 35 to 50 years | 0 (0.0%) | 0 (0.0%) |
| Total | 0 (0.0%) | 12 (100.0%) |
Fertility by Education in Richford
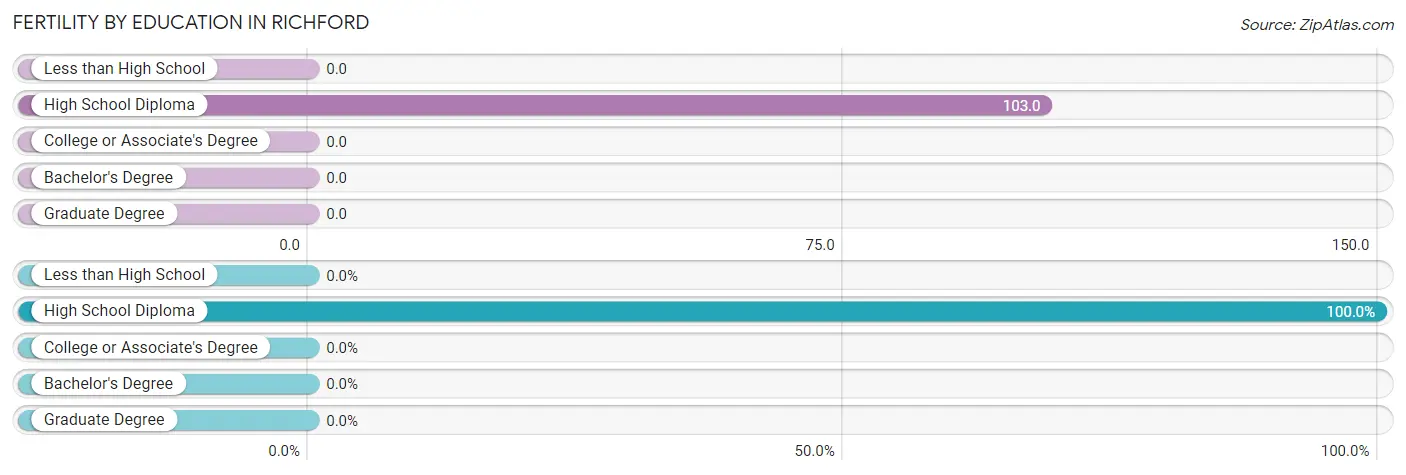
| Educational Attainment | Women with Births | Births / 1,000 Women |
| Less than High School | 0 (0.0%) | 0.0 |
| High School Diploma | 12 (100.0%) | 103.0 |
| College or Associate's Degree | 0 (0.0%) | 0.0 |
| Bachelor's Degree | 0 (0.0%) | 0.0 |
| Graduate Degree | 0 (0.0%) | 0.0 |
| Total | 12 (100.0%) | 31.0 |
Fertility by Education by Marriage Status in Richford
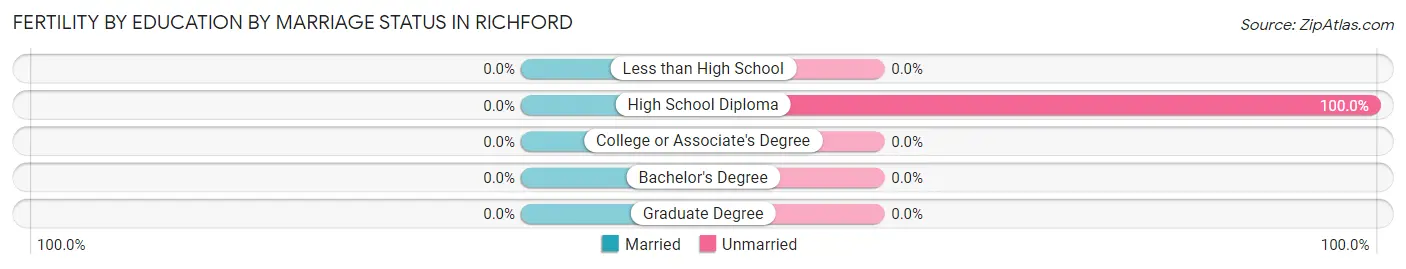
| Educational Attainment | Married | Unmarried |
| Less than High School | 0 (0.0%) | 0 (0.0%) |
| High School Diploma | 0 (0.0%) | 12 (100.0%) |
| College or Associate's Degree | 0 (0.0%) | 0 (0.0%) |
| Bachelor's Degree | 0 (0.0%) | 0 (0.0%) |
| Graduate Degree | 0 (0.0%) | 0 (0.0%) |
| Total | 0 (0.0%) | 12 (100.0%) |
Employment Characteristics in Richford
Employment by Class of Employer in Richford
Among the 589 employed individuals in Richford, private company employees (462 | 78.4%), not-for-profit organizations (53 | 9.0%), and self-employed (not incorporated) (38 | 6.5%) make up the most common classes of employment.
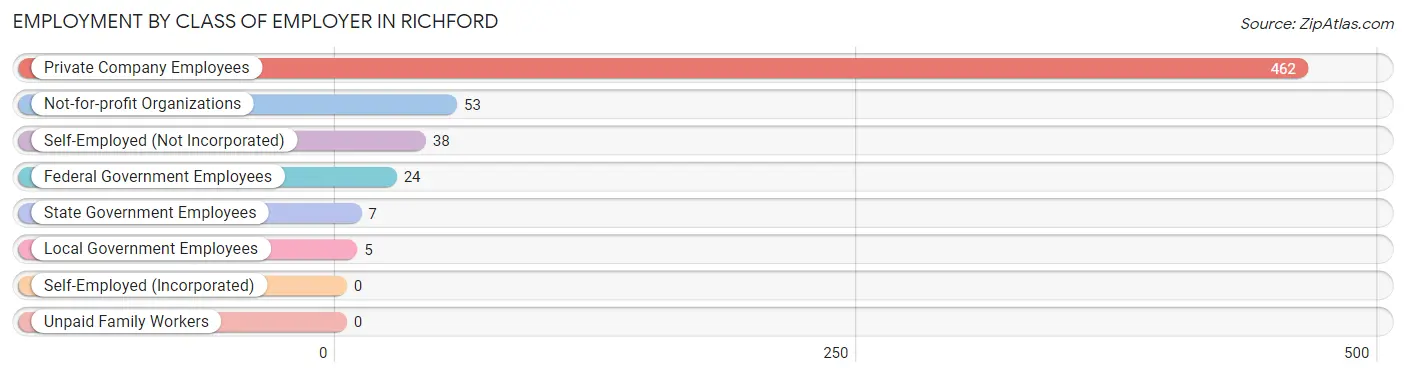
| Employer Class | # Employees | % Employees |
| Private Company Employees | 462 | 78.4% |
| Self-Employed (Incorporated) | 0 | 0.0% |
| Self-Employed (Not Incorporated) | 38 | 6.5% |
| Not-for-profit Organizations | 53 | 9.0% |
| Local Government Employees | 5 | 0.9% |
| State Government Employees | 7 | 1.2% |
| Federal Government Employees | 24 | 4.1% |
| Unpaid Family Workers | 0 | 0.0% |
| Total | 589 | 100.0% |
Employment Status by Age in Richford
According to the labor force statistics for Richford, out of the total population over 16 years of age (1,308), 49.9% or 653 individuals are in the labor force, with 8.0% or 52 of them unemployed. The age group with the highest labor force participation rate is 25 to 29 years, with 100.0% or 93 individuals in the labor force. Within the labor force, the 25 to 29 years age range has the highest percentage of unemployed individuals, with 18.3% or 17 of them being unemployed.
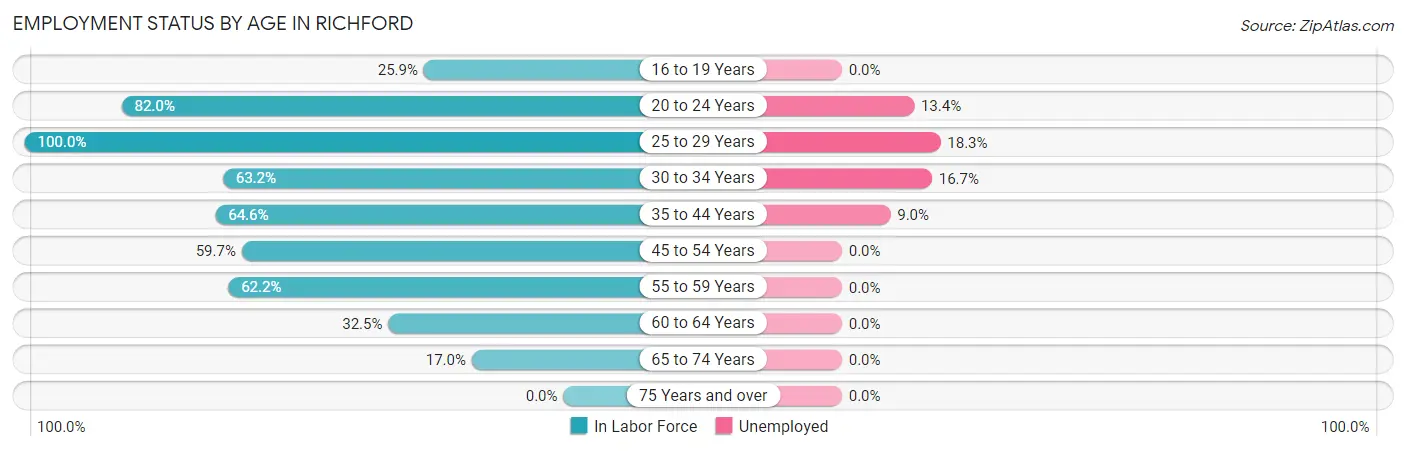
| Age Bracket | In Labor Force | Unemployed |
| 16 to 19 Years | 35 (25.9%) | 0 (0.0%) |
| 20 to 24 Years | 82 (82.0%) | 11 (13.4%) |
| 25 to 29 Years | 93 (100.0%) | 17 (18.3%) |
| 30 to 34 Years | 48 (63.2%) | 8 (16.7%) |
| 35 to 44 Years | 177 (64.6%) | 16 (9.0%) |
| 45 to 54 Years | 105 (59.7%) | 0 (0.0%) |
| 55 to 59 Years | 46 (62.2%) | 0 (0.0%) |
| 60 to 64 Years | 40 (32.5%) | 0 (0.0%) |
| 65 to 74 Years | 27 (17.0%) | 0 (0.0%) |
| 75 Years and over | 0 (0.0%) | 0 (0.0%) |
| Total | 653 (49.9%) | 52 (8.0%) |
Employment Status by Educational Attainment in Richford
According to labor force statistics for Richford, 62.4% of individuals (509) out of the total population between 25 and 64 years of age (816) are in the labor force, with 8.1% or 41 of them being unemployed. The group with the highest labor force participation rate are those with the educational attainment of college / associate degree, with 84.1% or 153 individuals in the labor force. Within the labor force, individuals with less than high school education have the highest percentage of unemployment, with 29.0% or 18 of them being unemployed.
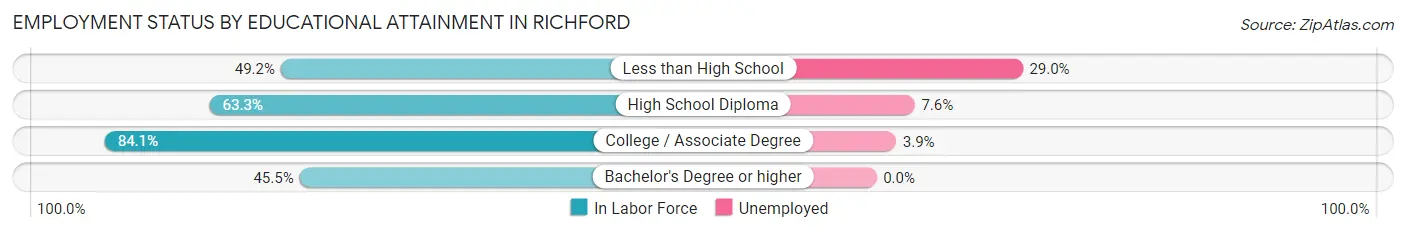
| Educational Attainment | In Labor Force | Unemployed |
| Less than High School | 62 (49.2%) | 37 (29.0%) |
| High School Diploma | 224 (63.3%) | 27 (7.6%) |
| College / Associate Degree | 153 (84.1%) | 7 (3.9%) |
| Bachelor's Degree or higher | 70 (45.5%) | 0 (0.0%) |
| Total | 509 (62.4%) | 66 (8.1%) |
Employment Occupations by Sex in Richford
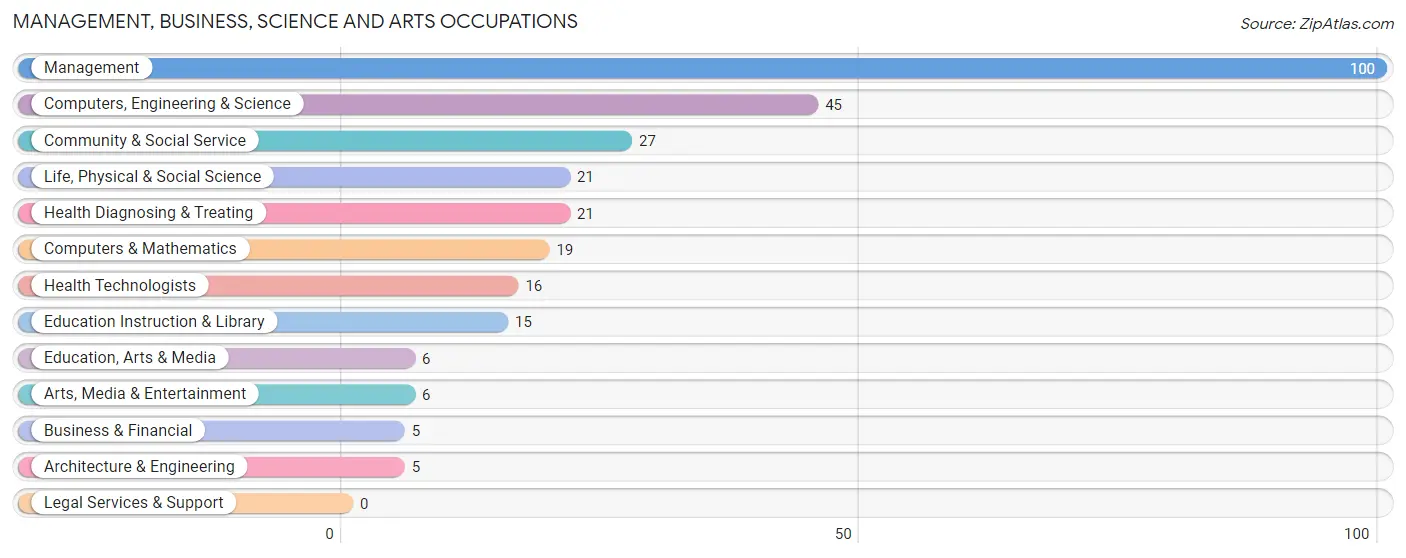
Management, Business, Science and Arts Occupations
The most common Management, Business, Science and Arts occupations in Richford are Management (100 | 16.6%), Computers, Engineering & Science (45 | 7.5%), Community & Social Service (27 | 4.5%), Life, Physical & Social Science (21 | 3.5%), and Health Diagnosing & Treating (21 | 3.5%).
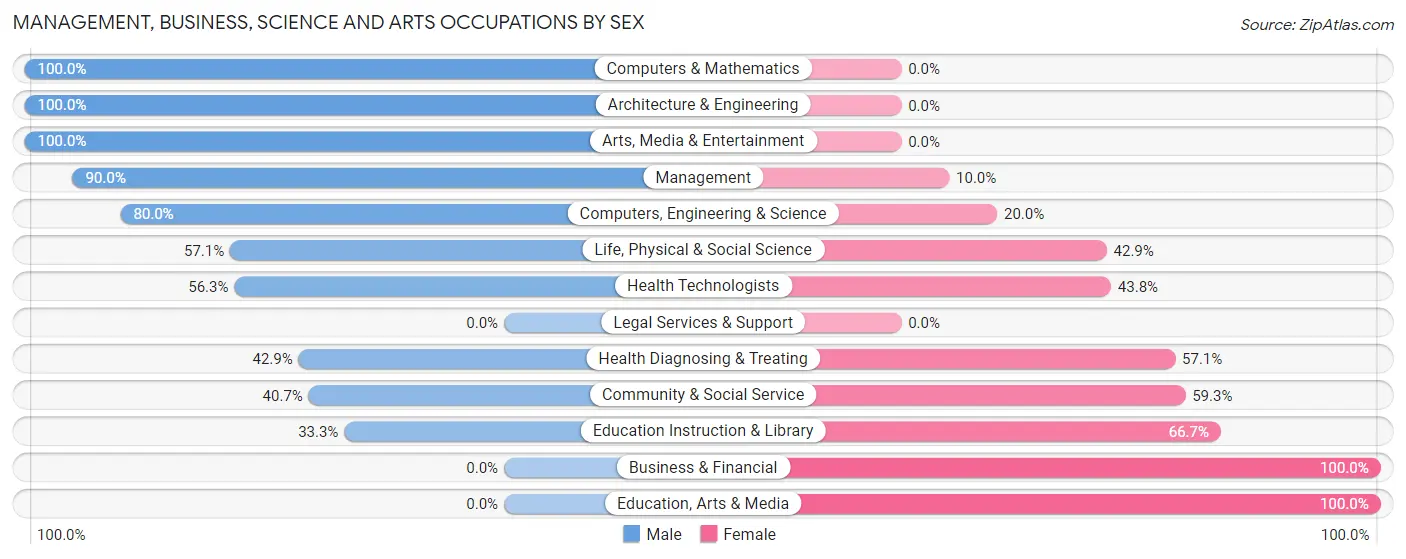
Management, Business, Science and Arts Occupations by Sex
Within the Management, Business, Science and Arts occupations in Richford, the most male-oriented occupations are Computers & Mathematics (100.0%), Architecture & Engineering (100.0%), and Arts, Media & Entertainment (100.0%), while the most female-oriented occupations are Business & Financial (100.0%), Education, Arts & Media (100.0%), and Education Instruction & Library (66.7%).
| Occupation | Male | Female |
| Management | 90 (90.0%) | 10 (10.0%) |
| Business & Financial | 0 (0.0%) | 5 (100.0%) |
| Computers, Engineering & Science | 36 (80.0%) | 9 (20.0%) |
| Computers & Mathematics | 19 (100.0%) | 0 (0.0%) |
| Architecture & Engineering | 5 (100.0%) | 0 (0.0%) |
| Life, Physical & Social Science | 12 (57.1%) | 9 (42.9%) |
| Community & Social Service | 11 (40.7%) | 16 (59.3%) |
| Education, Arts & Media | 0 (0.0%) | 6 (100.0%) |
| Legal Services & Support | 0 (0.0%) | 0 (0.0%) |
| Education Instruction & Library | 5 (33.3%) | 10 (66.7%) |
| Arts, Media & Entertainment | 6 (100.0%) | 0 (0.0%) |
| Health Diagnosing & Treating | 9 (42.9%) | 12 (57.1%) |
| Health Technologists | 9 (56.2%) | 7 (43.8%) |
| Total (Category) | 146 (73.7%) | 52 (26.3%) |
| Total (Overall) | 347 (57.7%) | 254 (42.3%) |
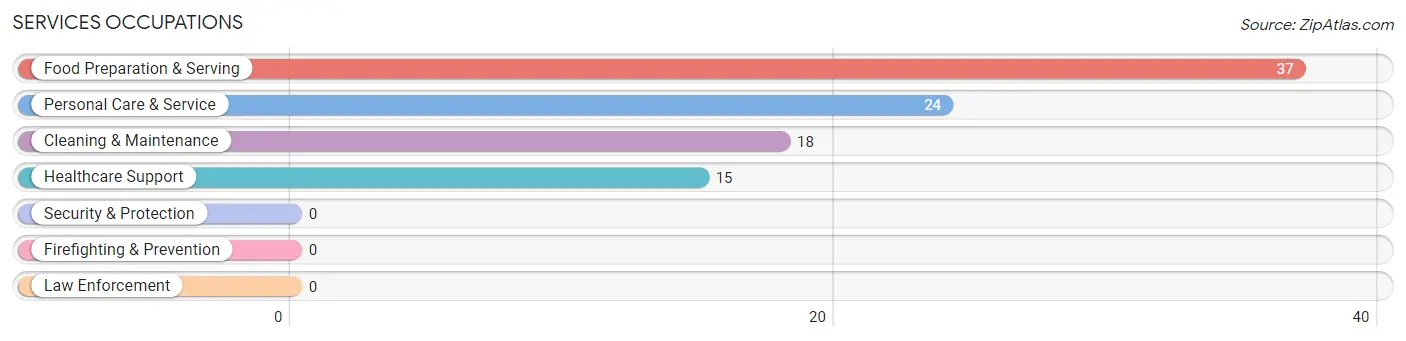
Services Occupations
The most common Services occupations in Richford are Food Preparation & Serving (37 | 6.2%), Personal Care & Service (24 | 4.0%), Cleaning & Maintenance (18 | 3.0%), and Healthcare Support (15 | 2.5%).
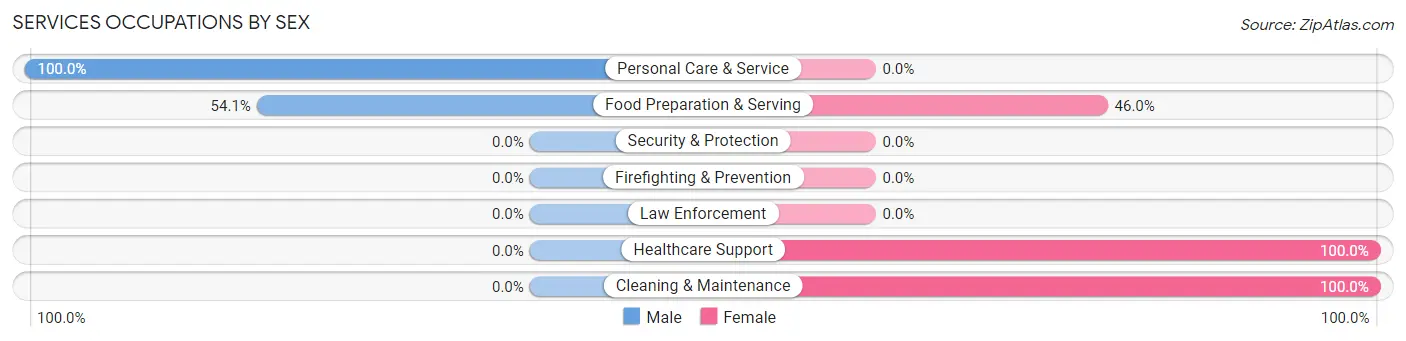
Services Occupations by Sex
Within the Services occupations in Richford, the most male-oriented occupations are Personal Care & Service (100.0%), and Food Preparation & Serving (54.0%), while the most female-oriented occupations are Healthcare Support (100.0%), Cleaning & Maintenance (100.0%), and Food Preparation & Serving (46.0%).
| Occupation | Male | Female |
| Healthcare Support | 0 (0.0%) | 15 (100.0%) |
| Security & Protection | 0 (0.0%) | 0 (0.0%) |
| Firefighting & Prevention | 0 (0.0%) | 0 (0.0%) |
| Law Enforcement | 0 (0.0%) | 0 (0.0%) |
| Food Preparation & Serving | 20 (54.0%) | 17 (46.0%) |
| Cleaning & Maintenance | 0 (0.0%) | 18 (100.0%) |
| Personal Care & Service | 24 (100.0%) | 0 (0.0%) |
| Total (Category) | 44 (46.8%) | 50 (53.2%) |
| Total (Overall) | 347 (57.7%) | 254 (42.3%) |
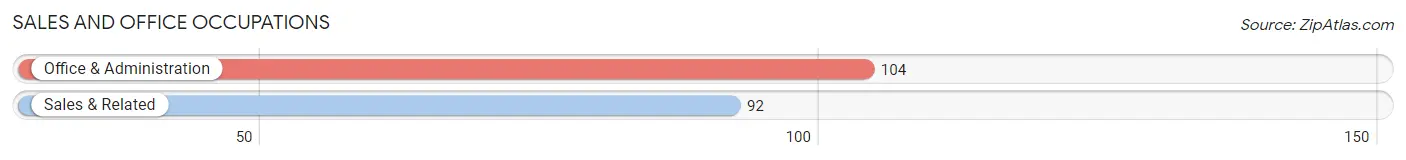
Sales and Office Occupations
The most common Sales and Office occupations in Richford are Office & Administration (104 | 17.3%), and Sales & Related (92 | 15.3%).
Sales and Office Occupations by Sex
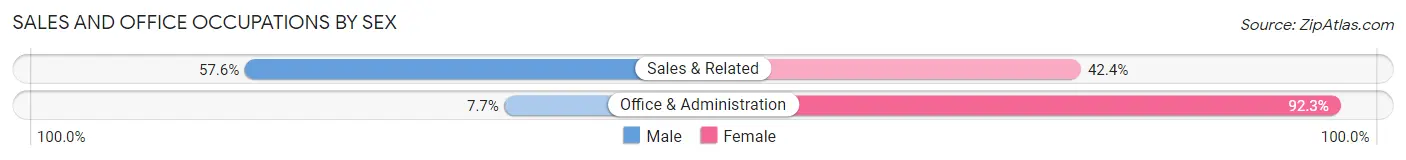
| Occupation | Male | Female |
| Sales & Related | 53 (57.6%) | 39 (42.4%) |
| Office & Administration | 8 (7.7%) | 96 (92.3%) |
| Total (Category) | 61 (31.1%) | 135 (68.9%) |
| Total (Overall) | 347 (57.7%) | 254 (42.3%) |
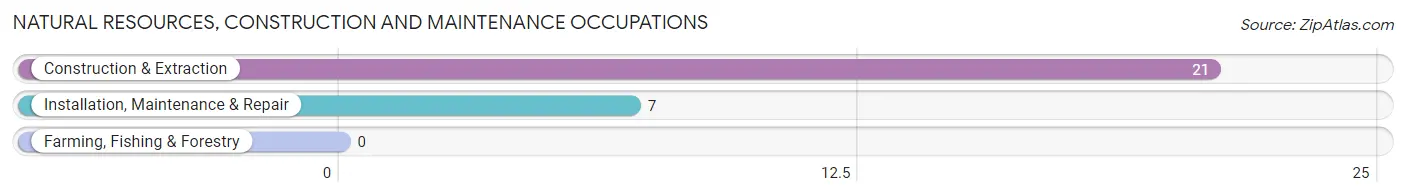
Natural Resources, Construction and Maintenance Occupations
The most common Natural Resources, Construction and Maintenance occupations in Richford are Construction & Extraction (21 | 3.5%), and Installation, Maintenance & Repair (7 | 1.2%).
Natural Resources, Construction and Maintenance Occupations by Sex
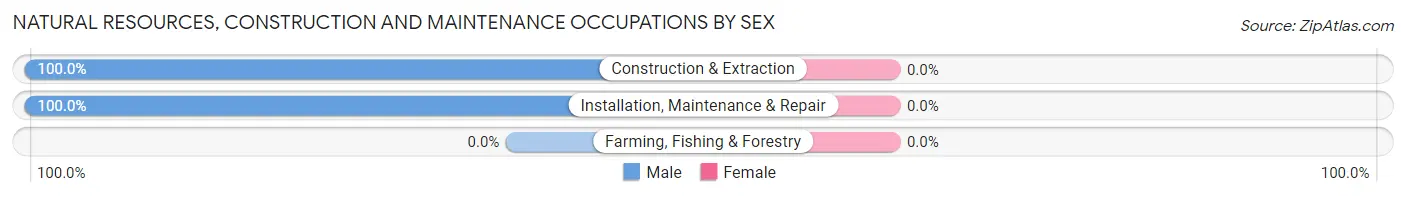
| Occupation | Male | Female |
| Farming, Fishing & Forestry | 0 (0.0%) | 0 (0.0%) |
| Construction & Extraction | 21 (100.0%) | 0 (0.0%) |
| Installation, Maintenance & Repair | 7 (100.0%) | 0 (0.0%) |
| Total (Category) | 28 (100.0%) | 0 (0.0%) |
| Total (Overall) | 347 (57.7%) | 254 (42.3%) |
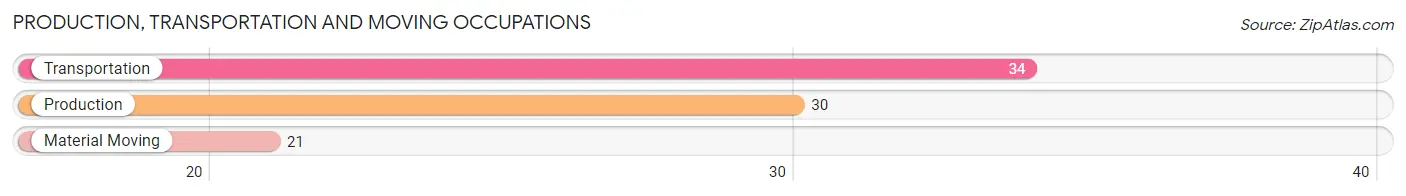
Production, Transportation and Moving Occupations
The most common Production, Transportation and Moving occupations in Richford are Transportation (34 | 5.7%), Production (30 | 5.0%), and Material Moving (21 | 3.5%).
Production, Transportation and Moving Occupations by Sex
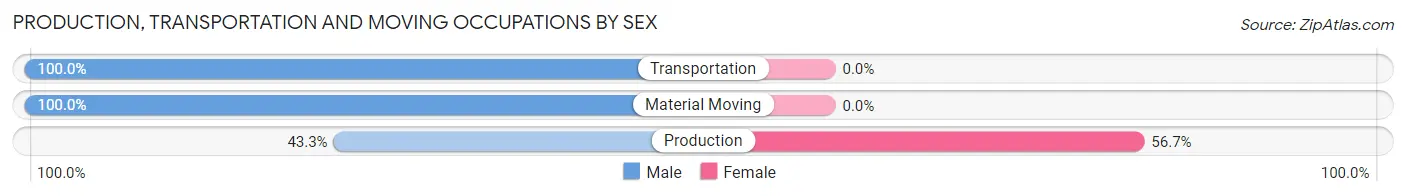
| Occupation | Male | Female |
| Production | 13 (43.3%) | 17 (56.7%) |
| Transportation | 34 (100.0%) | 0 (0.0%) |
| Material Moving | 21 (100.0%) | 0 (0.0%) |
| Total (Category) | 68 (80.0%) | 17 (20.0%) |
| Total (Overall) | 347 (57.7%) | 254 (42.3%) |
Employment Industries by Sex in Richford
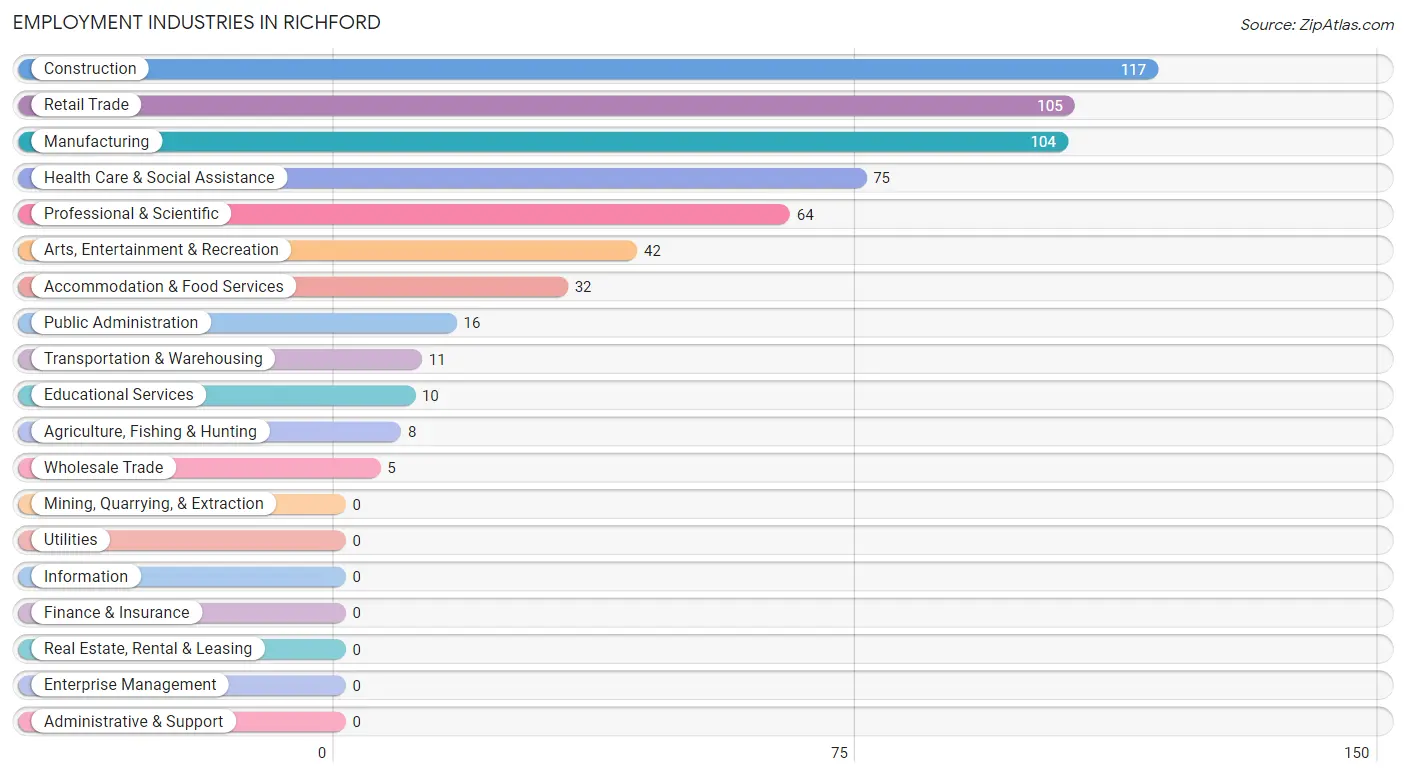
Employment Industries in Richford
The major employment industries in Richford include Construction (117 | 19.5%), Retail Trade (105 | 17.5%), Manufacturing (104 | 17.3%), Health Care & Social Assistance (75 | 12.5%), and Professional & Scientific (64 | 10.6%).
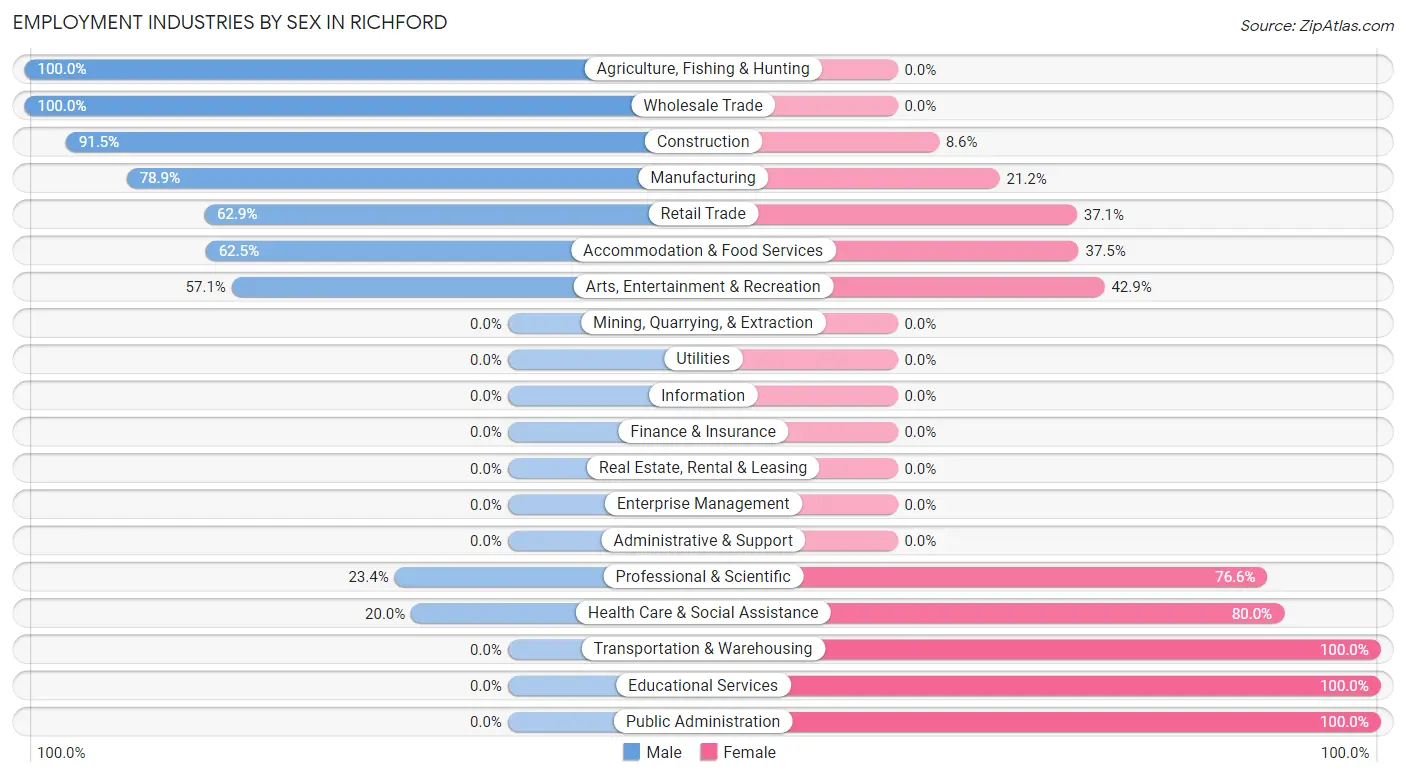
Employment Industries by Sex in Richford
The Richford industries that see more men than women are Agriculture, Fishing & Hunting (100.0%), Wholesale Trade (100.0%), and Construction (91.4%), whereas the industries that tend to have a higher number of women are Transportation & Warehousing (100.0%), Educational Services (100.0%), and Public Administration (100.0%).
| Industry | Male | Female |
| Agriculture, Fishing & Hunting | 8 (100.0%) | 0 (0.0%) |
| Mining, Quarrying, & Extraction | 0 (0.0%) | 0 (0.0%) |
| Construction | 107 (91.4%) | 10 (8.6%) |
| Manufacturing | 82 (78.8%) | 22 (21.1%) |
| Wholesale Trade | 5 (100.0%) | 0 (0.0%) |
| Retail Trade | 66 (62.9%) | 39 (37.1%) |
| Transportation & Warehousing | 0 (0.0%) | 11 (100.0%) |
| Utilities | 0 (0.0%) | 0 (0.0%) |
| Information | 0 (0.0%) | 0 (0.0%) |
| Finance & Insurance | 0 (0.0%) | 0 (0.0%) |
| Real Estate, Rental & Leasing | 0 (0.0%) | 0 (0.0%) |
| Professional & Scientific | 15 (23.4%) | 49 (76.6%) |
| Enterprise Management | 0 (0.0%) | 0 (0.0%) |
| Administrative & Support | 0 (0.0%) | 0 (0.0%) |
| Educational Services | 0 (0.0%) | 10 (100.0%) |
| Health Care & Social Assistance | 15 (20.0%) | 60 (80.0%) |
| Arts, Entertainment & Recreation | 24 (57.1%) | 18 (42.9%) |
| Accommodation & Food Services | 20 (62.5%) | 12 (37.5%) |
| Public Administration | 0 (0.0%) | 16 (100.0%) |
| Total | 347 (57.7%) | 254 (42.3%) |
Education in Richford
School Enrollment in Richford
The most common levels of schooling among the 428 students in Richford are high school (120 | 28.0%), elementary school (118 | 27.6%), and middle school (73 | 17.1%).
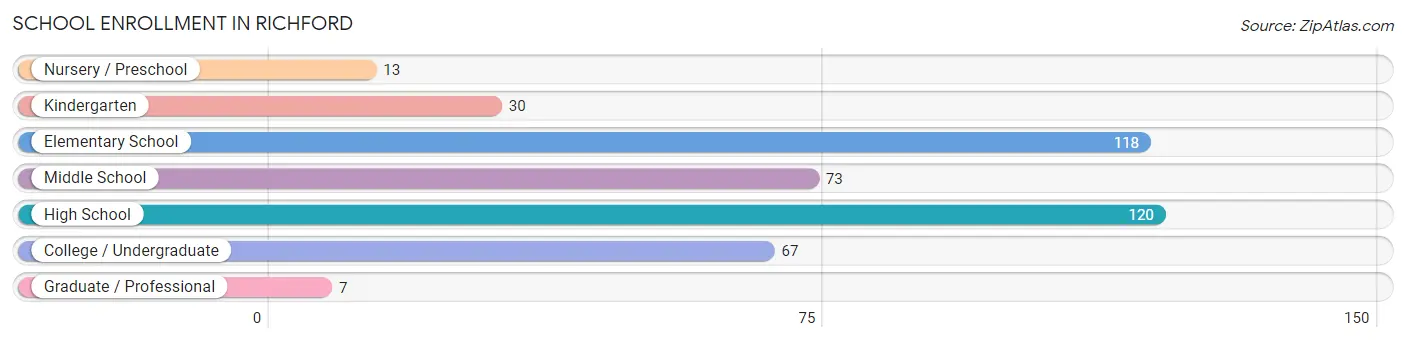
| School Level | # Students | % Students |
| Nursery / Preschool | 13 | 3.0% |
| Kindergarten | 30 | 7.0% |
| Elementary School | 118 | 27.6% |
| Middle School | 73 | 17.1% |
| High School | 120 | 28.0% |
| College / Undergraduate | 67 | 15.7% |
| Graduate / Professional | 7 | 1.6% |
| Total | 428 | 100.0% |
School Enrollment by Age by Funding Source in Richford
Out of a total of 428 students who are enrolled in schools in Richford, 34 (7.9%) attend a private institution, while the remaining 394 (92.1%) are enrolled in public schools. The age group of 35 years and over has the highest likelihood of being enrolled in private schools, with 16 (100.0% in the age bracket) enrolled. Conversely, the age group of 3 to 4 year olds has the lowest likelihood of being enrolled in a private school, with 6 (100.0% in the age bracket) attending a public institution.
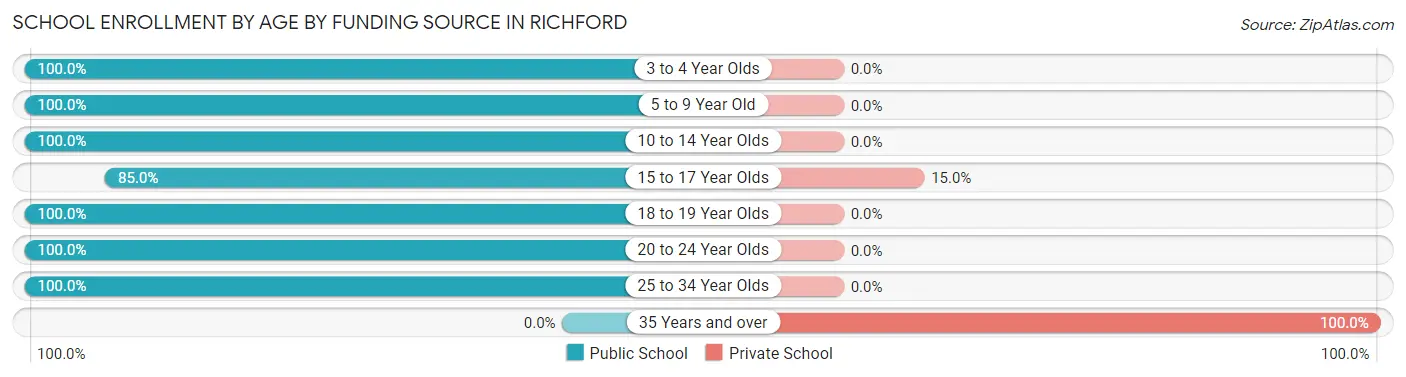
| Age Bracket | Public School | Private School |
| 3 to 4 Year Olds | 6 (100.0%) | 0 (0.0%) |
| 5 to 9 Year Old | 148 (100.0%) | 0 (0.0%) |
| 10 to 14 Year Olds | 80 (100.0%) | 0 (0.0%) |
| 15 to 17 Year Olds | 102 (85.0%) | 18 (15.0%) |
| 18 to 19 Year Olds | 42 (100.0%) | 0 (0.0%) |
| 20 to 24 Year Olds | 9 (100.0%) | 0 (0.0%) |
| 25 to 34 Year Olds | 7 (100.0%) | 0 (0.0%) |
| 35 Years and over | 0 (0.0%) | 16 (100.0%) |
| Total | 394 (92.1%) | 34 (7.9%) |
Educational Attainment by Field of Study in Richford
Business (49 | 28.5%), psychology (28 | 16.3%), bio, nature & agricultural (26 | 15.1%), engineering (15 | 8.7%), and science & technology (14 | 8.1%) are the most common fields of study among 172 individuals in Richford who have obtained a bachelor's degree or higher.
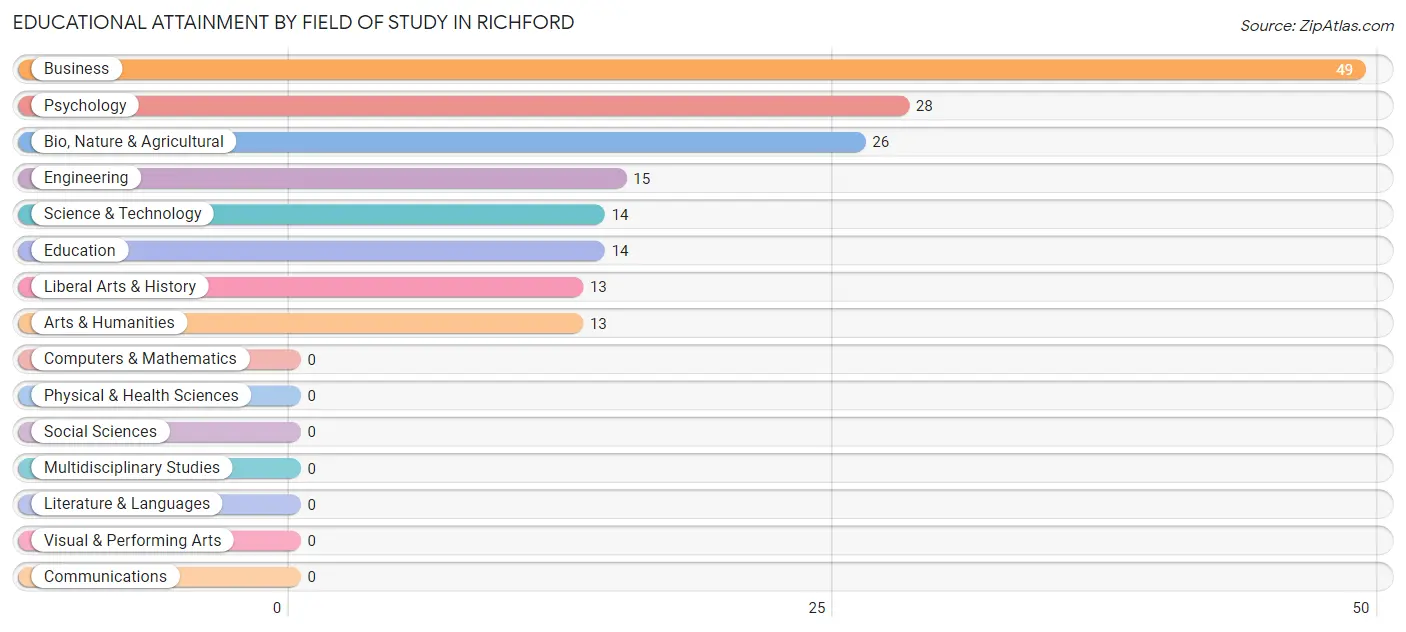
| Field of Study | # Graduates | % Graduates |
| Computers & Mathematics | 0 | 0.0% |
| Bio, Nature & Agricultural | 26 | 15.1% |
| Physical & Health Sciences | 0 | 0.0% |
| Psychology | 28 | 16.3% |
| Social Sciences | 0 | 0.0% |
| Engineering | 15 | 8.7% |
| Multidisciplinary Studies | 0 | 0.0% |
| Science & Technology | 14 | 8.1% |
| Business | 49 | 28.5% |
| Education | 14 | 8.1% |
| Literature & Languages | 0 | 0.0% |
| Liberal Arts & History | 13 | 7.6% |
| Visual & Performing Arts | 0 | 0.0% |
| Communications | 0 | 0.0% |
| Arts & Humanities | 13 | 7.6% |
| Total | 172 | 100.0% |
Transportation & Commute in Richford
Vehicle Availability by Sex in Richford
The most prevalent vehicle ownership categories in Richford are males with 2 vehicles (152, accounting for 43.8%) and females with 2 vehicles (125, making up 62.8%).
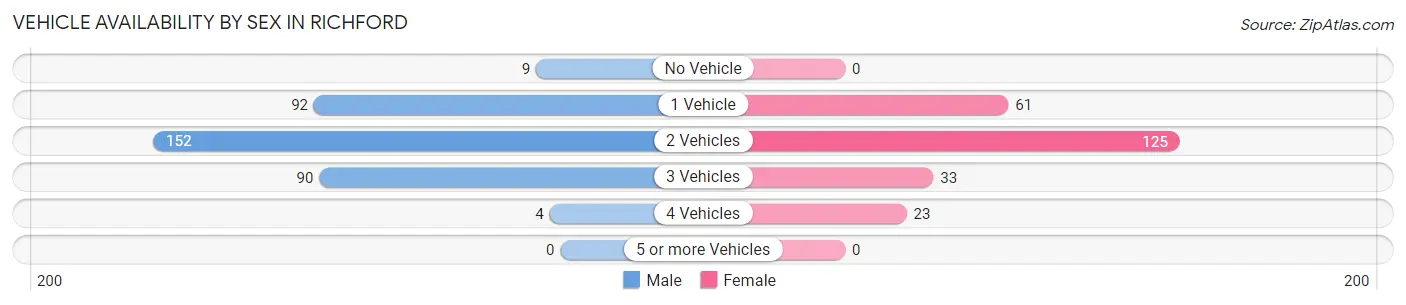
| Vehicles Available | Male | Female |
| No Vehicle | 9 (2.6%) | 0 (0.0%) |
| 1 Vehicle | 92 (26.5%) | 61 (25.2%) |
| 2 Vehicles | 152 (43.8%) | 125 (51.6%) |
| 3 Vehicles | 90 (25.9%) | 33 (13.6%) |
| 4 Vehicles | 4 (1.1%) | 23 (9.5%) |
| 5 or more Vehicles | 0 (0.0%) | 0 (0.0%) |
| Total | 347 (100.0%) | 242 (100.0%) |
Commute Time in Richford
The most frequently occuring commute durations in Richford are 5 to 9 minutes (130 commuters, 22.4%), less than 5 minutes (120 commuters, 20.7%), and 45 to 59 minutes (104 commuters, 17.9%).
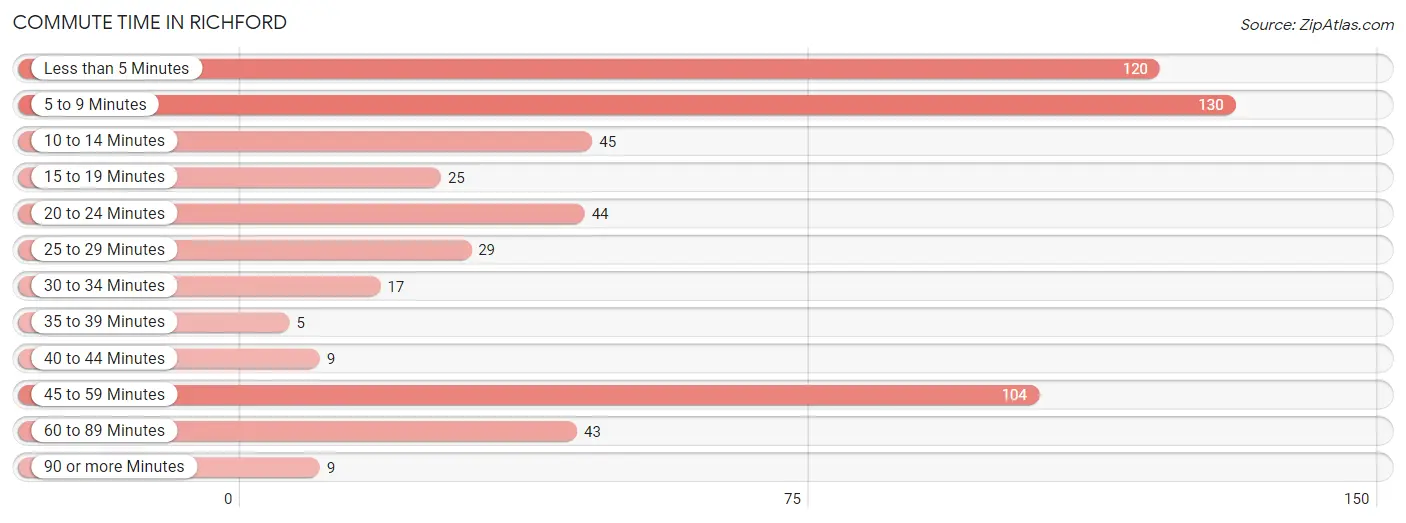
| Commute Time | # Commuters | % Commuters |
| Less than 5 Minutes | 120 | 20.7% |
| 5 to 9 Minutes | 130 | 22.4% |
| 10 to 14 Minutes | 45 | 7.8% |
| 15 to 19 Minutes | 25 | 4.3% |
| 20 to 24 Minutes | 44 | 7.6% |
| 25 to 29 Minutes | 29 | 5.0% |
| 30 to 34 Minutes | 17 | 2.9% |
| 35 to 39 Minutes | 5 | 0.9% |
| 40 to 44 Minutes | 9 | 1.5% |
| 45 to 59 Minutes | 104 | 17.9% |
| 60 to 89 Minutes | 43 | 7.4% |
| 90 or more Minutes | 9 | 1.5% |
Commute Time by Sex in Richford
The most common commute times in Richford are 5 to 9 minutes (105 commuters, 30.3%) for males and 45 to 59 minutes (38 commuters, 16.3%) for females.
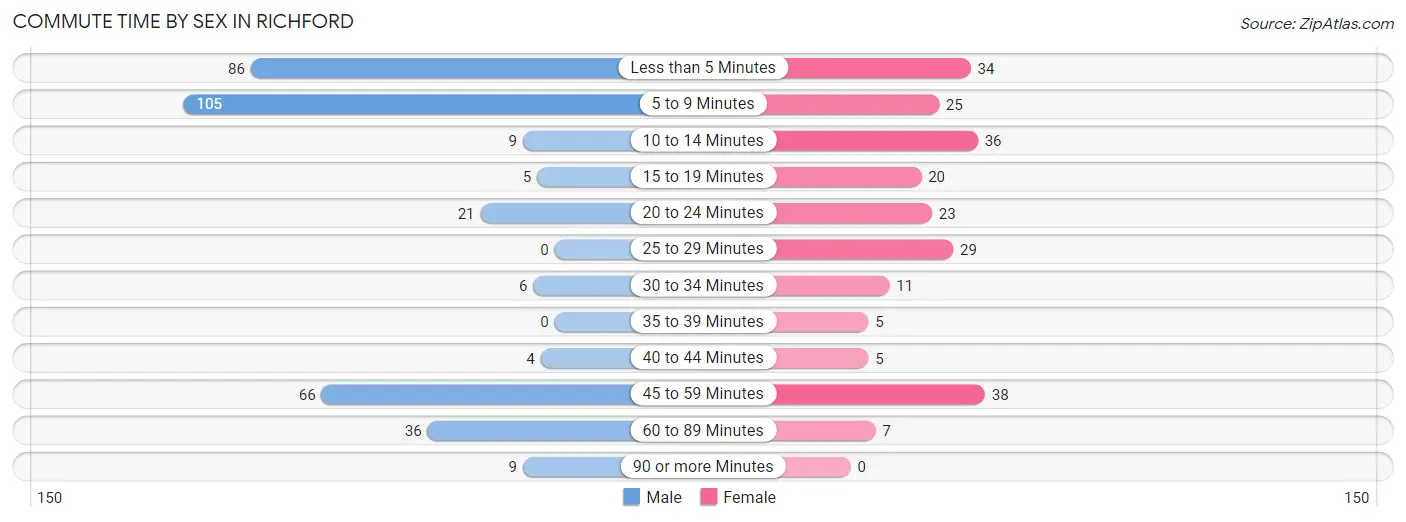
| Commute Time | Male | Female |
| Less than 5 Minutes | 86 (24.8%) | 34 (14.6%) |
| 5 to 9 Minutes | 105 (30.3%) | 25 (10.7%) |
| 10 to 14 Minutes | 9 (2.6%) | 36 (15.4%) |
| 15 to 19 Minutes | 5 (1.4%) | 20 (8.6%) |
| 20 to 24 Minutes | 21 (6.0%) | 23 (9.9%) |
| 25 to 29 Minutes | 0 (0.0%) | 29 (12.4%) |
| 30 to 34 Minutes | 6 (1.7%) | 11 (4.7%) |
| 35 to 39 Minutes | 0 (0.0%) | 5 (2.1%) |
| 40 to 44 Minutes | 4 (1.1%) | 5 (2.1%) |
| 45 to 59 Minutes | 66 (19.0%) | 38 (16.3%) |
| 60 to 89 Minutes | 36 (10.4%) | 7 (3.0%) |
| 90 or more Minutes | 9 (2.6%) | 0 (0.0%) |
Time of Departure to Work by Sex in Richford
The most frequent times of departure to work in Richford are 6:00 AM to 6:29 AM (98, 28.2%) for males and 6:00 AM to 6:29 AM (56, 24.0%) for females.
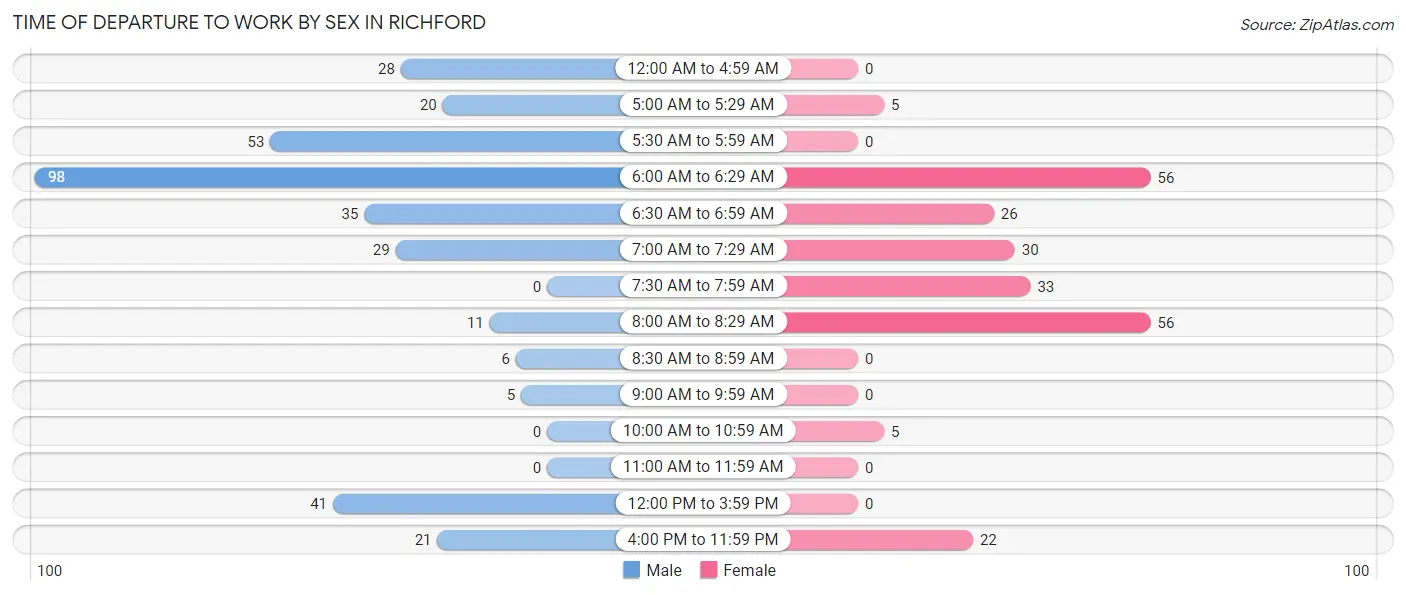
| Time of Departure | Male | Female |
| 12:00 AM to 4:59 AM | 28 (8.1%) | 0 (0.0%) |
| 5:00 AM to 5:29 AM | 20 (5.8%) | 5 (2.1%) |
| 5:30 AM to 5:59 AM | 53 (15.3%) | 0 (0.0%) |
| 6:00 AM to 6:29 AM | 98 (28.2%) | 56 (24.0%) |
| 6:30 AM to 6:59 AM | 35 (10.1%) | 26 (11.2%) |
| 7:00 AM to 7:29 AM | 29 (8.4%) | 30 (12.9%) |
| 7:30 AM to 7:59 AM | 0 (0.0%) | 33 (14.2%) |
| 8:00 AM to 8:29 AM | 11 (3.2%) | 56 (24.0%) |
| 8:30 AM to 8:59 AM | 6 (1.7%) | 0 (0.0%) |
| 9:00 AM to 9:59 AM | 5 (1.4%) | 0 (0.0%) |
| 10:00 AM to 10:59 AM | 0 (0.0%) | 5 (2.1%) |
| 11:00 AM to 11:59 AM | 0 (0.0%) | 0 (0.0%) |
| 12:00 PM to 3:59 PM | 41 (11.8%) | 0 (0.0%) |
| 4:00 PM to 11:59 PM | 21 (6.0%) | 22 (9.4%) |
| Total | 347 (100.0%) | 233 (100.0%) |
Housing Occupancy in Richford
Occupancy by Ownership in Richford
Of the total 615 dwellings in Richford, owner-occupied units account for 397 (64.5%), while renter-occupied units make up 218 (35.4%).
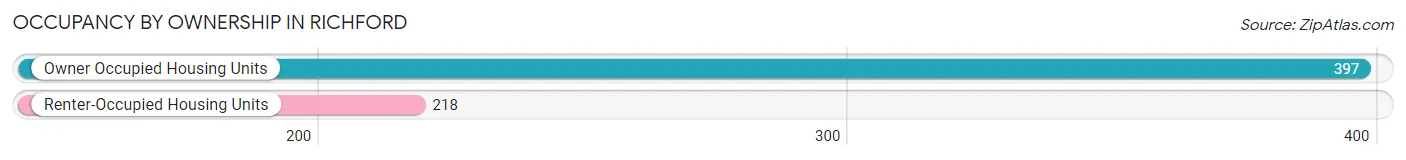
| Occupancy | # Housing Units | % Housing Units |
| Owner Occupied Housing Units | 397 | 64.5% |
| Renter-Occupied Housing Units | 218 | 35.4% |
| Total Occupied Housing Units | 615 | 100.0% |
Occupancy by Household Size in Richford
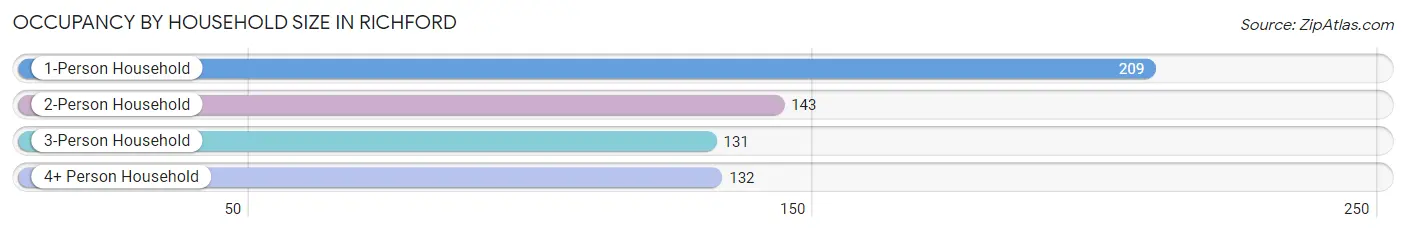
| Household Size | # Housing Units | % Housing Units |
| 1-Person Household | 209 | 34.0% |
| 2-Person Household | 143 | 23.3% |
| 3-Person Household | 131 | 21.3% |
| 4+ Person Household | 132 | 21.5% |
| Total Housing Units | 615 | 100.0% |
Occupancy by Ownership by Household Size in Richford
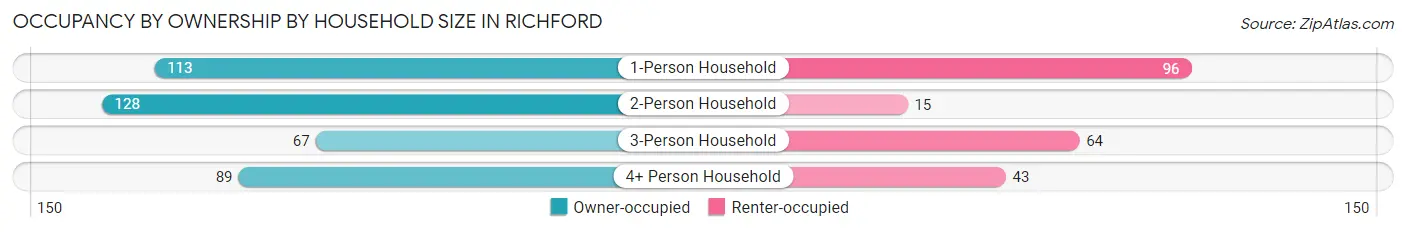
| Household Size | Owner-occupied | Renter-occupied |
| 1-Person Household | 113 (54.1%) | 96 (45.9%) |
| 2-Person Household | 128 (89.5%) | 15 (10.5%) |
| 3-Person Household | 67 (51.1%) | 64 (48.8%) |
| 4+ Person Household | 89 (67.4%) | 43 (32.6%) |
| Total Housing Units | 397 (64.5%) | 218 (35.4%) |
Occupancy by Educational Attainment in Richford
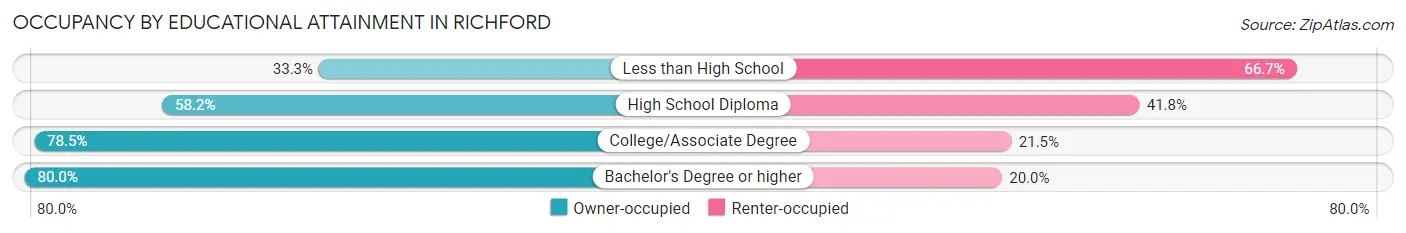
| Household Size | Owner-occupied | Renter-occupied |
| Less than High School | 30 (33.3%) | 60 (66.7%) |
| High School Diploma | 135 (58.2%) | 97 (41.8%) |
| College/Associate Degree | 124 (78.5%) | 34 (21.5%) |
| Bachelor's Degree or higher | 108 (80.0%) | 27 (20.0%) |
Occupancy by Age of Householder in Richford
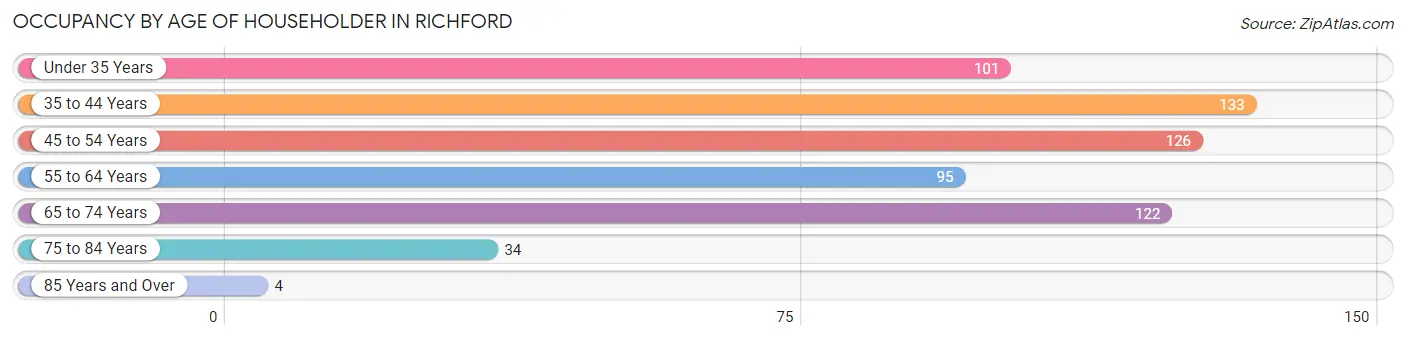
| Age Bracket | # Households | % Households |
| Under 35 Years | 101 | 16.4% |
| 35 to 44 Years | 133 | 21.6% |
| 45 to 54 Years | 126 | 20.5% |
| 55 to 64 Years | 95 | 15.4% |
| 65 to 74 Years | 122 | 19.8% |
| 75 to 84 Years | 34 | 5.5% |
| 85 Years and Over | 4 | 0.6% |
| Total | 615 | 100.0% |
Housing Finances in Richford
Median Income by Occupancy in Richford
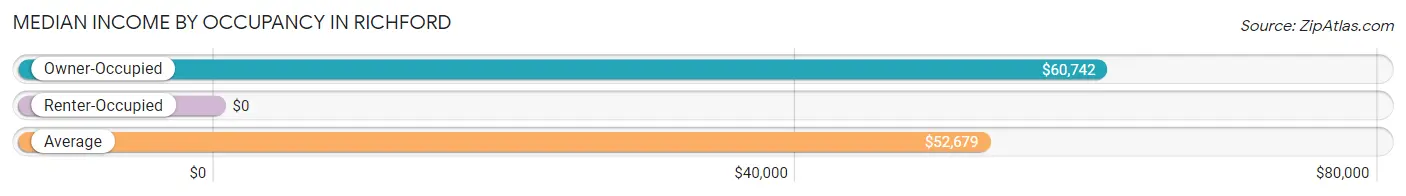
| Occupancy Type | # Households | Median Income |
| Owner-Occupied | 397 (64.5%) | $60,742 |
| Renter-Occupied | 218 (35.4%) | $0 |
| Average | 615 (100.0%) | $52,679 |
Occupancy by Householder Income Bracket in Richford
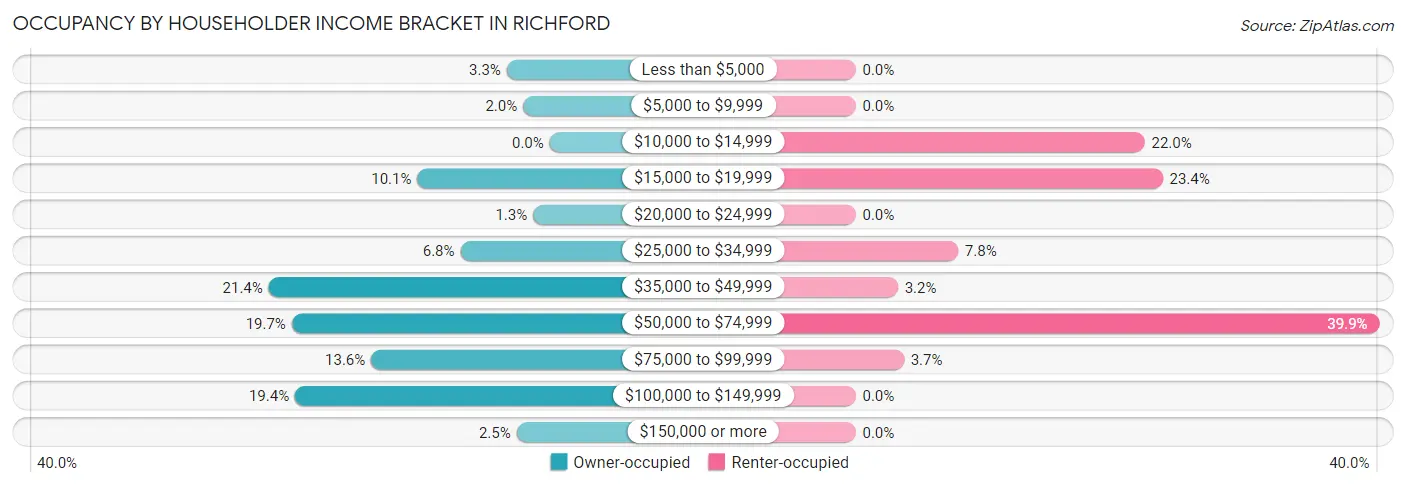
| Income Bracket | Owner-occupied | Renter-occupied |
| Less than $5,000 | 13 (3.3%) | 0 (0.0%) |
| $5,000 to $9,999 | 8 (2.0%) | 0 (0.0%) |
| $10,000 to $14,999 | 0 (0.0%) | 48 (22.0%) |
| $15,000 to $19,999 | 40 (10.1%) | 51 (23.4%) |
| $20,000 to $24,999 | 5 (1.3%) | 0 (0.0%) |
| $25,000 to $34,999 | 27 (6.8%) | 17 (7.8%) |
| $35,000 to $49,999 | 85 (21.4%) | 7 (3.2%) |
| $50,000 to $74,999 | 78 (19.7%) | 87 (39.9%) |
| $75,000 to $99,999 | 54 (13.6%) | 8 (3.7%) |
| $100,000 to $149,999 | 77 (19.4%) | 0 (0.0%) |
| $150,000 or more | 10 (2.5%) | 0 (0.0%) |
| Total | 397 (100.0%) | 218 (100.0%) |
Monthly Housing Cost Tiers in Richford
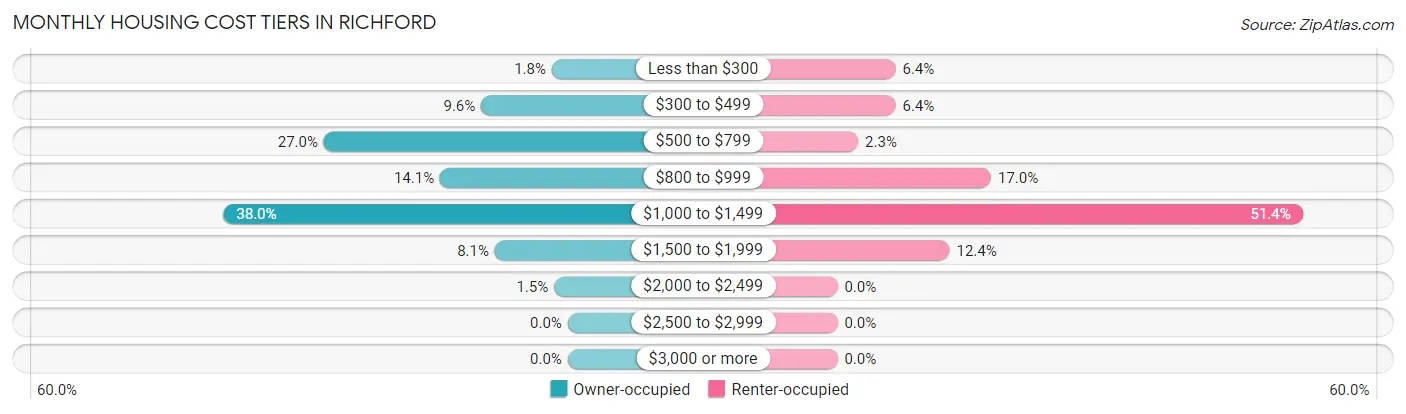
| Monthly Cost | Owner-occupied | Renter-occupied |
| Less than $300 | 7 (1.8%) | 14 (6.4%) |
| $300 to $499 | 38 (9.6%) | 14 (6.4%) |
| $500 to $799 | 107 (27.0%) | 5 (2.3%) |
| $800 to $999 | 56 (14.1%) | 37 (17.0%) |
| $1,000 to $1,499 | 151 (38.0%) | 112 (51.4%) |
| $1,500 to $1,999 | 32 (8.1%) | 27 (12.4%) |
| $2,000 to $2,499 | 6 (1.5%) | 0 (0.0%) |
| $2,500 to $2,999 | 0 (0.0%) | 0 (0.0%) |
| $3,000 or more | 0 (0.0%) | 0 (0.0%) |
| Total | 397 (100.0%) | 218 (100.0%) |
Physical Housing Characteristics in Richford
Housing Structures in Richford
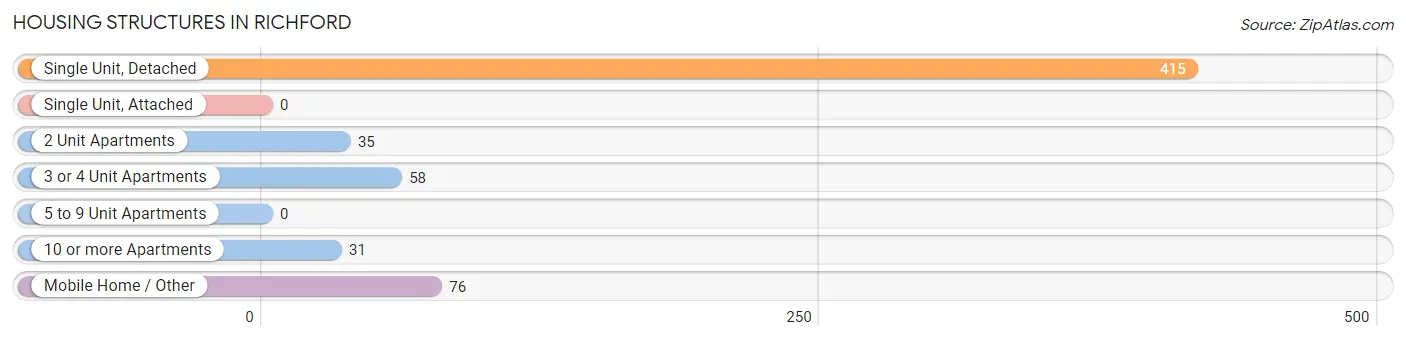
| Structure Type | # Housing Units | % Housing Units |
| Single Unit, Detached | 415 | 67.5% |
| Single Unit, Attached | 0 | 0.0% |
| 2 Unit Apartments | 35 | 5.7% |
| 3 or 4 Unit Apartments | 58 | 9.4% |
| 5 to 9 Unit Apartments | 0 | 0.0% |
| 10 or more Apartments | 31 | 5.0% |
| Mobile Home / Other | 76 | 12.4% |
| Total | 615 | 100.0% |
Housing Structures by Occupancy in Richford
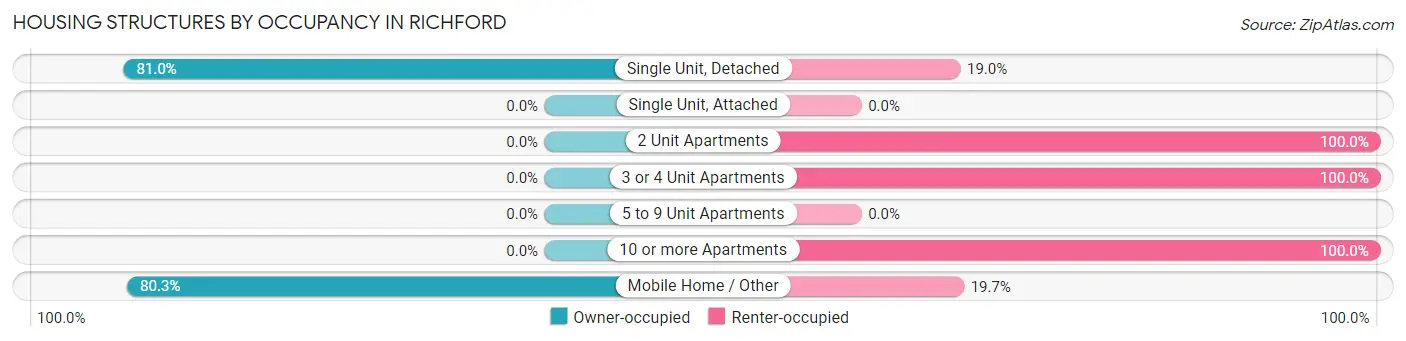
| Structure Type | Owner-occupied | Renter-occupied |
| Single Unit, Detached | 336 (81.0%) | 79 (19.0%) |
| Single Unit, Attached | 0 (0.0%) | 0 (0.0%) |
| 2 Unit Apartments | 0 (0.0%) | 35 (100.0%) |
| 3 or 4 Unit Apartments | 0 (0.0%) | 58 (100.0%) |
| 5 to 9 Unit Apartments | 0 (0.0%) | 0 (0.0%) |
| 10 or more Apartments | 0 (0.0%) | 31 (100.0%) |
| Mobile Home / Other | 61 (80.3%) | 15 (19.7%) |
| Total | 397 (64.5%) | 218 (35.4%) |
Housing Structures by Number of Rooms in Richford
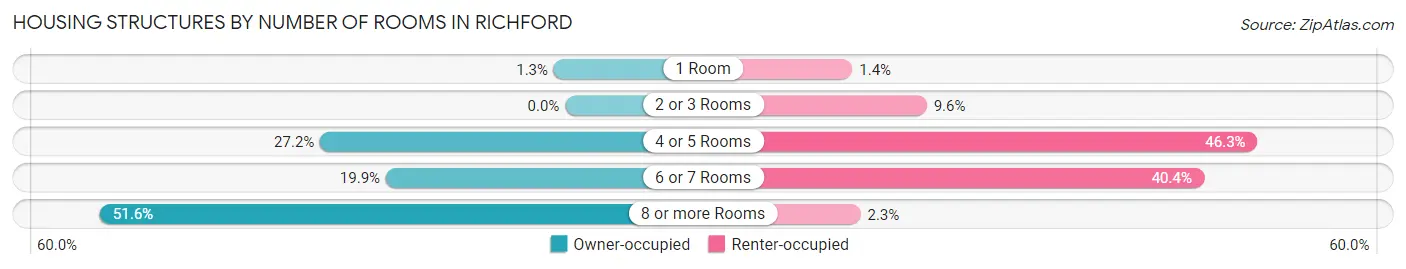
| Number of Rooms | Owner-occupied | Renter-occupied |
| 1 Room | 5 (1.3%) | 3 (1.4%) |
| 2 or 3 Rooms | 0 (0.0%) | 21 (9.6%) |
| 4 or 5 Rooms | 108 (27.2%) | 101 (46.3%) |
| 6 or 7 Rooms | 79 (19.9%) | 88 (40.4%) |
| 8 or more Rooms | 205 (51.6%) | 5 (2.3%) |
| Total | 397 (100.0%) | 218 (100.0%) |
Housing Structure by Heating Type in Richford
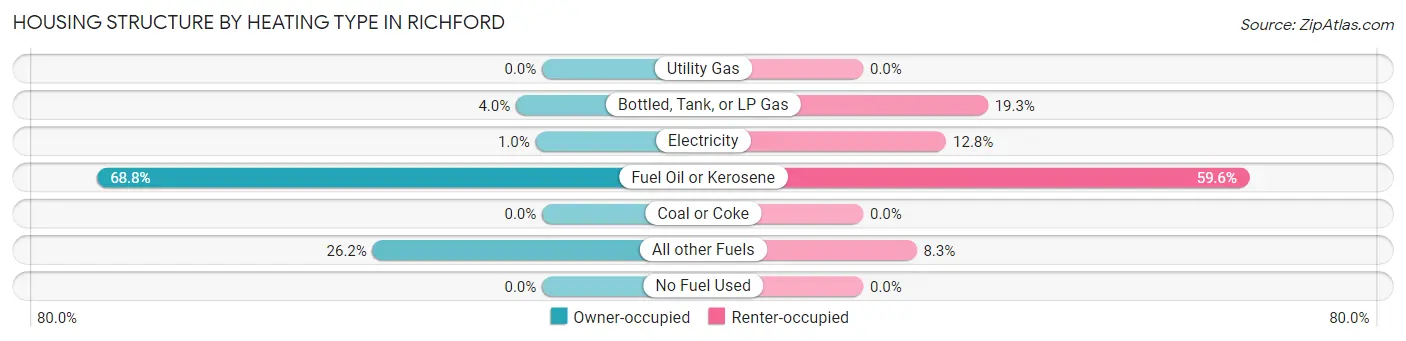
| Heating Type | Owner-occupied | Renter-occupied |
| Utility Gas | 0 (0.0%) | 0 (0.0%) |
| Bottled, Tank, or LP Gas | 16 (4.0%) | 42 (19.3%) |
| Electricity | 4 (1.0%) | 28 (12.8%) |
| Fuel Oil or Kerosene | 273 (68.8%) | 130 (59.6%) |
| Coal or Coke | 0 (0.0%) | 0 (0.0%) |
| All other Fuels | 104 (26.2%) | 18 (8.3%) |
| No Fuel Used | 0 (0.0%) | 0 (0.0%) |
| Total | 397 (100.0%) | 218 (100.0%) |
Household Vehicle Usage in Richford
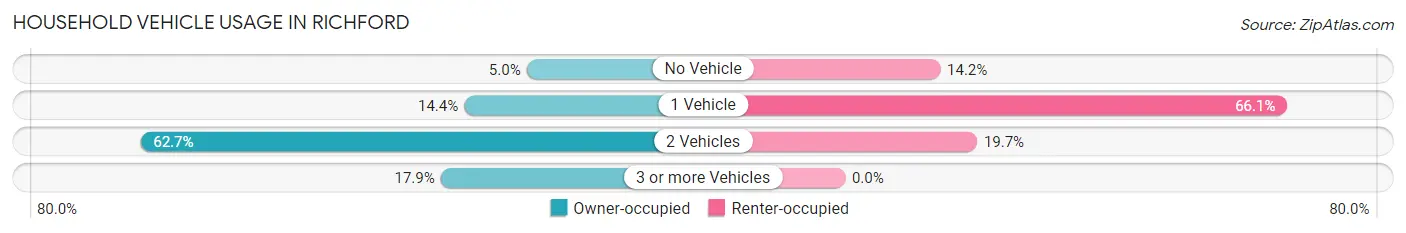
| Vehicles per Household | Owner-occupied | Renter-occupied |
| No Vehicle | 20 (5.0%) | 31 (14.2%) |
| 1 Vehicle | 57 (14.4%) | 144 (66.1%) |
| 2 Vehicles | 249 (62.7%) | 43 (19.7%) |
| 3 or more Vehicles | 71 (17.9%) | 0 (0.0%) |
| Total | 397 (100.0%) | 218 (100.0%) |
Real Estate & Mortgages in Richford
Real Estate and Mortgage Overview in Richford
| Characteristic | Without Mortgage | With Mortgage |
| Housing Units | 198 | 199 |
| Median Property Value | $129,200 | $160,900 |
| Median Household Income | $46,908 | $10 |
| Monthly Housing Costs | $618 | $0 |
| Real Estate Taxes | $2,218 | $0 |
Property Value by Mortgage Status in Richford
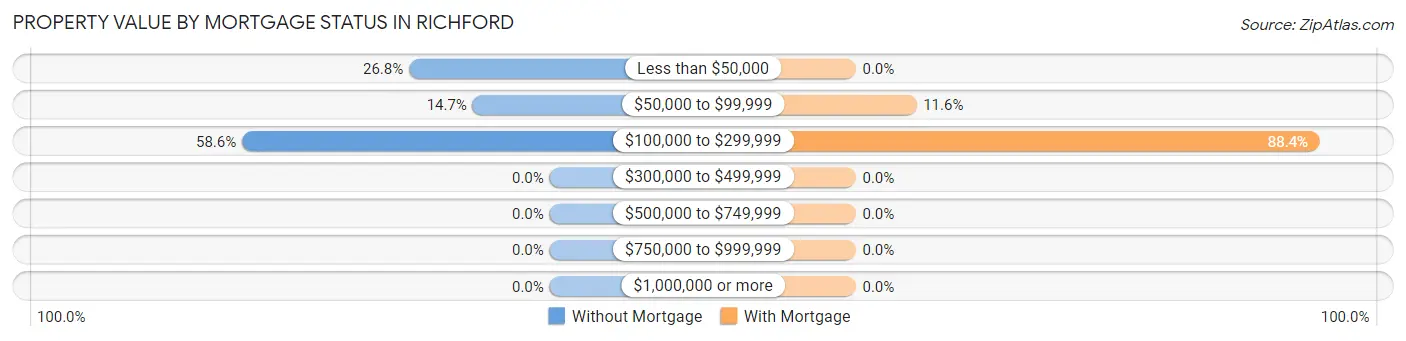
| Property Value | Without Mortgage | With Mortgage |
| Less than $50,000 | 53 (26.8%) | 0 (0.0%) |
| $50,000 to $99,999 | 29 (14.6%) | 23 (11.6%) |
| $100,000 to $299,999 | 116 (58.6%) | 176 (88.4%) |
| $300,000 to $499,999 | 0 (0.0%) | 0 (0.0%) |
| $500,000 to $749,999 | 0 (0.0%) | 0 (0.0%) |
| $750,000 to $999,999 | 0 (0.0%) | 0 (0.0%) |
| $1,000,000 or more | 0 (0.0%) | 0 (0.0%) |
| Total | 198 (100.0%) | 199 (100.0%) |
Household Income by Mortgage Status in Richford
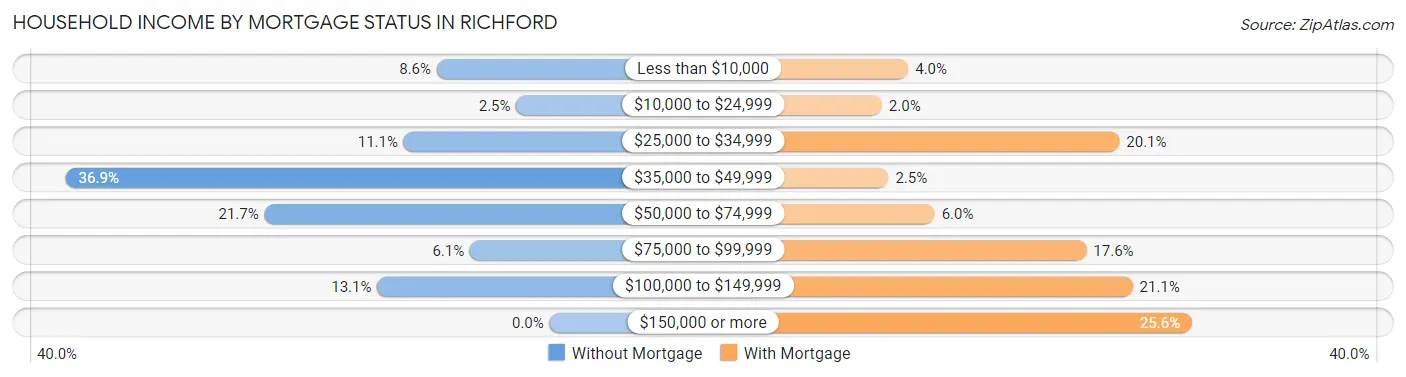
| Household Income | Without Mortgage | With Mortgage |
| Less than $10,000 | 17 (8.6%) | 8 (4.0%) |
| $10,000 to $24,999 | 5 (2.5%) | 4 (2.0%) |
| $25,000 to $34,999 | 22 (11.1%) | 40 (20.1%) |
| $35,000 to $49,999 | 73 (36.9%) | 5 (2.5%) |
| $50,000 to $74,999 | 43 (21.7%) | 12 (6.0%) |
| $75,000 to $99,999 | 12 (6.1%) | 35 (17.6%) |
| $100,000 to $149,999 | 26 (13.1%) | 42 (21.1%) |
| $150,000 or more | 0 (0.0%) | 51 (25.6%) |
| Total | 198 (100.0%) | 199 (100.0%) |
Property Value to Household Income Ratio in Richford
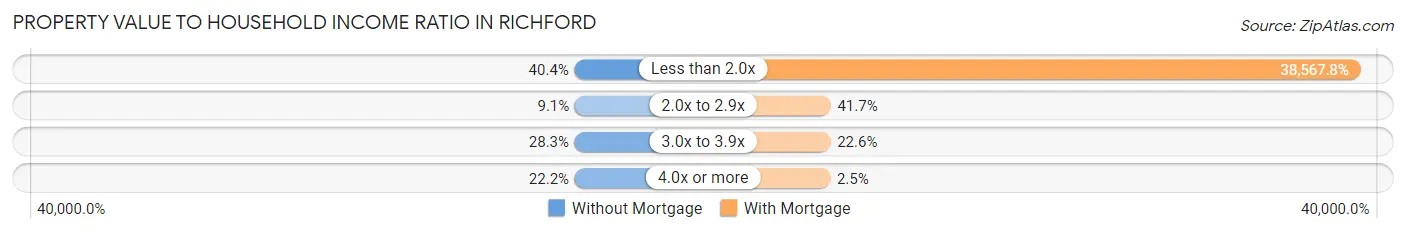
| Value-to-Income Ratio | Without Mortgage | With Mortgage |
| Less than 2.0x | 80 (40.4%) | 76,750 (38,567.8%) |
| 2.0x to 2.9x | 18 (9.1%) | 83 (41.7%) |
| 3.0x to 3.9x | 56 (28.3%) | 45 (22.6%) |
| 4.0x or more | 44 (22.2%) | 5 (2.5%) |
| Total | 198 (100.0%) | 199 (100.0%) |
Real Estate Taxes by Mortgage Status in Richford
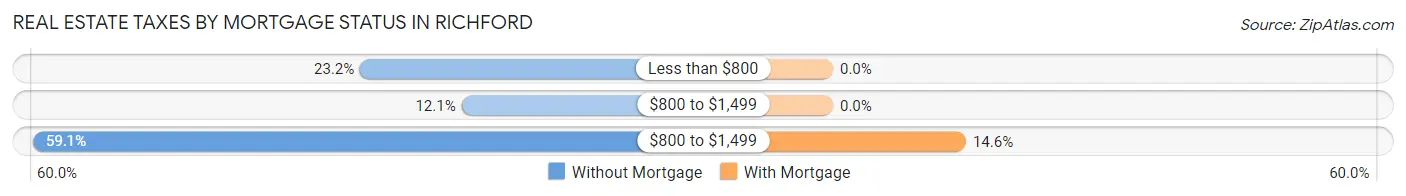
| Property Taxes | Without Mortgage | With Mortgage |
| Less than $800 | 46 (23.2%) | 0 (0.0%) |
| $800 to $1,499 | 24 (12.1%) | 0 (0.0%) |
| $800 to $1,499 | 117 (59.1%) | 29 (14.6%) |
| Total | 198 (100.0%) | 199 (100.0%) |
Health & Disability in Richford
Health Insurance Coverage by Age in Richford
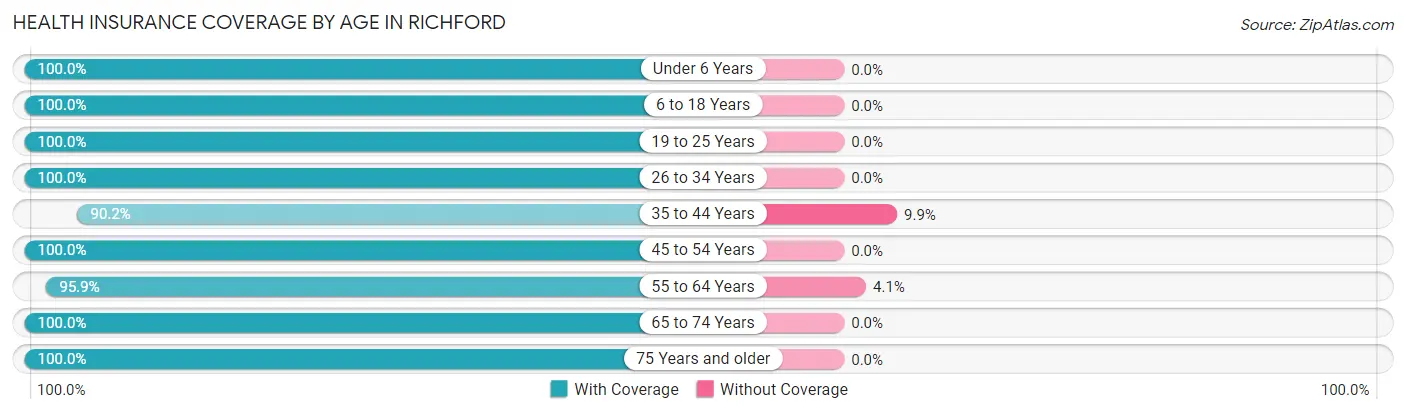
| Age Bracket | With Coverage | Without Coverage |
| Under 6 Years | 103 (100.0%) | 0 (0.0%) |
| 6 to 18 Years | 322 (100.0%) | 0 (0.0%) |
| 19 to 25 Years | 138 (100.0%) | 0 (0.0%) |
| 26 to 34 Years | 169 (100.0%) | 0 (0.0%) |
| 35 to 44 Years | 247 (90.1%) | 27 (9.9%) |
| 45 to 54 Years | 176 (100.0%) | 0 (0.0%) |
| 55 to 64 Years | 189 (95.9%) | 8 (4.1%) |
| 65 to 74 Years | 152 (100.0%) | 0 (0.0%) |
| 75 Years and older | 98 (100.0%) | 0 (0.0%) |
| Total | 1,594 (97.9%) | 35 (2.1%) |
Health Insurance Coverage by Citizenship Status in Richford
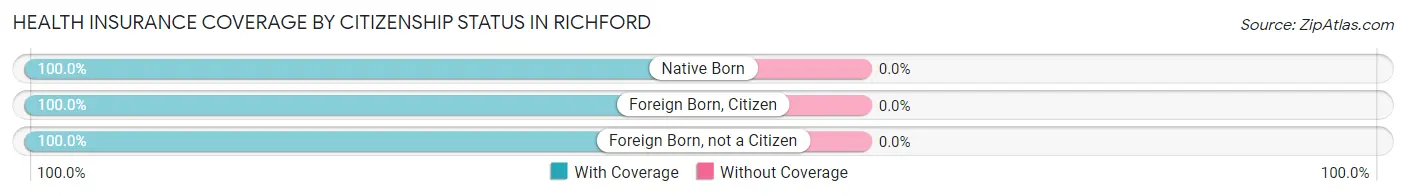
| Citizenship Status | With Coverage | Without Coverage |
| Native Born | 103 (100.0%) | 0 (0.0%) |
| Foreign Born, Citizen | 322 (100.0%) | 0 (0.0%) |
| Foreign Born, not a Citizen | 138 (100.0%) | 0 (0.0%) |
Health Insurance Coverage by Household Income in Richford
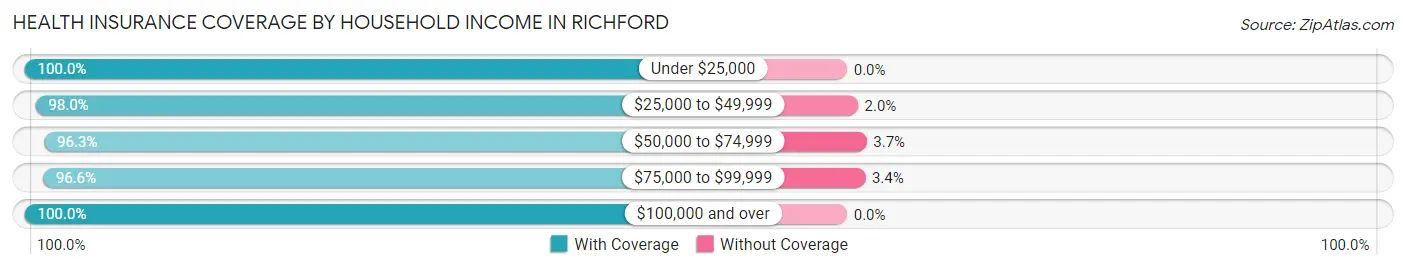
| Household Income | With Coverage | Without Coverage |
| Under $25,000 | 190 (100.0%) | 0 (0.0%) |
| $25,000 to $49,999 | 386 (98.0%) | 8 (2.0%) |
| $50,000 to $74,999 | 527 (96.3%) | 20 (3.7%) |
| $75,000 to $99,999 | 198 (96.6%) | 7 (3.4%) |
| $100,000 and over | 276 (100.0%) | 0 (0.0%) |
Public vs Private Health Insurance Coverage by Age in Richford
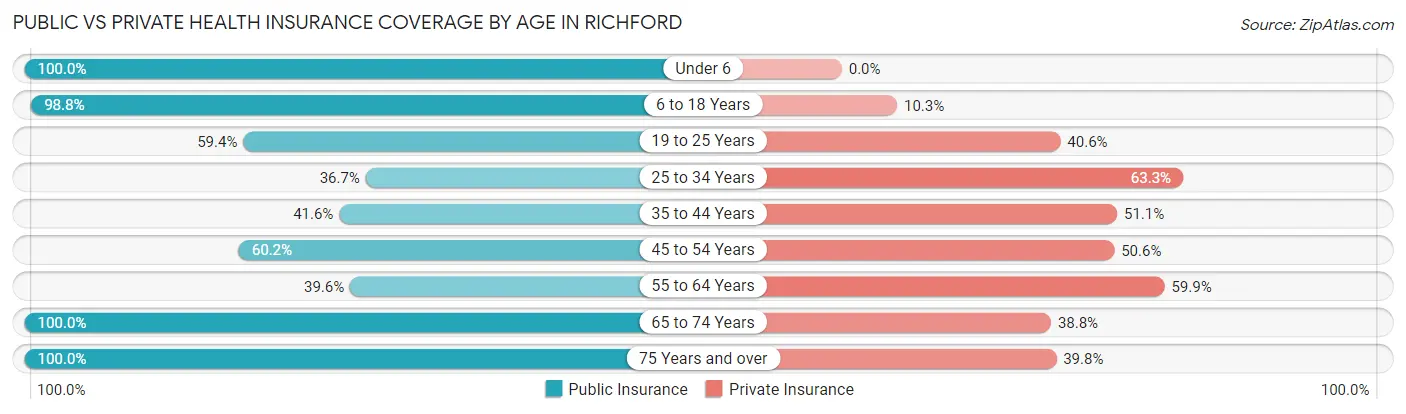
| Age Bracket | Public Insurance | Private Insurance |
| Under 6 | 103 (100.0%) | 0 (0.0%) |
| 6 to 18 Years | 318 (98.8%) | 33 (10.2%) |
| 19 to 25 Years | 82 (59.4%) | 56 (40.6%) |
| 25 to 34 Years | 62 (36.7%) | 107 (63.3%) |
| 35 to 44 Years | 114 (41.6%) | 140 (51.1%) |
| 45 to 54 Years | 106 (60.2%) | 89 (50.6%) |
| 55 to 64 Years | 78 (39.6%) | 118 (59.9%) |
| 65 to 74 Years | 152 (100.0%) | 59 (38.8%) |
| 75 Years and over | 98 (100.0%) | 39 (39.8%) |
| Total | 1,113 (68.3%) | 641 (39.4%) |
Disability Status by Sex by Age in Richford
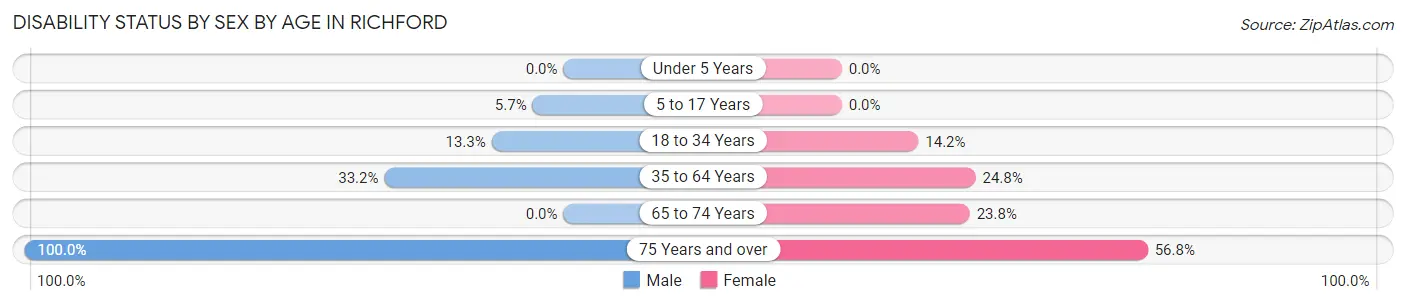
| Age Bracket | Male | Female |
| Under 5 Years | 0 (0.0%) | 0 (0.0%) |
| 5 to 17 Years | 15 (5.7%) | 0 (0.0%) |
| 18 to 34 Years | 18 (13.3%) | 26 (14.2%) |
| 35 to 64 Years | 116 (33.2%) | 74 (24.8%) |
| 65 to 74 Years | 0 (0.0%) | 19 (23.7%) |
| 75 Years and over | 17 (100.0%) | 46 (56.8%) |
Disability Class by Sex by Age in Richford
Disability Class: Hearing Difficulty
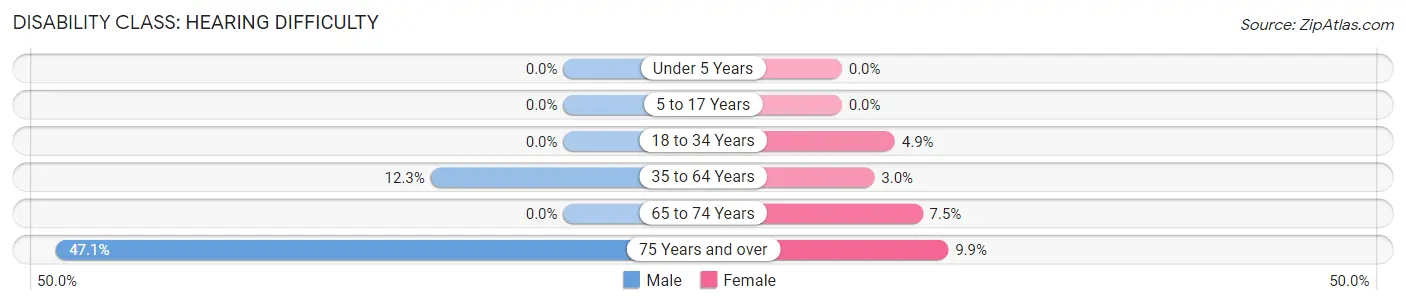
| Age Bracket | Male | Female |
| Under 5 Years | 0 (0.0%) | 0 (0.0%) |
| 5 to 17 Years | 0 (0.0%) | 0 (0.0%) |
| 18 to 34 Years | 0 (0.0%) | 9 (4.9%) |
| 35 to 64 Years | 43 (12.3%) | 9 (3.0%) |
| 65 to 74 Years | 0 (0.0%) | 6 (7.5%) |
| 75 Years and over | 8 (47.1%) | 8 (9.9%) |
Disability Class: Vision Difficulty
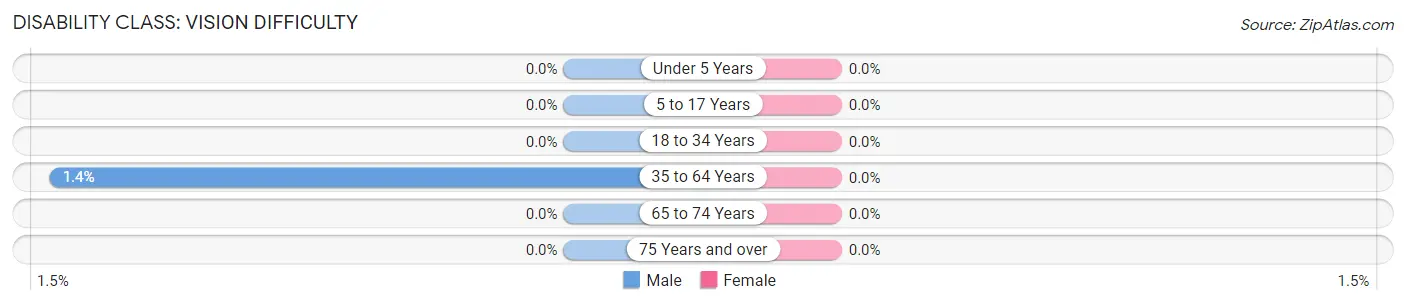
| Age Bracket | Male | Female |
| Under 5 Years | 0 (0.0%) | 0 (0.0%) |
| 5 to 17 Years | 0 (0.0%) | 0 (0.0%) |
| 18 to 34 Years | 0 (0.0%) | 0 (0.0%) |
| 35 to 64 Years | 5 (1.4%) | 0 (0.0%) |
| 65 to 74 Years | 0 (0.0%) | 0 (0.0%) |
| 75 Years and over | 0 (0.0%) | 0 (0.0%) |
Disability Class: Cognitive Difficulty
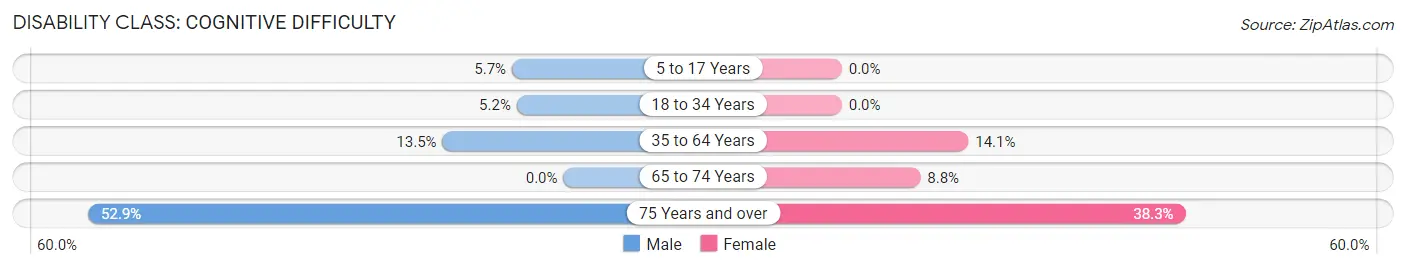
| Age Bracket | Male | Female |
| 5 to 17 Years | 15 (5.7%) | 0 (0.0%) |
| 18 to 34 Years | 7 (5.2%) | 0 (0.0%) |
| 35 to 64 Years | 47 (13.5%) | 42 (14.1%) |
| 65 to 74 Years | 0 (0.0%) | 7 (8.7%) |
| 75 Years and over | 9 (52.9%) | 31 (38.3%) |
Disability Class: Ambulatory Difficulty
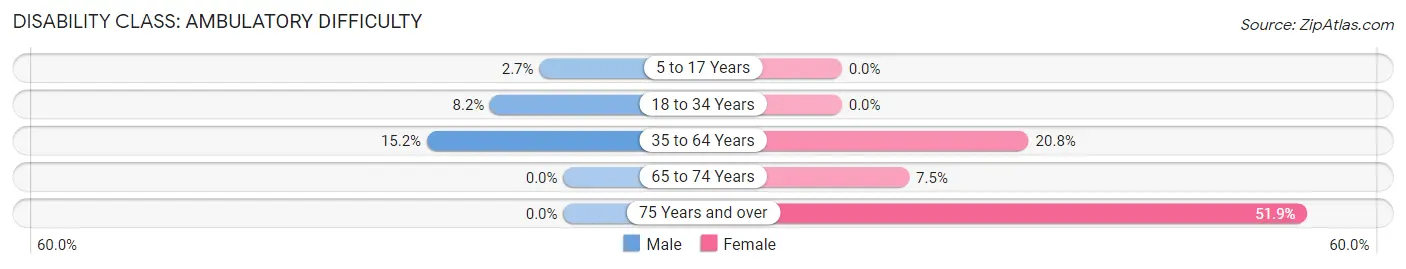
| Age Bracket | Male | Female |
| 5 to 17 Years | 7 (2.7%) | 0 (0.0%) |
| 18 to 34 Years | 11 (8.2%) | 0 (0.0%) |
| 35 to 64 Years | 53 (15.2%) | 62 (20.8%) |
| 65 to 74 Years | 0 (0.0%) | 6 (7.5%) |
| 75 Years and over | 0 (0.0%) | 42 (51.8%) |
Disability Class: Self-Care Difficulty
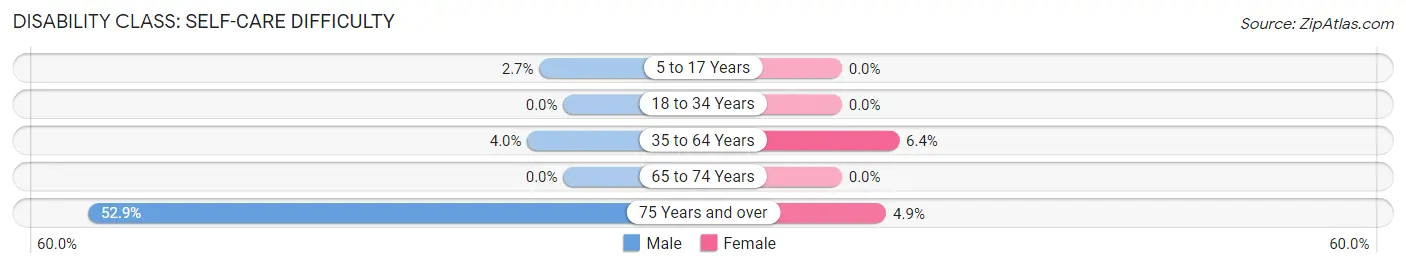
| Age Bracket | Male | Female |
| 5 to 17 Years | 7 (2.7%) | 0 (0.0%) |
| 18 to 34 Years | 0 (0.0%) | 0 (0.0%) |
| 35 to 64 Years | 14 (4.0%) | 19 (6.4%) |
| 65 to 74 Years | 0 (0.0%) | 0 (0.0%) |
| 75 Years and over | 9 (52.9%) | 4 (4.9%) |
Technology Access in Richford
Computing Device Access in Richford
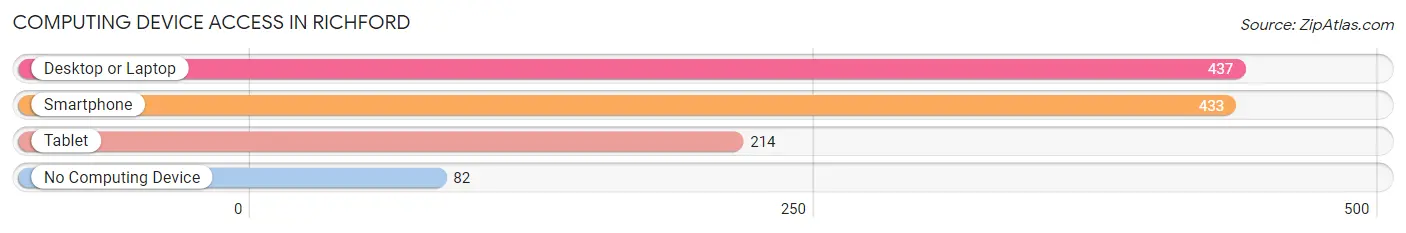
| Device Type | # Households | % Households |
| Desktop or Laptop | 437 | 71.1% |
| Smartphone | 433 | 70.4% |
| Tablet | 214 | 34.8% |
| No Computing Device | 82 | 13.3% |
| Total | 615 | 100.0% |
Internet Access in Richford
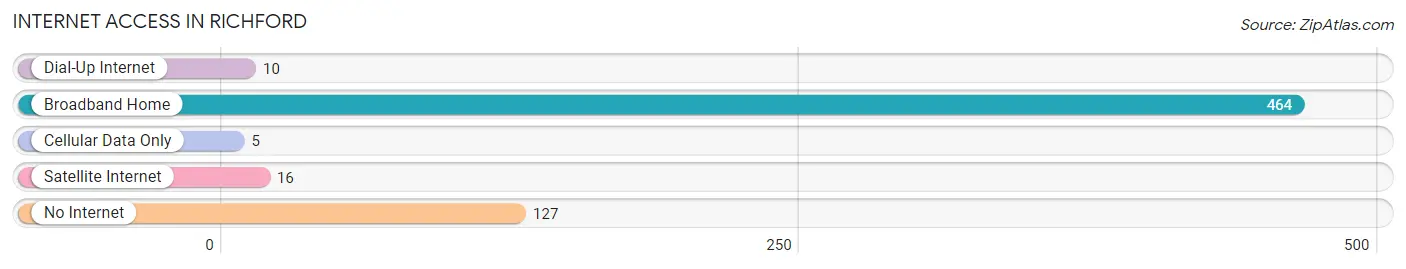
| Internet Type | # Households | % Households |
| Dial-Up Internet | 10 | 1.6% |
| Broadband Home | 464 | 75.4% |
| Cellular Data Only | 5 | 0.8% |
| Satellite Internet | 16 | 2.6% |
| No Internet | 127 | 20.6% |
| Total | 615 | 100.0% |
Richford Summary
Richford is a town located in Franklin County, Vermont, United States. The population was 1,845 at the 2010 census. Richford is located on the Canada–US border, directly across from the town of Stanstead, Quebec.
History
Richford was first settled in 1790 by a group of settlers from Massachusetts. The town was named after the Richford family, who were among the first settlers. The town was incorporated in 1820.
In the 19th century, Richford was an important stop on the stagecoach route between Montreal and Boston. The town was also a major center for the lumber industry, with several sawmills located in the area.
Geography
Richford is located in the northeastern corner of Franklin County, on the Canada–US border. The town is bordered to the north by the town of Stanstead, Quebec, to the east by the town of Montgomery, to the south by the town of Berkshire, and to the west by the town of Enosburg.
The Missisquoi River flows through the town, and the town is located in the Missisquoi Valley. The town is located in the Green Mountains, and the highest point in the town is the summit of Richford Mountain, at an elevation of 1,845 feet (562 m).
Economy
The economy of Richford is largely based on agriculture and tourism. The town is home to several dairy farms, as well as a number of apple orchards. The town is also home to several small businesses, including a sawmill, a maple syrup producer, and a furniture maker.
The town is also a popular tourist destination, with several bed and breakfasts located in the area. The town is home to several historic sites, including the Richford Historical Society Museum and the Richford Congregational Church.
Demographics
As of the 2010 census, there were 1,845 people, 745 households, and 486 families residing in the town. The population density was 44.3 people per square mile (17.1/km2). There were 817 housing units at an average density of 19.6 per square mile (7.6/km2). The racial makeup of the town was 97.2% White, 0.3% African American, 0.3% Native American, 0.3% Asian, 0.2% from other races, and 1.7% from two or more races. Hispanic or Latino of any race were 0.9% of the population.
There were 745 households, out of which 28.2% had children under the age of 18 living with them, 49.2% were married couples living together, 10.2% had a female householder with no husband present, and 35.2% were non-families. 29.2% of all households were made up of individuals, and 13.2% had someone living alone who was 65 years of age or older. The average household size was 2.41 and the average family size was 2.94.
In the town, the population was spread out, with 24.2% under the age of 18, 6.7% from 18 to 24, 25.3% from 25 to 44, 27.2% from 45 to 64, and 16.6% who were 65 years of age or older. The median age was 40 years. For every 100 females, there were 95.2 males. For every 100 females age 18 and over, there were 92.2 males.
The median income for a household in the town was $35,000, and the median income for a family was $41,250. Males had a median income of $30,000 versus $21,250 for females. The per capita income for the town was $17,845. About 8.2% of families and 11.2% of the population were below the poverty line, including 14.2% of those under age 18 and 8.2% of those age 65 or over.
Common Questions
What is Per Capita Income in Richford?
Per Capita income in Richford is $22,846.
What is the Median Family Income in Richford?
Median Family Income in Richford is $61,094.
What is the Median Household income in Richford?
Median Household Income in Richford is $52,679.
What is Income or Wage Gap in Richford?
Income or Wage Gap in Richford is 23.4%.
Women in Richford earn 76.6 cents for every dollar earned by a man.
What is Family Income Deficit in Richford?
Family Income Deficit in Richford is $11,069.
Families that are below poverty line in Richford earn $11,069 less on average than the poverty threshold level.
What is Inequality or Gini Index in Richford?
Inequality or Gini Index in Richford is 0.37.
What is the Total Population of Richford?
Total Population of Richford is 1,636.
What is the Total Male Population of Richford?
Total Male Population of Richford is 901.
What is the Total Female Population of Richford?
Total Female Population of Richford is 735.
What is the Ratio of Males per 100 Females in Richford?
There are 122.59 Males per 100 Females in Richford.
What is the Ratio of Females per 100 Males in Richford?
There are 81.58 Females per 100 Males in Richford.
What is the Median Population Age in Richford?
Median Population Age in Richford is 39.2 Years.
What is the Average Family Size in Richford
Average Family Size in Richford is 3.2 People.
What is the Average Household Size in Richford
Average Household Size in Richford is 2.6 People.
How Large is the Labor Force in Richford?
There are 653 People in the Labor Forcein in Richford.
What is the Percentage of People in the Labor Force in Richford?
49.9% of People are in the Labor Force in Richford.
What is the Unemployment Rate in Richford?
Unemployment Rate in Richford is 8.0%.