Zip Codes with the Highest Percentage of Households with Income Below $10,000 in Lynchburg, VA
RELATED REPORTS & OPTIONS
Household Income | $0-10k
Lynchburg
Compare Zip Codes
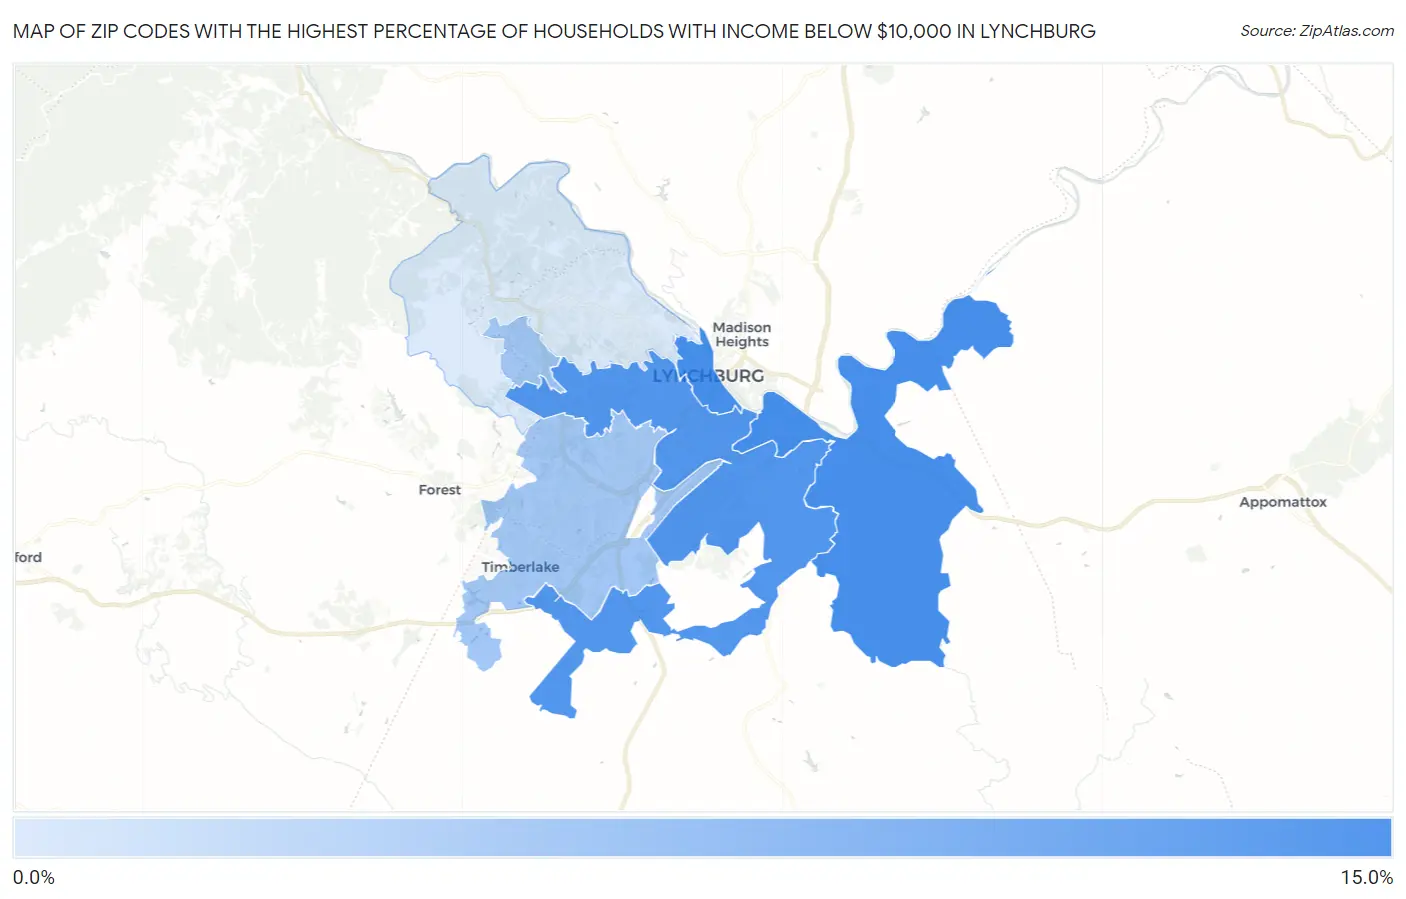
Map of Zip Codes with the Highest Percentage of Households with Income Below $10,000 in Lynchburg
2.3%
10.3%
Zip Codes with the Highest Percentage of Households with Income Below $10,000 in Lynchburg, VA
| Zip Code | Households with Income < $10k | vs State | vs National | |
| 1. | 24504 | 10.3% | 4.2%(+6.10)#83 | 4.9%(+5.40)#3,369 |
| 2. | 24501 | 9.6% | 4.2%(+5.40)#99 | 4.9%(+4.70)#3,874 |
| 3. | 24502 | 5.3% | 4.2%(+1.10)#275 | 4.9%(+0.400)#10,728 |
| 4. | 24503 | 2.3% | 4.2%(-1.90)#533 | 4.9%(-2.60)#22,487 |
1
Common Questions
What are the Top 3 Zip Codes with the Highest Percentage of Households with Income Below $10,000 in Lynchburg, VA?
Top 3 Zip Codes with the Highest Percentage of Households with Income Below $10,000 in Lynchburg, VA are:
What zip code has the Highest Percentage of Households with Income Below $10,000 in Lynchburg, VA?
24504 has the Highest Percentage of Households with Income Below $10,000 in Lynchburg, VA with 10.3%.
What is the Percentage of Households with Income Below $10,000 in Lynchburg, VA?
Percentage of Households with Income Below $10,000 in Lynchburg is 7.0%.
What is the Percentage of Households with Income Below $10,000 in Virginia?
Percentage of Households with Income Below $10,000 in Virginia is 4.2%.
What is the Percentage of Households with Income Below $10,000 in the United States?
Percentage of Households with Income Below $10,000 in the United States is 4.9%.