Zip Codes with the Highest Percentage of Population Employed in Health Diagnosing & Treating in Lynchburg, VA
RELATED REPORTS & OPTIONS
Health Diagnosing & Treating
Lynchburg
Compare Zip Codes
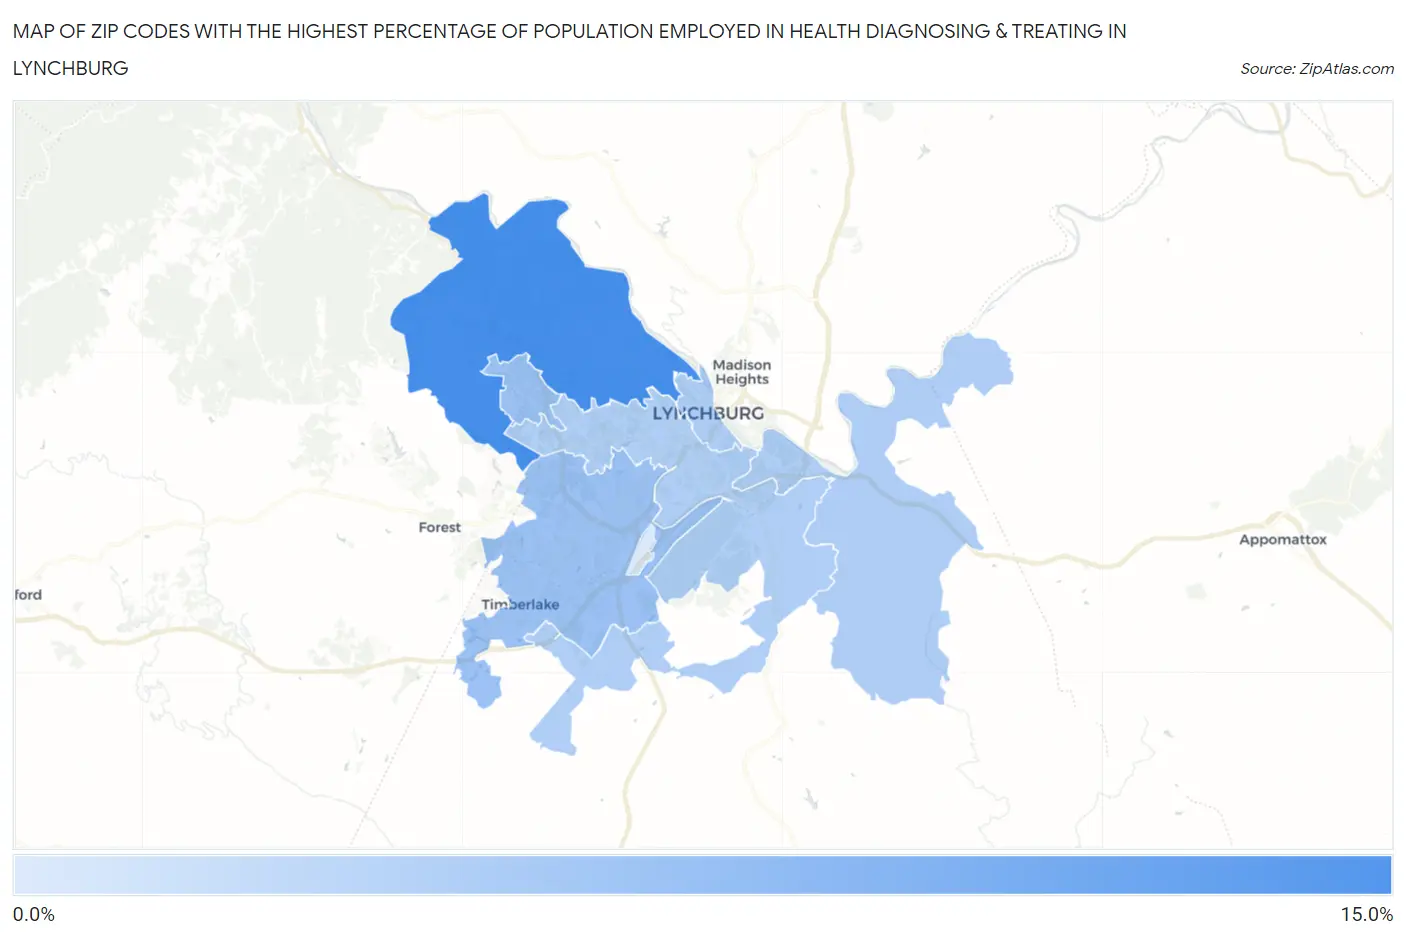
Map of Zip Codes with the Highest Percentage of Population Employed in Health Diagnosing & Treating in Lynchburg
1.1%
10.5%
Zip Codes with the Highest Percentage of Population Employed in Health Diagnosing & Treating in Lynchburg, VA
| Zip Code | % Employed | vs State | vs National | |
| 1. | 24503 | 10.5% | 5.7%(+4.82)#92 | 6.2%(+4.23)#3,332 |
| 2. | 24502 | 5.2% | 5.7%(-0.445)#398 | 6.2%(-1.03)#16,891 |
| 3. | 24504 | 3.9% | 5.7%(-1.72)#547 | 6.2%(-2.31)#21,577 |
| 4. | 24501 | 3.8% | 5.7%(-1.88)#560 | 6.2%(-2.47)#22,063 |
| 5. | 24515 | 1.1% | 5.7%(-4.57)#718 | 6.2%(-5.16)#27,744 |
1
Common Questions
What are the Top 3 Zip Codes with the Highest Percentage of Population Employed in Health Diagnosing & Treating in Lynchburg, VA?
Top 3 Zip Codes with the Highest Percentage of Population Employed in Health Diagnosing & Treating in Lynchburg, VA are:
What zip code has the Highest Percentage of Population Employed in Health Diagnosing & Treating in Lynchburg, VA?
24503 has the Highest Percentage of Population Employed in Health Diagnosing & Treating in Lynchburg, VA with 10.5%.
What is the Percentage of Population Employed in Health Diagnosing & Treating in Lynchburg, VA?
Percentage of Population Employed in Health Diagnosing & Treating in Lynchburg is 5.3%.
What is the Percentage of Population Employed in Health Diagnosing & Treating in Virginia?
Percentage of Population Employed in Health Diagnosing & Treating in Virginia is 5.7%.
What is the Percentage of Population Employed in Health Diagnosing & Treating in the United States?
Percentage of Population Employed in Health Diagnosing & Treating in the United States is 6.2%.