Zip Codes with the Highest Percentage of Households with Income Below $10,000 in Danville, VA
RELATED REPORTS & OPTIONS
Household Income | $0-10k
Danville
Compare Zip Codes
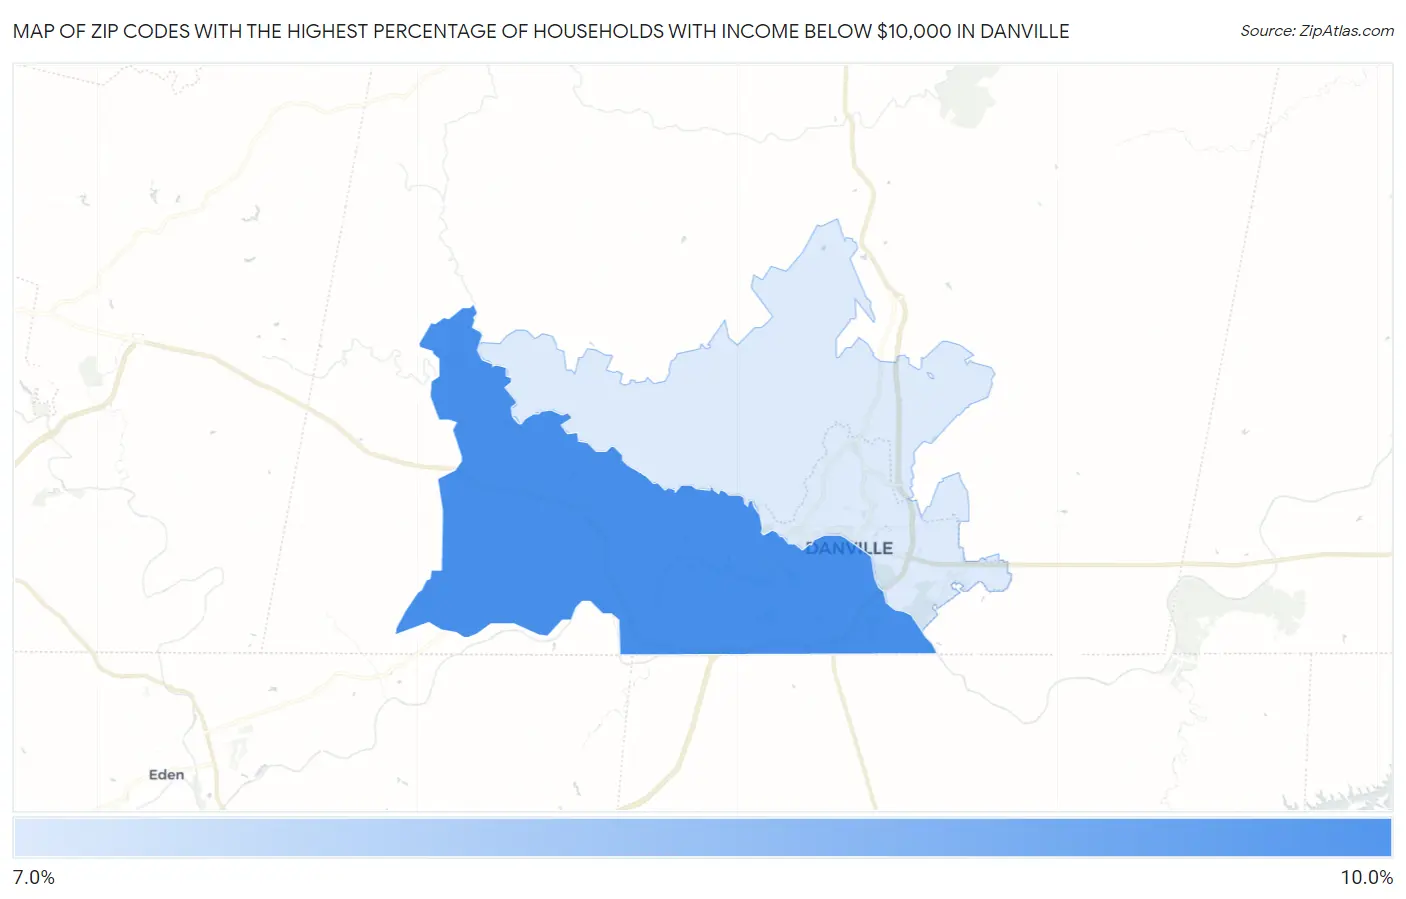
Map of Zip Codes with the Highest Percentage of Households with Income Below $10,000 in Danville
7.9%
8.4%
Zip Codes with the Highest Percentage of Households with Income Below $10,000 in Danville, VA
| Zip Code | Households with Income < $10k | vs State | vs National | |
| 1. | 24541 | 8.4% | 4.2%(+4.20)#125 | 4.9%(+3.50)#5,028 |
| 2. | 24540 | 7.9% | 4.2%(+3.70)#142 | 4.9%(+3.00)#5,679 |
1
Common Questions
What are the Top Zip Codes with the Highest Percentage of Households with Income Below $10,000 in Danville, VA?
Top Zip Codes with the Highest Percentage of Households with Income Below $10,000 in Danville, VA are:
What zip code has the Highest Percentage of Households with Income Below $10,000 in Danville, VA?
24541 has the Highest Percentage of Households with Income Below $10,000 in Danville, VA with 8.4%.
What is the Percentage of Households with Income Below $10,000 in Danville, VA?
Percentage of Households with Income Below $10,000 in Danville is 9.4%.
What is the Percentage of Households with Income Below $10,000 in Virginia?
Percentage of Households with Income Below $10,000 in Virginia is 4.2%.
What is the Percentage of Households with Income Below $10,000 in the United States?
Percentage of Households with Income Below $10,000 in the United States is 4.9%.