Zip Codes with the Highest Percentage of Households with Income Below $10,000 in Warrenton, VA
RELATED REPORTS & OPTIONS
Household Income | $0-10k
Warrenton
Compare Zip Codes
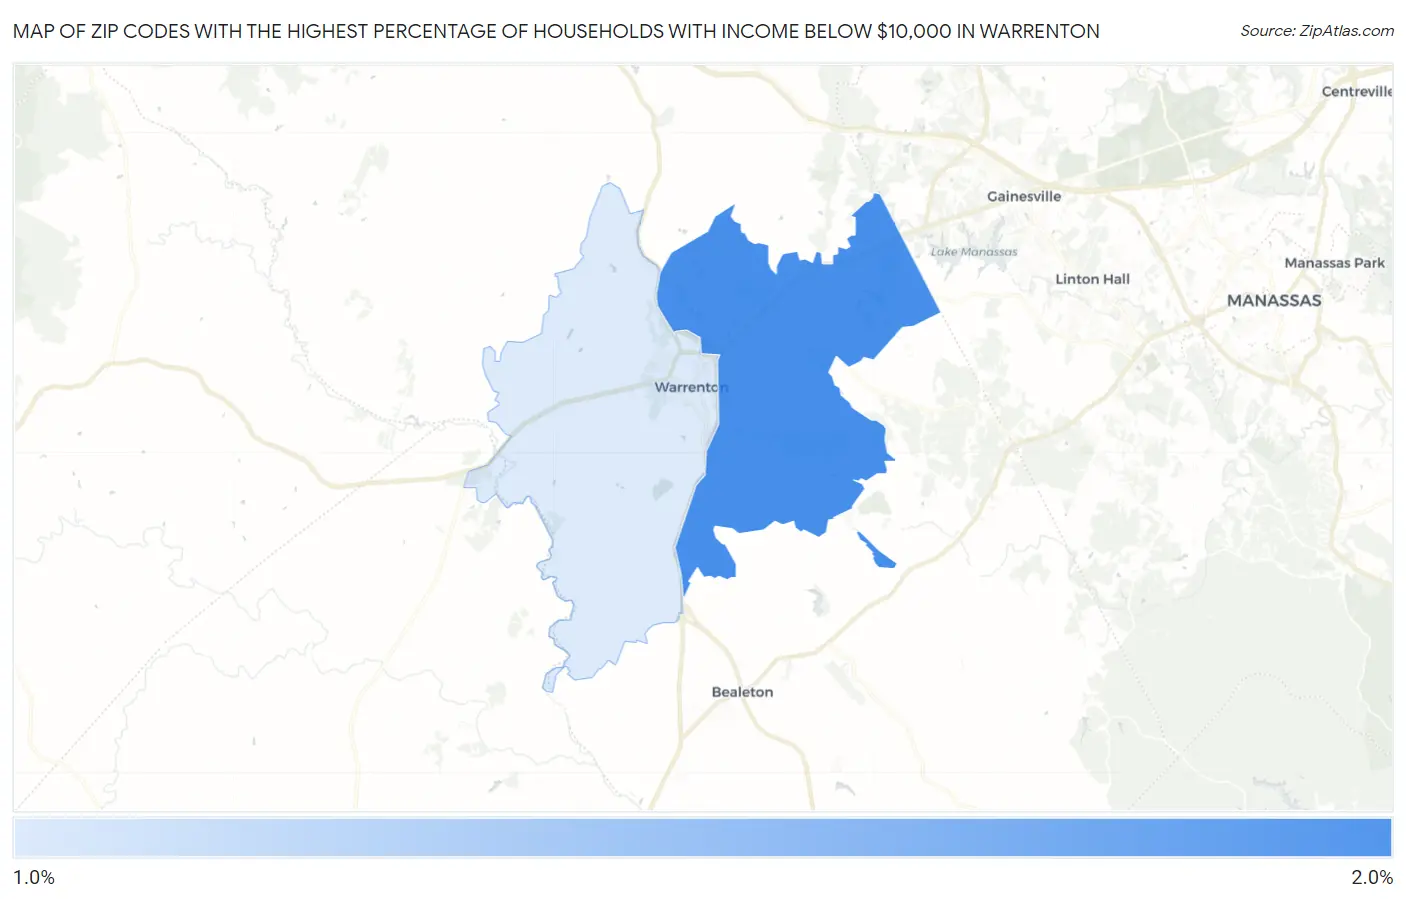
Map of Zip Codes with the Highest Percentage of Households with Income Below $10,000 in Warrenton
1.5%
1.8%
Zip Codes with the Highest Percentage of Households with Income Below $10,000 in Warrenton, VA
| Zip Code | Households with Income < $10k | vs State | vs National | |
| 1. | 20187 | 1.8% | 4.2%(-2.40)#588 | 4.9%(-3.10)#24,391 |
| 2. | 20186 | 1.5% | 4.2%(-2.70)#617 | 4.9%(-3.40)#25,455 |
1
Common Questions
What are the Top Zip Codes with the Highest Percentage of Households with Income Below $10,000 in Warrenton, VA?
Top Zip Codes with the Highest Percentage of Households with Income Below $10,000 in Warrenton, VA are:
What zip code has the Highest Percentage of Households with Income Below $10,000 in Warrenton, VA?
20187 has the Highest Percentage of Households with Income Below $10,000 in Warrenton, VA with 1.8%.
What is the Percentage of Households with Income Below $10,000 in Warrenton, VA?
Percentage of Households with Income Below $10,000 in Warrenton is 2.2%.
What is the Percentage of Households with Income Below $10,000 in Virginia?
Percentage of Households with Income Below $10,000 in Virginia is 4.2%.
What is the Percentage of Households with Income Below $10,000 in the United States?
Percentage of Households with Income Below $10,000 in the United States is 4.9%.