Zip Codes with the Highest Percentage of Population Employed in Security & Protection in Lynchburg, VA
RELATED REPORTS & OPTIONS
Security & Protection
Lynchburg
Compare Zip Codes
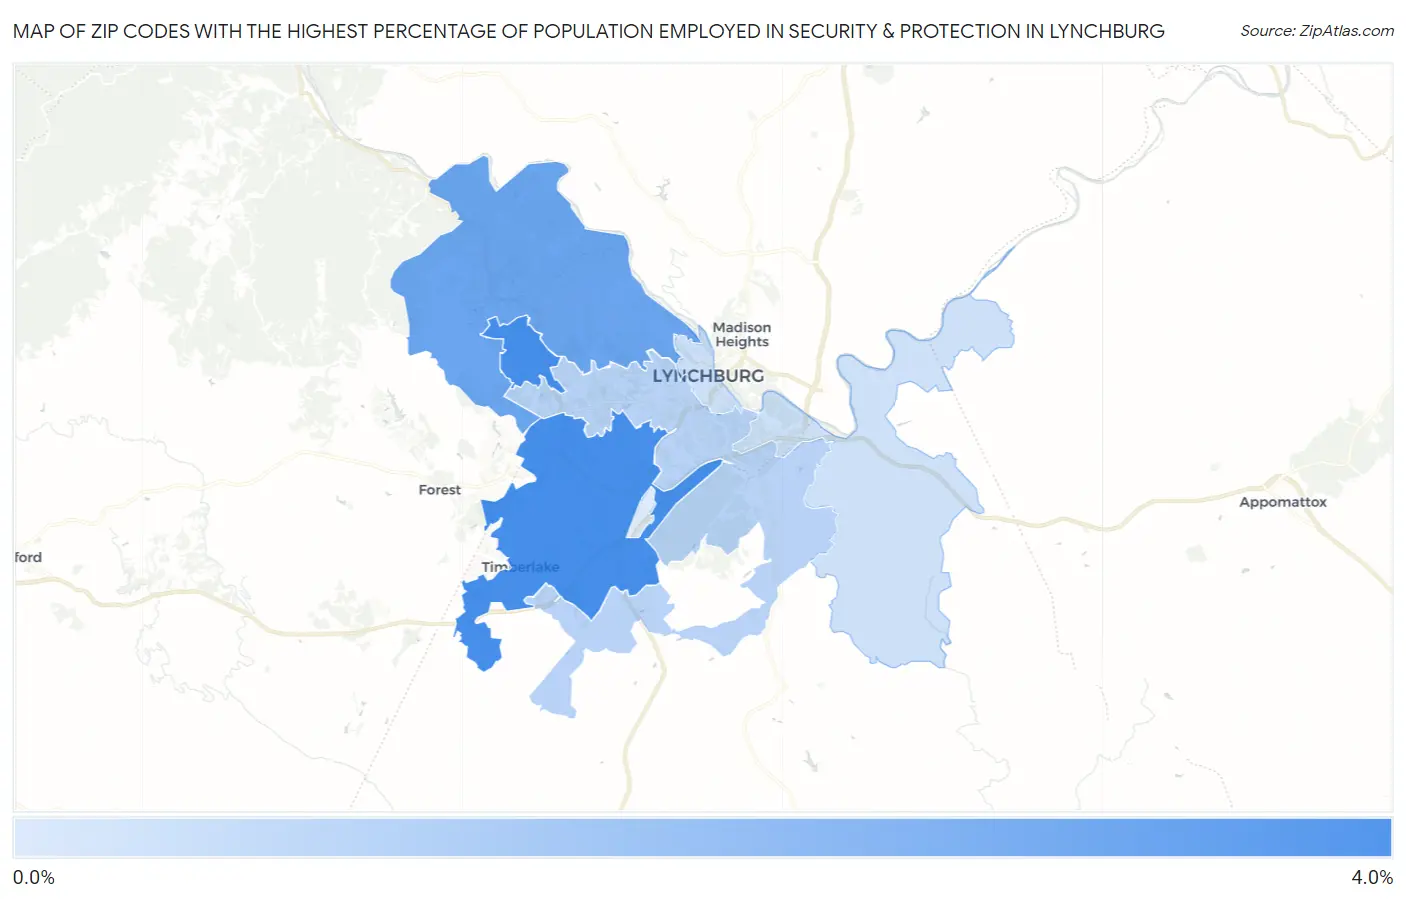
Map of Zip Codes with the Highest Percentage of Population Employed in Security & Protection in Lynchburg
0.57%
3.1%
Zip Codes with the Highest Percentage of Population Employed in Security & Protection in Lynchburg, VA
| Zip Code | % Employed | vs State | vs National | |
| 1. | 24502 | 3.1% | 2.7%(+0.416)#280 | 2.1%(+0.950)#6,892 |
| 2. | 24503 | 2.5% | 2.7%(-0.206)#376 | 2.1%(+0.327)#9,641 |
| 3. | 24501 | 1.2% | 2.7%(-1.50)#570 | 2.1%(-0.968)#18,667 |
| 4. | 24504 | 0.79% | 2.7%(-1.90)#609 | 2.1%(-1.36)#21,490 |
| 5. | 24515 | 0.57% | 2.7%(-2.11)#630 | 2.1%(-1.58)#22,836 |
1
Common Questions
What are the Top 3 Zip Codes with the Highest Percentage of Population Employed in Security & Protection in Lynchburg, VA?
Top 3 Zip Codes with the Highest Percentage of Population Employed in Security & Protection in Lynchburg, VA are:
What zip code has the Highest Percentage of Population Employed in Security & Protection in Lynchburg, VA?
24502 has the Highest Percentage of Population Employed in Security & Protection in Lynchburg, VA with 3.1%.
What is the Percentage of Population Employed in Security & Protection in Lynchburg, VA?
Percentage of Population Employed in Security & Protection in Lynchburg is 2.4%.
What is the Percentage of Population Employed in Security & Protection in Virginia?
Percentage of Population Employed in Security & Protection in Virginia is 2.7%.
What is the Percentage of Population Employed in Security & Protection in the United States?
Percentage of Population Employed in Security & Protection in the United States is 2.1%.