Zip Codes with the Highest Percentage of Population Employed in Accommodation & Food Services in Lynchburg, VA
RELATED REPORTS & OPTIONS
Accommodation & Food Services
Lynchburg
Compare Zip Codes
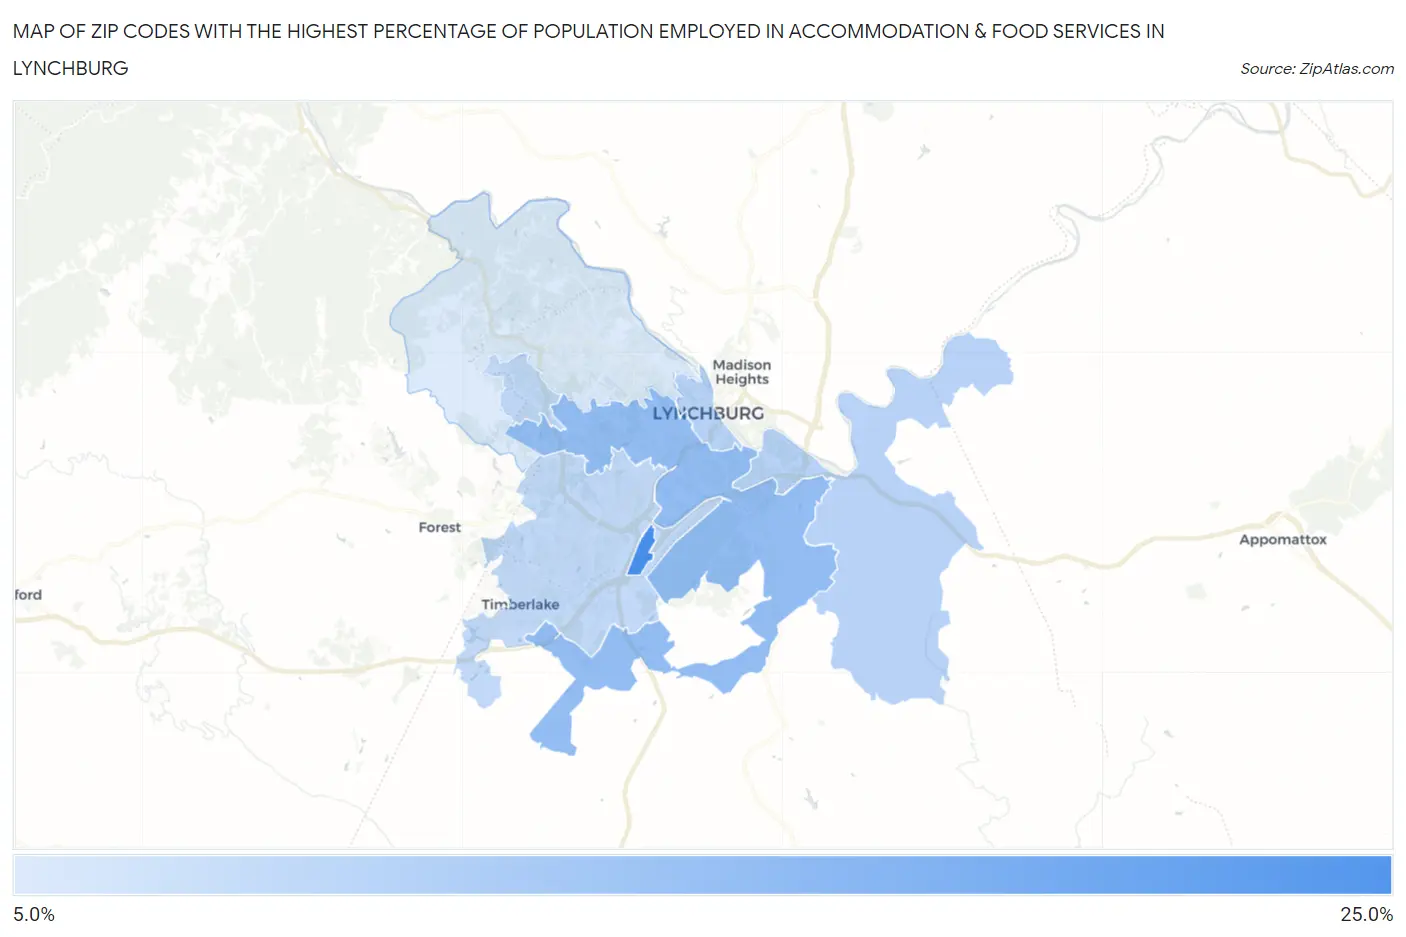
Map of Zip Codes with the Highest Percentage of Population Employed in Accommodation & Food Services in Lynchburg
5.0%
21.7%
Zip Codes with the Highest Percentage of Population Employed in Accommodation & Food Services in Lynchburg, VA
| Zip Code | % Employed | vs State | vs National | |
| 1. | 24515 | 21.7% | 6.4%(+15.3)#21 | 6.9%(+14.8)#695 |
| 2. | 24501 | 13.0% | 6.4%(+6.57)#65 | 6.9%(+6.13)#2,346 |
| 3. | 24504 | 8.8% | 6.4%(+2.36)#161 | 6.9%(+1.92)#6,276 |
| 4. | 24502 | 7.9% | 6.4%(+1.50)#205 | 6.9%(+1.06)#7,946 |
| 5. | 24503 | 5.0% | 6.4%(-1.42)#438 | 6.9%(-1.86)#16,760 |
1
Common Questions
What are the Top 3 Zip Codes with the Highest Percentage of Population Employed in Accommodation & Food Services in Lynchburg, VA?
Top 3 Zip Codes with the Highest Percentage of Population Employed in Accommodation & Food Services in Lynchburg, VA are:
What zip code has the Highest Percentage of Population Employed in Accommodation & Food Services in Lynchburg, VA?
24515 has the Highest Percentage of Population Employed in Accommodation & Food Services in Lynchburg, VA with 21.7%.
What is the Percentage of Population Employed in Accommodation & Food Services in Lynchburg, VA?
Percentage of Population Employed in Accommodation & Food Services in Lynchburg is 10.0%.
What is the Percentage of Population Employed in Accommodation & Food Services in Virginia?
Percentage of Population Employed in Accommodation & Food Services in Virginia is 6.4%.
What is the Percentage of Population Employed in Accommodation & Food Services in the United States?
Percentage of Population Employed in Accommodation & Food Services in the United States is 6.9%.