Zip Codes with the Highest Percentage of Population Employed in Legal Services & Support in Lynchburg, VA
RELATED REPORTS & OPTIONS
Legal Services & Support
Lynchburg
Compare Zip Codes
Map of Zip Codes with the Highest Percentage of Population Employed in Legal Services & Support in Lynchburg
0.19%
1.5%
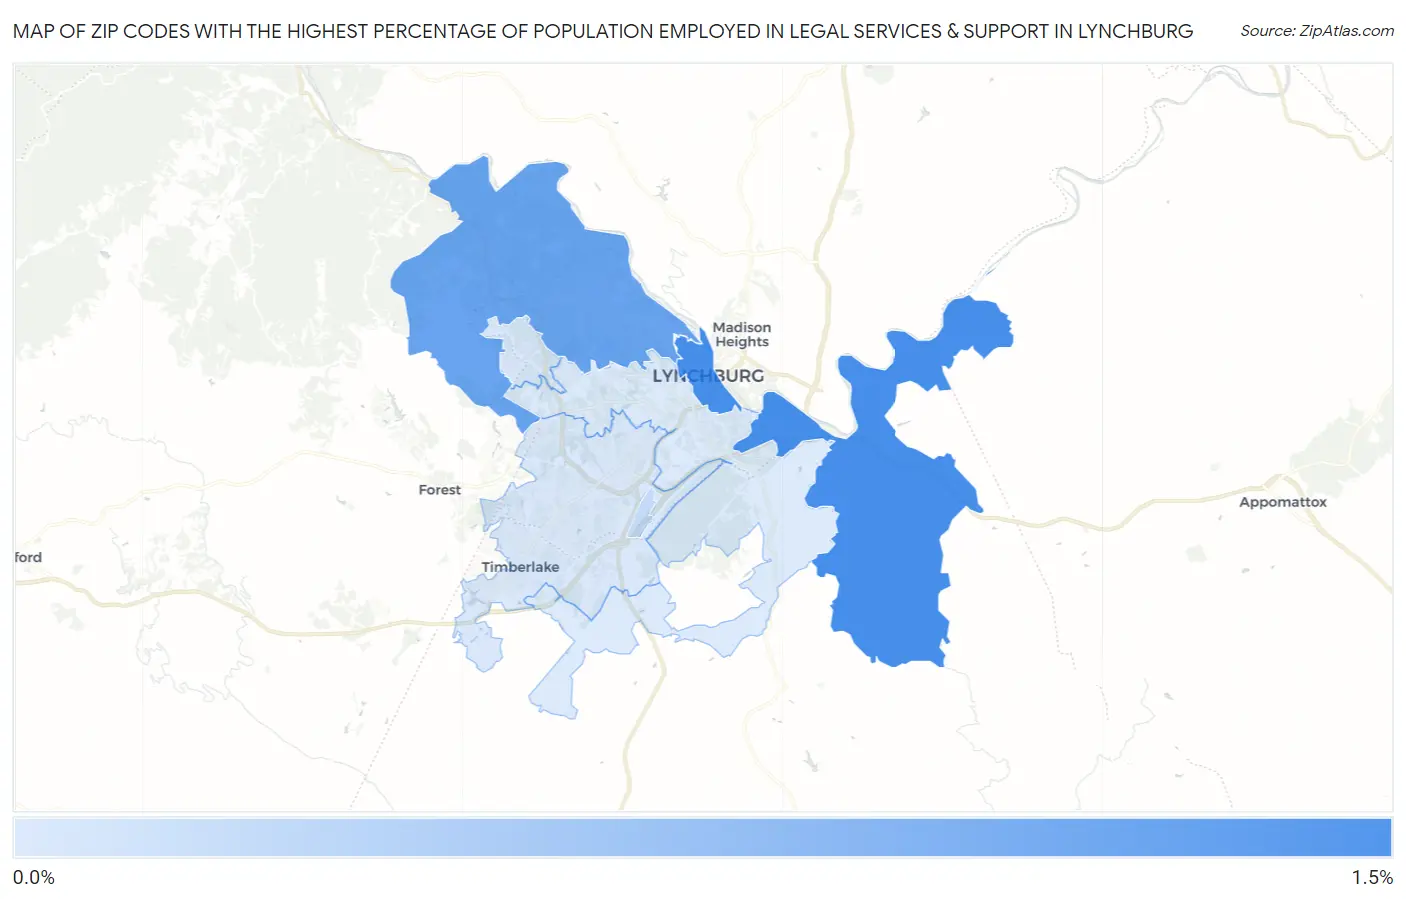
Zip Codes with the Highest Percentage of Population Employed in Legal Services & Support in Lynchburg, VA
| Zip Code | % Employed | vs State | vs National | |
| 1. | 24504 | 1.5% | 1.6%(-0.151)#183 | 1.2%(+0.288)#5,165 |
| 2. | 24503 | 1.2% | 1.6%(-0.457)#227 | 1.2%(-0.019)#6,740 |
| 3. | 24515 | 0.40% | 1.6%(-1.22)#381 | 1.2%(-0.785)#13,846 |
| 4. | 24502 | 0.22% | 1.6%(-1.40)#429 | 1.2%(-0.964)#15,988 |
| 5. | 24501 | 0.19% | 1.6%(-1.43)#434 | 1.2%(-0.993)#16,285 |
1
Common Questions
What are the Top 3 Zip Codes with the Highest Percentage of Population Employed in Legal Services & Support in Lynchburg, VA?
Top 3 Zip Codes with the Highest Percentage of Population Employed in Legal Services & Support in Lynchburg, VA are:
What zip code has the Highest Percentage of Population Employed in Legal Services & Support in Lynchburg, VA?
24504 has the Highest Percentage of Population Employed in Legal Services & Support in Lynchburg, VA with 1.5%.
What is the Percentage of Population Employed in Legal Services & Support in Lynchburg, VA?
Percentage of Population Employed in Legal Services & Support in Lynchburg is 0.64%.
What is the Percentage of Population Employed in Legal Services & Support in Virginia?
Percentage of Population Employed in Legal Services & Support in Virginia is 1.6%.
What is the Percentage of Population Employed in Legal Services & Support in the United States?
Percentage of Population Employed in Legal Services & Support in the United States is 1.2%.