Zip Codes with the Highest Percentage of Population with a Degree in Liberal Arts and History in Lynchburg, VA
RELATED REPORTS & OPTIONS
Liberal Arts and History
Lynchburg
Compare Zip Codes
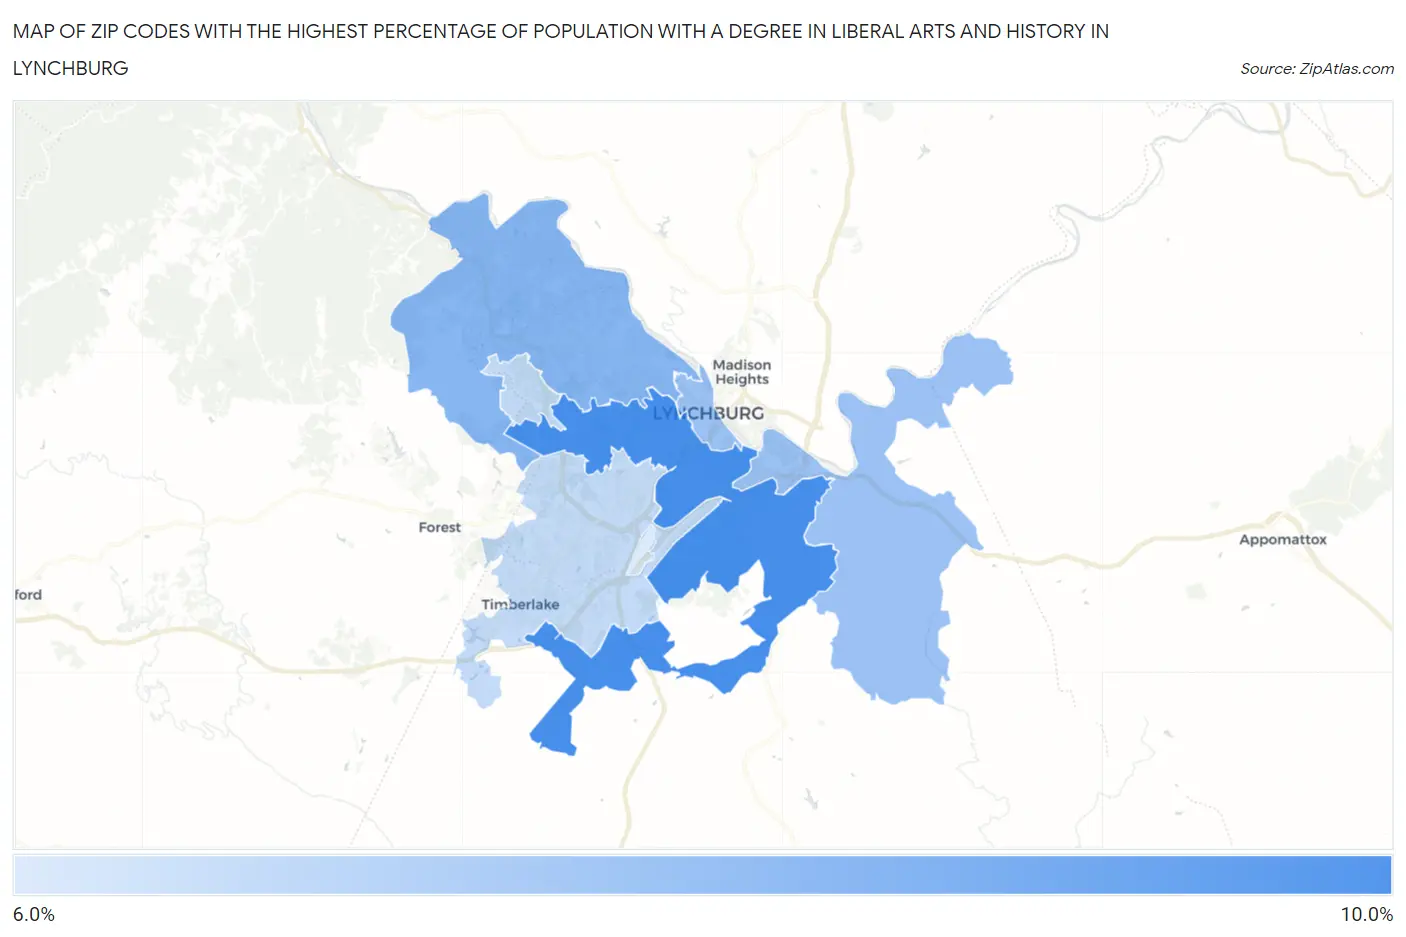
Map of Zip Codes with the Highest Percentage of Population with a Degree in Liberal Arts and History in Lynchburg
6.9%
8.8%
Zip Codes with the Highest Percentage of Population with a Degree in Liberal Arts and History in Lynchburg, VA
| Zip Code | % Graduates | vs State | vs National | |
| 1. | 24501 | 8.8% | 5.9%(+2.94)#168 | 4.9%(+3.92)#4,039 |
| 2. | 24503 | 8.0% | 5.9%(+2.11)#213 | 4.9%(+3.10)#4,937 |
| 3. | 24504 | 7.7% | 5.9%(+1.85)#228 | 4.9%(+2.83)#5,296 |
| 4. | 24502 | 7.2% | 5.9%(+1.37)#255 | 4.9%(+2.35)#6,010 |
| 5. | 24515 | 6.9% | 5.9%(+1.04)#274 | 4.9%(+2.02)#6,556 |
1
Common Questions
What are the Top 3 Zip Codes with the Highest Percentage of Population with a Degree in Liberal Arts and History in Lynchburg, VA?
Top 3 Zip Codes with the Highest Percentage of Population with a Degree in Liberal Arts and History in Lynchburg, VA are:
What zip code has the Highest Percentage of Population with a Degree in Liberal Arts and History in Lynchburg, VA?
24501 has the Highest Percentage of Population with a Degree in Liberal Arts and History in Lynchburg, VA with 8.8%.
What is the Percentage of Population with a Degree in Liberal Arts and History in Lynchburg, VA?
Percentage of Population with a Degree in Liberal Arts and History in Lynchburg is 7.0%.
What is the Percentage of Population with a Degree in Liberal Arts and History in Virginia?
Percentage of Population with a Degree in Liberal Arts and History in Virginia is 5.9%.
What is the Percentage of Population with a Degree in Liberal Arts and History in the United States?
Percentage of Population with a Degree in Liberal Arts and History in the United States is 4.9%.