Eastville, VA Map & Demographics
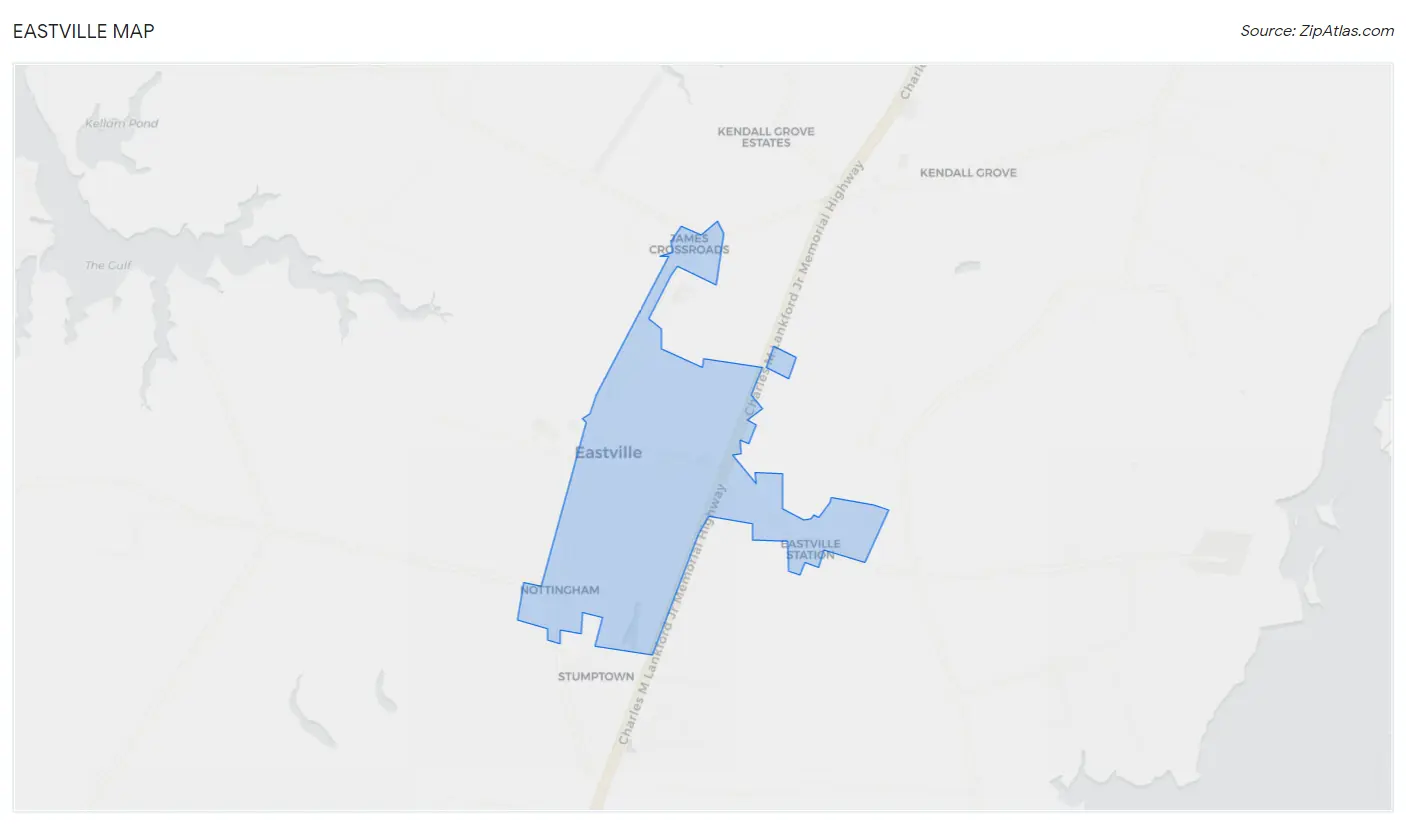
Eastville Map
Eastville Overview
$40,384
PER CAPITA INCOME
$74,375
AVG FAMILY INCOME
$54,118
AVG HOUSEHOLD INCOME
3.8%
WAGE / INCOME GAP [ % ]
96.2¢/ $1
WAGE / INCOME GAP [ $ ]
0.34
INEQUALITY / GINI INDEX
316
TOTAL POPULATION
144
MALE POPULATION
172
FEMALE POPULATION
83.72
MALES / 100 FEMALES
119.44
FEMALES / 100 MALES
56.4
MEDIAN AGE
3.0
AVG FAMILY SIZE
1.8
AVG HOUSEHOLD SIZE
171
LABOR FORCE [ PEOPLE ]
66.0%
PERCENT IN LABOR FORCE
1.8%
UNEMPLOYMENT RATE
Eastville Zip Codes
Eastville Area Codes
Income in Eastville
Income Overview in Eastville
Per Capita Income in Eastville is $40,384, while median incomes of families and households are $74,375 and $54,118 respectively.
| Characteristic | Number | Measure |
| Per Capita Income | 316 | $40,384 |
| Median Family Income | 64 | $74,375 |
| Mean Family Income | 64 | $94,075 |
| Median Household Income | 180 | $54,118 |
| Mean Household Income | 180 | $72,077 |
| Income Deficit | 64 | $0 |
| Wage / Income Gap (%) | 316 | 3.84% |
| Wage / Income Gap ($) | 316 | 96.16¢ per $1 |
| Gini / Inequality Index | 316 | 0.34 |
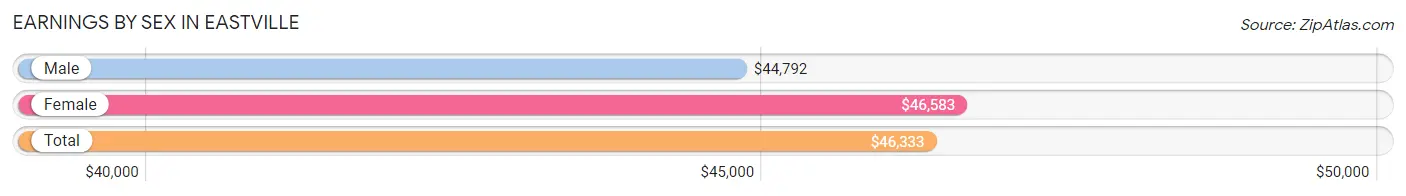
Earnings by Sex in Eastville
Average Earnings in Eastville are $46,333, $44,792 for men and $46,583 for women, a difference of 3.8%.
| Sex | Number | Average Earnings |
| Male | 91 (52.9%) | $44,792 |
| Female | 81 (47.1%) | $46,583 |
| Total | 172 (100.0%) | $46,333 |
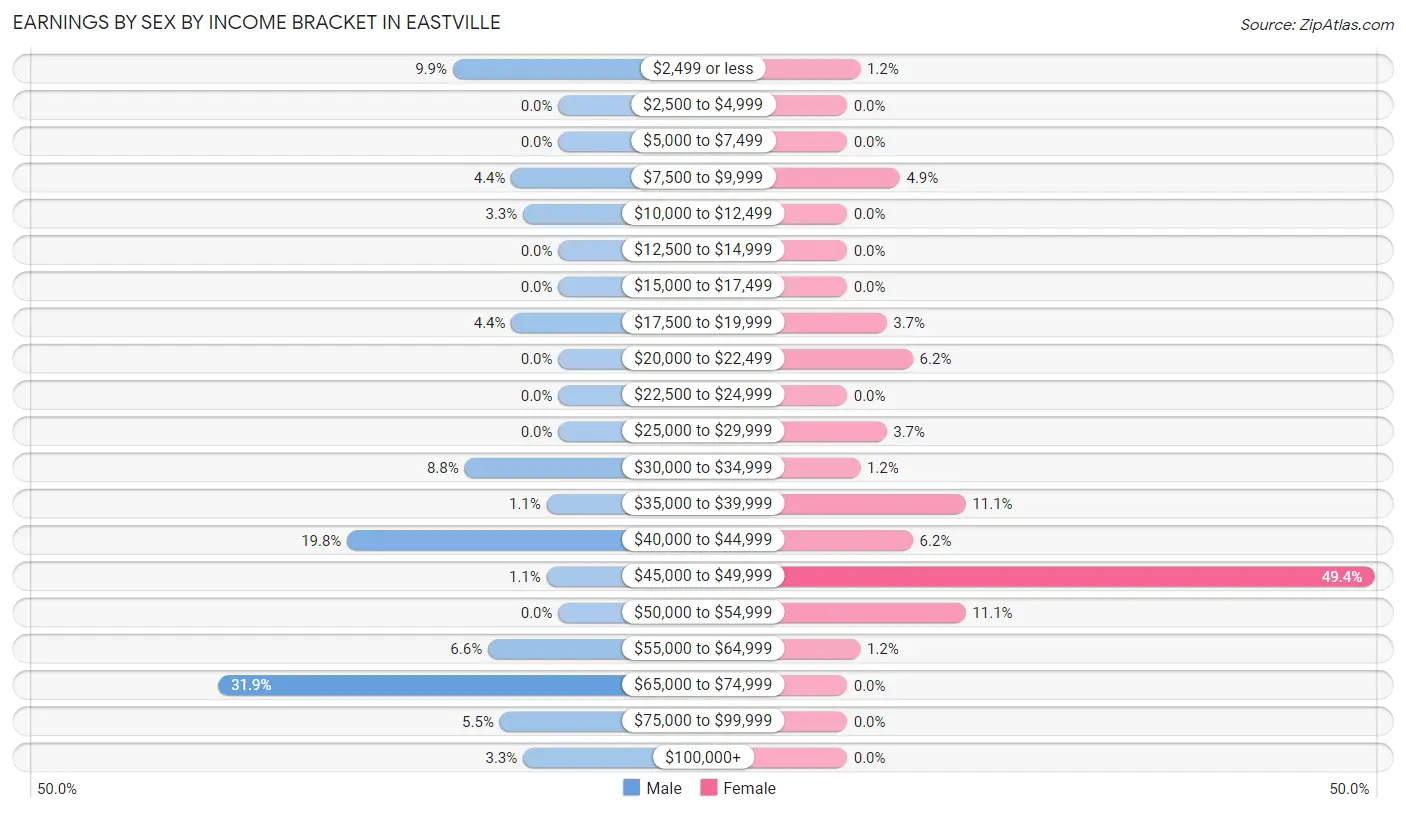
Earnings by Sex by Income Bracket in Eastville
The most common earnings brackets in Eastville are $65,000 to $74,999 for men (29 | 31.9%) and $45,000 to $49,999 for women (40 | 49.4%).
| Income | Male | Female |
| $2,499 or less | 9 (9.9%) | 1 (1.2%) |
| $2,500 to $4,999 | 0 (0.0%) | 0 (0.0%) |
| $5,000 to $7,499 | 0 (0.0%) | 0 (0.0%) |
| $7,500 to $9,999 | 4 (4.4%) | 4 (4.9%) |
| $10,000 to $12,499 | 3 (3.3%) | 0 (0.0%) |
| $12,500 to $14,999 | 0 (0.0%) | 0 (0.0%) |
| $15,000 to $17,499 | 0 (0.0%) | 0 (0.0%) |
| $17,500 to $19,999 | 4 (4.4%) | 3 (3.7%) |
| $20,000 to $22,499 | 0 (0.0%) | 5 (6.2%) |
| $22,500 to $24,999 | 0 (0.0%) | 0 (0.0%) |
| $25,000 to $29,999 | 0 (0.0%) | 3 (3.7%) |
| $30,000 to $34,999 | 8 (8.8%) | 1 (1.2%) |
| $35,000 to $39,999 | 1 (1.1%) | 9 (11.1%) |
| $40,000 to $44,999 | 18 (19.8%) | 5 (6.2%) |
| $45,000 to $49,999 | 1 (1.1%) | 40 (49.4%) |
| $50,000 to $54,999 | 0 (0.0%) | 9 (11.1%) |
| $55,000 to $64,999 | 6 (6.6%) | 1 (1.2%) |
| $65,000 to $74,999 | 29 (31.9%) | 0 (0.0%) |
| $75,000 to $99,999 | 5 (5.5%) | 0 (0.0%) |
| $100,000+ | 3 (3.3%) | 0 (0.0%) |
| Total | 91 (100.0%) | 81 (100.0%) |
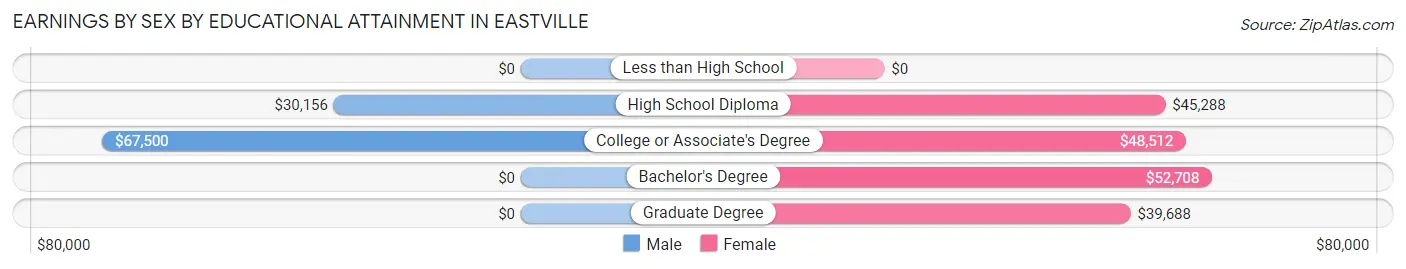
Earnings by Sex by Educational Attainment in Eastville
Average earnings in Eastville are $56,000 for men and $47,083 for women, a difference of 15.9%. Men with an educational attainment of college or associate's degree enjoy the highest average annual earnings of $67,500, while those with high school diploma education earn the least with $30,156. Women with an educational attainment of bachelor's degree earn the most with the average annual earnings of $52,708, while those with graduate degree education have the smallest earnings of $39,688.
| Educational Attainment | Male Income | Female Income |
| Less than High School | - | - |
| High School Diploma | $30,156 | $45,288 |
| College or Associate's Degree | $67,500 | $48,512 |
| Bachelor's Degree | - | - |
| Graduate Degree | - | - |
| Total | $56,000 | $47,083 |
Family Income in Eastville
Family Income Brackets in Eastville
According to the Eastville family income data, there are 17 families falling into the $50,000 to $74,999 income range, which is the most common income bracket and makes up 26.6% of all families.
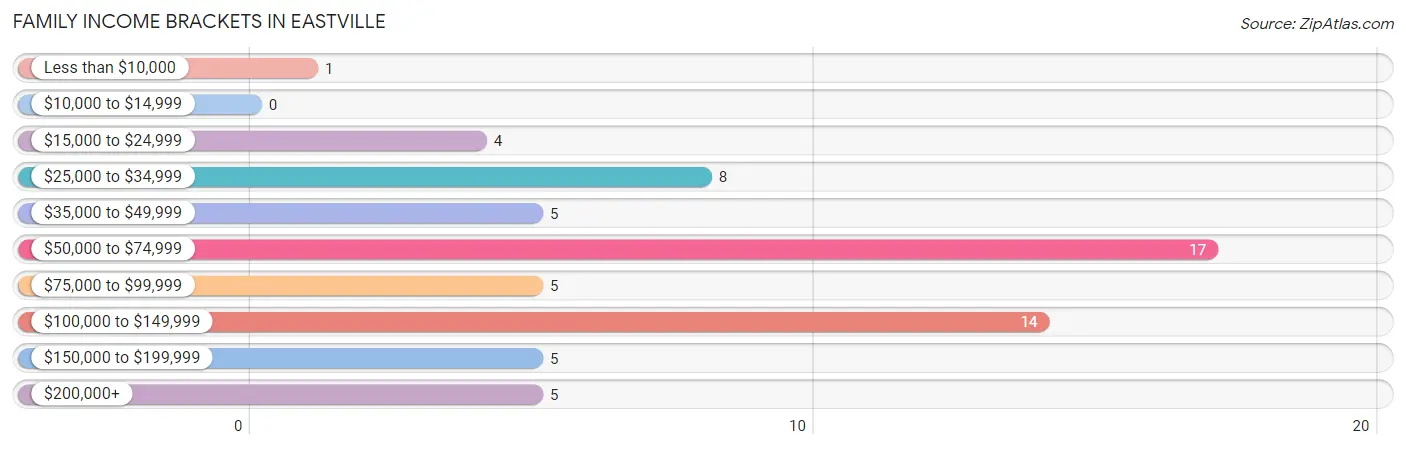
| Income Bracket | # Families | % Families |
| Less than $10,000 | 1 | 1.6% |
| $10,000 to $14,999 | 0 | 0.0% |
| $15,000 to $24,999 | 4 | 6.3% |
| $25,000 to $34,999 | 8 | 12.5% |
| $35,000 to $49,999 | 5 | 7.8% |
| $50,000 to $74,999 | 17 | 26.6% |
| $75,000 to $99,999 | 5 | 7.8% |
| $100,000 to $149,999 | 14 | 21.9% |
| $150,000 to $199,999 | 5 | 7.8% |
| $200,000+ | 5 | 7.8% |
Family Income by Famaliy Size in Eastville
2-person families (35 | 54.7%) account for the highest median family income in Eastville with $74,464 per family, while 2-person families (35 | 54.7%) have the highest median income of $37,232 per family member.
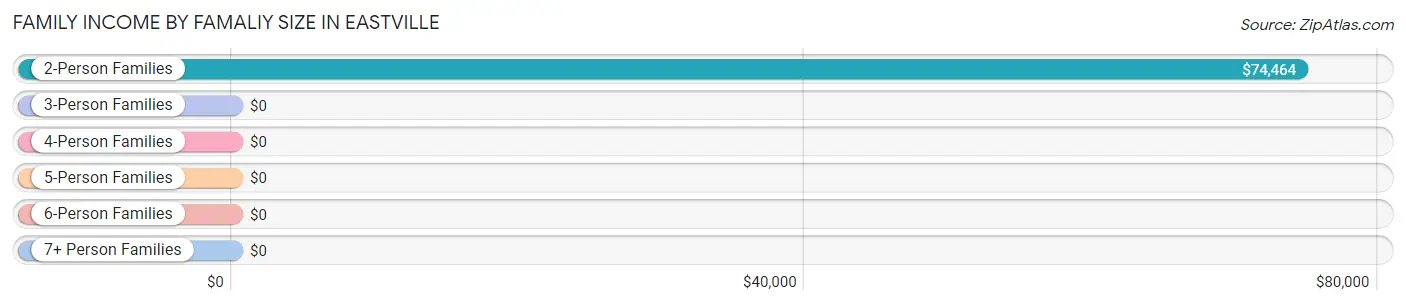
| Income Bracket | # Families | Median Income |
| 2-Person Families | 35 (54.7%) | $74,464 |
| 3-Person Families | 10 (15.6%) | $0 |
| 4-Person Families | 18 (28.1%) | $0 |
| 5-Person Families | 0 (0.0%) | $0 |
| 6-Person Families | 1 (1.6%) | $0 |
| 7+ Person Families | 0 (0.0%) | $0 |
| Total | 64 (100.0%) | $74,375 |
Family Income by Number of Earners in Eastville
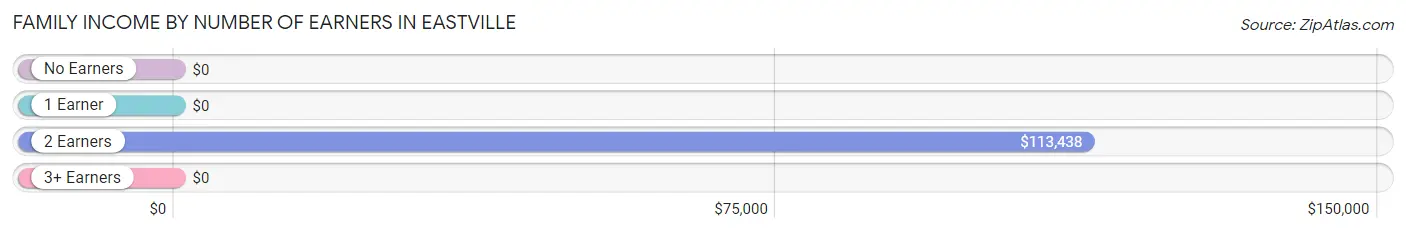
| Number of Earners | # Families | Median Income |
| No Earners | 10 (15.6%) | $0 |
| 1 Earner | 35 (54.7%) | $0 |
| 2 Earners | 13 (20.3%) | $113,438 |
| 3+ Earners | 6 (9.4%) | $0 |
| Total | 64 (100.0%) | $74,375 |
Household Income in Eastville
Household Income Brackets in Eastville
With 62 households falling in the category, the $50,000 to $74,999 income range is the most frequent in Eastville, accounting for 34.4% of all households. In contrast, only 4 households (2.2%) fall into the less than $10,000 income bracket, making it the least populous group.
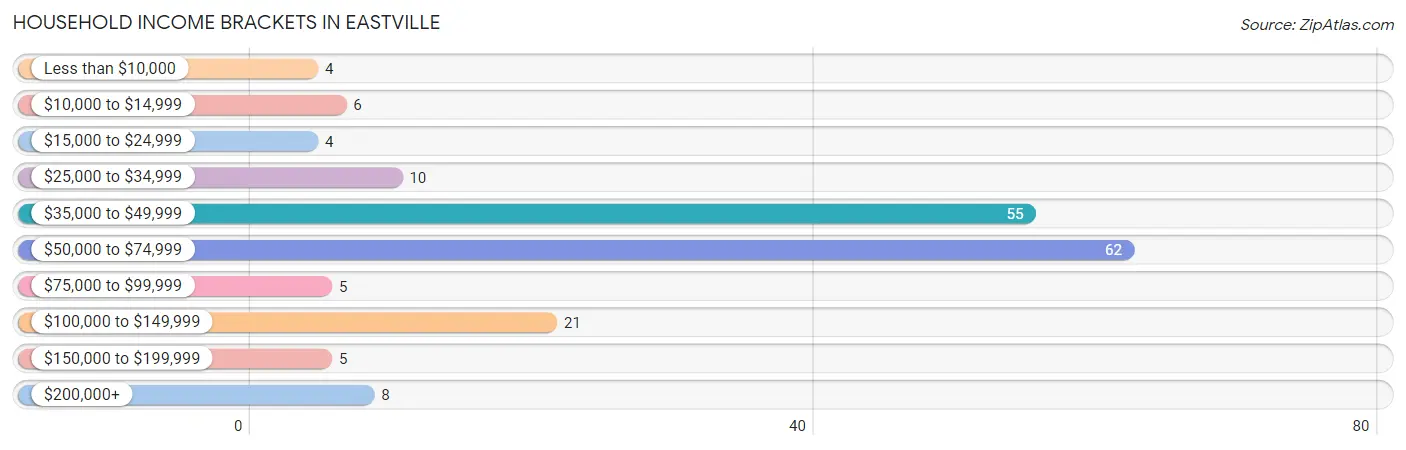
| Income Bracket | # Households | % Households |
| Less than $10,000 | 4 | 2.2% |
| $10,000 to $14,999 | 6 | 3.3% |
| $15,000 to $24,999 | 4 | 2.2% |
| $25,000 to $34,999 | 10 | 5.6% |
| $35,000 to $49,999 | 55 | 30.6% |
| $50,000 to $74,999 | 62 | 34.4% |
| $75,000 to $99,999 | 5 | 2.8% |
| $100,000 to $149,999 | 21 | 11.7% |
| $150,000 to $199,999 | 5 | 2.8% |
| $200,000+ | 8 | 4.4% |
Household Income by Householder Age in Eastville
The median household income in Eastville is $54,118, with the highest median household income of $68,750 found in the 65+ years age bracket for the primary householder. A total of 46 households (25.6%) fall into this category.
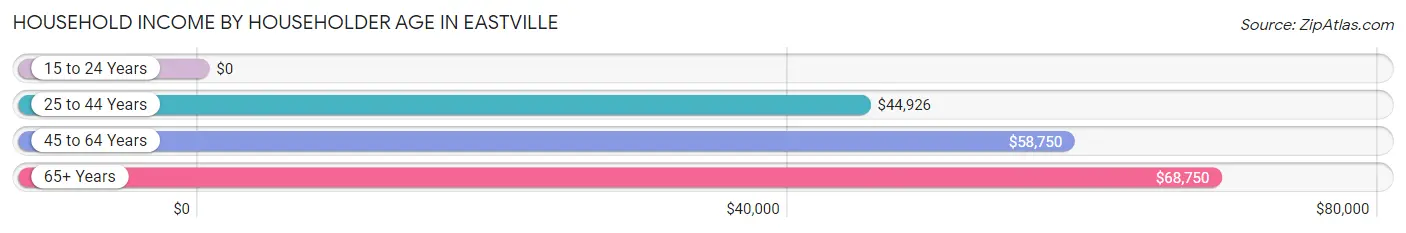
| Income Bracket | # Households | Median Income |
| 15 to 24 Years | 0 (0.0%) | $0 |
| 25 to 44 Years | 51 (28.3%) | $44,926 |
| 45 to 64 Years | 83 (46.1%) | $58,750 |
| 65+ Years | 46 (25.6%) | $68,750 |
| Total | 180 (100.0%) | $54,118 |
Poverty in Eastville
Income Below Poverty by Sex and Age in Eastville
With 7.2% poverty level for males and 15.7% for females among the residents of Eastville, 6 to 11 year old males and 6 to 11 year old females are the most vulnerable to poverty, with 2 males (50.0%) and 10 females (66.7%) in their respective age groups living below the poverty level.
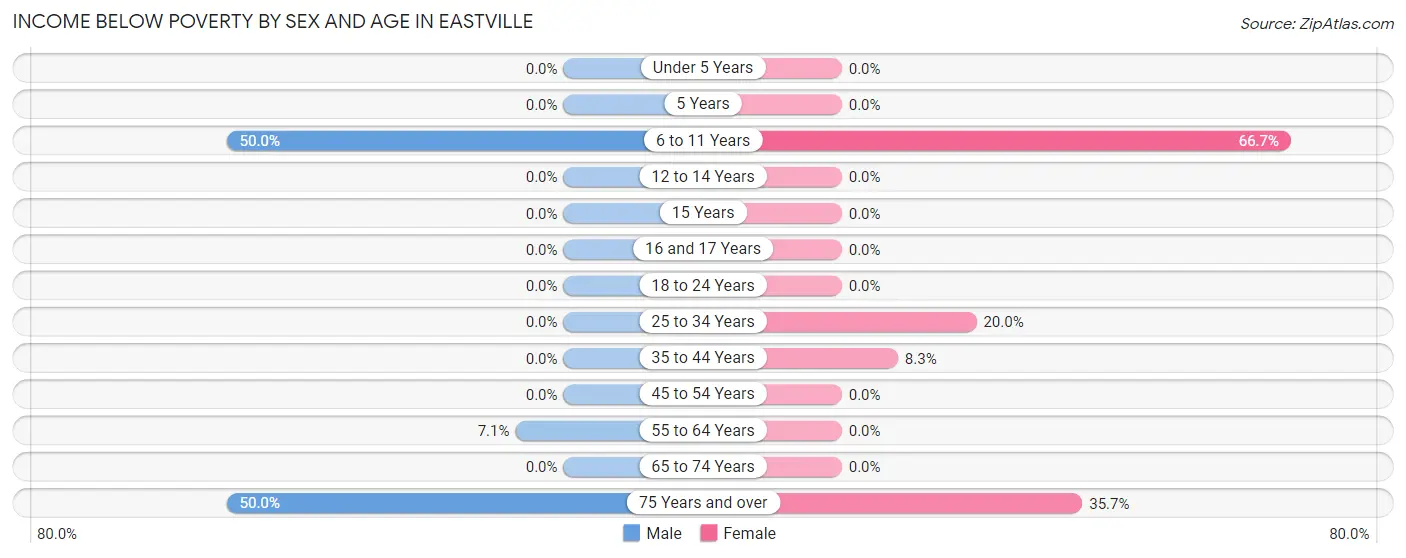
| Age Bracket | Male | Female |
| Under 5 Years | 0 (0.0%) | 0 (0.0%) |
| 5 Years | 0 (0.0%) | 0 (0.0%) |
| 6 to 11 Years | 2 (50.0%) | 10 (66.7%) |
| 12 to 14 Years | 0 (0.0%) | 0 (0.0%) |
| 15 Years | 0 (0.0%) | 0 (0.0%) |
| 16 and 17 Years | 0 (0.0%) | 0 (0.0%) |
| 18 to 24 Years | 0 (0.0%) | 0 (0.0%) |
| 25 to 34 Years | 0 (0.0%) | 6 (20.0%) |
| 35 to 44 Years | 0 (0.0%) | 1 (8.3%) |
| 45 to 54 Years | 0 (0.0%) | 0 (0.0%) |
| 55 to 64 Years | 3 (7.1%) | 0 (0.0%) |
| 65 to 74 Years | 0 (0.0%) | 0 (0.0%) |
| 75 Years and over | 5 (50.0%) | 10 (35.7%) |
| Total | 10 (7.2%) | 27 (15.7%) |
Income Above Poverty by Sex and Age in Eastville
According to the poverty statistics in Eastville, males aged under 5 years and females aged under 5 years are the age groups that are most secure financially, with 100.0% of males and 100.0% of females in these age groups living above the poverty line.
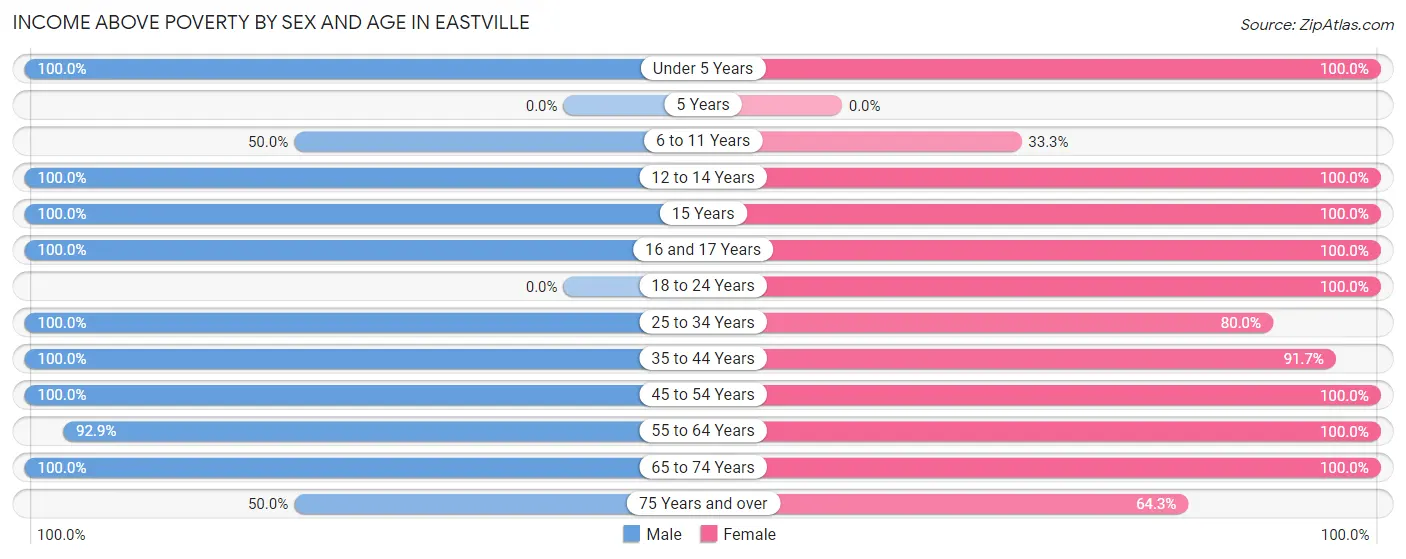
| Age Bracket | Male | Female |
| Under 5 Years | 7 (100.0%) | 6 (100.0%) |
| 5 Years | 0 (0.0%) | 0 (0.0%) |
| 6 to 11 Years | 2 (50.0%) | 5 (33.3%) |
| 12 to 14 Years | 3 (100.0%) | 1 (100.0%) |
| 15 Years | 13 (100.0%) | 2 (100.0%) |
| 16 and 17 Years | 9 (100.0%) | 1 (100.0%) |
| 18 to 24 Years | 0 (0.0%) | 5 (100.0%) |
| 25 to 34 Years | 12 (100.0%) | 24 (80.0%) |
| 35 to 44 Years | 25 (100.0%) | 11 (91.7%) |
| 45 to 54 Years | 2 (100.0%) | 1 (100.0%) |
| 55 to 64 Years | 39 (92.9%) | 54 (100.0%) |
| 65 to 74 Years | 11 (100.0%) | 17 (100.0%) |
| 75 Years and over | 5 (50.0%) | 18 (64.3%) |
| Total | 128 (92.7%) | 145 (84.3%) |
Income Below Poverty Among Married-Couple Families in Eastville
The poverty statistics for married-couple families in Eastville show that 10.0% or 4 of the total 40 families live below the poverty line. Families with 1 or 2 children have the highest poverty rate of 25.0%, comprising of 4 families. On the other hand, families with no children have the lowest poverty rate of 0.0%, which includes 0 families.
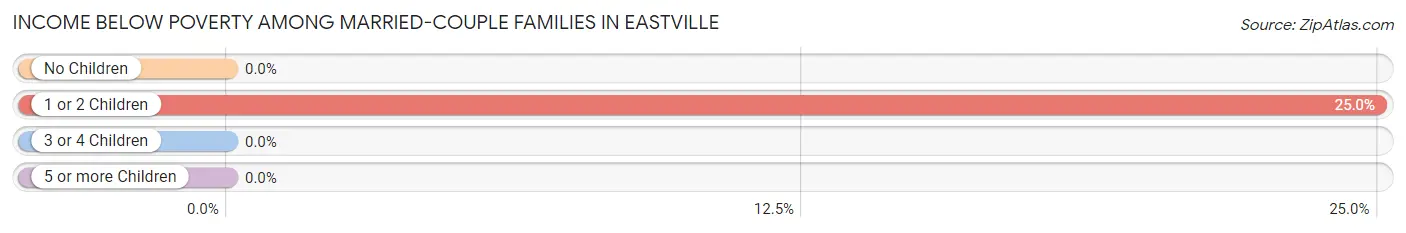
| Children | Above Poverty | Below Poverty |
| No Children | 23 (100.0%) | 0 (0.0%) |
| 1 or 2 Children | 12 (75.0%) | 4 (25.0%) |
| 3 or 4 Children | 1 (100.0%) | 0 (0.0%) |
| 5 or more Children | 0 (0.0%) | 0 (0.0%) |
| Total | 36 (90.0%) | 4 (10.0%) |
Income Below Poverty Among Single-Parent Households in Eastville
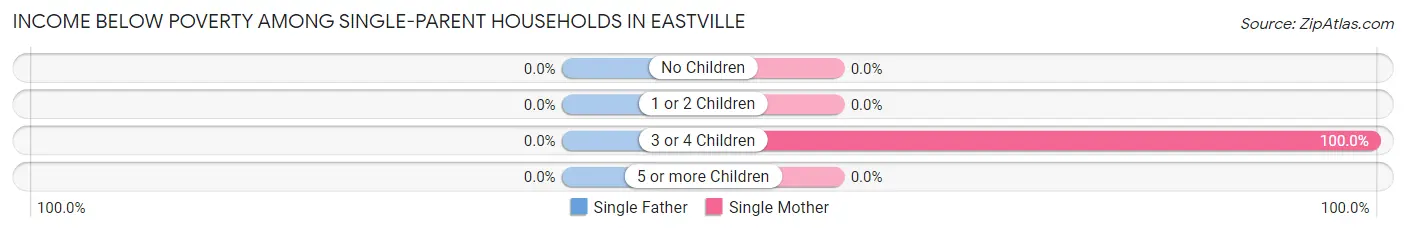
| Children | Single Father | Single Mother |
| No Children | 0 (0.0%) | 0 (0.0%) |
| 1 or 2 Children | 0 (0.0%) | 0 (0.0%) |
| 3 or 4 Children | 0 (0.0%) | 1 (100.0%) |
| 5 or more Children | 0 (0.0%) | 0 (0.0%) |
| Total | 0 (0.0%) | 1 (6.2%) |
Income Below Poverty Among Married-Couple vs Single-Parent Households in Eastville
The poverty data for Eastville shows that 4 of the married-couple family households (10.0%) and 1 of the single-parent households (4.2%) are living below the poverty level. Within the married-couple family households, those with 1 or 2 children have the highest poverty rate, with 4 households (25.0%) falling below the poverty line. Among the single-parent households, those with 3 or 4 children have the highest poverty rate, with 1 household (100.0%) living below poverty.
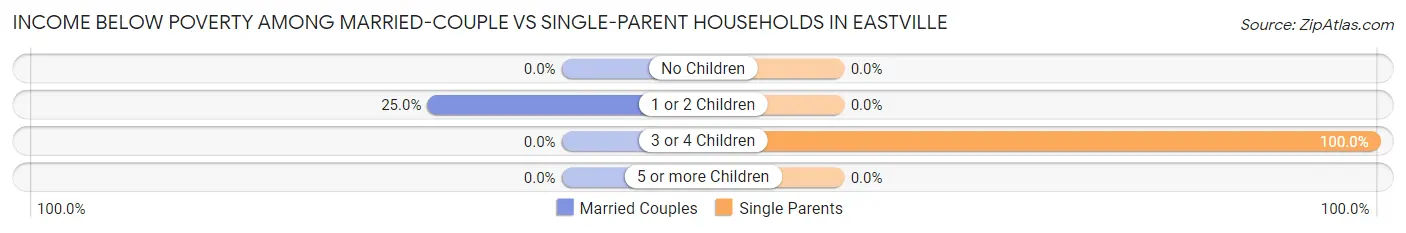
| Children | Married-Couple Families | Single-Parent Households |
| No Children | 0 (0.0%) | 0 (0.0%) |
| 1 or 2 Children | 4 (25.0%) | 0 (0.0%) |
| 3 or 4 Children | 0 (0.0%) | 1 (100.0%) |
| 5 or more Children | 0 (0.0%) | 0 (0.0%) |
| Total | 4 (10.0%) | 1 (4.2%) |
Race in Eastville
The most populous races in Eastville are White / Caucasian (223 | 70.6%), Black / African American (86 | 27.2%), and Asian (7 | 2.2%).
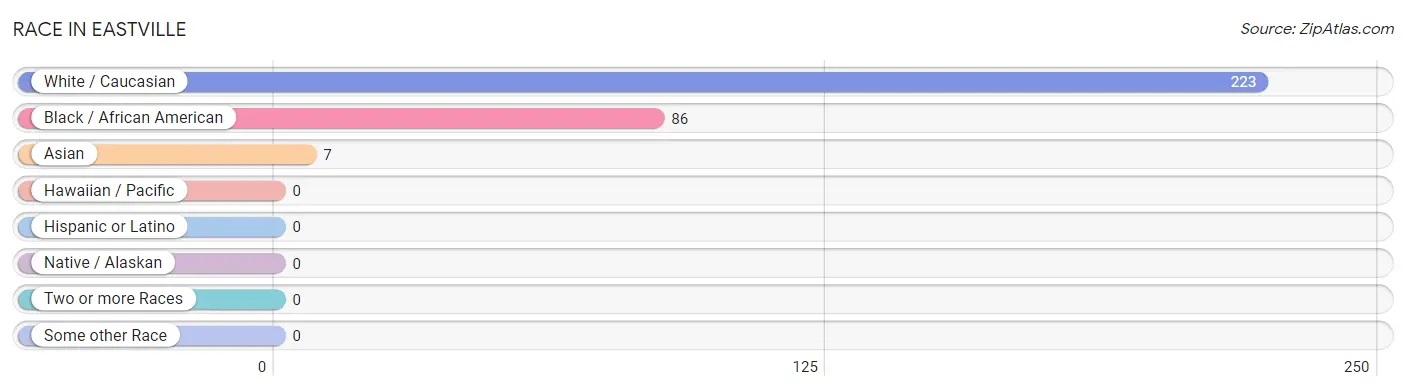
| Race | # Population | % Population |
| Asian | 7 | 2.2% |
| Black / African American | 86 | 27.2% |
| Hawaiian / Pacific | 0 | 0.0% |
| Hispanic or Latino | 0 | 0.0% |
| Native / Alaskan | 0 | 0.0% |
| White / Caucasian | 223 | 70.6% |
| Two or more Races | 0 | 0.0% |
| Some other Race | 0 | 0.0% |
| Total | 316 | 100.0% |
Ancestry in Eastville
The most populous ancestries reported in Eastville are American (223 | 70.6%), German (21 | 6.7%), Irish (21 | 6.7%), British (17 | 5.4%), and English (14 | 4.4%), together accounting for 93.7% of all Eastville residents.
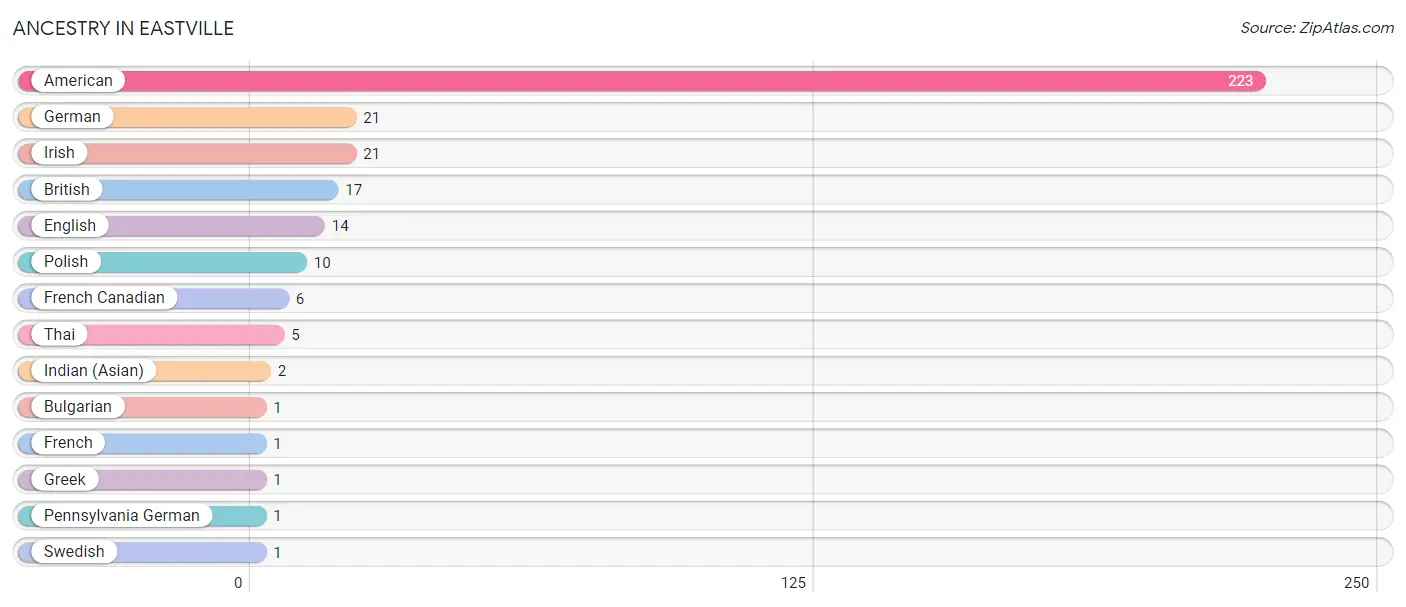
| Ancestry | # Population | % Population |
| American | 223 | 70.6% |
| British | 17 | 5.4% |
| Bulgarian | 1 | 0.3% |
| English | 14 | 4.4% |
| French | 1 | 0.3% |
| French Canadian | 6 | 1.9% |
| German | 21 | 6.7% |
| Greek | 1 | 0.3% |
| Indian (Asian) | 2 | 0.6% |
| Irish | 21 | 6.7% |
| Pennsylvania German | 1 | 0.3% |
| Polish | 10 | 3.2% |
| Swedish | 1 | 0.3% |
| Thai | 5 | 1.6% | View All 14 Rows |
Immigrants in Eastville
The most numerous immigrant groups reported in Eastville came from Australia (4 | 1.3%), Oceania (4 | 1.3%), Asia (2 | 0.6%), China (2 | 0.6%), and Eastern Asia (2 | 0.6%), together accounting for 4.4% of all Eastville residents.
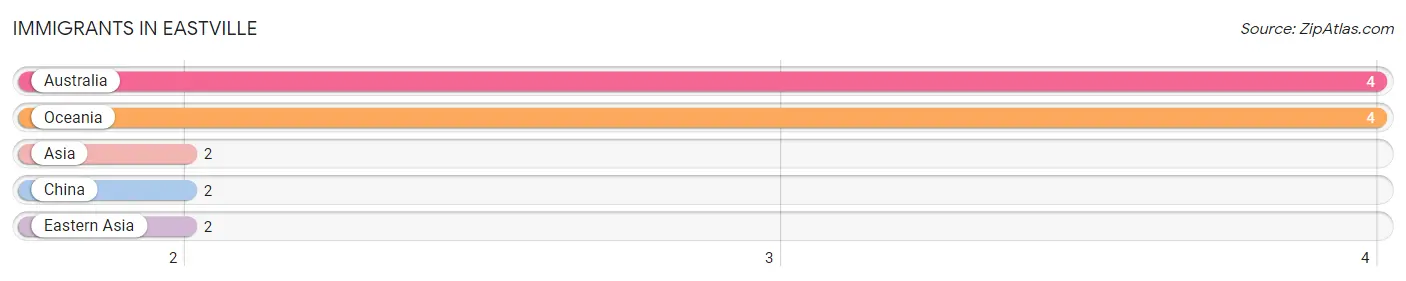
| Immigration Origin | # Population | % Population |
| Asia | 2 | 0.6% |
| Australia | 4 | 1.3% |
| China | 2 | 0.6% |
| Eastern Asia | 2 | 0.6% |
| Oceania | 4 | 1.3% | View All 5 Rows |
Sex and Age in Eastville
Sex and Age in Eastville
The most populous age groups in Eastville are 60 to 64 Years (36 | 25.0%) for men and 55 to 59 Years (32 | 18.6%) for women.
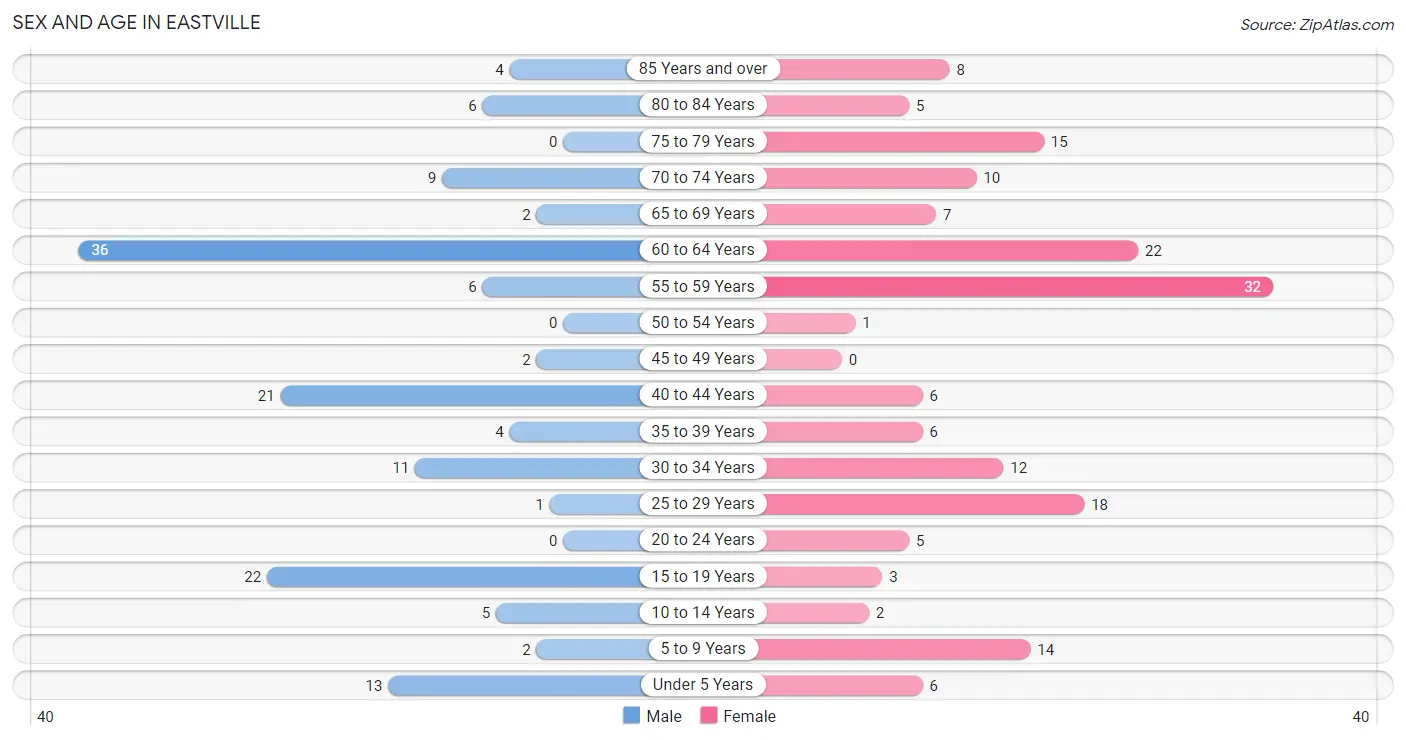
| Age Bracket | Male | Female |
| Under 5 Years | 13 (9.0%) | 6 (3.5%) |
| 5 to 9 Years | 2 (1.4%) | 14 (8.1%) |
| 10 to 14 Years | 5 (3.5%) | 2 (1.2%) |
| 15 to 19 Years | 22 (15.3%) | 3 (1.7%) |
| 20 to 24 Years | 0 (0.0%) | 5 (2.9%) |
| 25 to 29 Years | 1 (0.7%) | 18 (10.5%) |
| 30 to 34 Years | 11 (7.6%) | 12 (7.0%) |
| 35 to 39 Years | 4 (2.8%) | 6 (3.5%) |
| 40 to 44 Years | 21 (14.6%) | 6 (3.5%) |
| 45 to 49 Years | 2 (1.4%) | 0 (0.0%) |
| 50 to 54 Years | 0 (0.0%) | 1 (0.6%) |
| 55 to 59 Years | 6 (4.2%) | 32 (18.6%) |
| 60 to 64 Years | 36 (25.0%) | 22 (12.8%) |
| 65 to 69 Years | 2 (1.4%) | 7 (4.1%) |
| 70 to 74 Years | 9 (6.2%) | 10 (5.8%) |
| 75 to 79 Years | 0 (0.0%) | 15 (8.7%) |
| 80 to 84 Years | 6 (4.2%) | 5 (2.9%) |
| 85 Years and over | 4 (2.8%) | 8 (4.6%) |
| Total | 144 (100.0%) | 172 (100.0%) |
Families and Households in Eastville
Median Family Size in Eastville
The median family size in Eastville is 2.95 persons per family, with married-couple families (40 | 62.5%) accounting for the largest median family size of 3.4 persons per family. On the other hand, single male/father families (8 | 12.5%) represent the smallest median family size with 1.38 persons per family.
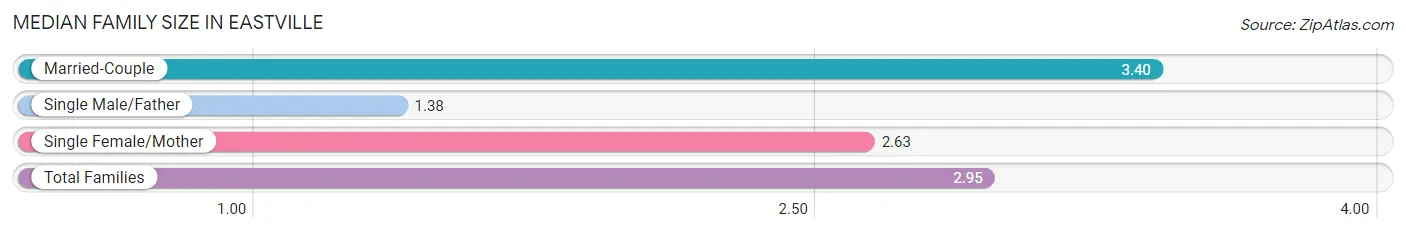
| Family Type | # Families | Family Size |
| Married-Couple | 40 (62.5%) | 3.40 |
| Single Male/Father | 8 (12.5%) | 1.38 |
| Single Female/Mother | 16 (25.0%) | 2.63 |
| Total Families | 64 (100.0%) | 2.95 |
Median Household Size in Eastville
The median household size in Eastville is 1.76 persons per household, with married-couple households (40 | 22.2%) accounting for the largest median household size of 3.55 persons per household. non-family households (116 | 64.4%) represent the smallest median household size with 1.01 persons per household.
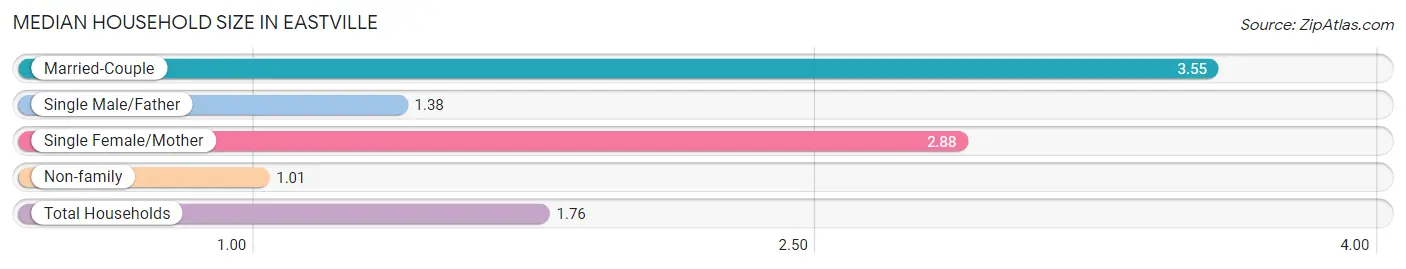
| Household Type | # Households | Household Size |
| Married-Couple | 40 (22.2%) | 3.55 |
| Single Male/Father | 8 (4.4%) | 1.38 |
| Single Female/Mother | 16 (8.9%) | 2.88 |
| Non-family | 116 (64.4%) | 1.01 |
| Total Households | 180 (100.0%) | 1.76 |
Household Size by Marriage Status in Eastville
Out of a total of 180 households in Eastville, 64 (35.6%) are family households, while 116 (64.4%) are nonfamily households. The most numerous type of family households are 2-person households, comprising 35, and the most common type of nonfamily households are 1-person households, comprising 110.
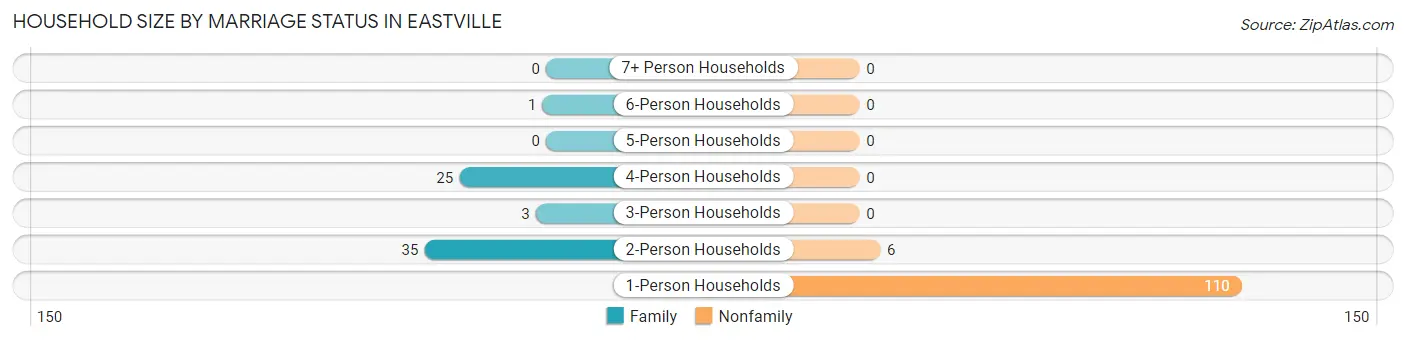
| Household Size | Family Households | Nonfamily Households |
| 1-Person Households | - | 110 (61.1%) |
| 2-Person Households | 35 (19.4%) | 6 (3.3%) |
| 3-Person Households | 3 (1.7%) | 0 (0.0%) |
| 4-Person Households | 25 (13.9%) | 0 (0.0%) |
| 5-Person Households | 0 (0.0%) | 0 (0.0%) |
| 6-Person Households | 1 (0.6%) | 0 (0.0%) |
| 7+ Person Households | 0 (0.0%) | 0 (0.0%) |
| Total | 64 (35.6%) | 116 (64.4%) |
Female Fertility in Eastville
Fertility by Age in Eastville
Average fertility rate in Eastville is 100.0 births per 1,000 women. Women in the age bracket of 20 to 34 years have the highest fertility rate with 114.0 births per 1,000 women. Women in the age bracket of 20 to 34 years acount for 80.0% of all women with births.
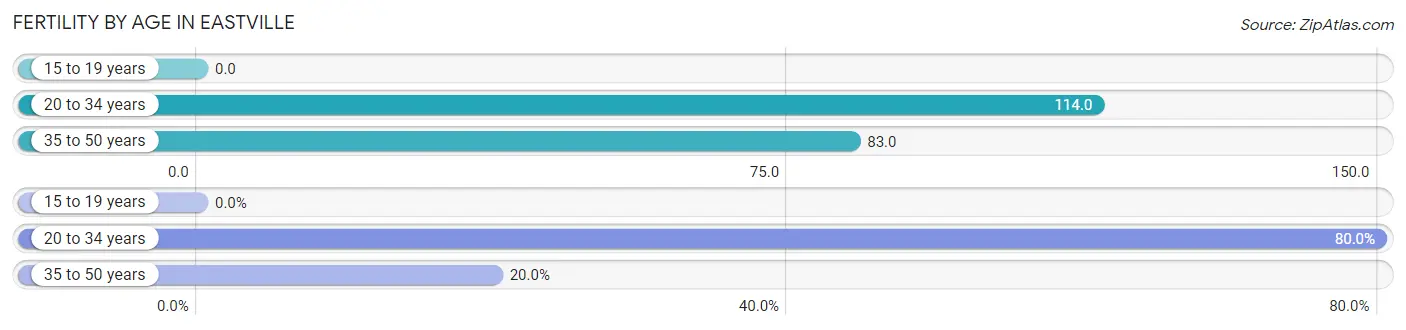
| Age Bracket | Women with Births | Births / 1,000 Women |
| 15 to 19 years | 0 (0.0%) | 0.0 |
| 20 to 34 years | 4 (80.0%) | 114.0 |
| 35 to 50 years | 1 (20.0%) | 83.0 |
| Total | 5 (100.0%) | 100.0 |
Fertility by Age by Marriage Status in Eastville
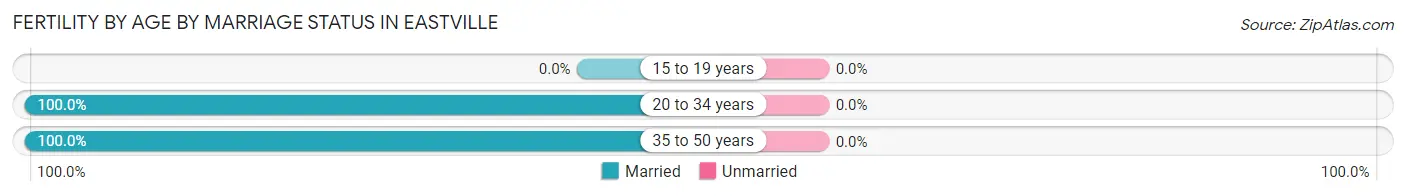
| Age Bracket | Married | Unmarried |
| 15 to 19 years | 0 (0.0%) | 0 (0.0%) |
| 20 to 34 years | 4 (100.0%) | 0 (0.0%) |
| 35 to 50 years | 1 (100.0%) | 0 (0.0%) |
| Total | 5 (100.0%) | 0 (0.0%) |
Fertility by Education in Eastville
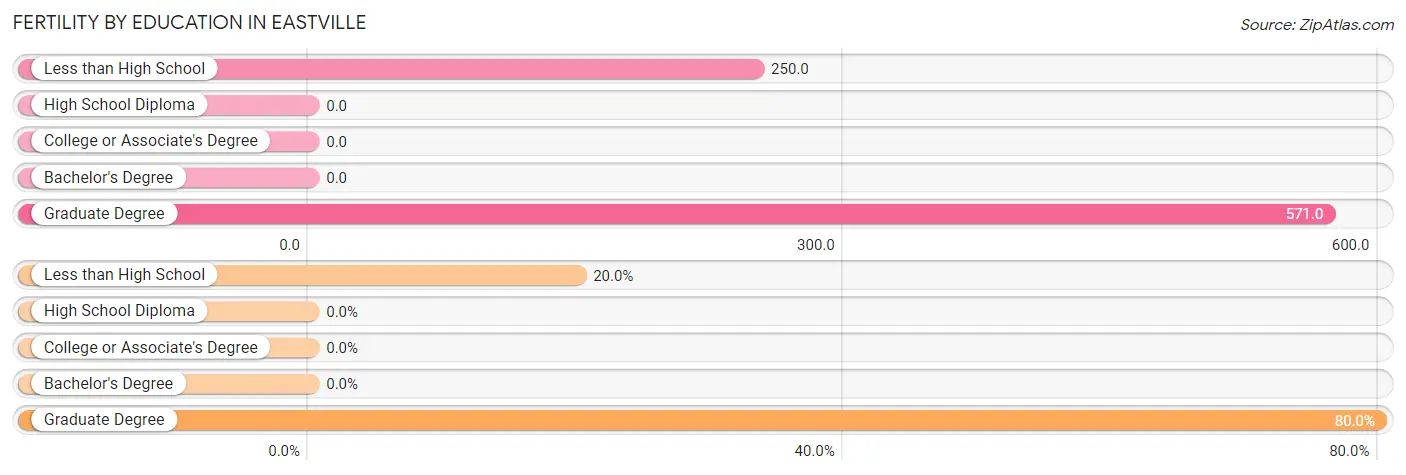
| Educational Attainment | Women with Births | Births / 1,000 Women |
| Less than High School | 1 (20.0%) | 250.0 |
| High School Diploma | 0 (0.0%) | 0.0 |
| College or Associate's Degree | 0 (0.0%) | 0.0 |
| Bachelor's Degree | 0 (0.0%) | 0.0 |
| Graduate Degree | 4 (80.0%) | 571.0 |
| Total | 5 (100.0%) | 100.0 |
Fertility by Education by Marriage Status in Eastville
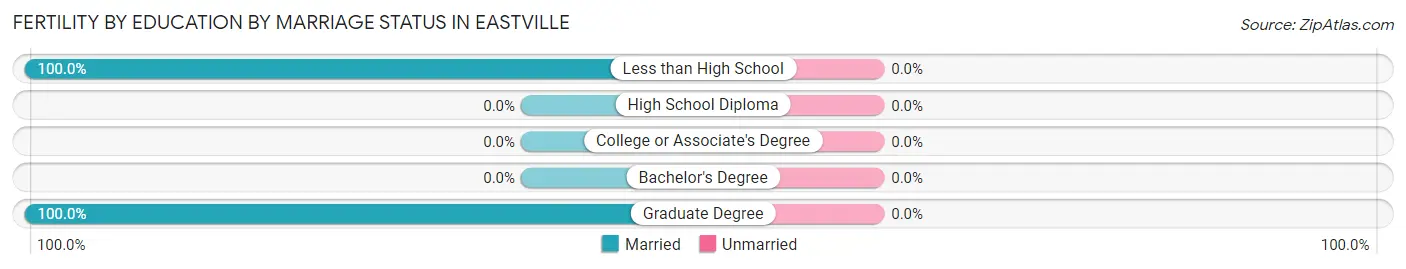
| Educational Attainment | Married | Unmarried |
| Less than High School | 1 (100.0%) | 0 (0.0%) |
| High School Diploma | 0 (0.0%) | 0 (0.0%) |
| College or Associate's Degree | 0 (0.0%) | 0 (0.0%) |
| Bachelor's Degree | 0 (0.0%) | 0 (0.0%) |
| Graduate Degree | 4 (100.0%) | 0 (0.0%) |
| Total | 5 (100.0%) | 0 (0.0%) |
Employment Characteristics in Eastville
Employment by Class of Employer in Eastville
Among the 165 employed individuals in Eastville, private company employees (72 | 43.6%), local government employees (52 | 31.5%), and not-for-profit organizations (29 | 17.6%) make up the most common classes of employment.
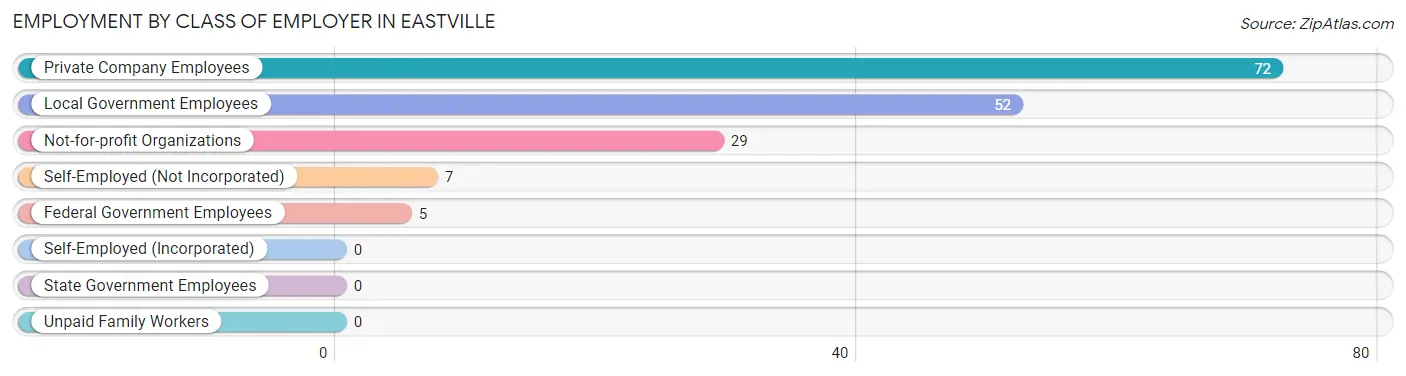
| Employer Class | # Employees | % Employees |
| Private Company Employees | 72 | 43.6% |
| Self-Employed (Incorporated) | 0 | 0.0% |
| Self-Employed (Not Incorporated) | 7 | 4.2% |
| Not-for-profit Organizations | 29 | 17.6% |
| Local Government Employees | 52 | 31.5% |
| State Government Employees | 0 | 0.0% |
| Federal Government Employees | 5 | 3.0% |
| Unpaid Family Workers | 0 | 0.0% |
| Total | 165 | 100.0% |
Employment Status by Age in Eastville
According to the labor force statistics for Eastville, out of the total population over 16 years of age (259), 66.0% or 171 individuals are in the labor force, with 1.8% or 3 of them unemployed. The age group with the highest labor force participation rate is 16 to 19 years, with 100.0% or 10 individuals in the labor force. Within the labor force, the 65 to 74 years age range has the highest percentage of unemployed individuals, with 25.0% or 3 of them being unemployed.
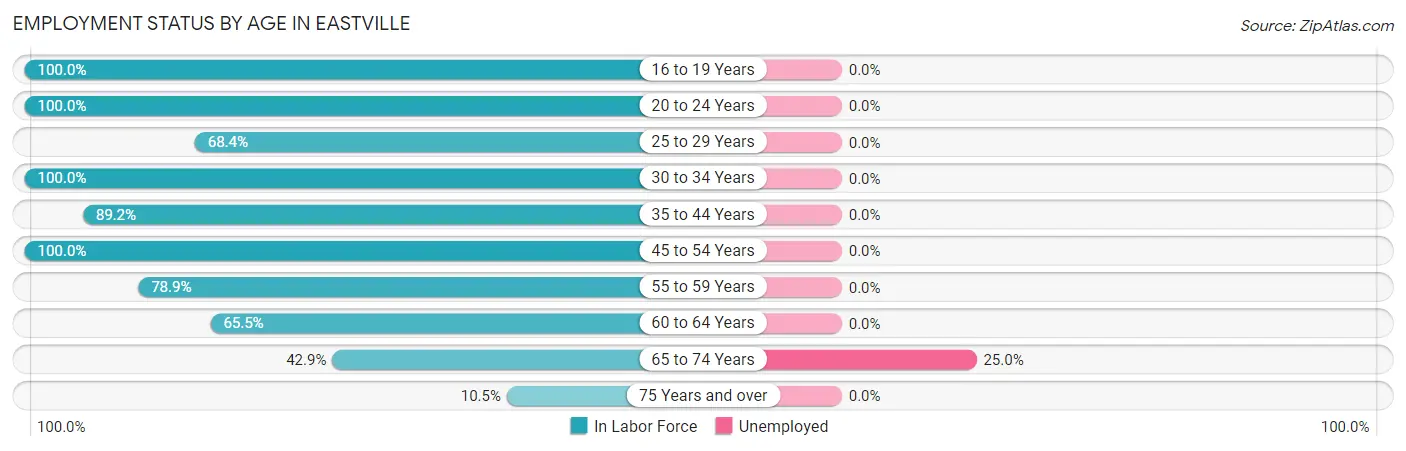
| Age Bracket | In Labor Force | Unemployed |
| 16 to 19 Years | 10 (100.0%) | 0 (0.0%) |
| 20 to 24 Years | 5 (100.0%) | 0 (0.0%) |
| 25 to 29 Years | 13 (68.4%) | 0 (0.0%) |
| 30 to 34 Years | 23 (100.0%) | 0 (0.0%) |
| 35 to 44 Years | 33 (89.2%) | 0 (0.0%) |
| 45 to 54 Years | 3 (100.0%) | 0 (0.0%) |
| 55 to 59 Years | 30 (78.9%) | 0 (0.0%) |
| 60 to 64 Years | 38 (65.5%) | 0 (0.0%) |
| 65 to 74 Years | 12 (42.9%) | 3 (25.0%) |
| 75 Years and over | 4 (10.5%) | 0 (0.0%) |
| Total | 171 (66.0%) | 3 (1.8%) |
Employment Status by Educational Attainment in Eastville
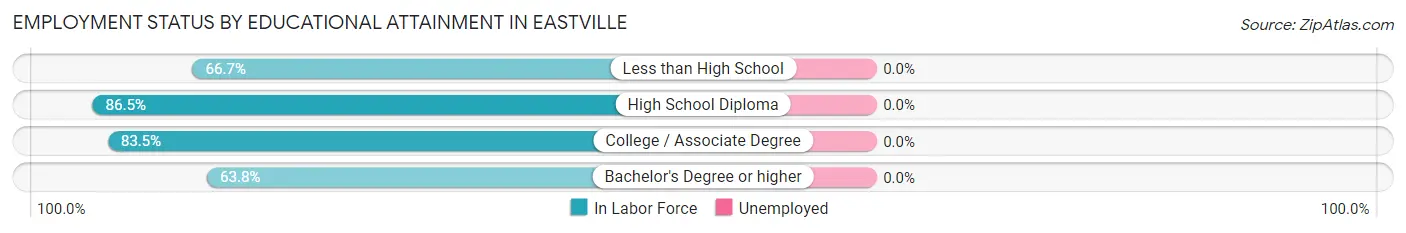
| Educational Attainment | In Labor Force | Unemployed |
| Less than High School | 2 (66.7%) | 0 (0.0%) |
| High School Diploma | 32 (86.5%) | 0 (0.0%) |
| College / Associate Degree | 76 (83.5%) | 0 (0.0%) |
| Bachelor's Degree or higher | 30 (63.8%) | 0 (0.0%) |
| Total | 140 (78.7%) | 0 (0.0%) |
Employment Occupations by Sex in Eastville
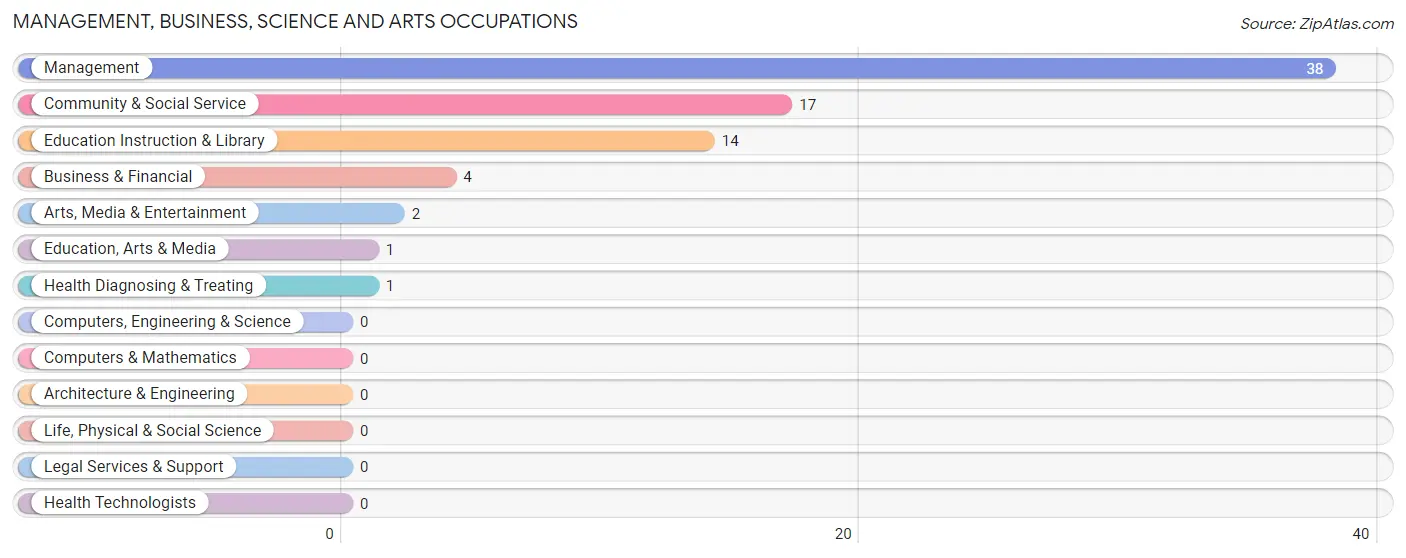
Management, Business, Science and Arts Occupations
The most common Management, Business, Science and Arts occupations in Eastville are Management (38 | 22.6%), Community & Social Service (17 | 10.1%), Education Instruction & Library (14 | 8.3%), Business & Financial (4 | 2.4%), and Arts, Media & Entertainment (2 | 1.2%).
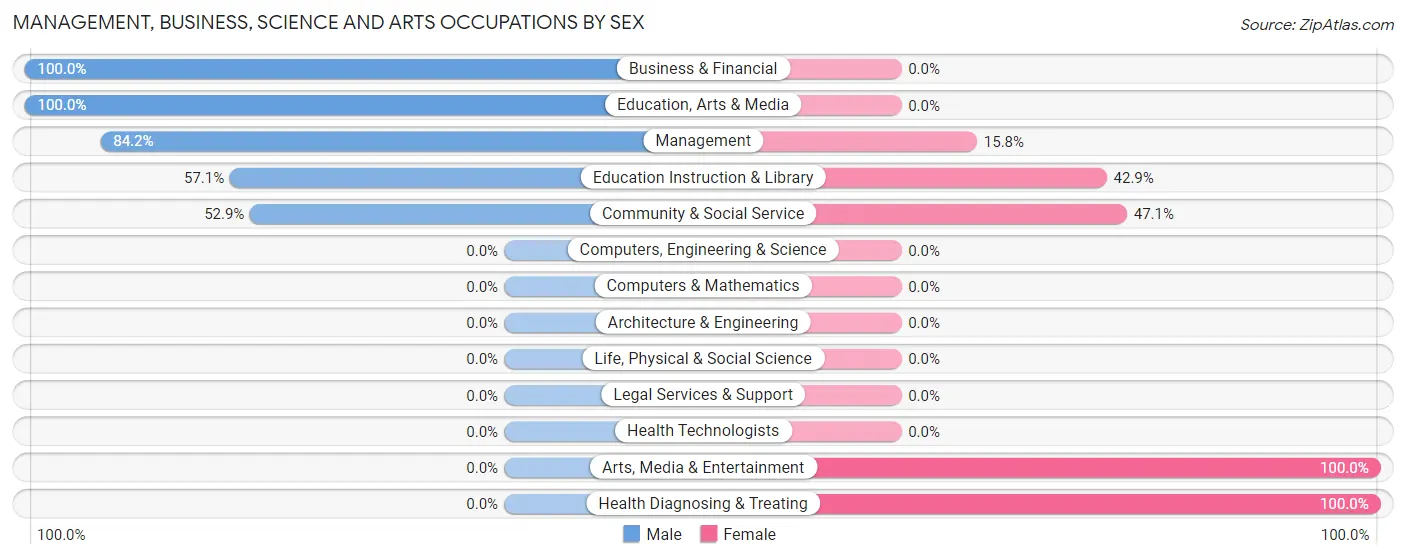
Management, Business, Science and Arts Occupations by Sex
Within the Management, Business, Science and Arts occupations in Eastville, the most male-oriented occupations are Business & Financial (100.0%), Education, Arts & Media (100.0%), and Management (84.2%), while the most female-oriented occupations are Arts, Media & Entertainment (100.0%), Health Diagnosing & Treating (100.0%), and Community & Social Service (47.1%).
| Occupation | Male | Female |
| Management | 32 (84.2%) | 6 (15.8%) |
| Business & Financial | 4 (100.0%) | 0 (0.0%) |
| Computers, Engineering & Science | 0 (0.0%) | 0 (0.0%) |
| Computers & Mathematics | 0 (0.0%) | 0 (0.0%) |
| Architecture & Engineering | 0 (0.0%) | 0 (0.0%) |
| Life, Physical & Social Science | 0 (0.0%) | 0 (0.0%) |
| Community & Social Service | 9 (52.9%) | 8 (47.1%) |
| Education, Arts & Media | 1 (100.0%) | 0 (0.0%) |
| Legal Services & Support | 0 (0.0%) | 0 (0.0%) |
| Education Instruction & Library | 8 (57.1%) | 6 (42.9%) |
| Arts, Media & Entertainment | 0 (0.0%) | 2 (100.0%) |
| Health Diagnosing & Treating | 0 (0.0%) | 1 (100.0%) |
| Health Technologists | 0 (0.0%) | 0 (0.0%) |
| Total (Category) | 45 (75.0%) | 15 (25.0%) |
| Total (Overall) | 91 (54.2%) | 77 (45.8%) |
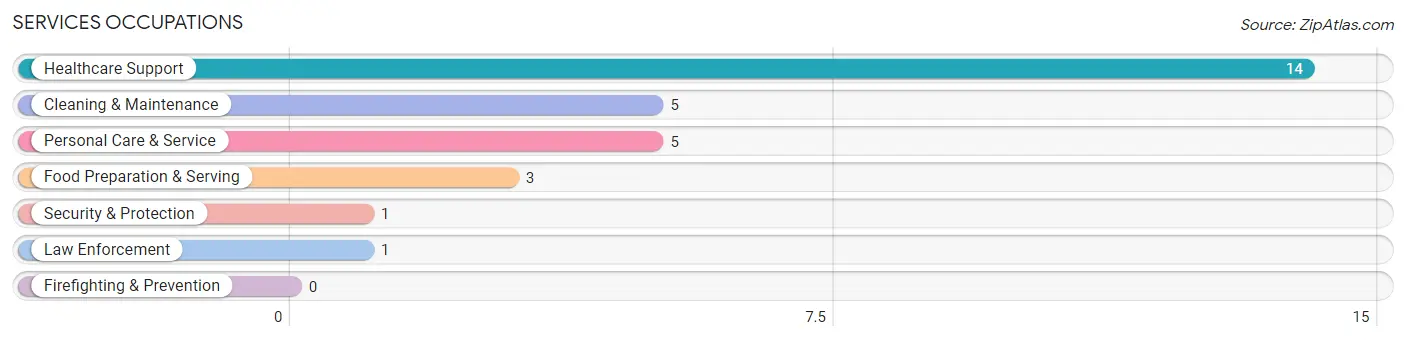
Services Occupations
The most common Services occupations in Eastville are Healthcare Support (14 | 8.3%), Cleaning & Maintenance (5 | 3.0%), Personal Care & Service (5 | 3.0%), Food Preparation & Serving (3 | 1.8%), and Security & Protection (1 | 0.6%).
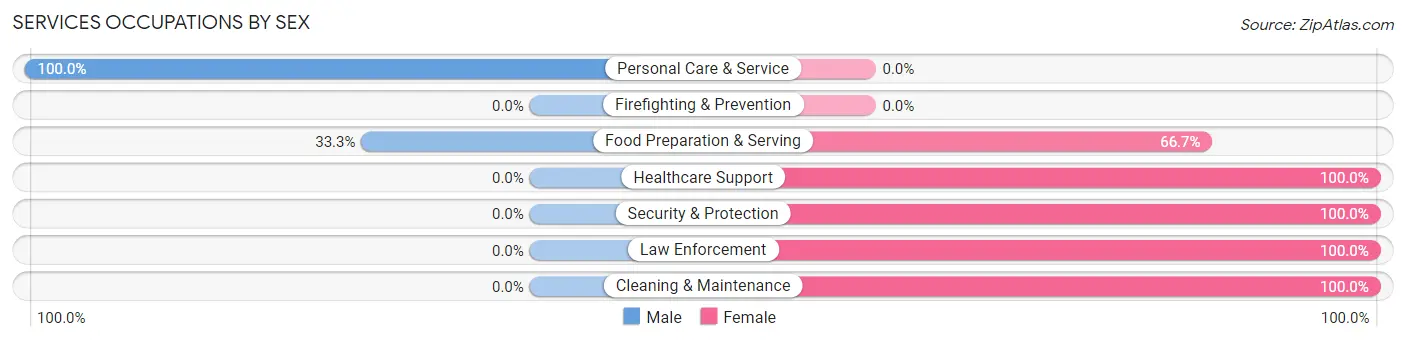
Services Occupations by Sex
Within the Services occupations in Eastville, the most male-oriented occupations are Personal Care & Service (100.0%), and Food Preparation & Serving (33.3%), while the most female-oriented occupations are Healthcare Support (100.0%), Security & Protection (100.0%), and Law Enforcement (100.0%).
| Occupation | Male | Female |
| Healthcare Support | 0 (0.0%) | 14 (100.0%) |
| Security & Protection | 0 (0.0%) | 1 (100.0%) |
| Firefighting & Prevention | 0 (0.0%) | 0 (0.0%) |
| Law Enforcement | 0 (0.0%) | 1 (100.0%) |
| Food Preparation & Serving | 1 (33.3%) | 2 (66.7%) |
| Cleaning & Maintenance | 0 (0.0%) | 5 (100.0%) |
| Personal Care & Service | 5 (100.0%) | 0 (0.0%) |
| Total (Category) | 6 (21.4%) | 22 (78.6%) |
| Total (Overall) | 91 (54.2%) | 77 (45.8%) |
Sales and Office Occupations
The most common Sales and Office occupations in Eastville are Office & Administration (31 | 18.4%), and Sales & Related (10 | 5.9%).
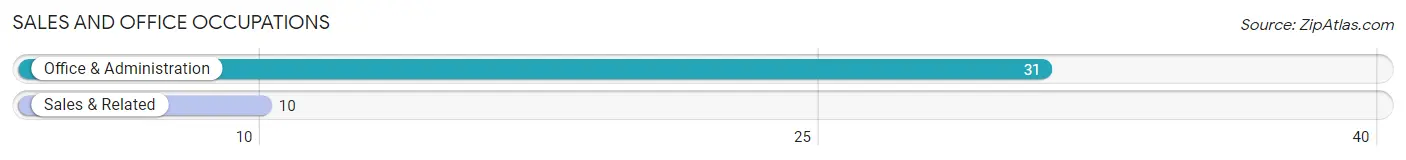
Sales and Office Occupations by Sex
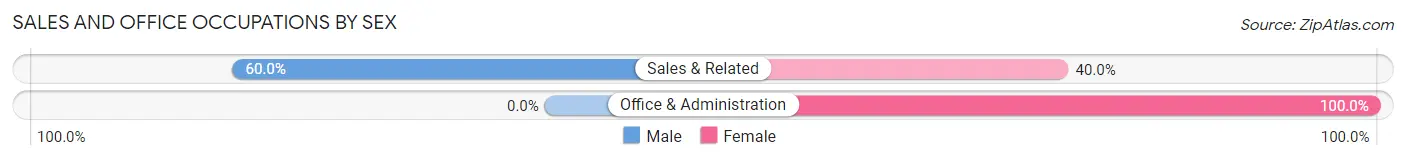
| Occupation | Male | Female |
| Sales & Related | 6 (60.0%) | 4 (40.0%) |
| Office & Administration | 0 (0.0%) | 31 (100.0%) |
| Total (Category) | 6 (14.6%) | 35 (85.4%) |
| Total (Overall) | 91 (54.2%) | 77 (45.8%) |
Natural Resources, Construction and Maintenance Occupations
The most common Natural Resources, Construction and Maintenance occupations in Eastville are , and Farming, Fishing & Forestry (17 | 10.1%).
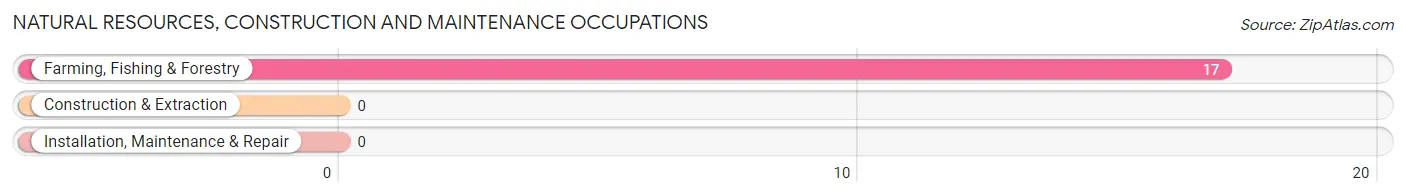
Natural Resources, Construction and Maintenance Occupations by Sex
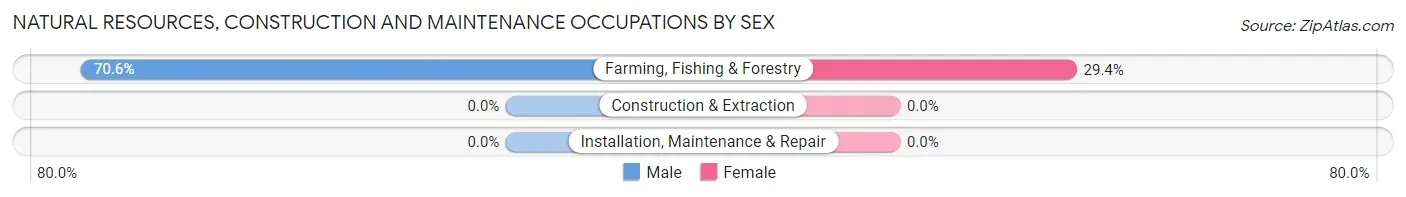
| Occupation | Male | Female |
| Farming, Fishing & Forestry | 12 (70.6%) | 5 (29.4%) |
| Construction & Extraction | 0 (0.0%) | 0 (0.0%) |
| Installation, Maintenance & Repair | 0 (0.0%) | 0 (0.0%) |
| Total (Category) | 12 (70.6%) | 5 (29.4%) |
| Total (Overall) | 91 (54.2%) | 77 (45.8%) |
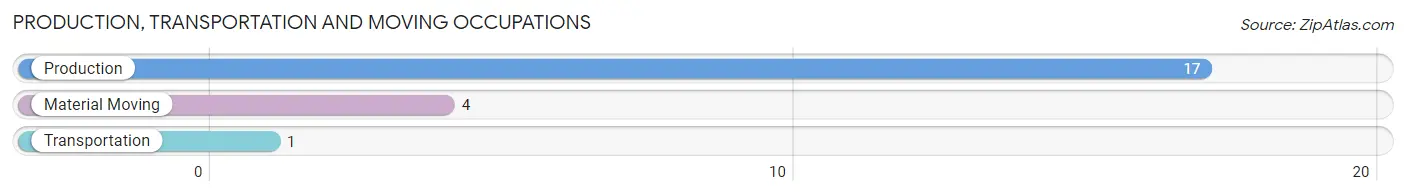
Production, Transportation and Moving Occupations
The most common Production, Transportation and Moving occupations in Eastville are Production (17 | 10.1%), Material Moving (4 | 2.4%), and Transportation (1 | 0.6%).
Production, Transportation and Moving Occupations by Sex
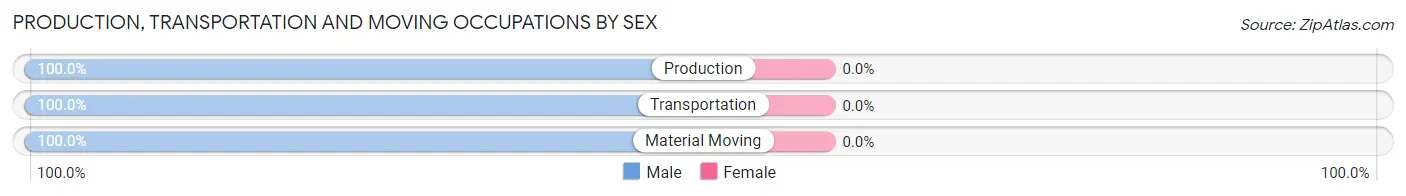
| Occupation | Male | Female |
| Production | 17 (100.0%) | 0 (0.0%) |
| Transportation | 1 (100.0%) | 0 (0.0%) |
| Material Moving | 4 (100.0%) | 0 (0.0%) |
| Total (Category) | 22 (100.0%) | 0 (0.0%) |
| Total (Overall) | 91 (54.2%) | 77 (45.8%) |
Employment Industries by Sex in Eastville
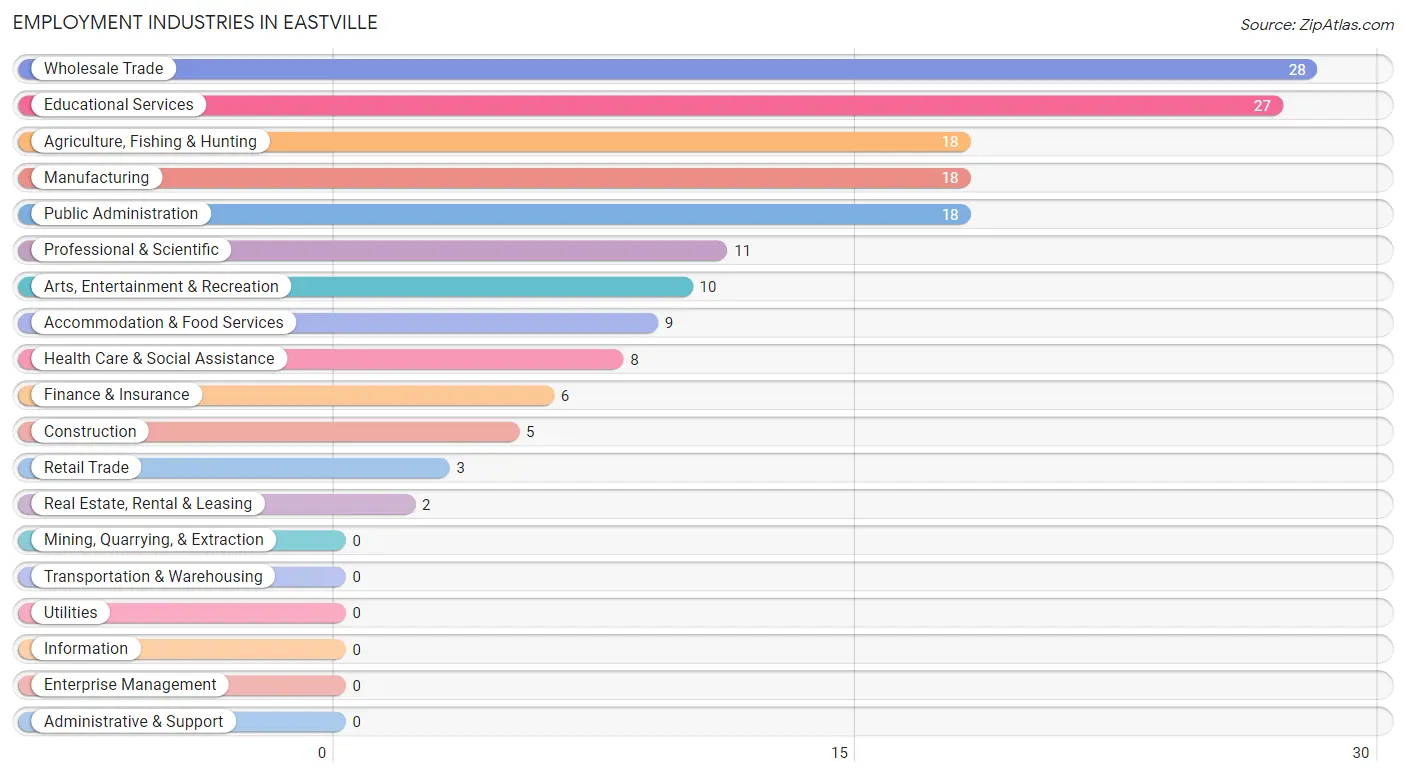
Employment Industries in Eastville
The major employment industries in Eastville include Wholesale Trade (28 | 16.7%), Educational Services (27 | 16.1%), Agriculture, Fishing & Hunting (18 | 10.7%), Manufacturing (18 | 10.7%), and Public Administration (18 | 10.7%).
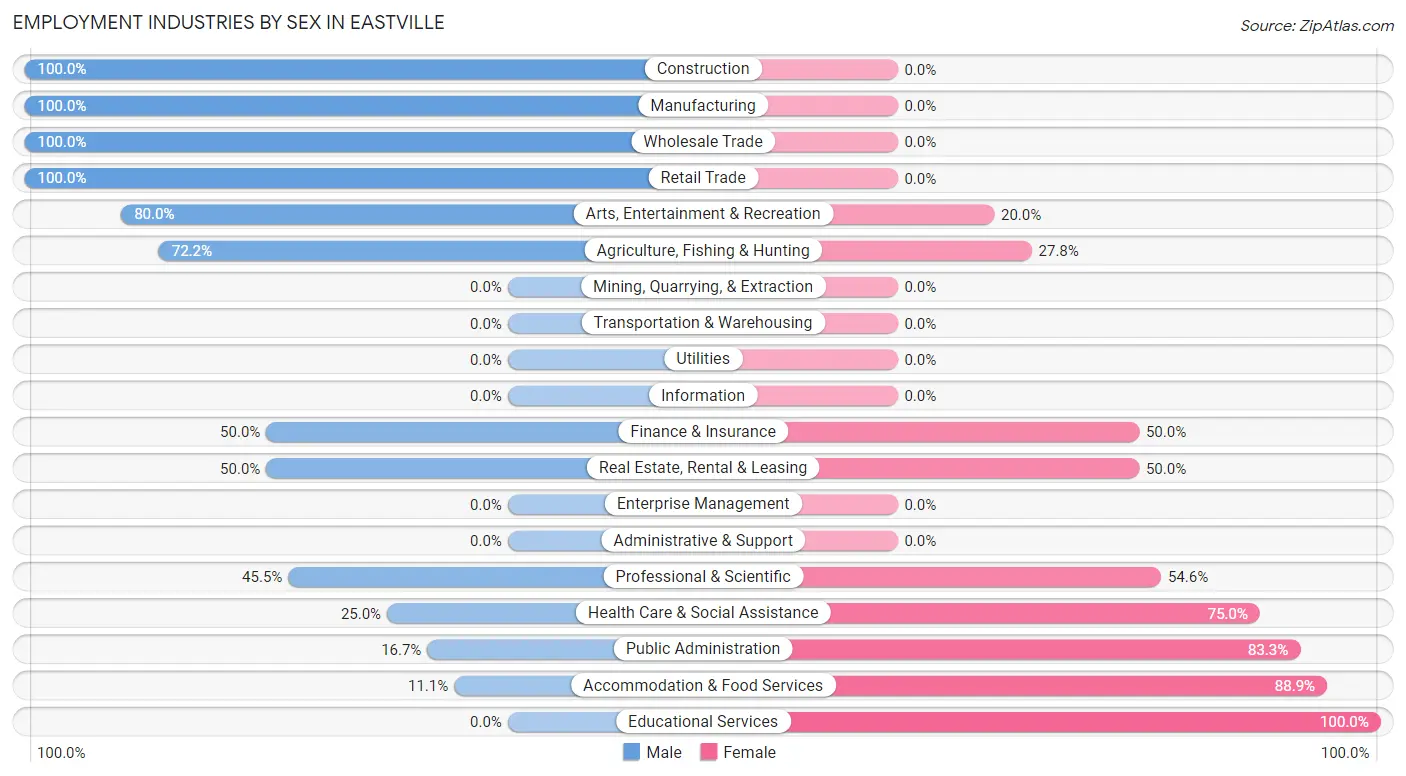
Employment Industries by Sex in Eastville
The Eastville industries that see more men than women are Construction (100.0%), Manufacturing (100.0%), and Wholesale Trade (100.0%), whereas the industries that tend to have a higher number of women are Educational Services (100.0%), Accommodation & Food Services (88.9%), and Public Administration (83.3%).
| Industry | Male | Female |
| Agriculture, Fishing & Hunting | 13 (72.2%) | 5 (27.8%) |
| Mining, Quarrying, & Extraction | 0 (0.0%) | 0 (0.0%) |
| Construction | 5 (100.0%) | 0 (0.0%) |
| Manufacturing | 18 (100.0%) | 0 (0.0%) |
| Wholesale Trade | 28 (100.0%) | 0 (0.0%) |
| Retail Trade | 3 (100.0%) | 0 (0.0%) |
| Transportation & Warehousing | 0 (0.0%) | 0 (0.0%) |
| Utilities | 0 (0.0%) | 0 (0.0%) |
| Information | 0 (0.0%) | 0 (0.0%) |
| Finance & Insurance | 3 (50.0%) | 3 (50.0%) |
| Real Estate, Rental & Leasing | 1 (50.0%) | 1 (50.0%) |
| Professional & Scientific | 5 (45.5%) | 6 (54.5%) |
| Enterprise Management | 0 (0.0%) | 0 (0.0%) |
| Administrative & Support | 0 (0.0%) | 0 (0.0%) |
| Educational Services | 0 (0.0%) | 27 (100.0%) |
| Health Care & Social Assistance | 2 (25.0%) | 6 (75.0%) |
| Arts, Entertainment & Recreation | 8 (80.0%) | 2 (20.0%) |
| Accommodation & Food Services | 1 (11.1%) | 8 (88.9%) |
| Public Administration | 3 (16.7%) | 15 (83.3%) |
| Total | 91 (54.2%) | 77 (45.8%) |
Education in Eastville
School Enrollment in Eastville
The most common levels of schooling among the 54 students in Eastville are elementary school (16 | 29.6%), middle school (16 | 29.6%), and high school (16 | 29.6%).
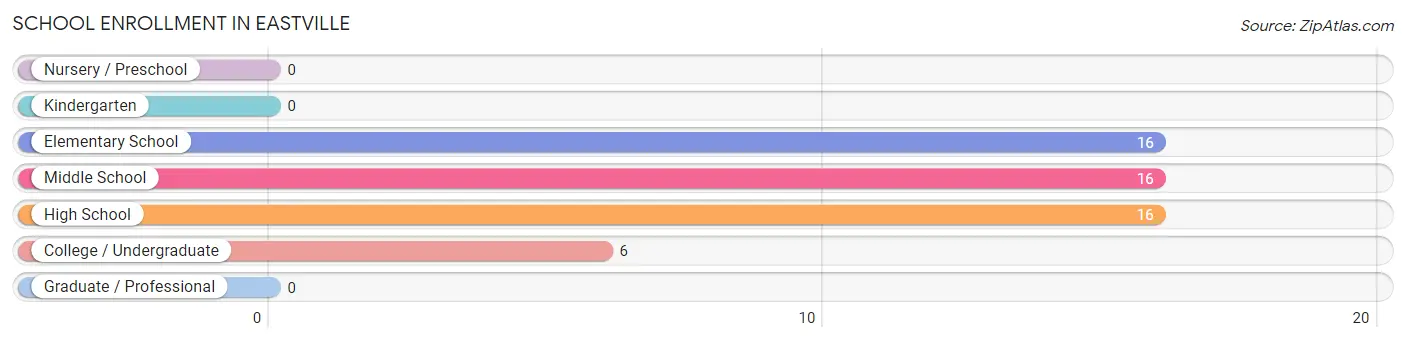
| School Level | # Students | % Students |
| Nursery / Preschool | 0 | 0.0% |
| Kindergarten | 0 | 0.0% |
| Elementary School | 16 | 29.6% |
| Middle School | 16 | 29.6% |
| High School | 16 | 29.6% |
| College / Undergraduate | 6 | 11.1% |
| Graduate / Professional | 0 | 0.0% |
| Total | 54 | 100.0% |
School Enrollment by Age by Funding Source in Eastville
Out of a total of 54 students who are enrolled in schools in Eastville, 31 (57.4%) attend a private institution, while the remaining 23 (42.6%) are enrolled in public schools. The age group of 25 to 34 year olds has the highest likelihood of being enrolled in private schools, with 6 (100.0% in the age bracket) enrolled. Conversely, the age group of 10 to 14 year olds has the lowest likelihood of being enrolled in a private school, with 5 (71.4% in the age bracket) attending a public institution.
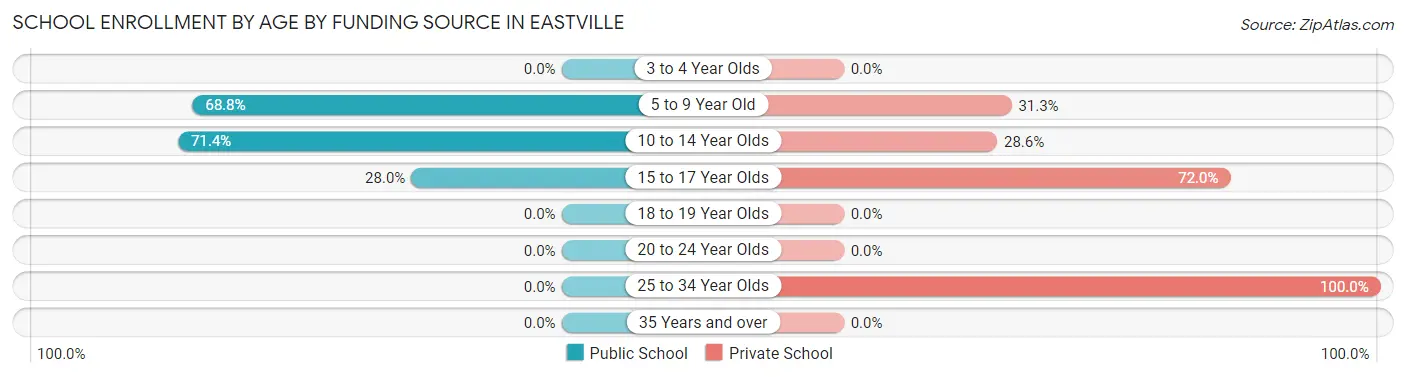
| Age Bracket | Public School | Private School |
| 3 to 4 Year Olds | 0 (0.0%) | 0 (0.0%) |
| 5 to 9 Year Old | 11 (68.8%) | 5 (31.2%) |
| 10 to 14 Year Olds | 5 (71.4%) | 2 (28.6%) |
| 15 to 17 Year Olds | 7 (28.0%) | 18 (72.0%) |
| 18 to 19 Year Olds | 0 (0.0%) | 0 (0.0%) |
| 20 to 24 Year Olds | 0 (0.0%) | 0 (0.0%) |
| 25 to 34 Year Olds | 0 (0.0%) | 6 (100.0%) |
| 35 Years and over | 0 (0.0%) | 0 (0.0%) |
| Total | 23 (42.6%) | 31 (57.4%) |
Educational Attainment by Field of Study in Eastville
Arts & humanities (20 | 28.2%), business (12 | 16.9%), literature & languages (7 | 9.9%), bio, nature & agricultural (6 | 8.5%), and social sciences (5 | 7.0%) are the most common fields of study among 71 individuals in Eastville who have obtained a bachelor's degree or higher.
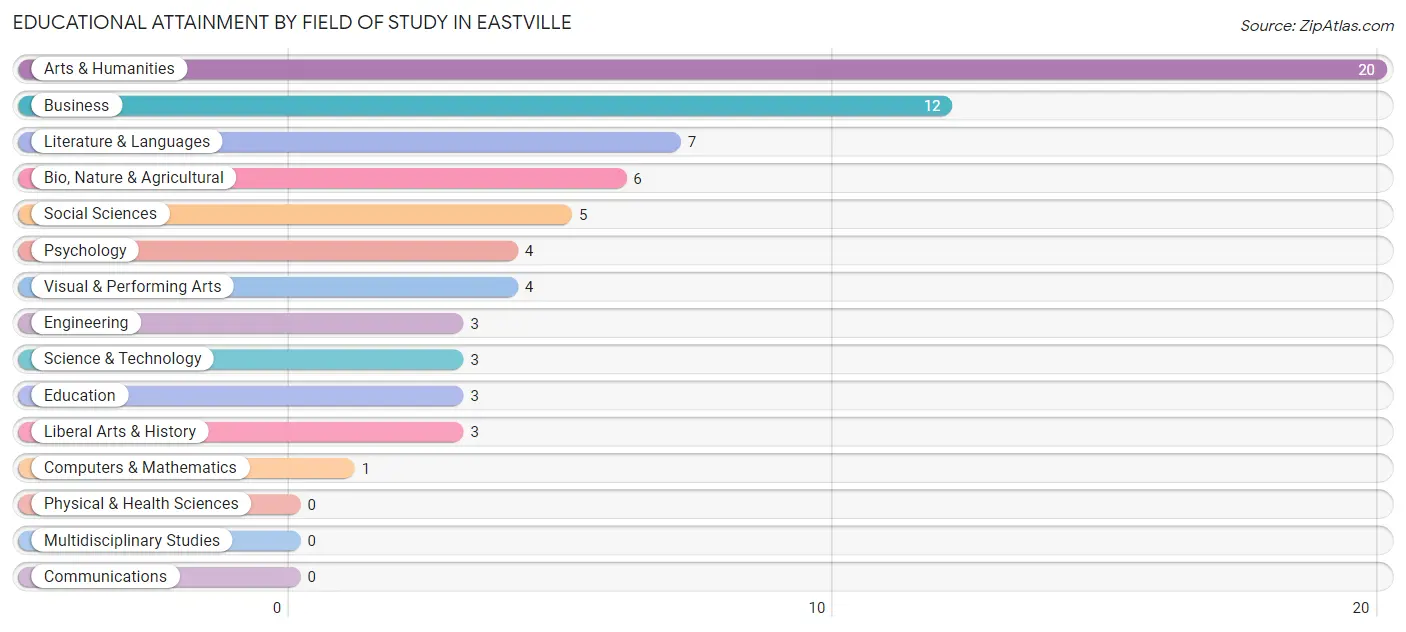
| Field of Study | # Graduates | % Graduates |
| Computers & Mathematics | 1 | 1.4% |
| Bio, Nature & Agricultural | 6 | 8.5% |
| Physical & Health Sciences | 0 | 0.0% |
| Psychology | 4 | 5.6% |
| Social Sciences | 5 | 7.0% |
| Engineering | 3 | 4.2% |
| Multidisciplinary Studies | 0 | 0.0% |
| Science & Technology | 3 | 4.2% |
| Business | 12 | 16.9% |
| Education | 3 | 4.2% |
| Literature & Languages | 7 | 9.9% |
| Liberal Arts & History | 3 | 4.2% |
| Visual & Performing Arts | 4 | 5.6% |
| Communications | 0 | 0.0% |
| Arts & Humanities | 20 | 28.2% |
| Total | 71 | 100.0% |
Transportation & Commute in Eastville
Vehicle Availability by Sex in Eastville
The most prevalent vehicle ownership categories in Eastville are males with 1 vehicle (46, accounting for 52.3%) and females with 1 vehicle (35, making up 59.7%).
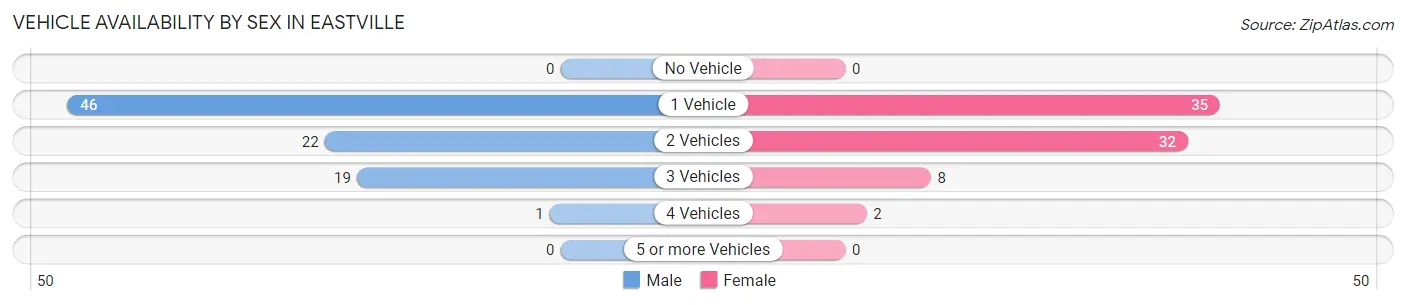
| Vehicles Available | Male | Female |
| No Vehicle | 0 (0.0%) | 0 (0.0%) |
| 1 Vehicle | 46 (52.3%) | 35 (45.5%) |
| 2 Vehicles | 22 (25.0%) | 32 (41.6%) |
| 3 Vehicles | 19 (21.6%) | 8 (10.4%) |
| 4 Vehicles | 1 (1.1%) | 2 (2.6%) |
| 5 or more Vehicles | 0 (0.0%) | 0 (0.0%) |
| Total | 88 (100.0%) | 77 (100.0%) |
Commute Time in Eastville
The most frequently occuring commute durations in Eastville are 15 to 19 minutes (37 commuters, 27.2%), 20 to 24 minutes (34 commuters, 25.0%), and 5 to 9 minutes (18 commuters, 13.2%).
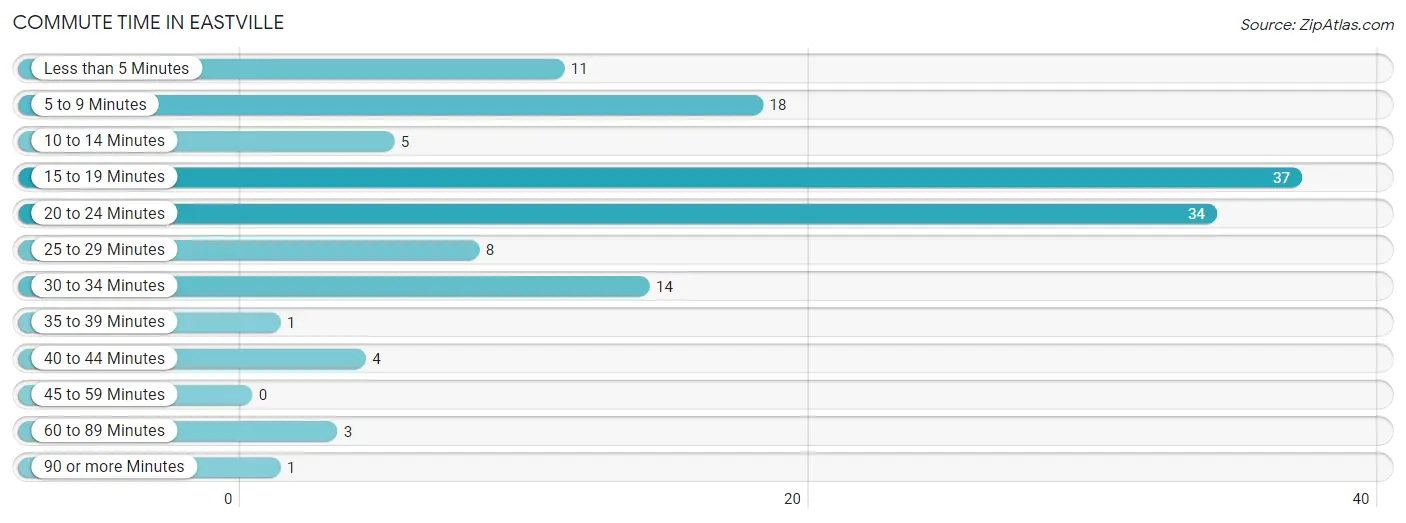
| Commute Time | # Commuters | % Commuters |
| Less than 5 Minutes | 11 | 8.1% |
| 5 to 9 Minutes | 18 | 13.2% |
| 10 to 14 Minutes | 5 | 3.7% |
| 15 to 19 Minutes | 37 | 27.2% |
| 20 to 24 Minutes | 34 | 25.0% |
| 25 to 29 Minutes | 8 | 5.9% |
| 30 to 34 Minutes | 14 | 10.3% |
| 35 to 39 Minutes | 1 | 0.7% |
| 40 to 44 Minutes | 4 | 2.9% |
| 45 to 59 Minutes | 0 | 0.0% |
| 60 to 89 Minutes | 3 | 2.2% |
| 90 or more Minutes | 1 | 0.7% |
Commute Time by Sex in Eastville
The most common commute times in Eastville are 20 to 24 minutes (25 commuters, 36.2%) for males and 15 to 19 minutes (22 commuters, 32.8%) for females.
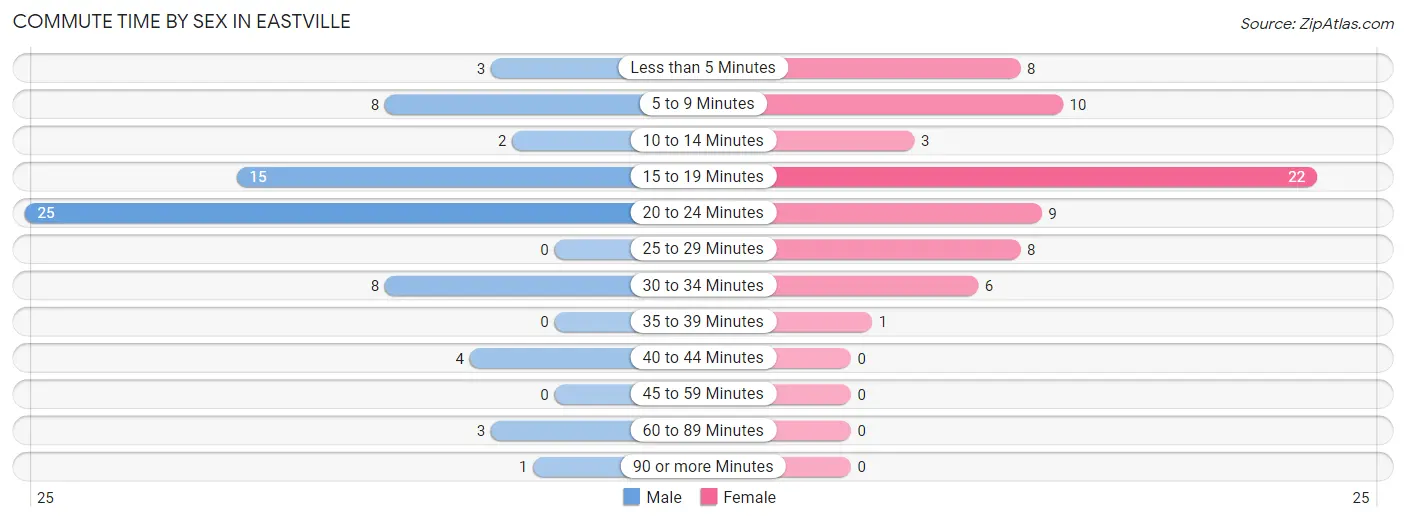
| Commute Time | Male | Female |
| Less than 5 Minutes | 3 (4.3%) | 8 (11.9%) |
| 5 to 9 Minutes | 8 (11.6%) | 10 (14.9%) |
| 10 to 14 Minutes | 2 (2.9%) | 3 (4.5%) |
| 15 to 19 Minutes | 15 (21.7%) | 22 (32.8%) |
| 20 to 24 Minutes | 25 (36.2%) | 9 (13.4%) |
| 25 to 29 Minutes | 0 (0.0%) | 8 (11.9%) |
| 30 to 34 Minutes | 8 (11.6%) | 6 (9.0%) |
| 35 to 39 Minutes | 0 (0.0%) | 1 (1.5%) |
| 40 to 44 Minutes | 4 (5.8%) | 0 (0.0%) |
| 45 to 59 Minutes | 0 (0.0%) | 0 (0.0%) |
| 60 to 89 Minutes | 3 (4.3%) | 0 (0.0%) |
| 90 or more Minutes | 1 (1.5%) | 0 (0.0%) |
Time of Departure to Work by Sex in Eastville
The most frequent times of departure to work in Eastville are 12:00 AM to 4:59 AM (25, 36.2%) for males and 8:00 AM to 8:29 AM (25, 37.3%) for females.
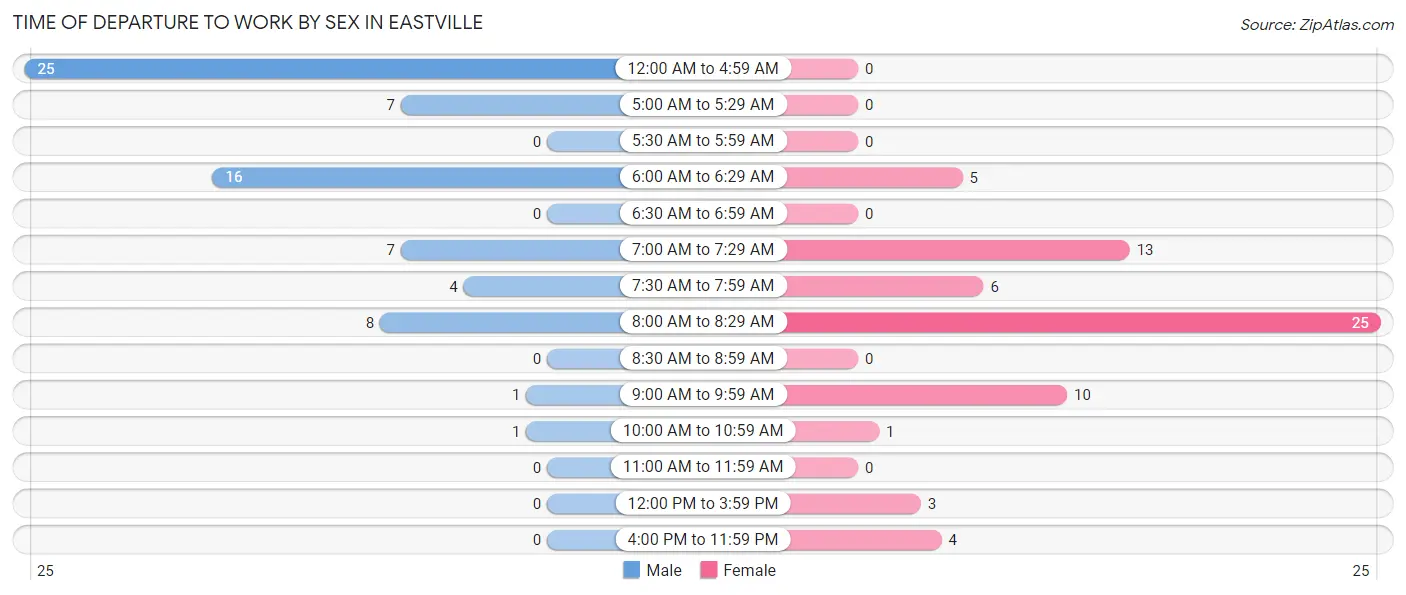
| Time of Departure | Male | Female |
| 12:00 AM to 4:59 AM | 25 (36.2%) | 0 (0.0%) |
| 5:00 AM to 5:29 AM | 7 (10.1%) | 0 (0.0%) |
| 5:30 AM to 5:59 AM | 0 (0.0%) | 0 (0.0%) |
| 6:00 AM to 6:29 AM | 16 (23.2%) | 5 (7.5%) |
| 6:30 AM to 6:59 AM | 0 (0.0%) | 0 (0.0%) |
| 7:00 AM to 7:29 AM | 7 (10.1%) | 13 (19.4%) |
| 7:30 AM to 7:59 AM | 4 (5.8%) | 6 (9.0%) |
| 8:00 AM to 8:29 AM | 8 (11.6%) | 25 (37.3%) |
| 8:30 AM to 8:59 AM | 0 (0.0%) | 0 (0.0%) |
| 9:00 AM to 9:59 AM | 1 (1.5%) | 10 (14.9%) |
| 10:00 AM to 10:59 AM | 1 (1.5%) | 1 (1.5%) |
| 11:00 AM to 11:59 AM | 0 (0.0%) | 0 (0.0%) |
| 12:00 PM to 3:59 PM | 0 (0.0%) | 3 (4.5%) |
| 4:00 PM to 11:59 PM | 0 (0.0%) | 4 (6.0%) |
| Total | 69 (100.0%) | 67 (100.0%) |
Housing Occupancy in Eastville
Occupancy by Ownership in Eastville
Of the total 180 dwellings in Eastville, owner-occupied units account for 104 (57.8%), while renter-occupied units make up 76 (42.2%).
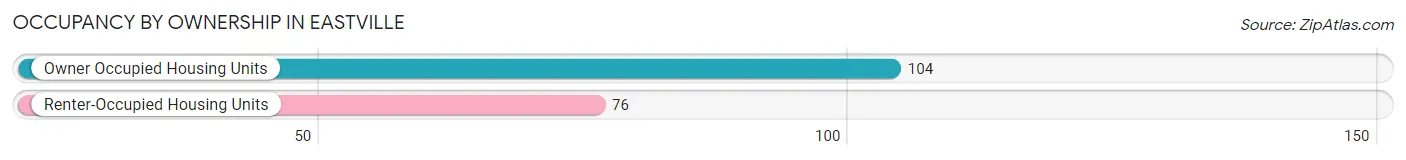
| Occupancy | # Housing Units | % Housing Units |
| Owner Occupied Housing Units | 104 | 57.8% |
| Renter-Occupied Housing Units | 76 | 42.2% |
| Total Occupied Housing Units | 180 | 100.0% |
Occupancy by Household Size in Eastville
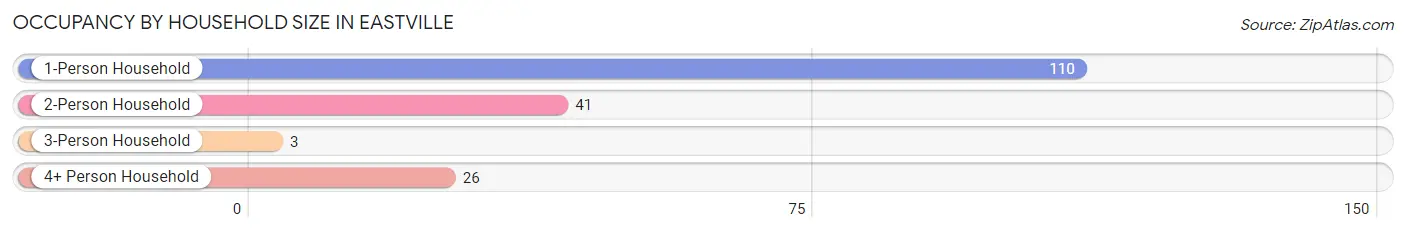
| Household Size | # Housing Units | % Housing Units |
| 1-Person Household | 110 | 61.1% |
| 2-Person Household | 41 | 22.8% |
| 3-Person Household | 3 | 1.7% |
| 4+ Person Household | 26 | 14.4% |
| Total Housing Units | 180 | 100.0% |
Occupancy by Ownership by Household Size in Eastville
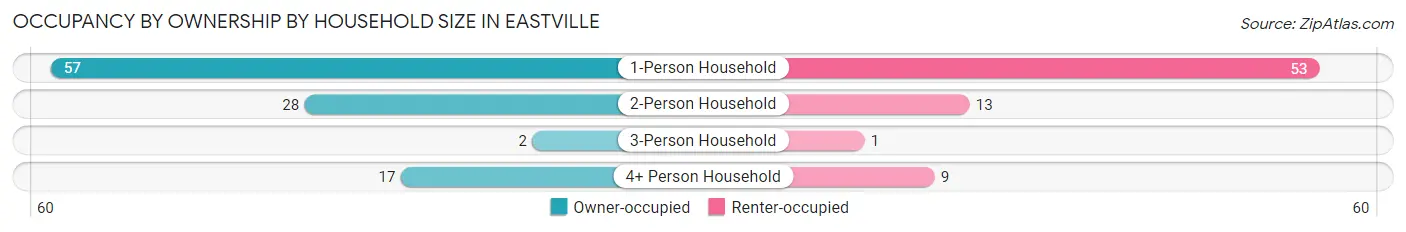
| Household Size | Owner-occupied | Renter-occupied |
| 1-Person Household | 57 (51.8%) | 53 (48.2%) |
| 2-Person Household | 28 (68.3%) | 13 (31.7%) |
| 3-Person Household | 2 (66.7%) | 1 (33.3%) |
| 4+ Person Household | 17 (65.4%) | 9 (34.6%) |
| Total Housing Units | 104 (57.8%) | 76 (42.2%) |
Occupancy by Educational Attainment in Eastville
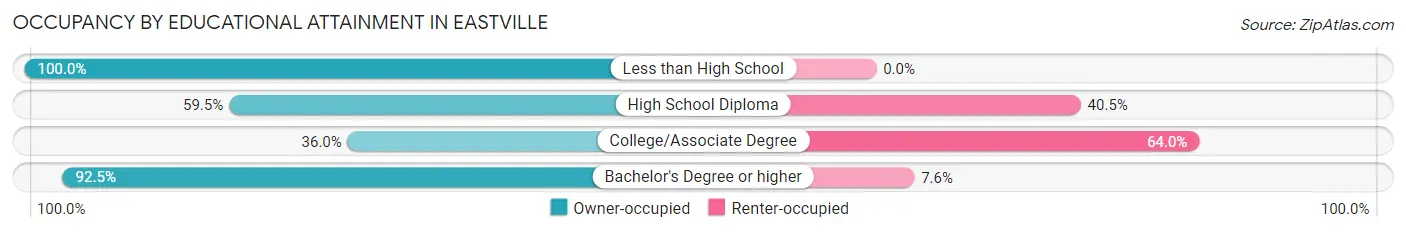
| Household Size | Owner-occupied | Renter-occupied |
| Less than High School | 1 (100.0%) | 0 (0.0%) |
| High School Diploma | 22 (59.5%) | 15 (40.5%) |
| College/Associate Degree | 32 (36.0%) | 57 (64.0%) |
| Bachelor's Degree or higher | 49 (92.4%) | 4 (7.5%) |
Occupancy by Age of Householder in Eastville
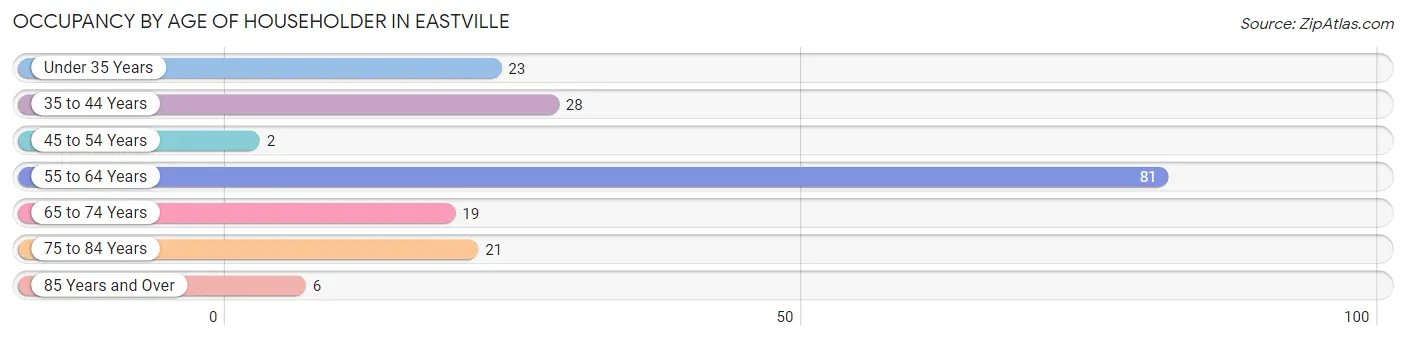
| Age Bracket | # Households | % Households |
| Under 35 Years | 23 | 12.8% |
| 35 to 44 Years | 28 | 15.6% |
| 45 to 54 Years | 2 | 1.1% |
| 55 to 64 Years | 81 | 45.0% |
| 65 to 74 Years | 19 | 10.6% |
| 75 to 84 Years | 21 | 11.7% |
| 85 Years and Over | 6 | 3.3% |
| Total | 180 | 100.0% |
Housing Finances in Eastville
Median Income by Occupancy in Eastville
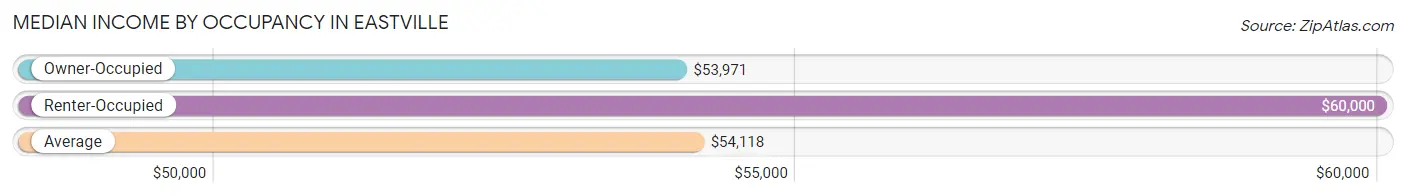
| Occupancy Type | # Households | Median Income |
| Owner-Occupied | 104 (57.8%) | $53,971 |
| Renter-Occupied | 76 (42.2%) | $60,000 |
| Average | 180 (100.0%) | $54,118 |
Occupancy by Householder Income Bracket in Eastville
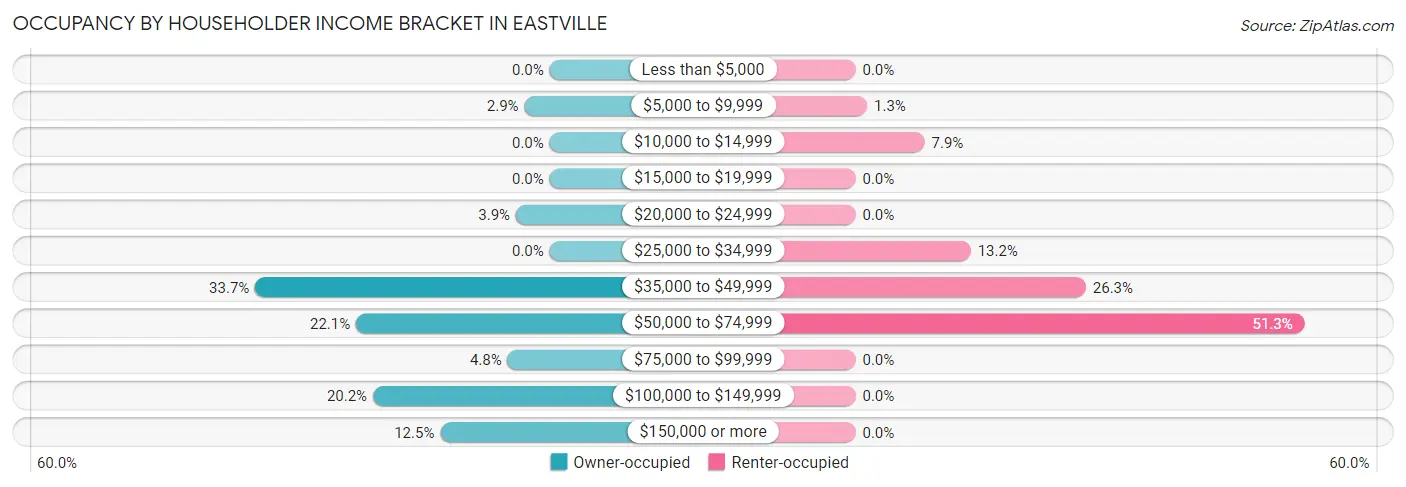
| Income Bracket | Owner-occupied | Renter-occupied |
| Less than $5,000 | 0 (0.0%) | 0 (0.0%) |
| $5,000 to $9,999 | 3 (2.9%) | 1 (1.3%) |
| $10,000 to $14,999 | 0 (0.0%) | 6 (7.9%) |
| $15,000 to $19,999 | 0 (0.0%) | 0 (0.0%) |
| $20,000 to $24,999 | 4 (3.8%) | 0 (0.0%) |
| $25,000 to $34,999 | 0 (0.0%) | 10 (13.2%) |
| $35,000 to $49,999 | 35 (33.7%) | 20 (26.3%) |
| $50,000 to $74,999 | 23 (22.1%) | 39 (51.3%) |
| $75,000 to $99,999 | 5 (4.8%) | 0 (0.0%) |
| $100,000 to $149,999 | 21 (20.2%) | 0 (0.0%) |
| $150,000 or more | 13 (12.5%) | 0 (0.0%) |
| Total | 104 (100.0%) | 76 (100.0%) |
Monthly Housing Cost Tiers in Eastville
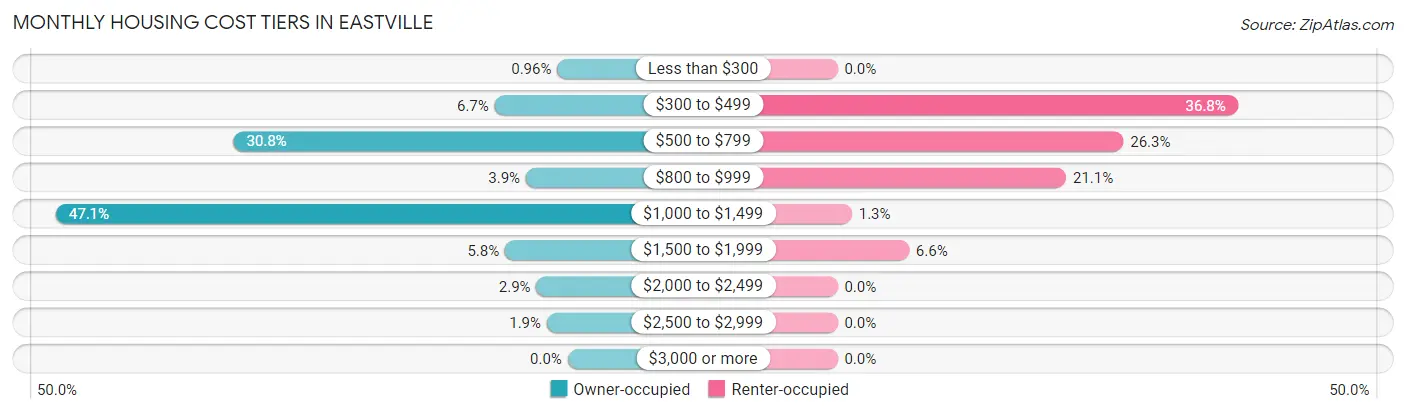
| Monthly Cost | Owner-occupied | Renter-occupied |
| Less than $300 | 1 (1.0%) | 0 (0.0%) |
| $300 to $499 | 7 (6.7%) | 28 (36.8%) |
| $500 to $799 | 32 (30.8%) | 20 (26.3%) |
| $800 to $999 | 4 (3.8%) | 16 (21.0%) |
| $1,000 to $1,499 | 49 (47.1%) | 1 (1.3%) |
| $1,500 to $1,999 | 6 (5.8%) | 5 (6.6%) |
| $2,000 to $2,499 | 3 (2.9%) | 0 (0.0%) |
| $2,500 to $2,999 | 2 (1.9%) | 0 (0.0%) |
| $3,000 or more | 0 (0.0%) | 0 (0.0%) |
| Total | 104 (100.0%) | 76 (100.0%) |
Physical Housing Characteristics in Eastville
Housing Structures in Eastville
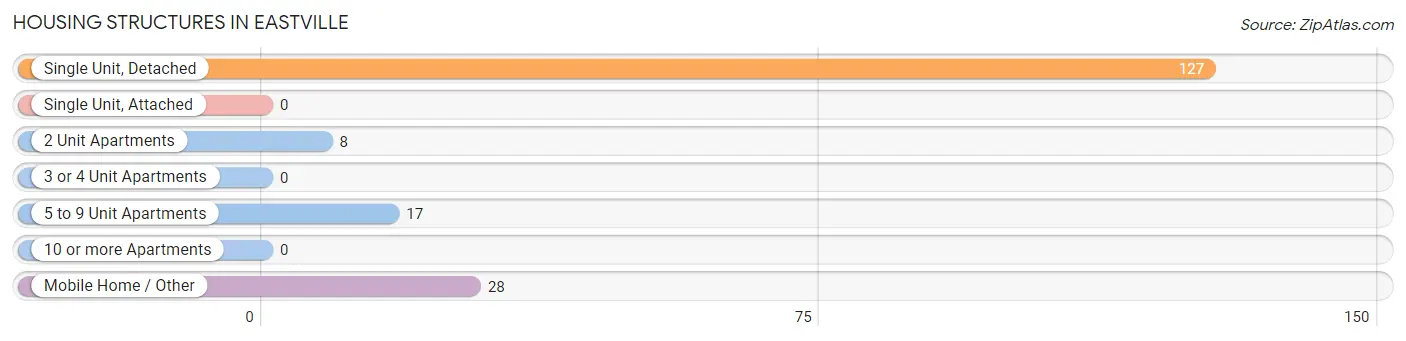
| Structure Type | # Housing Units | % Housing Units |
| Single Unit, Detached | 127 | 70.6% |
| Single Unit, Attached | 0 | 0.0% |
| 2 Unit Apartments | 8 | 4.4% |
| 3 or 4 Unit Apartments | 0 | 0.0% |
| 5 to 9 Unit Apartments | 17 | 9.4% |
| 10 or more Apartments | 0 | 0.0% |
| Mobile Home / Other | 28 | 15.6% |
| Total | 180 | 100.0% |
Housing Structures by Occupancy in Eastville
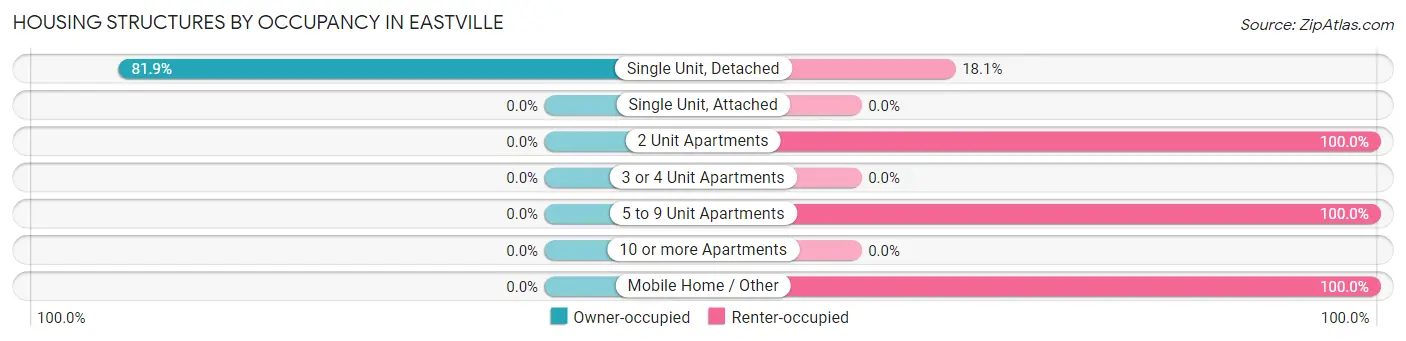
| Structure Type | Owner-occupied | Renter-occupied |
| Single Unit, Detached | 104 (81.9%) | 23 (18.1%) |
| Single Unit, Attached | 0 (0.0%) | 0 (0.0%) |
| 2 Unit Apartments | 0 (0.0%) | 8 (100.0%) |
| 3 or 4 Unit Apartments | 0 (0.0%) | 0 (0.0%) |
| 5 to 9 Unit Apartments | 0 (0.0%) | 17 (100.0%) |
| 10 or more Apartments | 0 (0.0%) | 0 (0.0%) |
| Mobile Home / Other | 0 (0.0%) | 28 (100.0%) |
| Total | 104 (57.8%) | 76 (42.2%) |
Housing Structures by Number of Rooms in Eastville
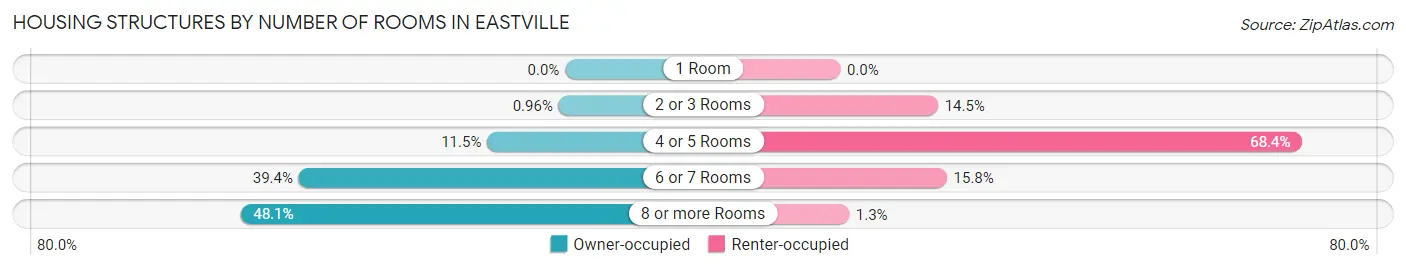
| Number of Rooms | Owner-occupied | Renter-occupied |
| 1 Room | 0 (0.0%) | 0 (0.0%) |
| 2 or 3 Rooms | 1 (1.0%) | 11 (14.5%) |
| 4 or 5 Rooms | 12 (11.5%) | 52 (68.4%) |
| 6 or 7 Rooms | 41 (39.4%) | 12 (15.8%) |
| 8 or more Rooms | 50 (48.1%) | 1 (1.3%) |
| Total | 104 (100.0%) | 76 (100.0%) |
Housing Structure by Heating Type in Eastville
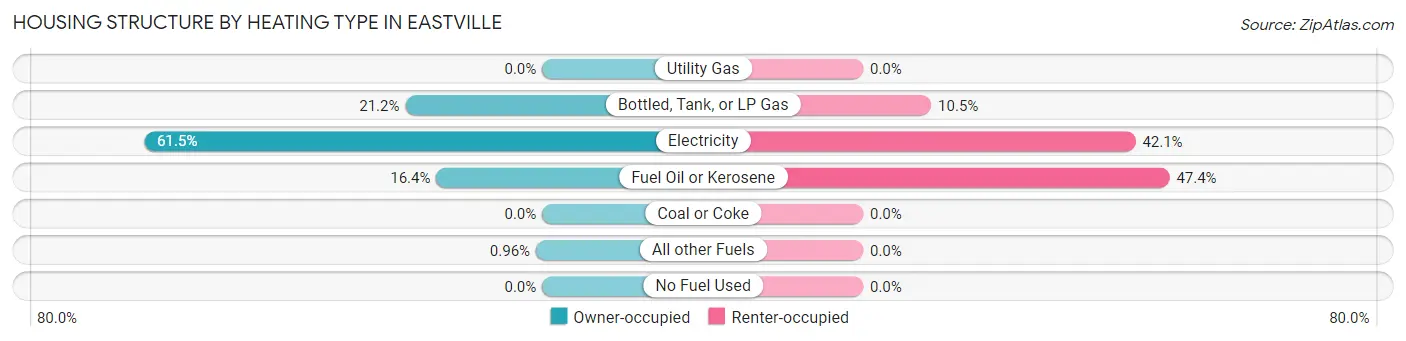
| Heating Type | Owner-occupied | Renter-occupied |
| Utility Gas | 0 (0.0%) | 0 (0.0%) |
| Bottled, Tank, or LP Gas | 22 (21.1%) | 8 (10.5%) |
| Electricity | 64 (61.5%) | 32 (42.1%) |
| Fuel Oil or Kerosene | 17 (16.4%) | 36 (47.4%) |
| Coal or Coke | 0 (0.0%) | 0 (0.0%) |
| All other Fuels | 1 (1.0%) | 0 (0.0%) |
| No Fuel Used | 0 (0.0%) | 0 (0.0%) |
| Total | 104 (100.0%) | 76 (100.0%) |
Household Vehicle Usage in Eastville
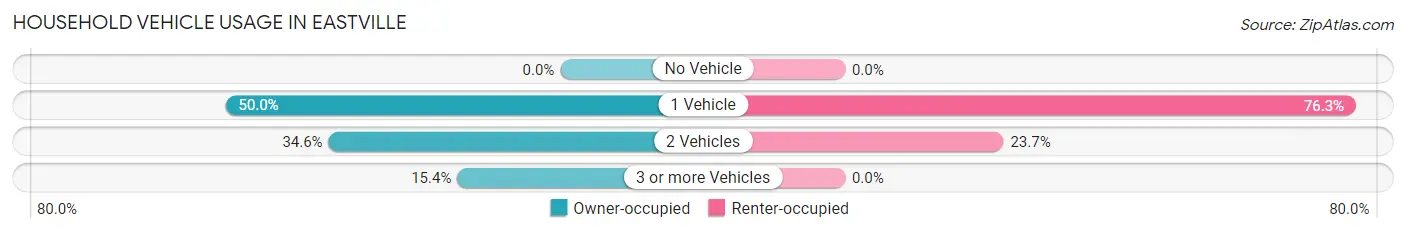
| Vehicles per Household | Owner-occupied | Renter-occupied |
| No Vehicle | 0 (0.0%) | 0 (0.0%) |
| 1 Vehicle | 52 (50.0%) | 58 (76.3%) |
| 2 Vehicles | 36 (34.6%) | 18 (23.7%) |
| 3 or more Vehicles | 16 (15.4%) | 0 (0.0%) |
| Total | 104 (100.0%) | 76 (100.0%) |
Real Estate & Mortgages in Eastville
Real Estate and Mortgage Overview in Eastville
| Characteristic | Without Mortgage | With Mortgage |
| Housing Units | 49 | 55 |
| Median Property Value | - | - |
| Median Household Income | $54,338 | $0 |
| Monthly Housing Costs | $597 | $0 |
| Real Estate Taxes | $2,596 | $4 |
Property Value by Mortgage Status in Eastville
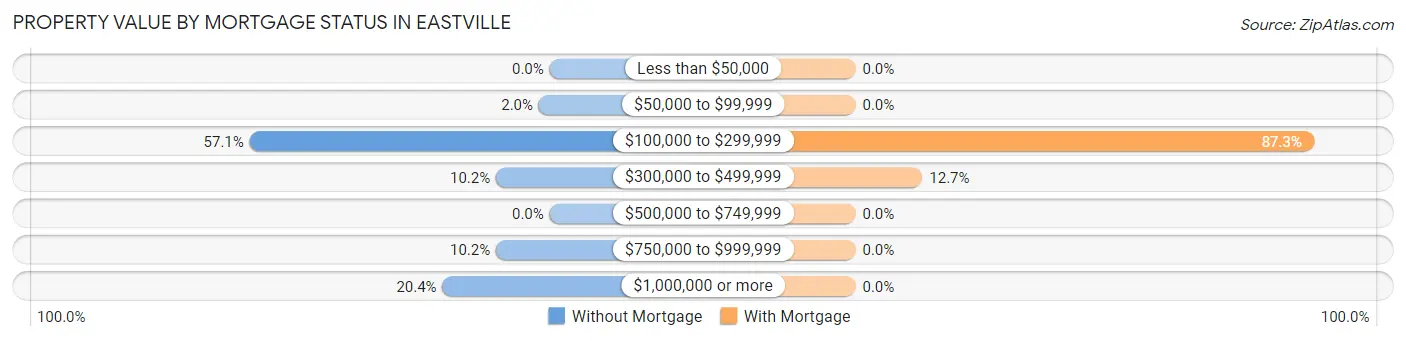
| Property Value | Without Mortgage | With Mortgage |
| Less than $50,000 | 0 (0.0%) | 0 (0.0%) |
| $50,000 to $99,999 | 1 (2.0%) | 0 (0.0%) |
| $100,000 to $299,999 | 28 (57.1%) | 48 (87.3%) |
| $300,000 to $499,999 | 5 (10.2%) | 7 (12.7%) |
| $500,000 to $749,999 | 0 (0.0%) | 0 (0.0%) |
| $750,000 to $999,999 | 5 (10.2%) | 0 (0.0%) |
| $1,000,000 or more | 10 (20.4%) | 0 (0.0%) |
| Total | 49 (100.0%) | 55 (100.0%) |
Household Income by Mortgage Status in Eastville
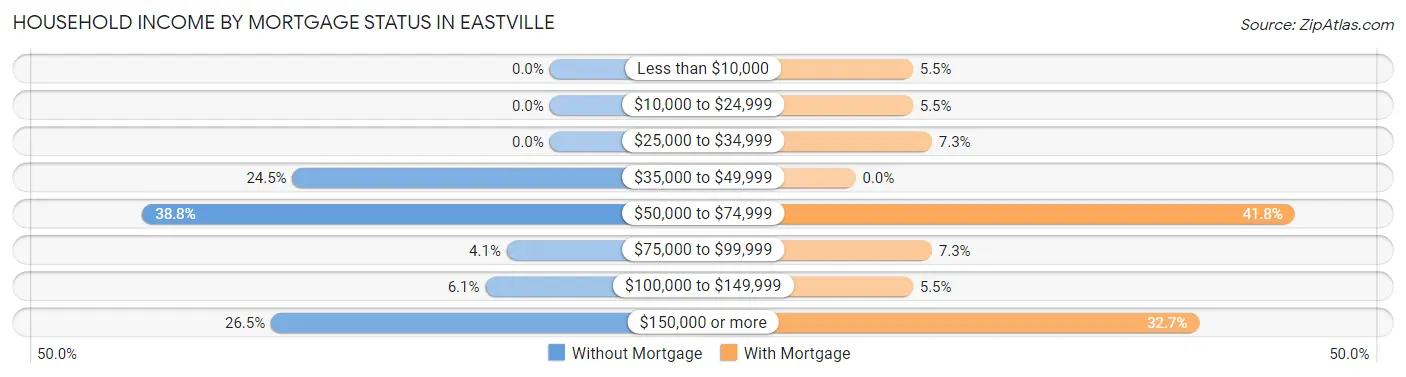
| Household Income | Without Mortgage | With Mortgage |
| Less than $10,000 | 0 (0.0%) | 3 (5.4%) |
| $10,000 to $24,999 | 0 (0.0%) | 3 (5.4%) |
| $25,000 to $34,999 | 0 (0.0%) | 4 (7.3%) |
| $35,000 to $49,999 | 12 (24.5%) | 0 (0.0%) |
| $50,000 to $74,999 | 19 (38.8%) | 23 (41.8%) |
| $75,000 to $99,999 | 2 (4.1%) | 4 (7.3%) |
| $100,000 to $149,999 | 3 (6.1%) | 3 (5.4%) |
| $150,000 or more | 13 (26.5%) | 18 (32.7%) |
| Total | 49 (100.0%) | 55 (100.0%) |
Property Value to Household Income Ratio in Eastville
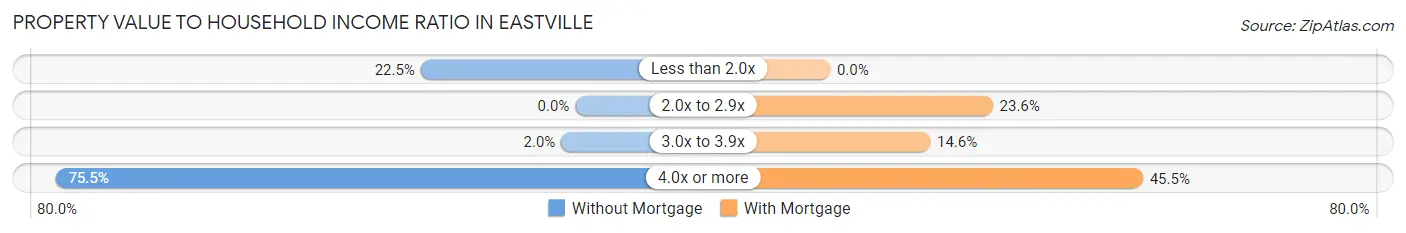
| Value-to-Income Ratio | Without Mortgage | With Mortgage |
| Less than 2.0x | 11 (22.5%) | 0 (0.0%) |
| 2.0x to 2.9x | 0 (0.0%) | 13 (23.6%) |
| 3.0x to 3.9x | 1 (2.0%) | 8 (14.5%) |
| 4.0x or more | 37 (75.5%) | 25 (45.5%) |
| Total | 49 (100.0%) | 55 (100.0%) |
Real Estate Taxes by Mortgage Status in Eastville
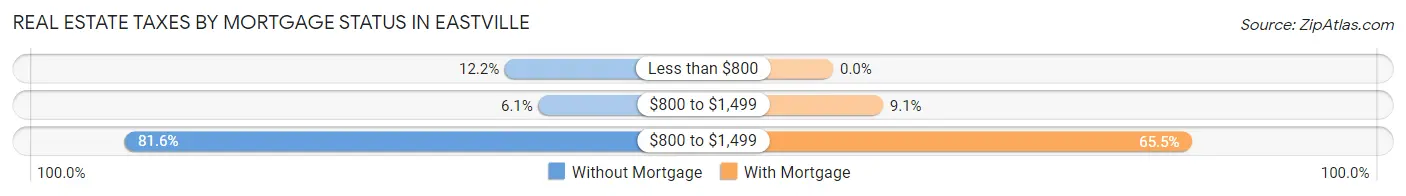
| Property Taxes | Without Mortgage | With Mortgage |
| Less than $800 | 6 (12.2%) | 0 (0.0%) |
| $800 to $1,499 | 3 (6.1%) | 5 (9.1%) |
| $800 to $1,499 | 40 (81.6%) | 36 (65.4%) |
| Total | 49 (100.0%) | 55 (100.0%) |
Health & Disability in Eastville
Health Insurance Coverage by Age in Eastville
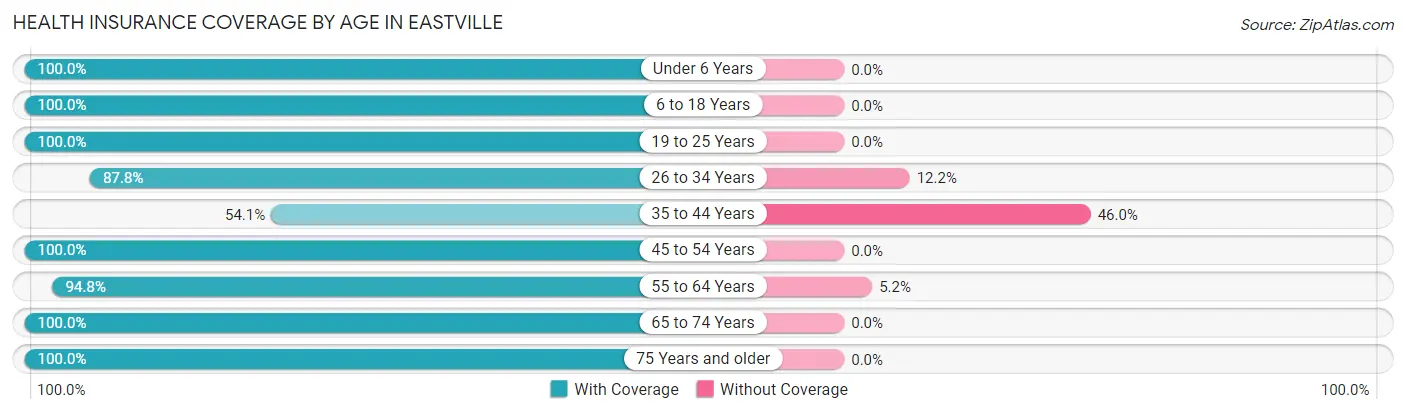
| Age Bracket | With Coverage | Without Coverage |
| Under 6 Years | 19 (100.0%) | 0 (0.0%) |
| 6 to 18 Years | 48 (100.0%) | 0 (0.0%) |
| 19 to 25 Years | 6 (100.0%) | 0 (0.0%) |
| 26 to 34 Years | 36 (87.8%) | 5 (12.2%) |
| 35 to 44 Years | 20 (54.0%) | 17 (46.0%) |
| 45 to 54 Years | 3 (100.0%) | 0 (0.0%) |
| 55 to 64 Years | 91 (94.8%) | 5 (5.2%) |
| 65 to 74 Years | 28 (100.0%) | 0 (0.0%) |
| 75 Years and older | 38 (100.0%) | 0 (0.0%) |
| Total | 289 (91.5%) | 27 (8.5%) |
Health Insurance Coverage by Citizenship Status in Eastville
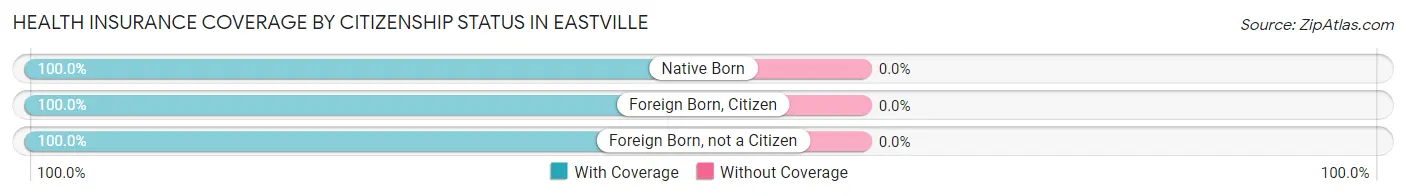
| Citizenship Status | With Coverage | Without Coverage |
| Native Born | 19 (100.0%) | 0 (0.0%) |
| Foreign Born, Citizen | 48 (100.0%) | 0 (0.0%) |
| Foreign Born, not a Citizen | 6 (100.0%) | 0 (0.0%) |
Health Insurance Coverage by Household Income in Eastville
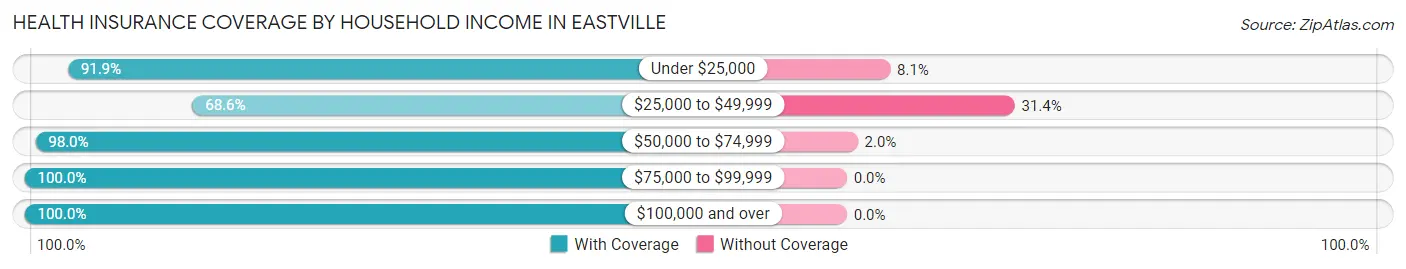
| Household Income | With Coverage | Without Coverage |
| Under $25,000 | 34 (91.9%) | 3 (8.1%) |
| $25,000 to $49,999 | 48 (68.6%) | 22 (31.4%) |
| $50,000 to $74,999 | 97 (98.0%) | 2 (2.0%) |
| $75,000 to $99,999 | 15 (100.0%) | 0 (0.0%) |
| $100,000 and over | 95 (100.0%) | 0 (0.0%) |
Public vs Private Health Insurance Coverage by Age in Eastville
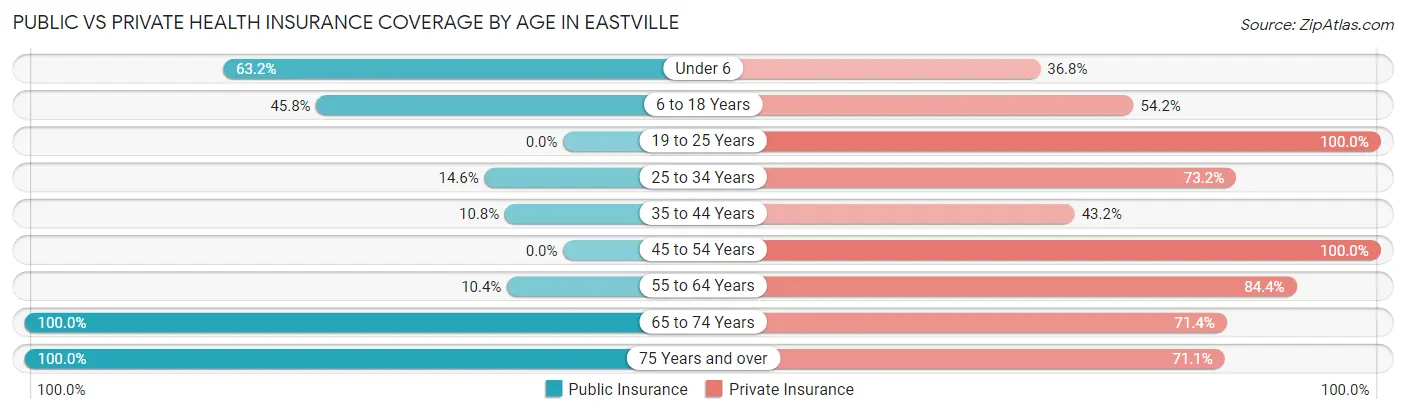
| Age Bracket | Public Insurance | Private Insurance |
| Under 6 | 12 (63.2%) | 7 (36.8%) |
| 6 to 18 Years | 22 (45.8%) | 26 (54.2%) |
| 19 to 25 Years | 0 (0.0%) | 6 (100.0%) |
| 25 to 34 Years | 6 (14.6%) | 30 (73.2%) |
| 35 to 44 Years | 4 (10.8%) | 16 (43.2%) |
| 45 to 54 Years | 0 (0.0%) | 3 (100.0%) |
| 55 to 64 Years | 10 (10.4%) | 81 (84.4%) |
| 65 to 74 Years | 28 (100.0%) | 20 (71.4%) |
| 75 Years and over | 38 (100.0%) | 27 (71.1%) |
| Total | 120 (38.0%) | 216 (68.3%) |
Disability Status by Sex by Age in Eastville

| Age Bracket | Male | Female |
| Under 5 Years | 0 (0.0%) | 0 (0.0%) |
| 5 to 17 Years | 2 (6.9%) | 1 (5.3%) |
| 18 to 34 Years | 0 (0.0%) | 0 (0.0%) |
| 35 to 64 Years | 6 (8.7%) | 0 (0.0%) |
| 65 to 74 Years | 2 (18.2%) | 7 (41.2%) |
| 75 Years and over | 4 (40.0%) | 13 (46.4%) |
Disability Class by Sex by Age in Eastville
Disability Class: Hearing Difficulty
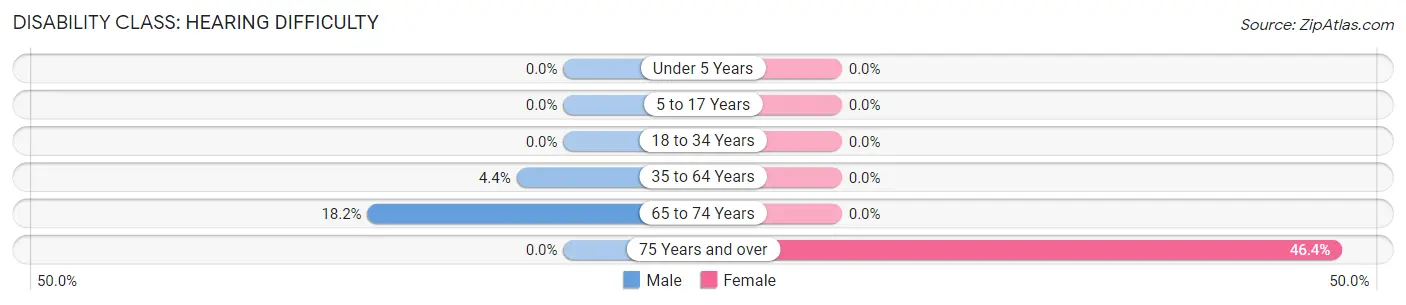
| Age Bracket | Male | Female |
| Under 5 Years | 0 (0.0%) | 0 (0.0%) |
| 5 to 17 Years | 0 (0.0%) | 0 (0.0%) |
| 18 to 34 Years | 0 (0.0%) | 0 (0.0%) |
| 35 to 64 Years | 3 (4.3%) | 0 (0.0%) |
| 65 to 74 Years | 2 (18.2%) | 0 (0.0%) |
| 75 Years and over | 0 (0.0%) | 13 (46.4%) |
Disability Class: Vision Difficulty
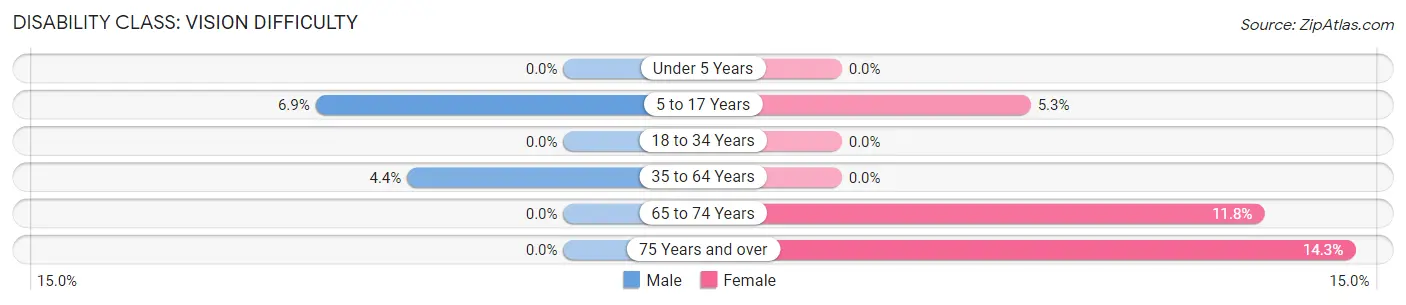
| Age Bracket | Male | Female |
| Under 5 Years | 0 (0.0%) | 0 (0.0%) |
| 5 to 17 Years | 2 (6.9%) | 1 (5.3%) |
| 18 to 34 Years | 0 (0.0%) | 0 (0.0%) |
| 35 to 64 Years | 3 (4.3%) | 0 (0.0%) |
| 65 to 74 Years | 0 (0.0%) | 2 (11.8%) |
| 75 Years and over | 0 (0.0%) | 4 (14.3%) |
Disability Class: Cognitive Difficulty
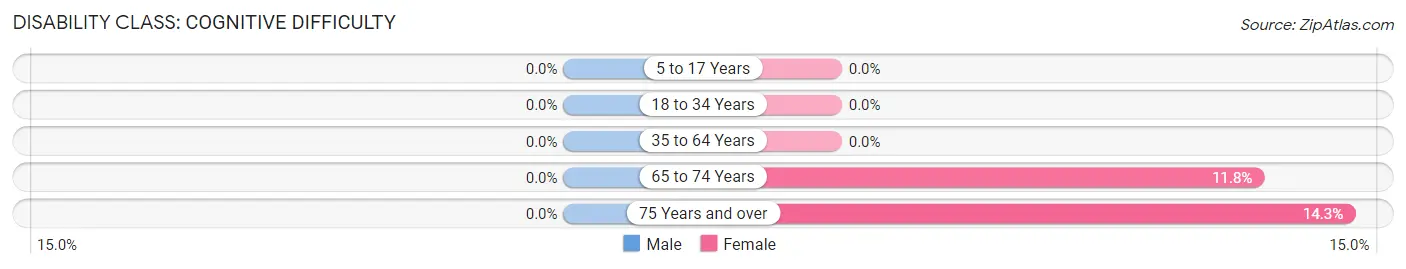
| Age Bracket | Male | Female |
| 5 to 17 Years | 0 (0.0%) | 0 (0.0%) |
| 18 to 34 Years | 0 (0.0%) | 0 (0.0%) |
| 35 to 64 Years | 0 (0.0%) | 0 (0.0%) |
| 65 to 74 Years | 0 (0.0%) | 2 (11.8%) |
| 75 Years and over | 0 (0.0%) | 4 (14.3%) |
Disability Class: Ambulatory Difficulty
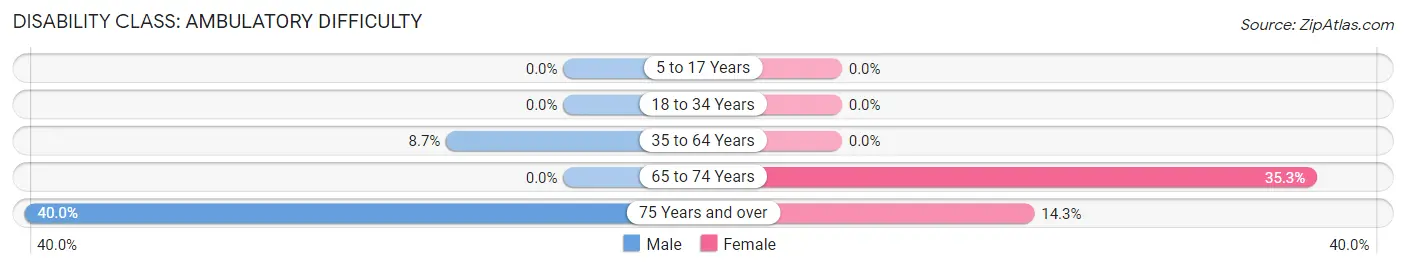
| Age Bracket | Male | Female |
| 5 to 17 Years | 0 (0.0%) | 0 (0.0%) |
| 18 to 34 Years | 0 (0.0%) | 0 (0.0%) |
| 35 to 64 Years | 6 (8.7%) | 0 (0.0%) |
| 65 to 74 Years | 0 (0.0%) | 6 (35.3%) |
| 75 Years and over | 4 (40.0%) | 4 (14.3%) |
Disability Class: Self-Care Difficulty
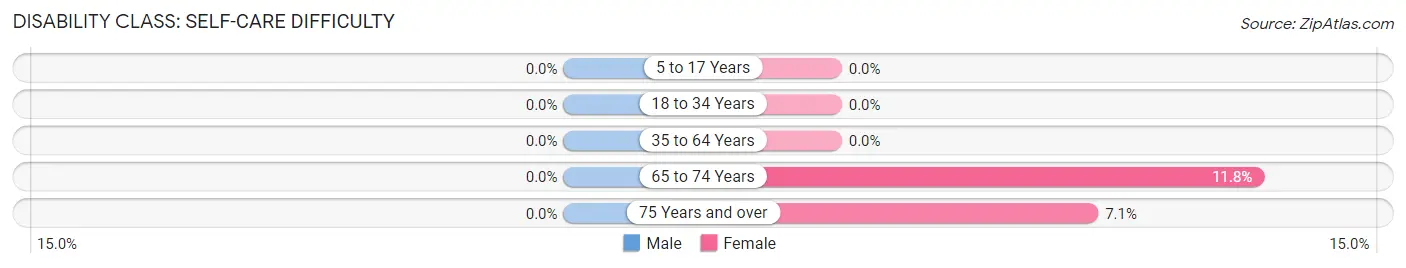
| Age Bracket | Male | Female |
| 5 to 17 Years | 0 (0.0%) | 0 (0.0%) |
| 18 to 34 Years | 0 (0.0%) | 0 (0.0%) |
| 35 to 64 Years | 0 (0.0%) | 0 (0.0%) |
| 65 to 74 Years | 0 (0.0%) | 2 (11.8%) |
| 75 Years and over | 0 (0.0%) | 2 (7.1%) |
Technology Access in Eastville
Computing Device Access in Eastville
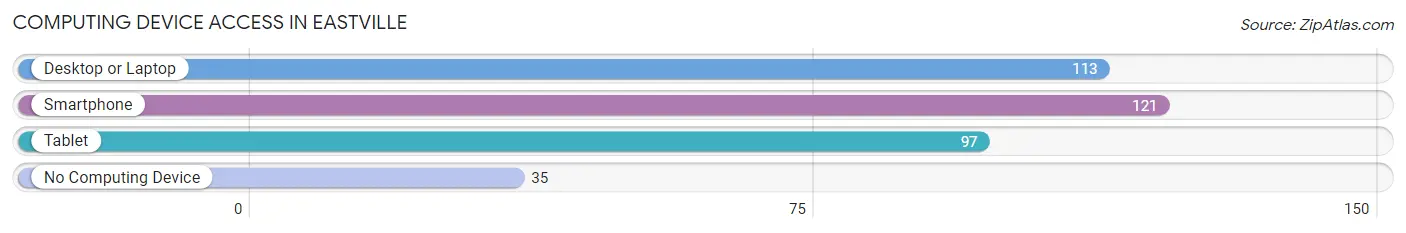
| Device Type | # Households | % Households |
| Desktop or Laptop | 113 | 62.8% |
| Smartphone | 121 | 67.2% |
| Tablet | 97 | 53.9% |
| No Computing Device | 35 | 19.4% |
| Total | 180 | 100.0% |
Internet Access in Eastville
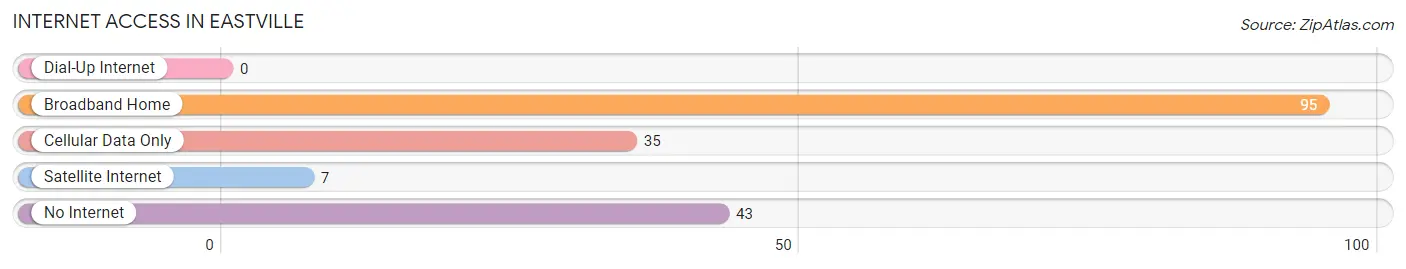
| Internet Type | # Households | % Households |
| Dial-Up Internet | 0 | 0.0% |
| Broadband Home | 95 | 52.8% |
| Cellular Data Only | 35 | 19.4% |
| Satellite Internet | 7 | 3.9% |
| No Internet | 43 | 23.9% |
| Total | 180 | 100.0% |
Eastville Summary
Eastville is a small town located in Northampton County, Virginia. It is situated on the Eastern Shore of Virginia, near the Chesapeake Bay. The town has a population of approximately 1,000 people and is part of the Hampton Roads metropolitan area.
History
Eastville was founded in 1711 by William and Mary College. The town was originally known as “East Town” and was the first settlement in Northampton County. The town was named after the East family, who were among the first settlers in the area.
In 1776, Eastville was the site of a major battle during the American Revolutionary War. The Battle of Great Bridge was fought between British and American forces, and resulted in a victory for the Americans.
In the 19th century, Eastville became a major port for the Chesapeake Bay oyster industry. The town was also home to several shipbuilding companies, which produced vessels for the U.S. Navy and merchant marine.
Geography
Eastville is located on the Eastern Shore of Virginia, near the Chesapeake Bay. The town is situated on the north side of the bay, and is bordered by the towns of Nassawadox and Exmore. The town is located approximately 30 miles south of the state capital, Richmond.
The town is situated on a flat coastal plain, with an average elevation of 10 feet above sea level. The town is located in a humid subtropical climate zone, with hot, humid summers and mild winters.
Economy
Eastville’s economy is largely based on agriculture and tourism. The town is home to several farms, which produce a variety of crops, including corn, soybeans, and wheat. The town is also home to several seafood processing plants, which process oysters, crabs, and other seafood for the local market.
Tourism is also an important part of the local economy. The town is home to several historic sites, including the Eastville Historic District, which is listed on the National Register of Historic Places. The town is also home to several parks and recreational areas, including the Eastville Beach Park and the Eastville Wildlife Management Area.
Demographics
As of the 2010 census, Eastville had a population of 1,000 people. The town is predominantly white, with a population that is 94.2% white, 2.2% African American, 0.7% Asian, and 0.1% Native American. The median household income in Eastville is $37,500, and the median home value is $150,000.
Eastville is served by the Northampton County Public Schools system. The town is home to one elementary school, one middle school, and one high school. The town is also home to several private schools, including the Eastville Academy and the Eastville Christian Academy.
Eastville is a small town with a rich history and a vibrant economy. The town is home to several historic sites, parks, and recreational areas, and is a popular destination for tourists. The town is also home to a diverse population, with a median household income and home value that are both above the national average.
Common Questions
What is Per Capita Income in Eastville?
Per Capita income in Eastville is $40,384.
What is the Median Family Income in Eastville?
Median Family Income in Eastville is $74,375.
What is the Median Household income in Eastville?
Median Household Income in Eastville is $54,118.
What is Income or Wage Gap in Eastville?
Income or Wage Gap in Eastville is 3.8%.
Women in Eastville earn 96.2 cents for every dollar earned by a man.
What is Inequality or Gini Index in Eastville?
Inequality or Gini Index in Eastville is 0.34.
What is the Total Population of Eastville?
Total Population of Eastville is 316.
What is the Total Male Population of Eastville?
Total Male Population of Eastville is 144.
What is the Total Female Population of Eastville?
Total Female Population of Eastville is 172.
What is the Ratio of Males per 100 Females in Eastville?
There are 83.72 Males per 100 Females in Eastville.
What is the Ratio of Females per 100 Males in Eastville?
There are 119.44 Females per 100 Males in Eastville.
What is the Median Population Age in Eastville?
Median Population Age in Eastville is 56.4 Years.
What is the Average Family Size in Eastville
Average Family Size in Eastville is 3.0 People.
What is the Average Household Size in Eastville
Average Household Size in Eastville is 1.8 People.
How Large is the Labor Force in Eastville?
There are 171 People in the Labor Forcein in Eastville.
What is the Percentage of People in the Labor Force in Eastville?
66.0% of People are in the Labor Force in Eastville.
What is the Unemployment Rate in Eastville?
Unemployment Rate in Eastville is 1.8%.