Tappahannock, VA Map & Demographics
Tappahannock Map
Tappahannock Overview
$27,503
PER CAPITA INCOME
$46,225
AVG FAMILY INCOME
$40,703
AVG HOUSEHOLD INCOME
48.4%
WAGE / INCOME GAP [ % ]
51.6¢/ $1
WAGE / INCOME GAP [ $ ]
$8,893
FAMILY INCOME DEFICIT
0.51
INEQUALITY / GINI INDEX
1,919
TOTAL POPULATION
878
MALE POPULATION
1,041
FEMALE POPULATION
84.34
MALES / 100 FEMALES
118.56
FEMALES / 100 MALES
48.2
MEDIAN AGE
2.4
AVG FAMILY SIZE
1.8
AVG HOUSEHOLD SIZE
776
LABOR FORCE [ PEOPLE ]
51.3%
PERCENT IN LABOR FORCE
5.7%
UNEMPLOYMENT RATE
Tappahannock Zip Codes
Tappahannock Area Codes
Income in Tappahannock
Income Overview in Tappahannock
Per Capita Income in Tappahannock is $27,503, while median incomes of families and households are $46,225 and $40,703 respectively.
| Characteristic | Number | Measure |
| Per Capita Income | 1,919 | $27,503 |
| Median Family Income | 501 | $46,225 |
| Mean Family Income | 501 | $66,617 |
| Median Household Income | 997 | $40,703 |
| Mean Household Income | 997 | $54,737 |
| Income Deficit | 501 | $8,893 |
| Wage / Income Gap (%) | 1,919 | 48.36% |
| Wage / Income Gap ($) | 1,919 | 51.64¢ per $1 |
| Gini / Inequality Index | 1,919 | 0.51 |
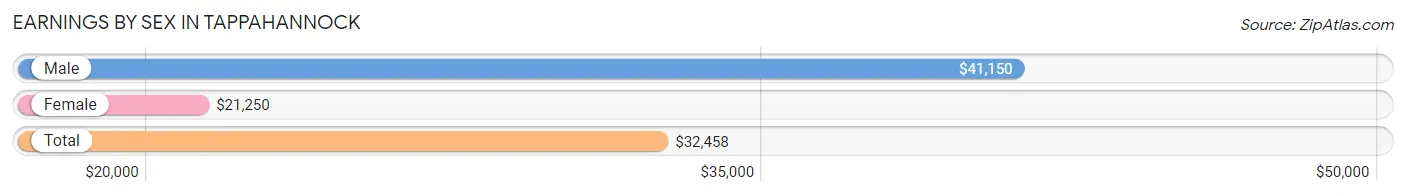
Earnings by Sex in Tappahannock
Average Earnings in Tappahannock are $32,458, $41,150 for men and $21,250 for women, a difference of 48.4%.
| Sex | Number | Average Earnings |
| Male | 401 (48.5%) | $41,150 |
| Female | 426 (51.5%) | $21,250 |
| Total | 827 (100.0%) | $32,458 |
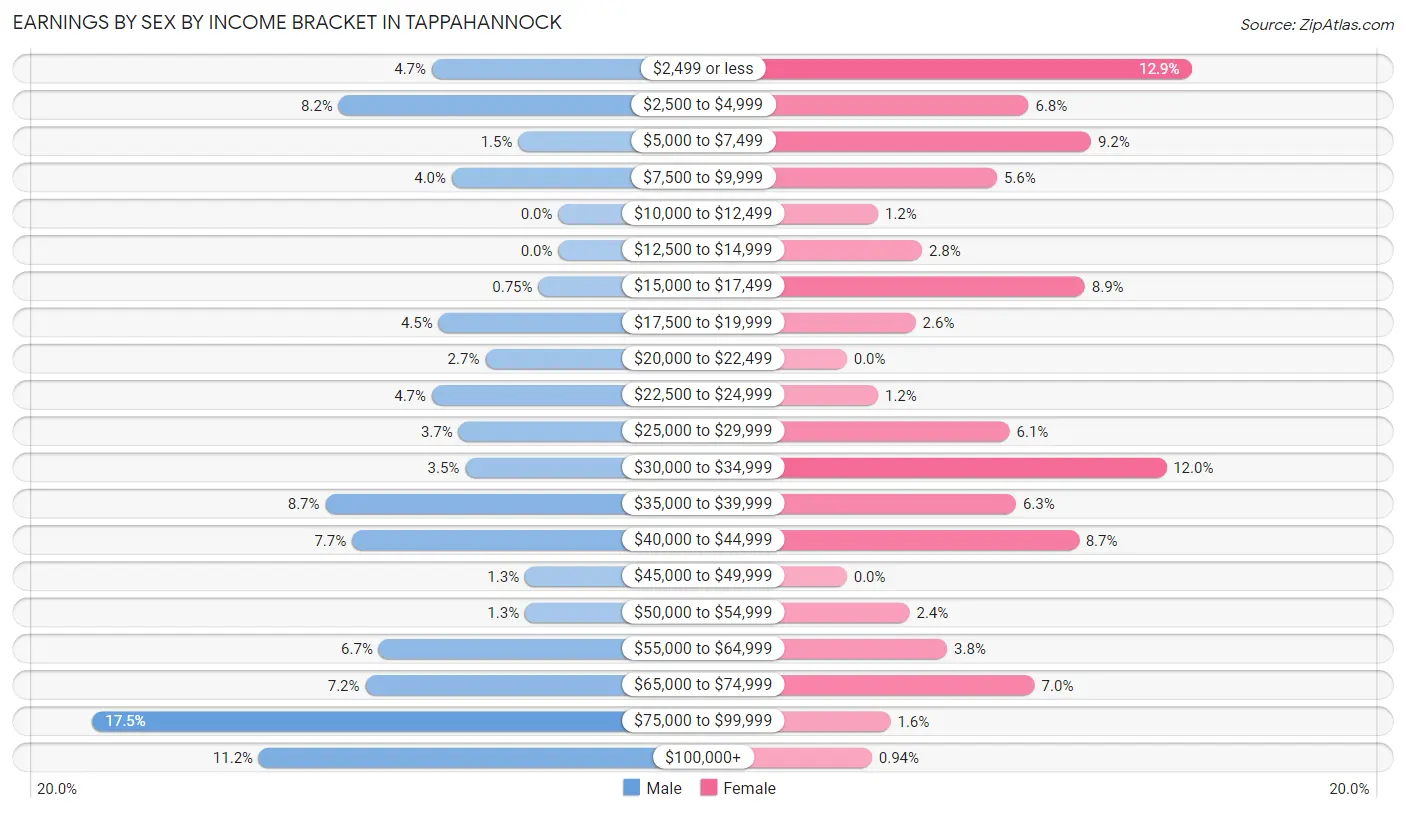
Earnings by Sex by Income Bracket in Tappahannock
The most common earnings brackets in Tappahannock are $75,000 to $99,999 for men (70 | 17.5%) and $2,499 or less for women (55 | 12.9%).
| Income | Male | Female |
| $2,499 or less | 19 (4.7%) | 55 (12.9%) |
| $2,500 to $4,999 | 33 (8.2%) | 29 (6.8%) |
| $5,000 to $7,499 | 6 (1.5%) | 39 (9.1%) |
| $7,500 to $9,999 | 16 (4.0%) | 24 (5.6%) |
| $10,000 to $12,499 | 0 (0.0%) | 5 (1.2%) |
| $12,500 to $14,999 | 0 (0.0%) | 12 (2.8%) |
| $15,000 to $17,499 | 3 (0.7%) | 38 (8.9%) |
| $17,500 to $19,999 | 18 (4.5%) | 11 (2.6%) |
| $20,000 to $22,499 | 11 (2.7%) | 0 (0.0%) |
| $22,500 to $24,999 | 19 (4.7%) | 5 (1.2%) |
| $25,000 to $29,999 | 15 (3.7%) | 26 (6.1%) |
| $30,000 to $34,999 | 14 (3.5%) | 51 (12.0%) |
| $35,000 to $39,999 | 35 (8.7%) | 27 (6.3%) |
| $40,000 to $44,999 | 31 (7.7%) | 37 (8.7%) |
| $45,000 to $49,999 | 5 (1.3%) | 0 (0.0%) |
| $50,000 to $54,999 | 5 (1.3%) | 10 (2.4%) |
| $55,000 to $64,999 | 27 (6.7%) | 16 (3.8%) |
| $65,000 to $74,999 | 29 (7.2%) | 30 (7.0%) |
| $75,000 to $99,999 | 70 (17.5%) | 7 (1.6%) |
| $100,000+ | 45 (11.2%) | 4 (0.9%) |
| Total | 401 (100.0%) | 426 (100.0%) |
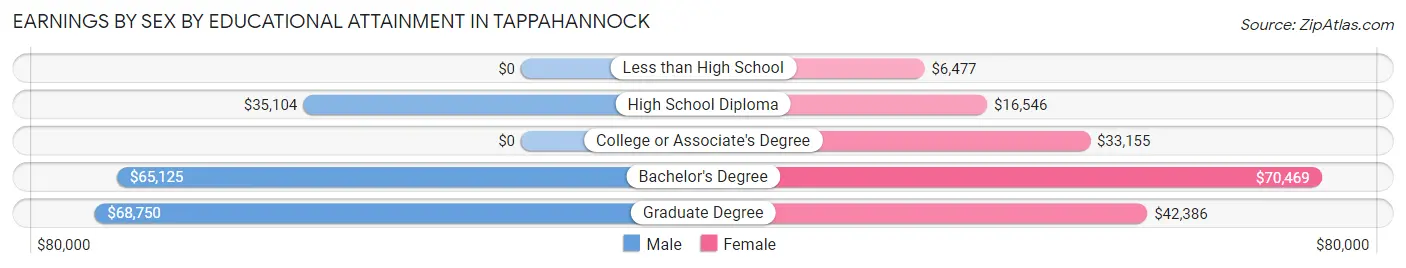
Earnings by Sex by Educational Attainment in Tappahannock
Average earnings in Tappahannock are $44,167 for men and $27,750 for women, a difference of 37.2%. Men with an educational attainment of graduate degree enjoy the highest average annual earnings of $68,750, while those with high school diploma education earn the least with $35,104. Women with an educational attainment of bachelor's degree earn the most with the average annual earnings of $70,469, while those with less than high school education have the smallest earnings of $6,477.
| Educational Attainment | Male Income | Female Income |
| Less than High School | - | - |
| High School Diploma | $35,104 | $16,546 |
| College or Associate's Degree | - | - |
| Bachelor's Degree | $65,125 | $70,469 |
| Graduate Degree | $68,750 | $42,386 |
| Total | $44,167 | $27,750 |
Family Income in Tappahannock
Family Income Brackets in Tappahannock
According to the Tappahannock family income data, there are 117 families falling into the $35,000 to $49,999 income range, which is the most common income bracket and makes up 23.4% of all families. Conversely, the $150,000 to $199,999 income bracket is the least frequent group with only 7 families (1.4%) belonging to this category.
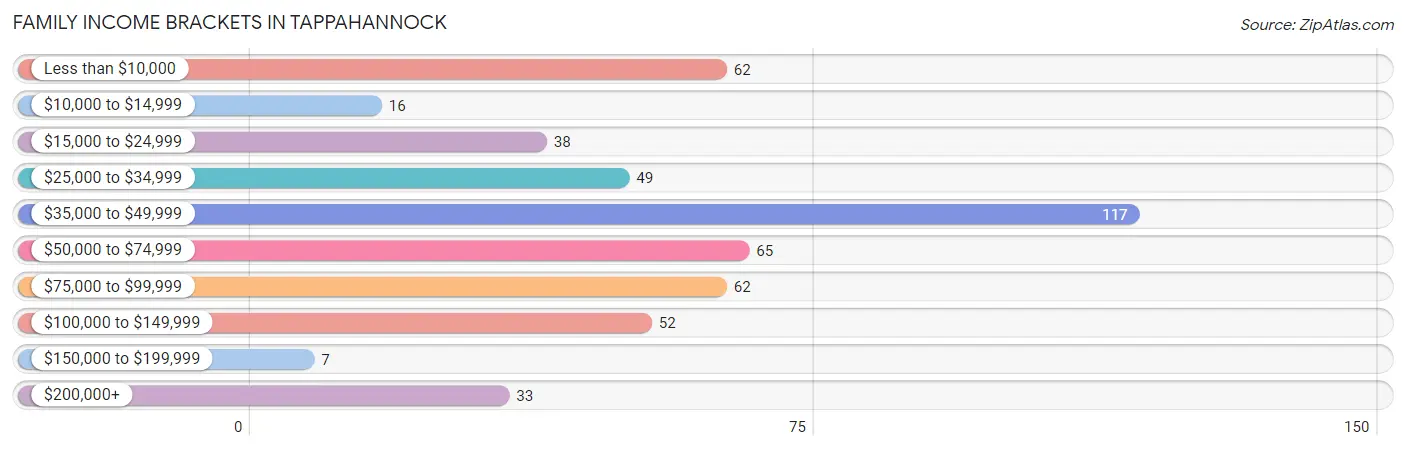
| Income Bracket | # Families | % Families |
| Less than $10,000 | 62 | 12.4% |
| $10,000 to $14,999 | 16 | 3.2% |
| $15,000 to $24,999 | 38 | 7.6% |
| $25,000 to $34,999 | 49 | 9.8% |
| $35,000 to $49,999 | 117 | 23.4% |
| $50,000 to $74,999 | 65 | 13.0% |
| $75,000 to $99,999 | 62 | 12.4% |
| $100,000 to $149,999 | 52 | 10.4% |
| $150,000 to $199,999 | 7 | 1.4% |
| $200,000+ | 33 | 6.6% |
Family Income by Famaliy Size in Tappahannock
2-person families (363 | 72.5%) account for the highest median family income in Tappahannock with $55,938 per family, while 2-person families (363 | 72.5%) have the highest median income of $27,969 per family member.
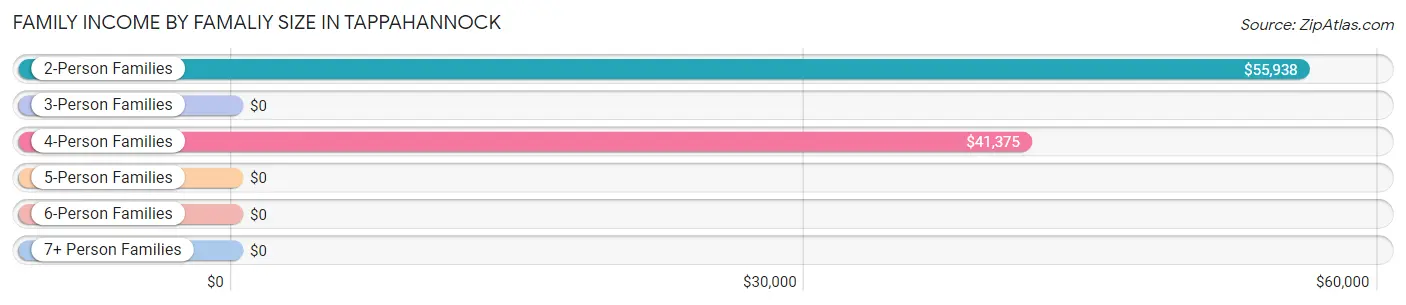
| Income Bracket | # Families | Median Income |
| 2-Person Families | 363 (72.5%) | $55,938 |
| 3-Person Families | 89 (17.8%) | $0 |
| 4-Person Families | 19 (3.8%) | $41,375 |
| 5-Person Families | 30 (6.0%) | $0 |
| 6-Person Families | 0 (0.0%) | $0 |
| 7+ Person Families | 0 (0.0%) | $0 |
| Total | 501 (100.0%) | $46,225 |
Family Income by Number of Earners in Tappahannock
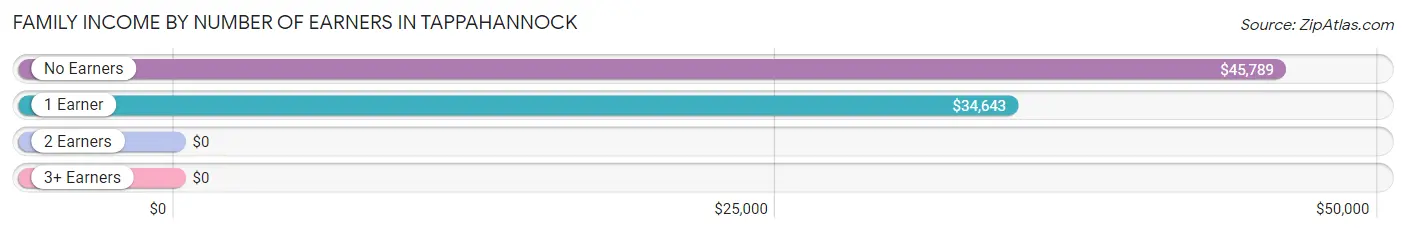
| Number of Earners | # Families | Median Income |
| No Earners | 138 (27.5%) | $45,789 |
| 1 Earner | 218 (43.5%) | $34,643 |
| 2 Earners | 130 (26.0%) | $0 |
| 3+ Earners | 15 (3.0%) | $0 |
| Total | 501 (100.0%) | $46,225 |
Household Income in Tappahannock
Household Income Brackets in Tappahannock
With 161 households falling in the category, the less than $10,000 income range is the most frequent in Tappahannock, accounting for 16.2% of all households. In contrast, only 13 households (1.3%) fall into the $150,000 to $199,999 income bracket, making it the least populous group.
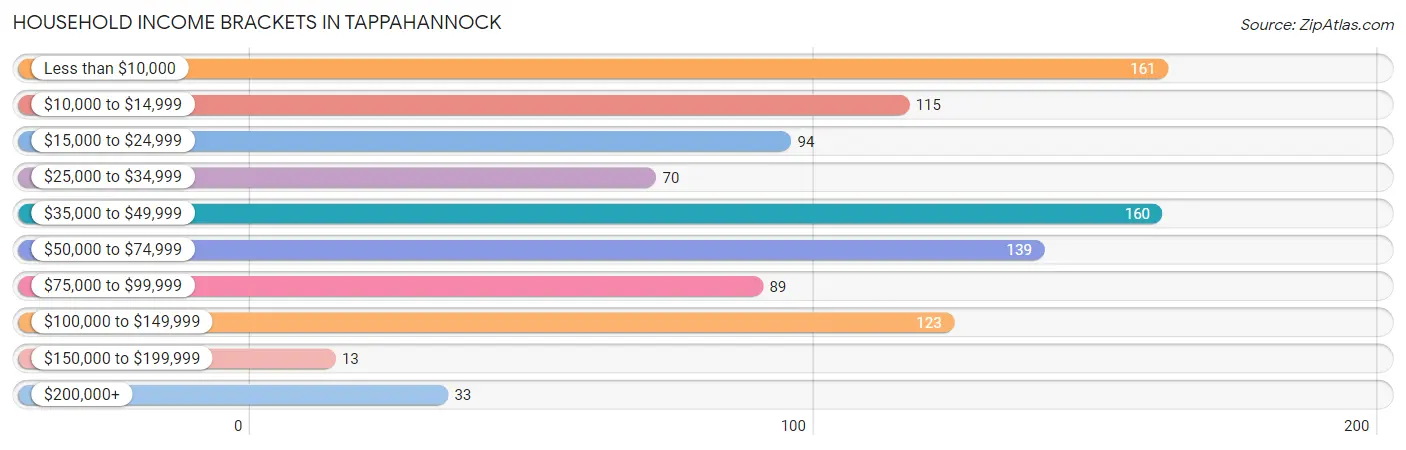
| Income Bracket | # Households | % Households |
| Less than $10,000 | 161 | 16.1% |
| $10,000 to $14,999 | 115 | 11.5% |
| $15,000 to $24,999 | 94 | 9.4% |
| $25,000 to $34,999 | 70 | 7.0% |
| $35,000 to $49,999 | 160 | 16.0% |
| $50,000 to $74,999 | 139 | 13.9% |
| $75,000 to $99,999 | 89 | 8.9% |
| $100,000 to $149,999 | 123 | 12.3% |
| $150,000 to $199,999 | 13 | 1.3% |
| $200,000+ | 33 | 3.3% |
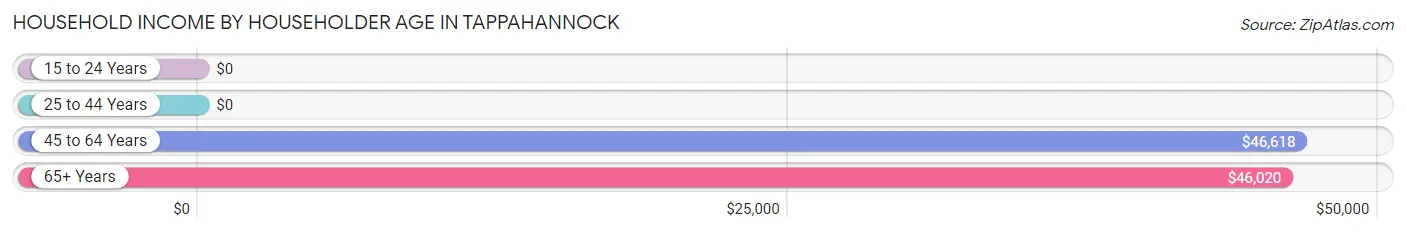
Household Income by Householder Age in Tappahannock
The median household income in Tappahannock is $40,703, with the highest median household income of $46,618 found in the 45 to 64 years age bracket for the primary householder. A total of 308 households (30.9%) fall into this category. Meanwhile, the 15 to 24 years age bracket for the primary householder has the lowest median household income of $0, with 19 households (1.9%) in this group.
| Income Bracket | # Households | Median Income |
| 15 to 24 Years | 19 (1.9%) | $0 |
| 25 to 44 Years | 321 (32.2%) | $0 |
| 45 to 64 Years | 308 (30.9%) | $46,618 |
| 65+ Years | 349 (35.0%) | $46,020 |
| Total | 997 (100.0%) | $40,703 |
Poverty in Tappahannock
Income Below Poverty by Sex and Age in Tappahannock
With 34.5% poverty level for males and 41.2% for females among the residents of Tappahannock, 12 to 14 year old males and 6 to 11 year old females are the most vulnerable to poverty, with 54 males (91.5%) and 71 females (67.6%) in their respective age groups living below the poverty level.
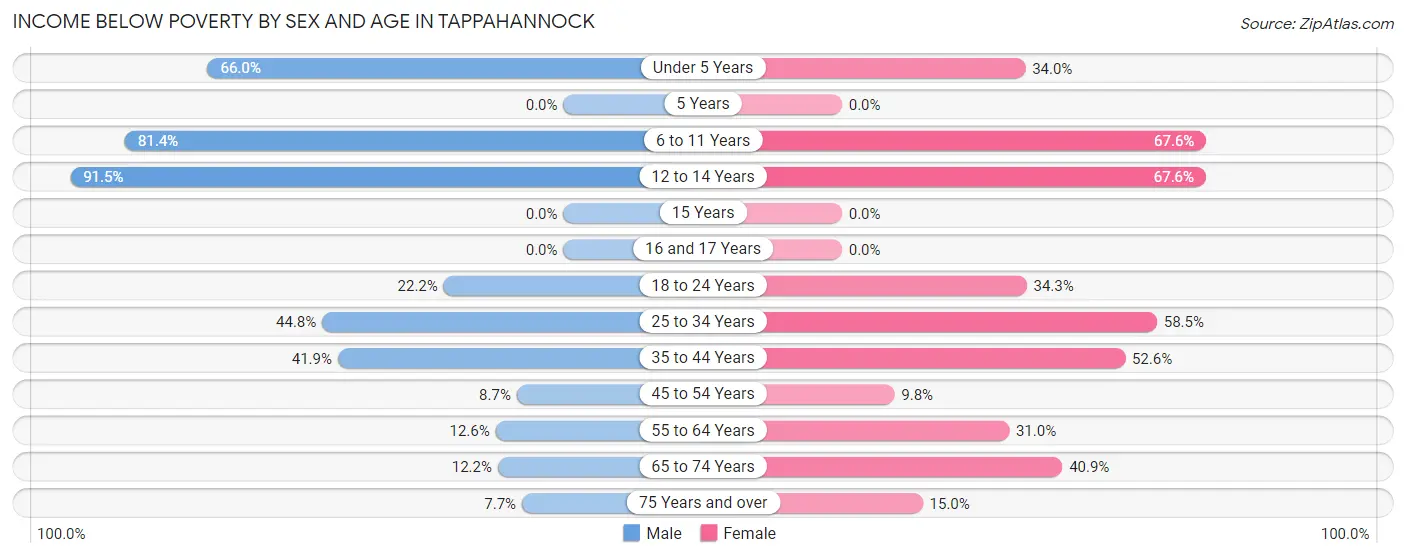
| Age Bracket | Male | Female |
| Under 5 Years | 35 (66.0%) | 16 (34.0%) |
| 5 Years | 0 (0.0%) | 0 (0.0%) |
| 6 to 11 Years | 83 (81.4%) | 71 (67.6%) |
| 12 to 14 Years | 54 (91.5%) | 25 (67.6%) |
| 15 Years | 0 (0.0%) | 0 (0.0%) |
| 16 and 17 Years | 0 (0.0%) | 0 (0.0%) |
| 18 to 24 Years | 10 (22.2%) | 12 (34.3%) |
| 25 to 34 Years | 30 (44.8%) | 107 (58.5%) |
| 35 to 44 Years | 36 (41.9%) | 41 (52.6%) |
| 45 to 54 Years | 9 (8.6%) | 8 (9.8%) |
| 55 to 64 Years | 19 (12.6%) | 45 (31.0%) |
| 65 to 74 Years | 9 (12.2%) | 63 (40.9%) |
| 75 Years and over | 8 (7.7%) | 18 (15.0%) |
| Total | 293 (34.5%) | 406 (41.2%) |
Income Above Poverty by Sex and Age in Tappahannock
According to the poverty statistics in Tappahannock, males aged 5 years and females aged 45 to 54 years are the age groups that are most secure financially, with 100.0% of males and 90.2% of females in these age groups living above the poverty line.
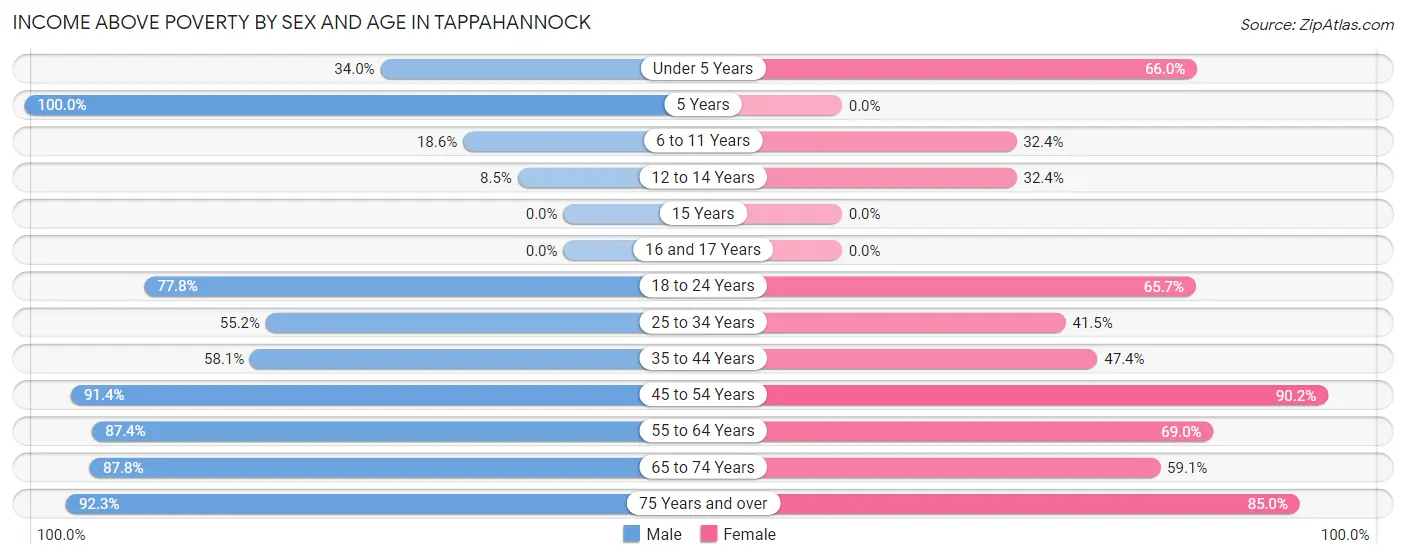
| Age Bracket | Male | Female |
| Under 5 Years | 18 (34.0%) | 31 (66.0%) |
| 5 Years | 4 (100.0%) | 0 (0.0%) |
| 6 to 11 Years | 19 (18.6%) | 34 (32.4%) |
| 12 to 14 Years | 5 (8.5%) | 12 (32.4%) |
| 15 Years | 0 (0.0%) | 0 (0.0%) |
| 16 and 17 Years | 0 (0.0%) | 0 (0.0%) |
| 18 to 24 Years | 35 (77.8%) | 23 (65.7%) |
| 25 to 34 Years | 37 (55.2%) | 76 (41.5%) |
| 35 to 44 Years | 50 (58.1%) | 37 (47.4%) |
| 45 to 54 Years | 95 (91.3%) | 74 (90.2%) |
| 55 to 64 Years | 132 (87.4%) | 100 (69.0%) |
| 65 to 74 Years | 65 (87.8%) | 91 (59.1%) |
| 75 Years and over | 96 (92.3%) | 102 (85.0%) |
| Total | 556 (65.5%) | 580 (58.8%) |
Income Below Poverty Among Married-Couple Families in Tappahannock
The poverty statistics for married-couple families in Tappahannock show that 6.8% or 22 of the total 325 families live below the poverty line. Families with no children have the highest poverty rate of 7.7%, comprising of 22 families. On the other hand, families with 1 or 2 children have the lowest poverty rate of 0.0%, which includes 0 families.
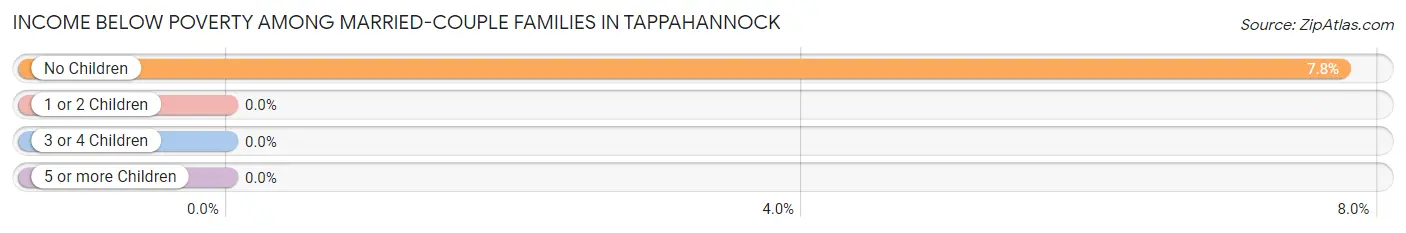
| Children | Above Poverty | Below Poverty |
| No Children | 262 (92.2%) | 22 (7.7%) |
| 1 or 2 Children | 32 (100.0%) | 0 (0.0%) |
| 3 or 4 Children | 9 (100.0%) | 0 (0.0%) |
| 5 or more Children | 0 (0.0%) | 0 (0.0%) |
| Total | 303 (93.2%) | 22 (6.8%) |
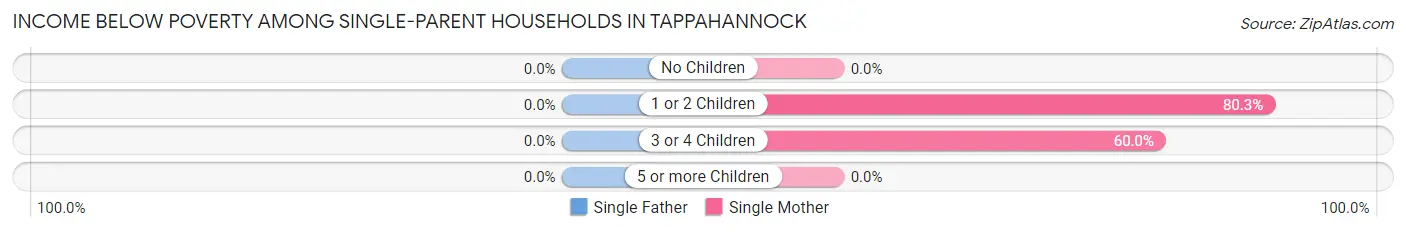
Income Below Poverty Among Single-Parent Households in Tappahannock
| Children | Single Father | Single Mother |
| No Children | 0 (0.0%) | 0 (0.0%) |
| 1 or 2 Children | 0 (0.0%) | 94 (80.3%) |
| 3 or 4 Children | 0 (0.0%) | 21 (60.0%) |
| 5 or more Children | 0 (0.0%) | 0 (0.0%) |
| Total | 0 (0.0%) | 115 (65.3%) |
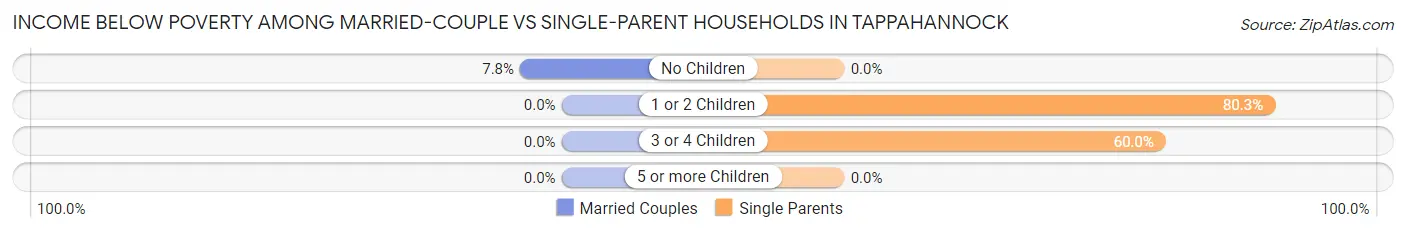
Income Below Poverty Among Married-Couple vs Single-Parent Households in Tappahannock
The poverty data for Tappahannock shows that 22 of the married-couple family households (6.8%) and 115 of the single-parent households (65.3%) are living below the poverty level. Within the married-couple family households, those with no children have the highest poverty rate, with 22 households (7.7%) falling below the poverty line. Among the single-parent households, those with 1 or 2 children have the highest poverty rate, with 94 household (80.3%) living below poverty.
| Children | Married-Couple Families | Single-Parent Households |
| No Children | 22 (7.7%) | 0 (0.0%) |
| 1 or 2 Children | 0 (0.0%) | 94 (80.3%) |
| 3 or 4 Children | 0 (0.0%) | 21 (60.0%) |
| 5 or more Children | 0 (0.0%) | 0 (0.0%) |
| Total | 22 (6.8%) | 115 (65.3%) |
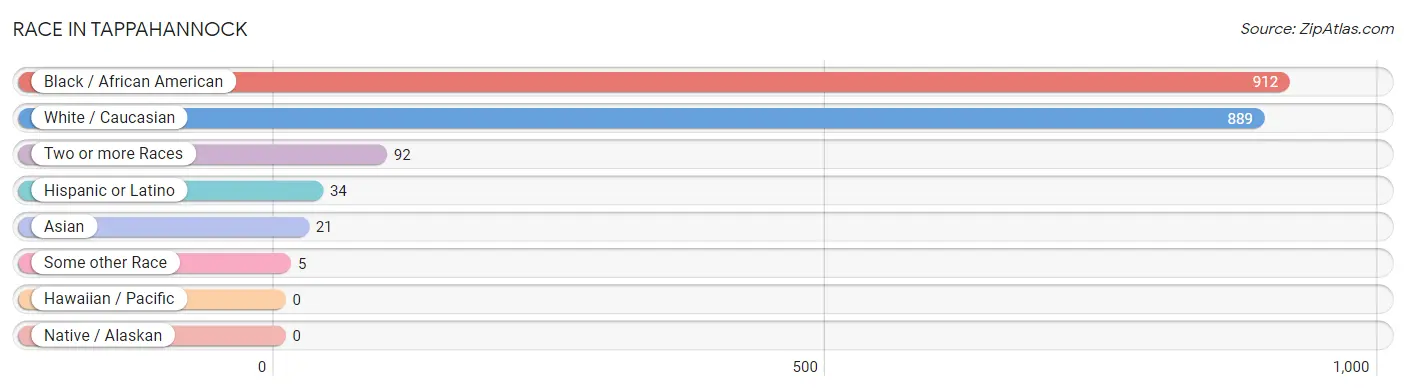
Race in Tappahannock
The most populous races in Tappahannock are Black / African American (912 | 47.5%), White / Caucasian (889 | 46.3%), and Two or more Races (92 | 4.8%).
| Race | # Population | % Population |
| Asian | 21 | 1.1% |
| Black / African American | 912 | 47.5% |
| Hawaiian / Pacific | 0 | 0.0% |
| Hispanic or Latino | 34 | 1.8% |
| Native / Alaskan | 0 | 0.0% |
| White / Caucasian | 889 | 46.3% |
| Two or more Races | 92 | 4.8% |
| Some other Race | 5 | 0.3% |
| Total | 1,919 | 100.0% |
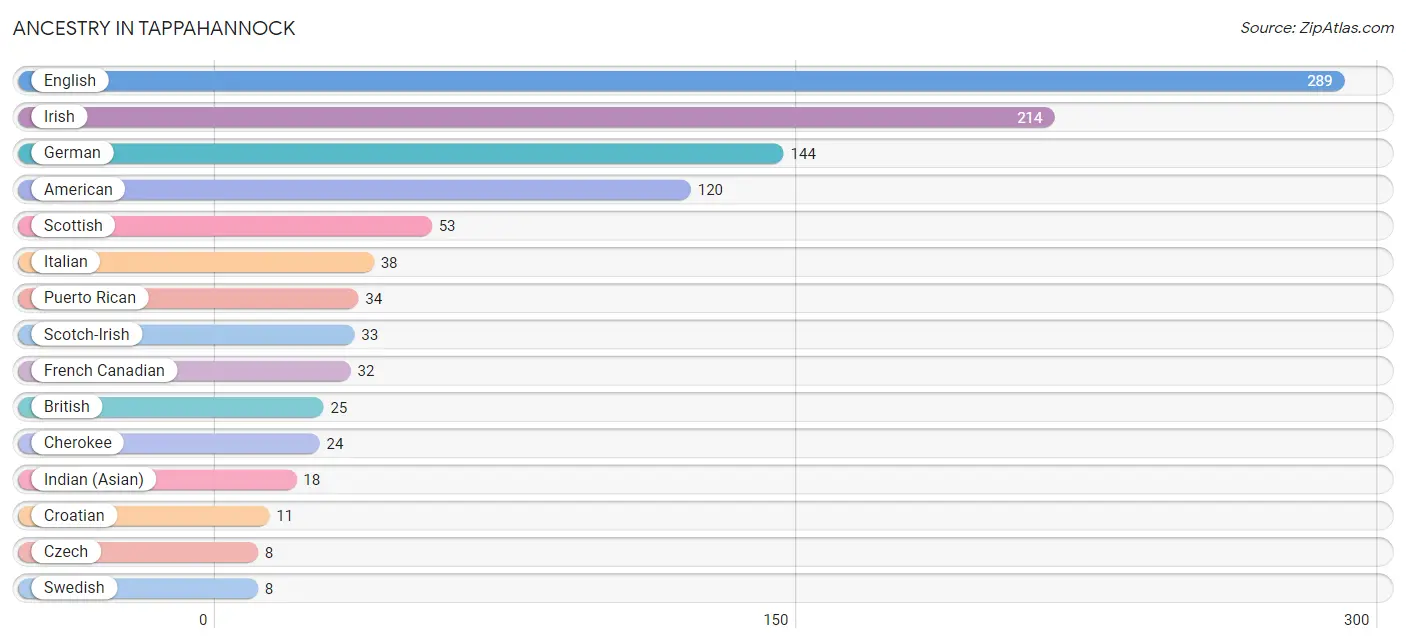
Ancestry in Tappahannock
The most populous ancestries reported in Tappahannock are English (289 | 15.1%), Irish (214 | 11.2%), German (144 | 7.5%), American (120 | 6.2%), and Scottish (53 | 2.8%), together accounting for 42.7% of all Tappahannock residents.
| Ancestry | # Population | % Population |
| American | 120 | 6.2% |
| British | 25 | 1.3% |
| Cherokee | 24 | 1.3% |
| Croatian | 11 | 0.6% |
| Czech | 8 | 0.4% |
| Dutch | 7 | 0.4% |
| English | 289 | 15.1% |
| European | 6 | 0.3% |
| French | 6 | 0.3% |
| French Canadian | 32 | 1.7% |
| German | 144 | 7.5% |
| Indian (Asian) | 18 | 0.9% |
| Irish | 214 | 11.2% |
| Italian | 38 | 2.0% |
| Korean | 3 | 0.2% |
| Polish | 1 | 0.1% |
| Puerto Rican | 34 | 1.8% |
| Samoan | 7 | 0.4% |
| Scandinavian | 6 | 0.3% |
| Scotch-Irish | 33 | 1.7% |
| Scottish | 53 | 2.8% |
| Slovak | 7 | 0.4% |
| Swedish | 8 | 0.4% | View All 23 Rows |
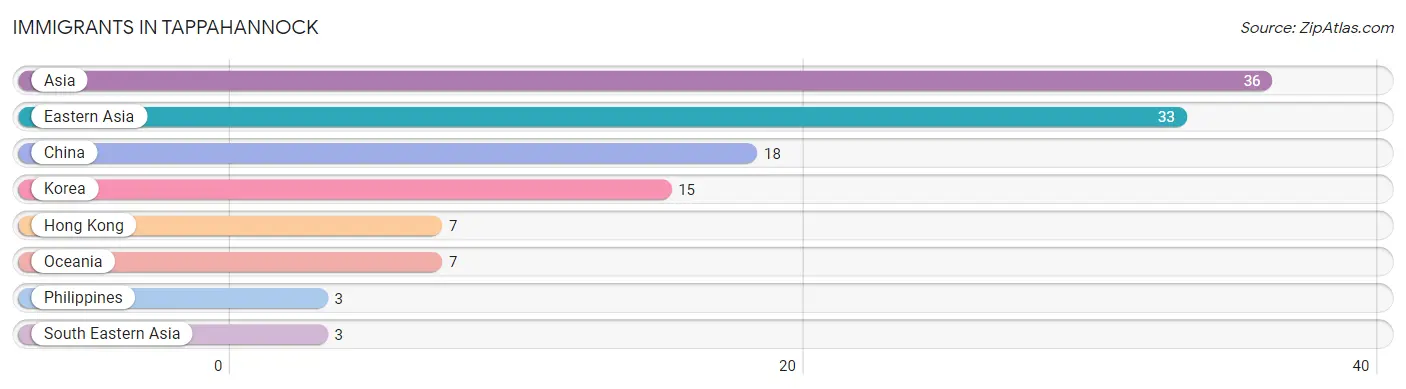
Immigrants in Tappahannock
The most numerous immigrant groups reported in Tappahannock came from Asia (36 | 1.9%), Eastern Asia (33 | 1.7%), China (18 | 0.9%), Korea (15 | 0.8%), and Hong Kong (7 | 0.4%), together accounting for 5.7% of all Tappahannock residents.
| Immigration Origin | # Population | % Population |
| Asia | 36 | 1.9% |
| China | 18 | 0.9% |
| Eastern Asia | 33 | 1.7% |
| Hong Kong | 7 | 0.4% |
| Korea | 15 | 0.8% |
| Oceania | 7 | 0.4% |
| Philippines | 3 | 0.2% |
| South Eastern Asia | 3 | 0.2% | View All 8 Rows |
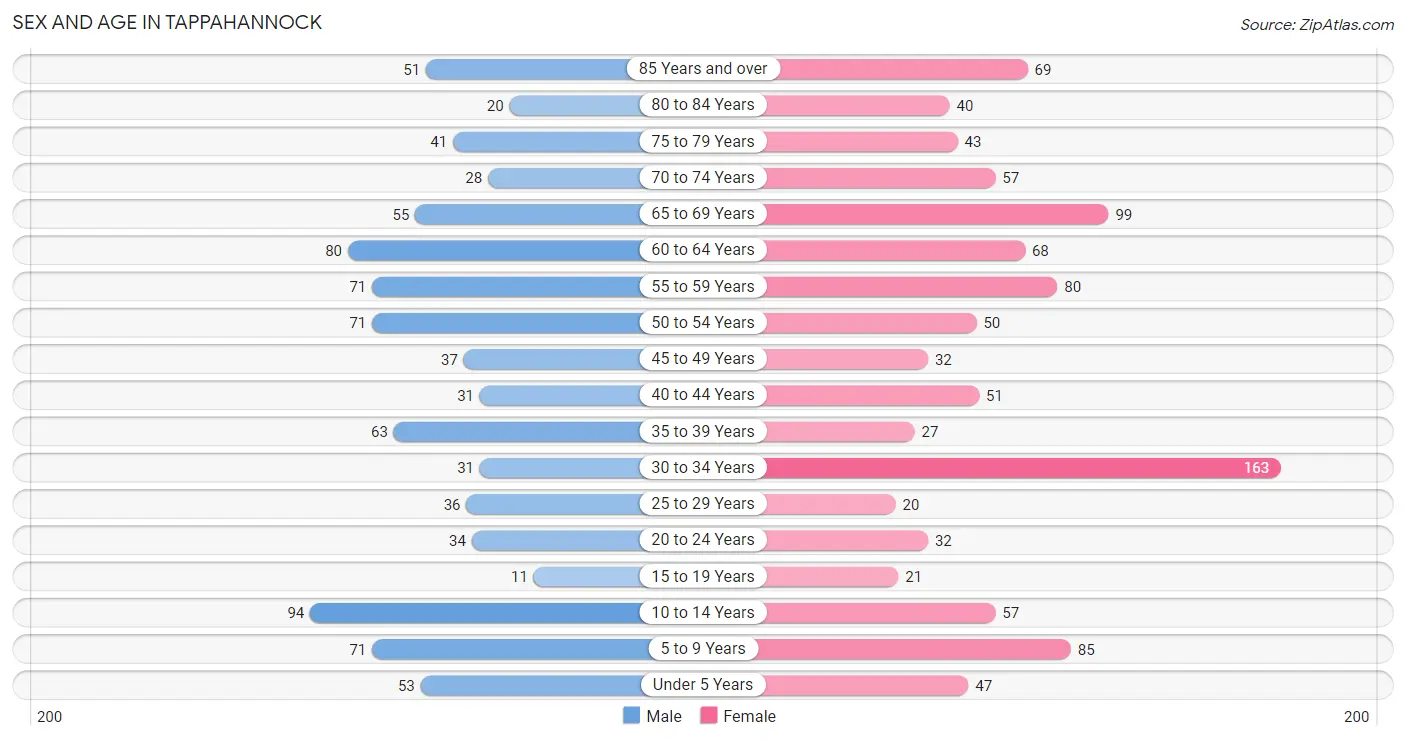
Sex and Age in Tappahannock
Sex and Age in Tappahannock
The most populous age groups in Tappahannock are 10 to 14 Years (94 | 10.7%) for men and 30 to 34 Years (163 | 15.7%) for women.
| Age Bracket | Male | Female |
| Under 5 Years | 53 (6.0%) | 47 (4.5%) |
| 5 to 9 Years | 71 (8.1%) | 85 (8.2%) |
| 10 to 14 Years | 94 (10.7%) | 57 (5.5%) |
| 15 to 19 Years | 11 (1.3%) | 21 (2.0%) |
| 20 to 24 Years | 34 (3.9%) | 32 (3.1%) |
| 25 to 29 Years | 36 (4.1%) | 20 (1.9%) |
| 30 to 34 Years | 31 (3.5%) | 163 (15.7%) |
| 35 to 39 Years | 63 (7.2%) | 27 (2.6%) |
| 40 to 44 Years | 31 (3.5%) | 51 (4.9%) |
| 45 to 49 Years | 37 (4.2%) | 32 (3.1%) |
| 50 to 54 Years | 71 (8.1%) | 50 (4.8%) |
| 55 to 59 Years | 71 (8.1%) | 80 (7.7%) |
| 60 to 64 Years | 80 (9.1%) | 68 (6.5%) |
| 65 to 69 Years | 55 (6.3%) | 99 (9.5%) |
| 70 to 74 Years | 28 (3.2%) | 57 (5.5%) |
| 75 to 79 Years | 41 (4.7%) | 43 (4.1%) |
| 80 to 84 Years | 20 (2.3%) | 40 (3.8%) |
| 85 Years and over | 51 (5.8%) | 69 (6.6%) |
| Total | 878 (100.0%) | 1,041 (100.0%) |
Families and Households in Tappahannock
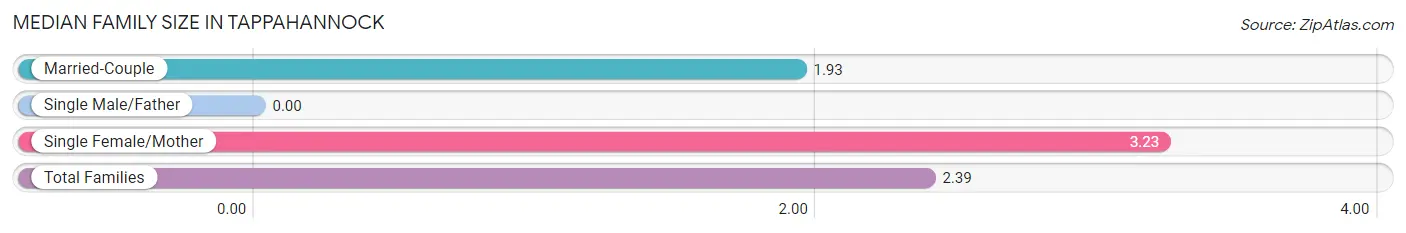
Median Family Size in Tappahannock
| Family Type | # Families | Family Size |
| Married-Couple | 325 (64.9%) | 1.93 |
| Single Male/Father | 0 (0.0%) | - |
| Single Female/Mother | 176 (35.1%) | 3.23 |
| Total Families | 501 (100.0%) | 2.39 |
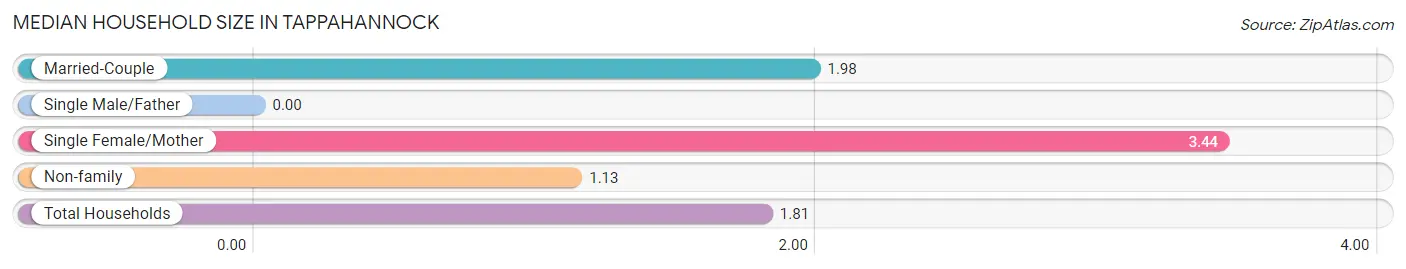
Median Household Size in Tappahannock
| Household Type | # Households | Household Size |
| Married-Couple | 325 (32.6%) | 1.98 |
| Single Male/Father | 0 (0.0%) | - |
| Single Female/Mother | 176 (17.6%) | 3.44 |
| Non-family | 496 (49.7%) | 1.13 |
| Total Households | 997 (100.0%) | 1.81 |
Household Size by Marriage Status in Tappahannock
Out of a total of 997 households in Tappahannock, 501 (50.2%) are family households, while 496 (49.7%) are nonfamily households. The most numerous type of family households are 2-person households, comprising 350, and the most common type of nonfamily households are 1-person households, comprising 448.
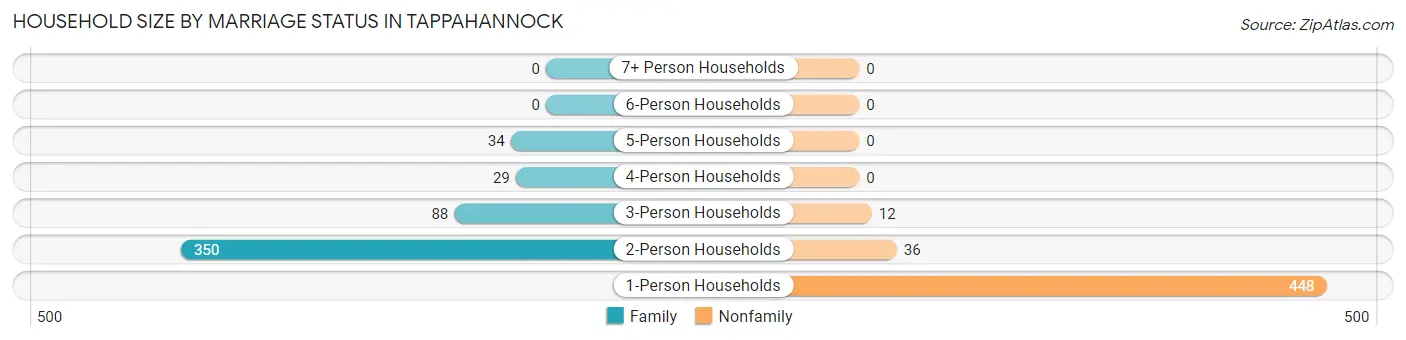
| Household Size | Family Households | Nonfamily Households |
| 1-Person Households | - | 448 (44.9%) |
| 2-Person Households | 350 (35.1%) | 36 (3.6%) |
| 3-Person Households | 88 (8.8%) | 12 (1.2%) |
| 4-Person Households | 29 (2.9%) | 0 (0.0%) |
| 5-Person Households | 34 (3.4%) | 0 (0.0%) |
| 6-Person Households | 0 (0.0%) | 0 (0.0%) |
| 7+ Person Households | 0 (0.0%) | 0 (0.0%) |
| Total | 501 (50.2%) | 496 (49.7%) |
Female Fertility in Tappahannock
Fertility by Age in Tappahannock
Average fertility rate in Tappahannock is 14.0 births per 1,000 women. Women in the age bracket of 15 to 19 years have the highest fertility rate with 238.0 births per 1,000 women. Women in the age bracket of 15 to 19 years acount for 100.0% of all women with births.
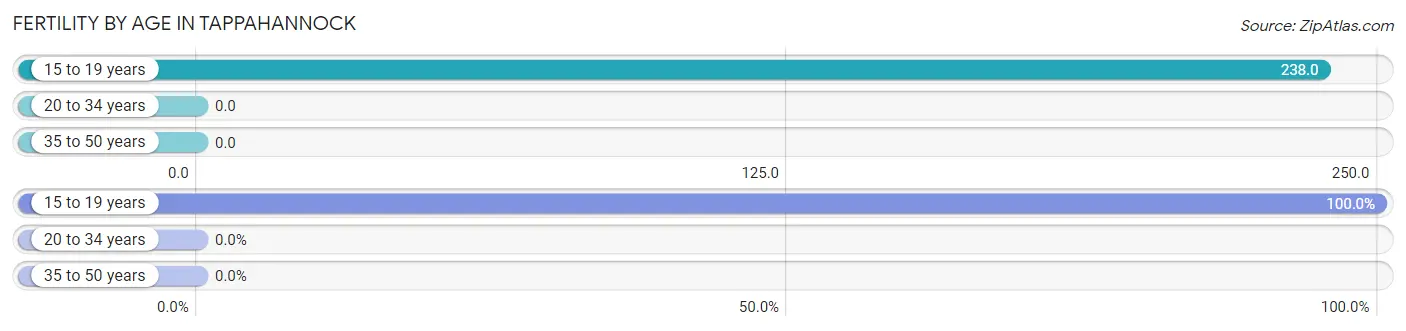
| Age Bracket | Women with Births | Births / 1,000 Women |
| 15 to 19 years | 5 (100.0%) | 238.0 |
| 20 to 34 years | 0 (0.0%) | 0.0 |
| 35 to 50 years | 0 (0.0%) | 0.0 |
| Total | 5 (100.0%) | 14.0 |
Fertility by Age by Marriage Status in Tappahannock
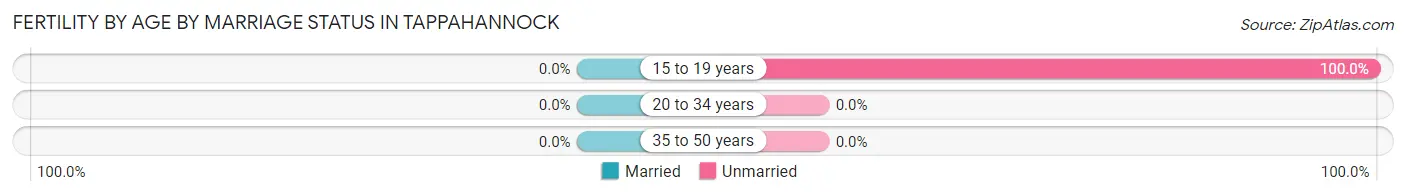
| Age Bracket | Married | Unmarried |
| 15 to 19 years | 0 (0.0%) | 5 (100.0%) |
| 20 to 34 years | 0 (0.0%) | 0 (0.0%) |
| 35 to 50 years | 0 (0.0%) | 0 (0.0%) |
| Total | 0 (0.0%) | 5 (100.0%) |
Fertility by Education in Tappahannock
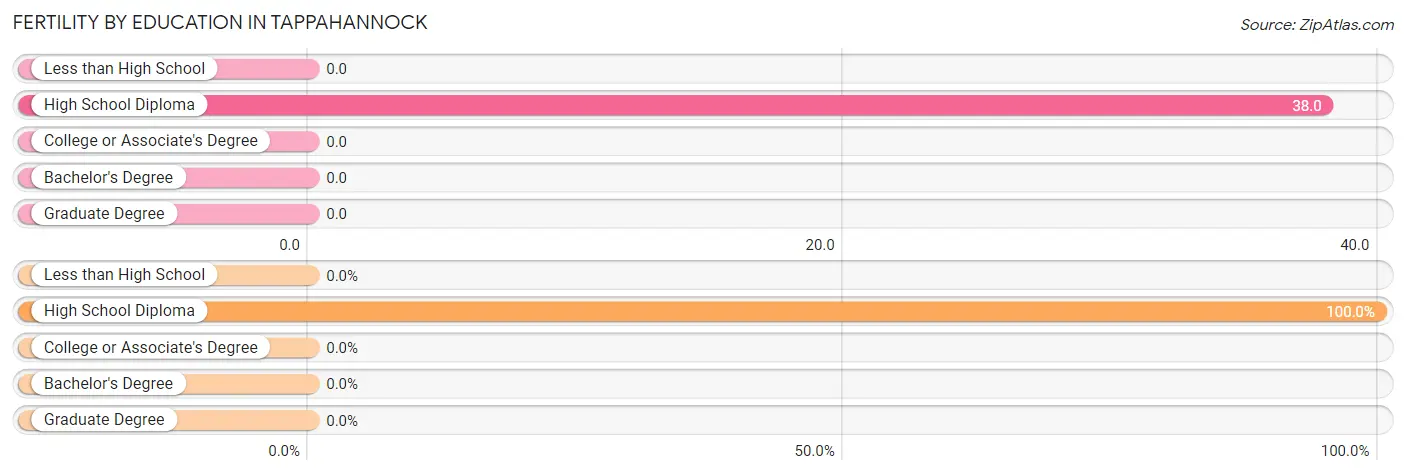
| Educational Attainment | Women with Births | Births / 1,000 Women |
| Less than High School | 0 (0.0%) | 0.0 |
| High School Diploma | 5 (100.0%) | 38.0 |
| College or Associate's Degree | 0 (0.0%) | 0.0 |
| Bachelor's Degree | 0 (0.0%) | 0.0 |
| Graduate Degree | 0 (0.0%) | 0.0 |
| Total | 5 (100.0%) | 14.0 |
Fertility by Education by Marriage Status in Tappahannock

| Educational Attainment | Married | Unmarried |
| Less than High School | 0 (0.0%) | 0 (0.0%) |
| High School Diploma | 0 (0.0%) | 5 (100.0%) |
| College or Associate's Degree | 0 (0.0%) | 0 (0.0%) |
| Bachelor's Degree | 0 (0.0%) | 0 (0.0%) |
| Graduate Degree | 0 (0.0%) | 0 (0.0%) |
| Total | 0 (0.0%) | 5 (100.0%) |
Employment Characteristics in Tappahannock
Employment by Class of Employer in Tappahannock
Among the 732 employed individuals in Tappahannock, private company employees (505 | 69.0%), not-for-profit organizations (60 | 8.2%), and self-employed (not incorporated) (56 | 7.6%) make up the most common classes of employment.
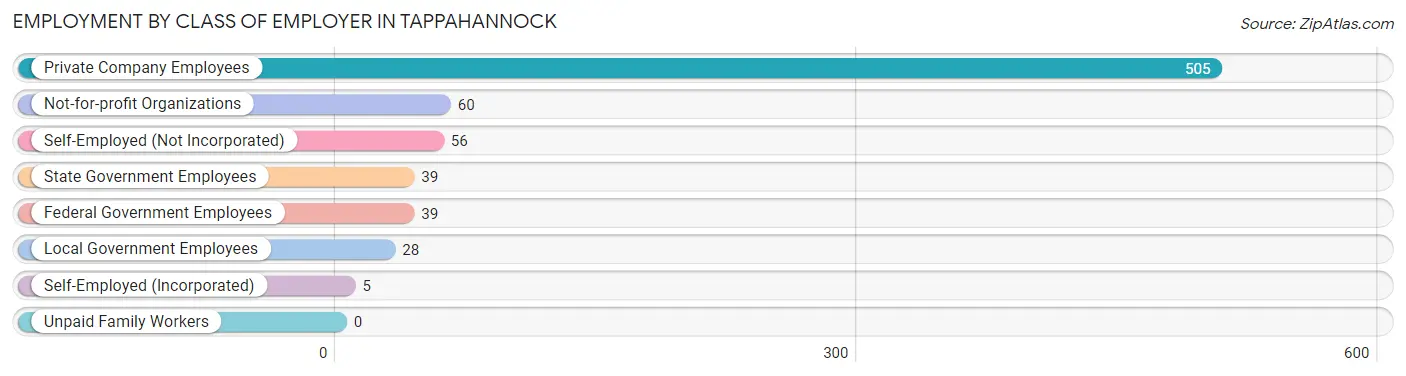
| Employer Class | # Employees | % Employees |
| Private Company Employees | 505 | 69.0% |
| Self-Employed (Incorporated) | 5 | 0.7% |
| Self-Employed (Not Incorporated) | 56 | 7.6% |
| Not-for-profit Organizations | 60 | 8.2% |
| Local Government Employees | 28 | 3.8% |
| State Government Employees | 39 | 5.3% |
| Federal Government Employees | 39 | 5.3% |
| Unpaid Family Workers | 0 | 0.0% |
| Total | 732 | 100.0% |
Employment Status by Age in Tappahannock
According to the labor force statistics for Tappahannock, out of the total population over 16 years of age (1,512), 51.3% or 776 individuals are in the labor force, with 5.7% or 44 of them unemployed. The age group with the highest labor force participation rate is 25 to 29 years, with 100.0% or 56 individuals in the labor force. Within the labor force, the 55 to 59 years age range has the highest percentage of unemployed individuals, with 32.1% or 34 of them being unemployed.
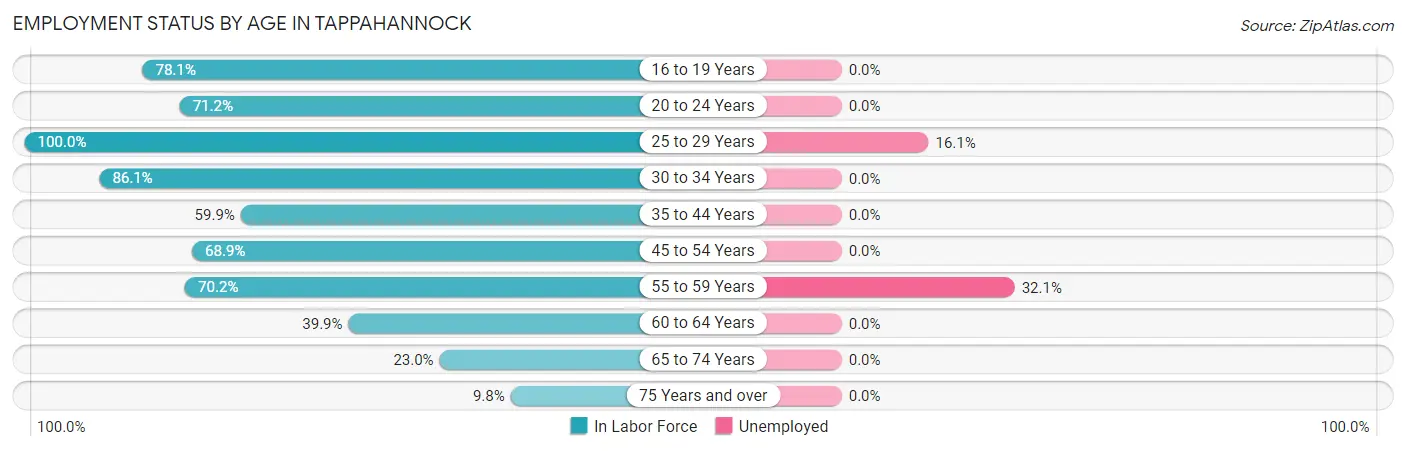
| Age Bracket | In Labor Force | Unemployed |
| 16 to 19 Years | 25 (78.1%) | 0 (0.0%) |
| 20 to 24 Years | 47 (71.2%) | 0 (0.0%) |
| 25 to 29 Years | 56 (100.0%) | 9 (16.1%) |
| 30 to 34 Years | 167 (86.1%) | 0 (0.0%) |
| 35 to 44 Years | 103 (59.9%) | 0 (0.0%) |
| 45 to 54 Years | 131 (68.9%) | 0 (0.0%) |
| 55 to 59 Years | 106 (70.2%) | 34 (32.1%) |
| 60 to 64 Years | 59 (39.9%) | 0 (0.0%) |
| 65 to 74 Years | 55 (23.0%) | 0 (0.0%) |
| 75 Years and over | 26 (9.8%) | 0 (0.0%) |
| Total | 776 (51.3%) | 44 (5.7%) |
Employment Status by Educational Attainment in Tappahannock
According to labor force statistics for Tappahannock, 68.3% of individuals (622) out of the total population between 25 and 64 years of age (911) are in the labor force, with 6.9% or 43 of them being unemployed. The group with the highest labor force participation rate are those with the educational attainment of bachelor's degree or higher, with 79.0% or 124 individuals in the labor force. Within the labor force, individuals with less than high school education have the highest percentage of unemployment, with 42.1% or 24 of them being unemployed.
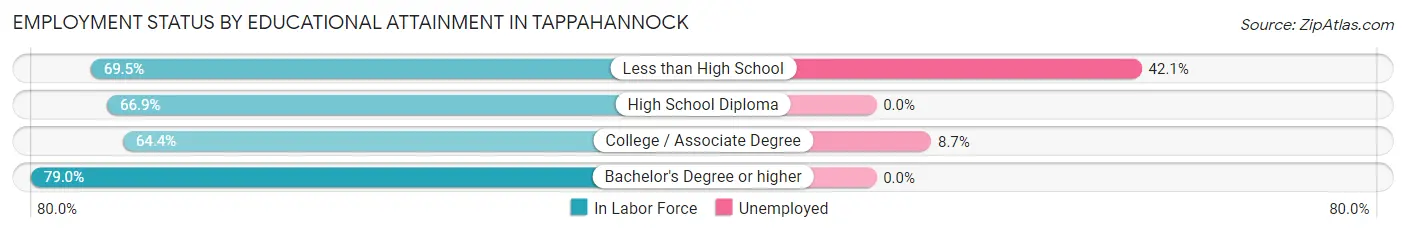
| Educational Attainment | In Labor Force | Unemployed |
| Less than High School | 57 (69.5%) | 35 (42.1%) |
| High School Diploma | 222 (66.9%) | 0 (0.0%) |
| College / Associate Degree | 219 (64.4%) | 30 (8.7%) |
| Bachelor's Degree or higher | 124 (79.0%) | 0 (0.0%) |
| Total | 622 (68.3%) | 63 (6.9%) |
Employment Occupations by Sex in Tappahannock
Management, Business, Science and Arts Occupations
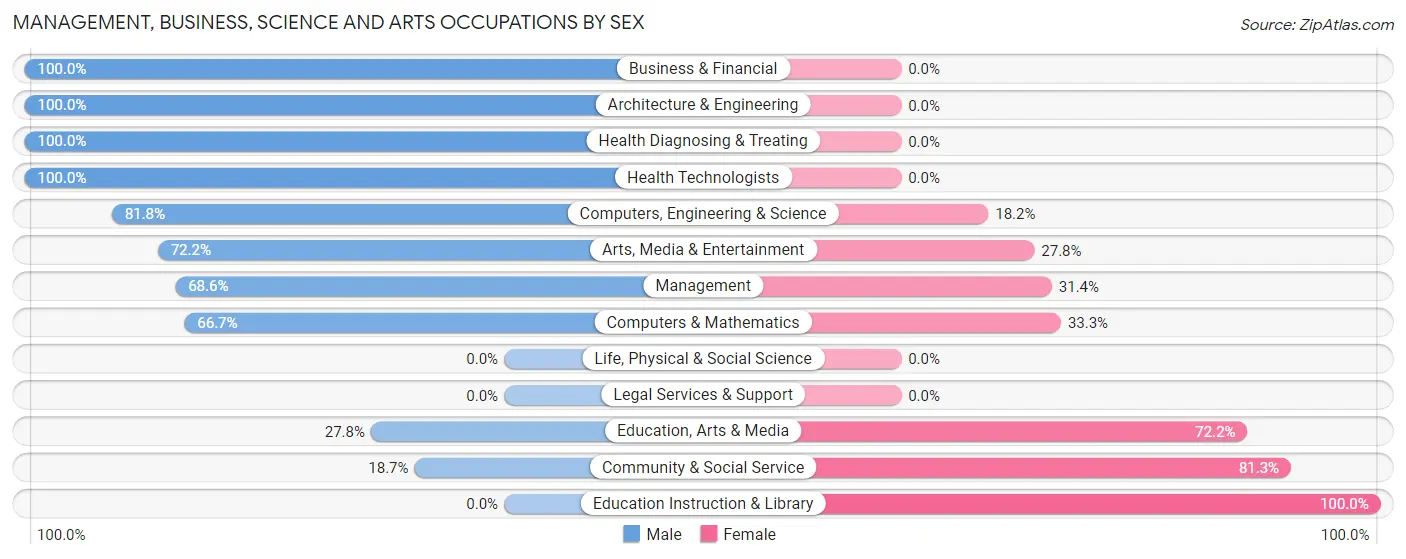
The most common Management, Business, Science and Arts occupations in Tappahannock are Community & Social Service (123 | 17.2%), Management (70 | 9.8%), Education Instruction & Library (69 | 9.6%), Education, Arts & Media (36 | 5.0%), and Computers, Engineering & Science (22 | 3.1%).
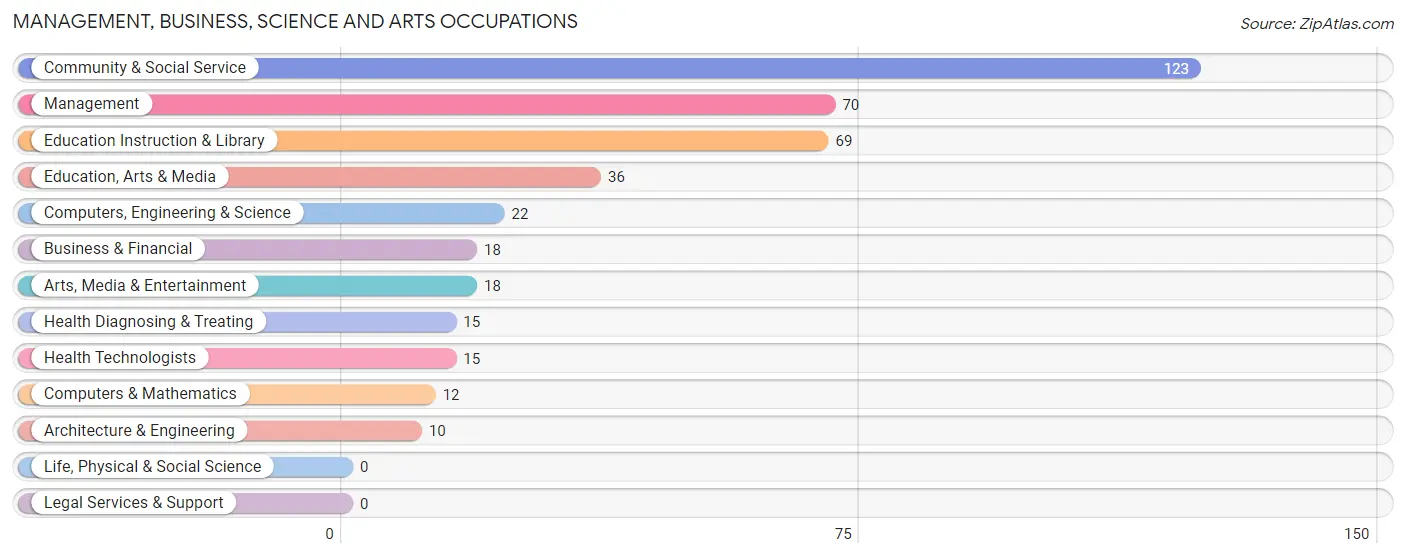
Management, Business, Science and Arts Occupations by Sex
Within the Management, Business, Science and Arts occupations in Tappahannock, the most male-oriented occupations are Business & Financial (100.0%), Architecture & Engineering (100.0%), and Health Diagnosing & Treating (100.0%), while the most female-oriented occupations are Education Instruction & Library (100.0%), Community & Social Service (81.3%), and Education, Arts & Media (72.2%).
| Occupation | Male | Female |
| Management | 48 (68.6%) | 22 (31.4%) |
| Business & Financial | 18 (100.0%) | 0 (0.0%) |
| Computers, Engineering & Science | 18 (81.8%) | 4 (18.2%) |
| Computers & Mathematics | 8 (66.7%) | 4 (33.3%) |
| Architecture & Engineering | 10 (100.0%) | 0 (0.0%) |
| Life, Physical & Social Science | 0 (0.0%) | 0 (0.0%) |
| Community & Social Service | 23 (18.7%) | 100 (81.3%) |
| Education, Arts & Media | 10 (27.8%) | 26 (72.2%) |
| Legal Services & Support | 0 (0.0%) | 0 (0.0%) |
| Education Instruction & Library | 0 (0.0%) | 69 (100.0%) |
| Arts, Media & Entertainment | 13 (72.2%) | 5 (27.8%) |
| Health Diagnosing & Treating | 15 (100.0%) | 0 (0.0%) |
| Health Technologists | 15 (100.0%) | 0 (0.0%) |
| Total (Category) | 122 (49.2%) | 126 (50.8%) |
| Total (Overall) | 344 (48.0%) | 373 (52.0%) |
Services Occupations
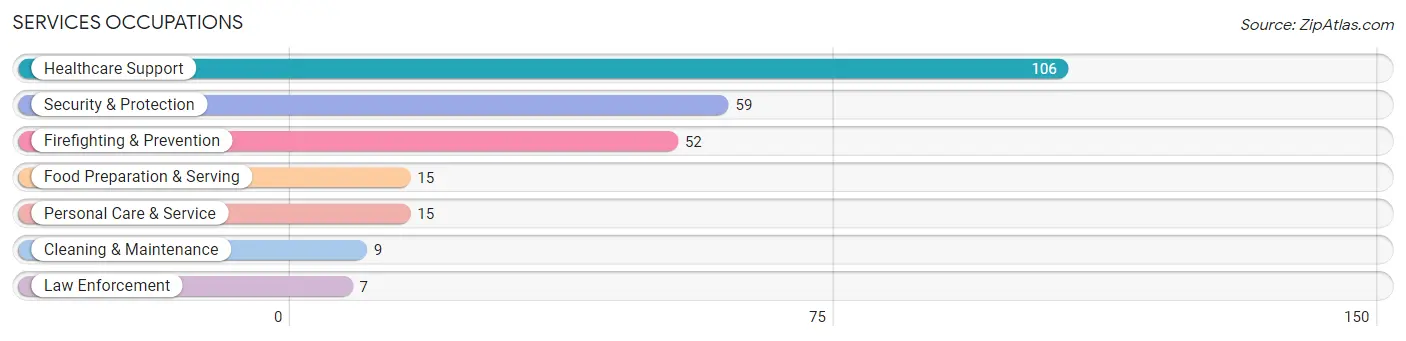
The most common Services occupations in Tappahannock are Healthcare Support (106 | 14.8%), Security & Protection (59 | 8.2%), Firefighting & Prevention (52 | 7.2%), Food Preparation & Serving (15 | 2.1%), and Personal Care & Service (15 | 2.1%).
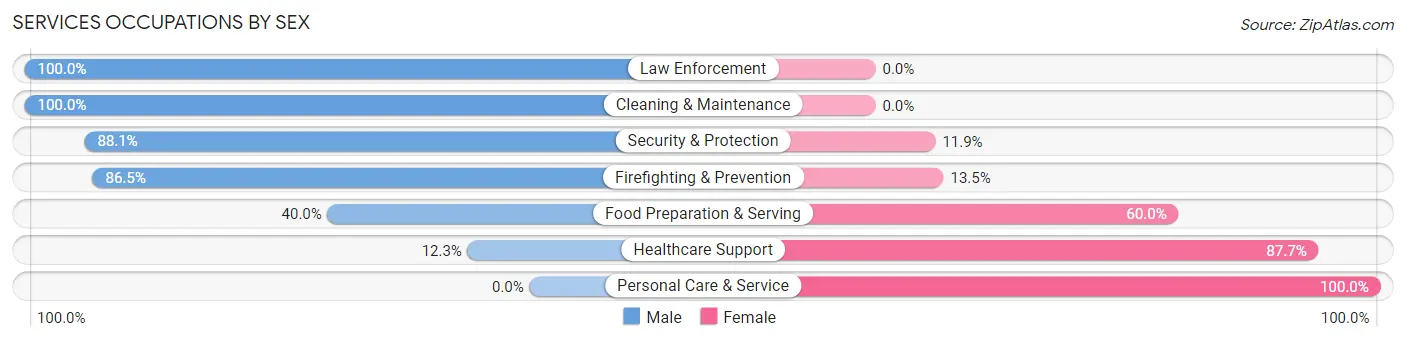
Services Occupations by Sex
Within the Services occupations in Tappahannock, the most male-oriented occupations are Law Enforcement (100.0%), Cleaning & Maintenance (100.0%), and Security & Protection (88.1%), while the most female-oriented occupations are Personal Care & Service (100.0%), Healthcare Support (87.7%), and Food Preparation & Serving (60.0%).
| Occupation | Male | Female |
| Healthcare Support | 13 (12.3%) | 93 (87.7%) |
| Security & Protection | 52 (88.1%) | 7 (11.9%) |
| Firefighting & Prevention | 45 (86.5%) | 7 (13.5%) |
| Law Enforcement | 7 (100.0%) | 0 (0.0%) |
| Food Preparation & Serving | 6 (40.0%) | 9 (60.0%) |
| Cleaning & Maintenance | 9 (100.0%) | 0 (0.0%) |
| Personal Care & Service | 0 (0.0%) | 15 (100.0%) |
| Total (Category) | 80 (39.2%) | 124 (60.8%) |
| Total (Overall) | 344 (48.0%) | 373 (52.0%) |
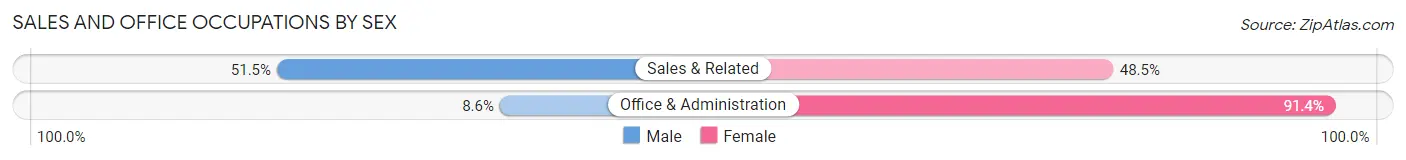
Sales and Office Occupations
The most common Sales and Office occupations in Tappahannock are Sales & Related (101 | 14.1%), and Office & Administration (58 | 8.1%).

Sales and Office Occupations by Sex
| Occupation | Male | Female |
| Sales & Related | 52 (51.5%) | 49 (48.5%) |
| Office & Administration | 5 (8.6%) | 53 (91.4%) |
| Total (Category) | 57 (35.8%) | 102 (64.1%) |
| Total (Overall) | 344 (48.0%) | 373 (52.0%) |
Natural Resources, Construction and Maintenance Occupations
The most common Natural Resources, Construction and Maintenance occupations in Tappahannock are Construction & Extraction (26 | 3.6%), and Installation, Maintenance & Repair (4 | 0.6%).
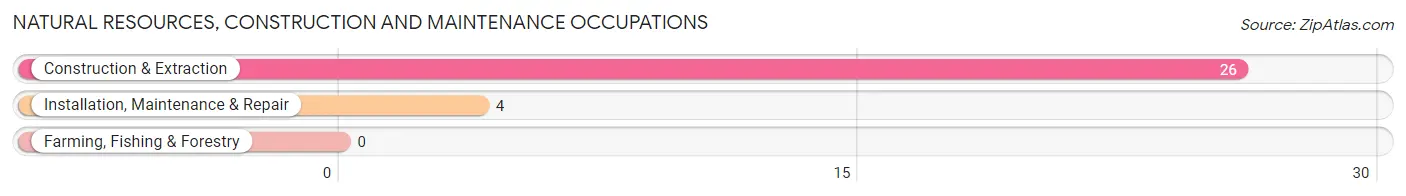
Natural Resources, Construction and Maintenance Occupations by Sex

| Occupation | Male | Female |
| Farming, Fishing & Forestry | 0 (0.0%) | 0 (0.0%) |
| Construction & Extraction | 26 (100.0%) | 0 (0.0%) |
| Installation, Maintenance & Repair | 4 (100.0%) | 0 (0.0%) |
| Total (Category) | 30 (100.0%) | 0 (0.0%) |
| Total (Overall) | 344 (48.0%) | 373 (52.0%) |
Production, Transportation and Moving Occupations
The most common Production, Transportation and Moving occupations in Tappahannock are Material Moving (47 | 6.6%), Production (21 | 2.9%), and Transportation (8 | 1.1%).
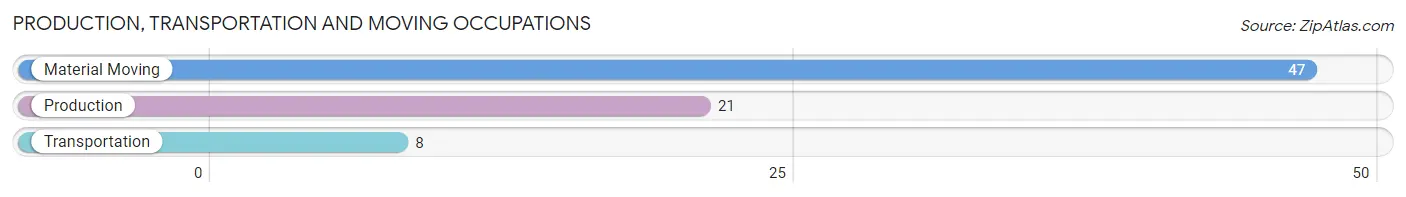
Production, Transportation and Moving Occupations by Sex
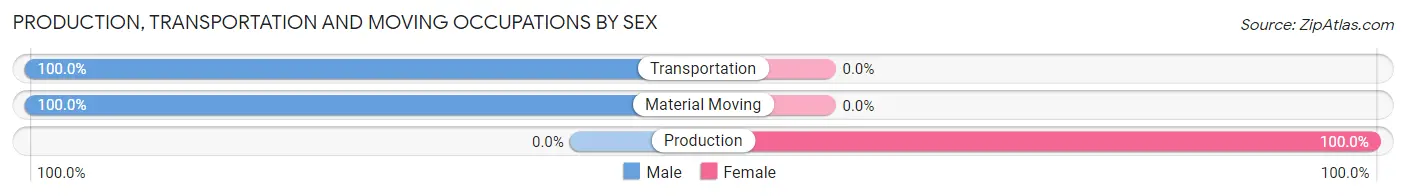
| Occupation | Male | Female |
| Production | 0 (0.0%) | 21 (100.0%) |
| Transportation | 8 (100.0%) | 0 (0.0%) |
| Material Moving | 47 (100.0%) | 0 (0.0%) |
| Total (Category) | 55 (72.4%) | 21 (27.6%) |
| Total (Overall) | 344 (48.0%) | 373 (52.0%) |
Employment Industries by Sex in Tappahannock
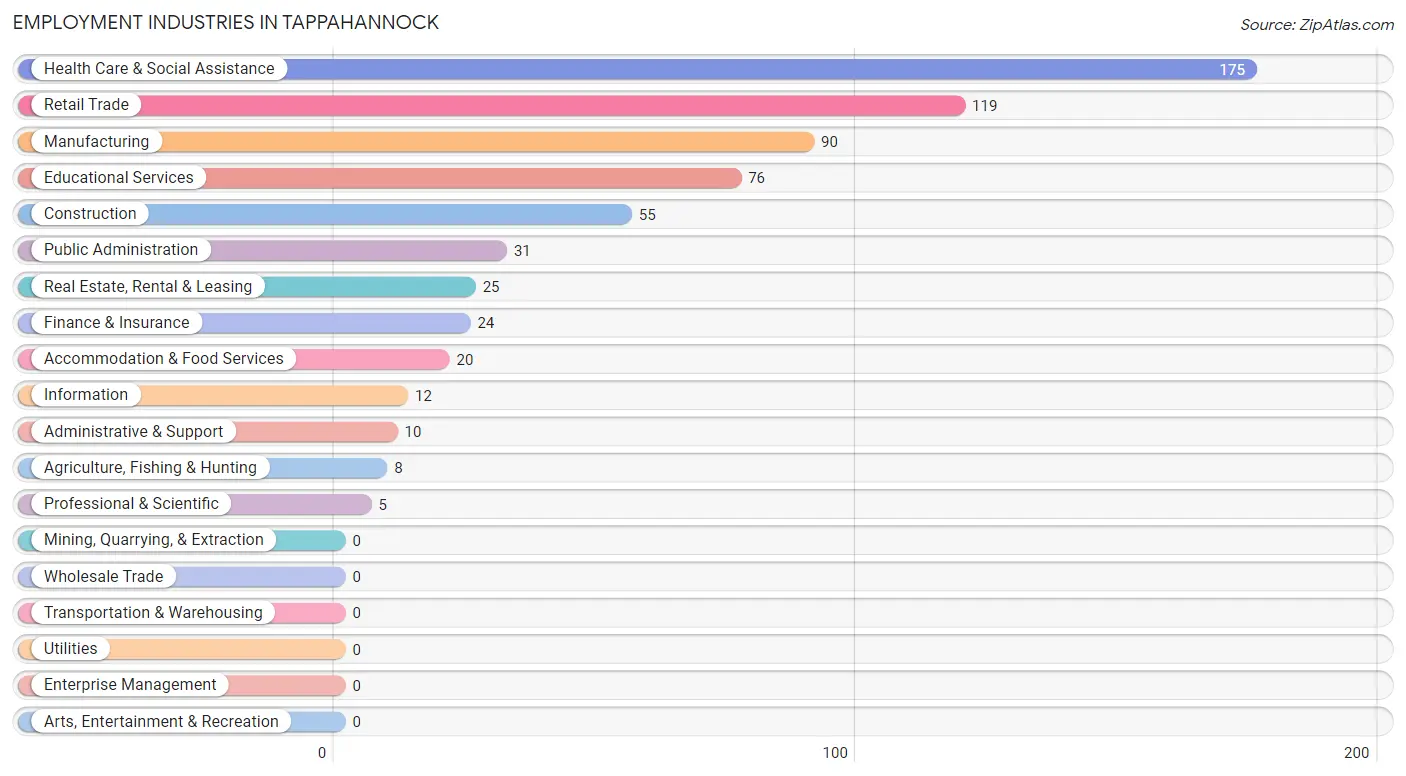
Employment Industries in Tappahannock
The major employment industries in Tappahannock include Health Care & Social Assistance (175 | 24.4%), Retail Trade (119 | 16.6%), Manufacturing (90 | 12.6%), Educational Services (76 | 10.6%), and Construction (55 | 7.7%).
Employment Industries by Sex in Tappahannock
The Tappahannock industries that see more men than women are Agriculture, Fishing & Hunting (100.0%), Construction (100.0%), and Information (100.0%), whereas the industries that tend to have a higher number of women are Finance & Insurance (100.0%), Professional & Scientific (100.0%), and Health Care & Social Assistance (86.9%).
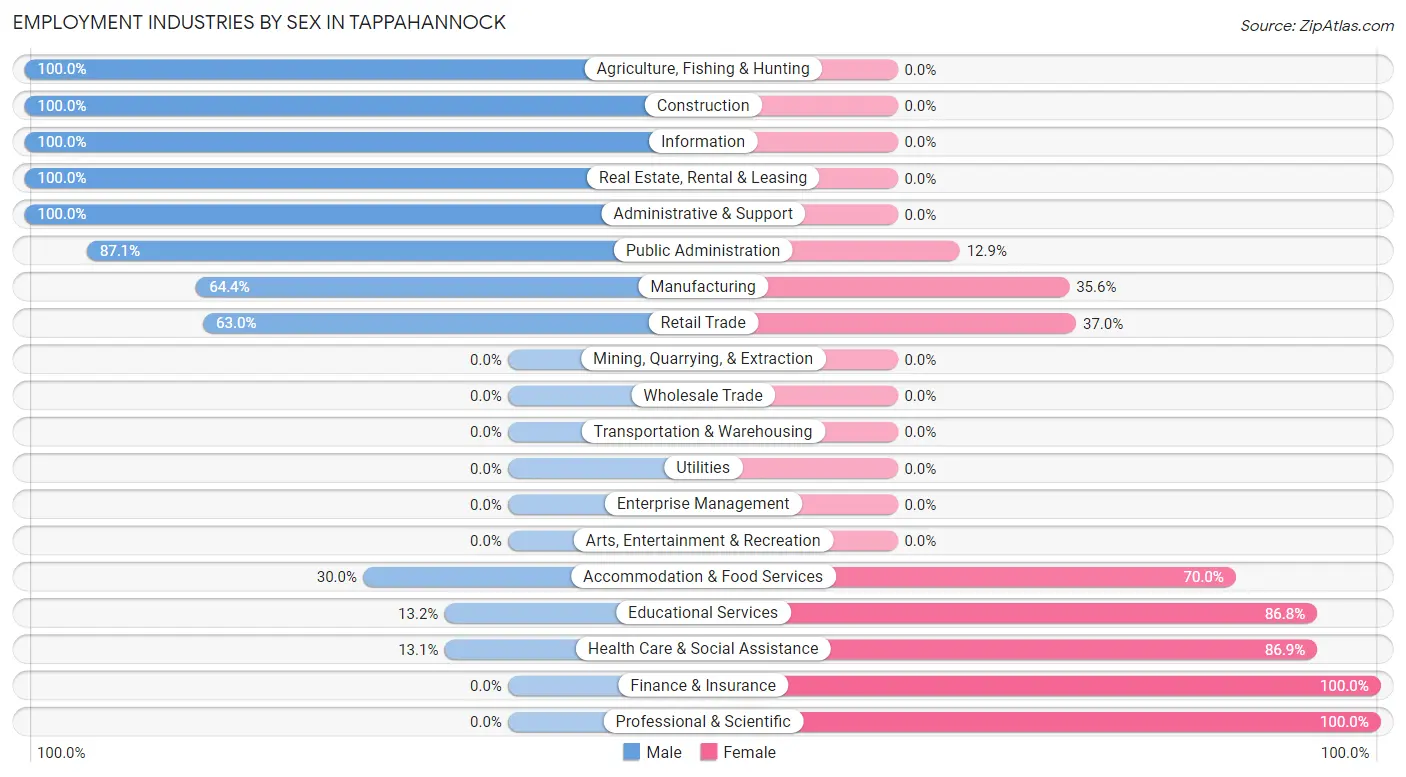
| Industry | Male | Female |
| Agriculture, Fishing & Hunting | 8 (100.0%) | 0 (0.0%) |
| Mining, Quarrying, & Extraction | 0 (0.0%) | 0 (0.0%) |
| Construction | 55 (100.0%) | 0 (0.0%) |
| Manufacturing | 58 (64.4%) | 32 (35.6%) |
| Wholesale Trade | 0 (0.0%) | 0 (0.0%) |
| Retail Trade | 75 (63.0%) | 44 (37.0%) |
| Transportation & Warehousing | 0 (0.0%) | 0 (0.0%) |
| Utilities | 0 (0.0%) | 0 (0.0%) |
| Information | 12 (100.0%) | 0 (0.0%) |
| Finance & Insurance | 0 (0.0%) | 24 (100.0%) |
| Real Estate, Rental & Leasing | 25 (100.0%) | 0 (0.0%) |
| Professional & Scientific | 0 (0.0%) | 5 (100.0%) |
| Enterprise Management | 0 (0.0%) | 0 (0.0%) |
| Administrative & Support | 10 (100.0%) | 0 (0.0%) |
| Educational Services | 10 (13.2%) | 66 (86.8%) |
| Health Care & Social Assistance | 23 (13.1%) | 152 (86.9%) |
| Arts, Entertainment & Recreation | 0 (0.0%) | 0 (0.0%) |
| Accommodation & Food Services | 6 (30.0%) | 14 (70.0%) |
| Public Administration | 27 (87.1%) | 4 (12.9%) |
| Total | 344 (48.0%) | 373 (52.0%) |
Education in Tappahannock
School Enrollment in Tappahannock
The most common levels of schooling among the 413 students in Tappahannock are middle school (151 | 36.6%), elementary school (82 | 19.9%), and kindergarten (74 | 17.9%).
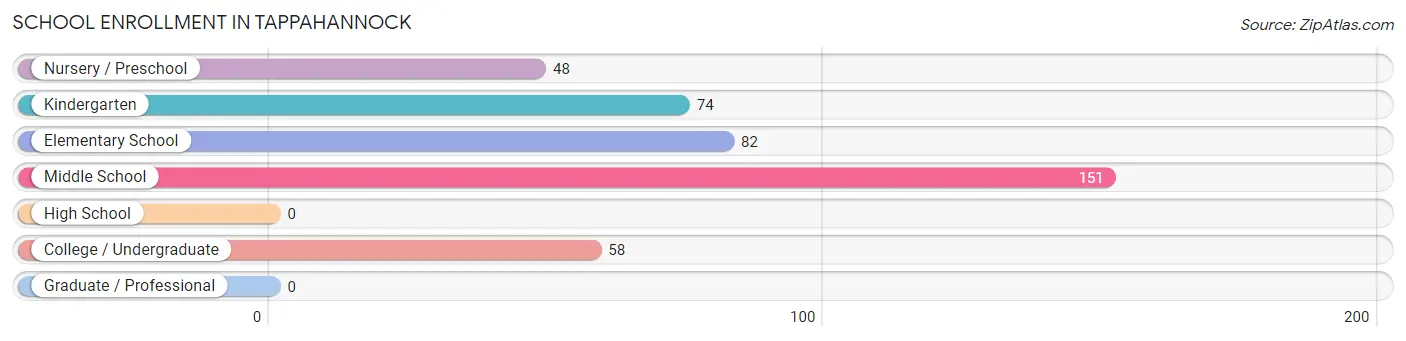
| School Level | # Students | % Students |
| Nursery / Preschool | 48 | 11.6% |
| Kindergarten | 74 | 17.9% |
| Elementary School | 82 | 19.9% |
| Middle School | 151 | 36.6% |
| High School | 0 | 0.0% |
| College / Undergraduate | 58 | 14.0% |
| Graduate / Professional | 0 | 0.0% |
| Total | 413 | 100.0% |
School Enrollment by Age by Funding Source in Tappahannock
Out of a total of 413 students who are enrolled in schools in Tappahannock, 52 (12.6%) attend a private institution, while the remaining 361 (87.4%) are enrolled in public schools. The age group of 20 to 24 year olds has the highest likelihood of being enrolled in private schools, with 8 (88.9% in the age bracket) enrolled. Conversely, the age group of 25 to 34 year olds has the lowest likelihood of being enrolled in a private school, with 24 (100.0% in the age bracket) attending a public institution.
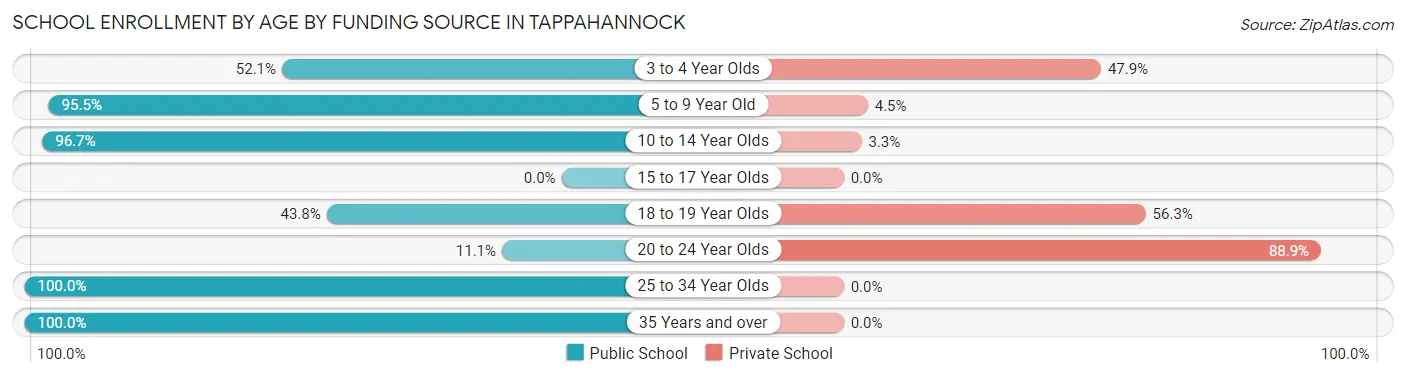
| Age Bracket | Public School | Private School |
| 3 to 4 Year Olds | 25 (52.1%) | 23 (47.9%) |
| 5 to 9 Year Old | 149 (95.5%) | 7 (4.5%) |
| 10 to 14 Year Olds | 146 (96.7%) | 5 (3.3%) |
| 15 to 17 Year Olds | 0 (0.0%) | 0 (0.0%) |
| 18 to 19 Year Olds | 7 (43.8%) | 9 (56.2%) |
| 20 to 24 Year Olds | 1 (11.1%) | 8 (88.9%) |
| 25 to 34 Year Olds | 24 (100.0%) | 0 (0.0%) |
| 35 Years and over | 9 (100.0%) | 0 (0.0%) |
| Total | 361 (87.4%) | 52 (12.6%) |
Educational Attainment by Field of Study in Tappahannock
Education (54 | 16.7%), business (44 | 13.6%), literature & languages (36 | 11.2%), engineering (34 | 10.5%), and psychology (32 | 9.9%) are the most common fields of study among 323 individuals in Tappahannock who have obtained a bachelor's degree or higher.
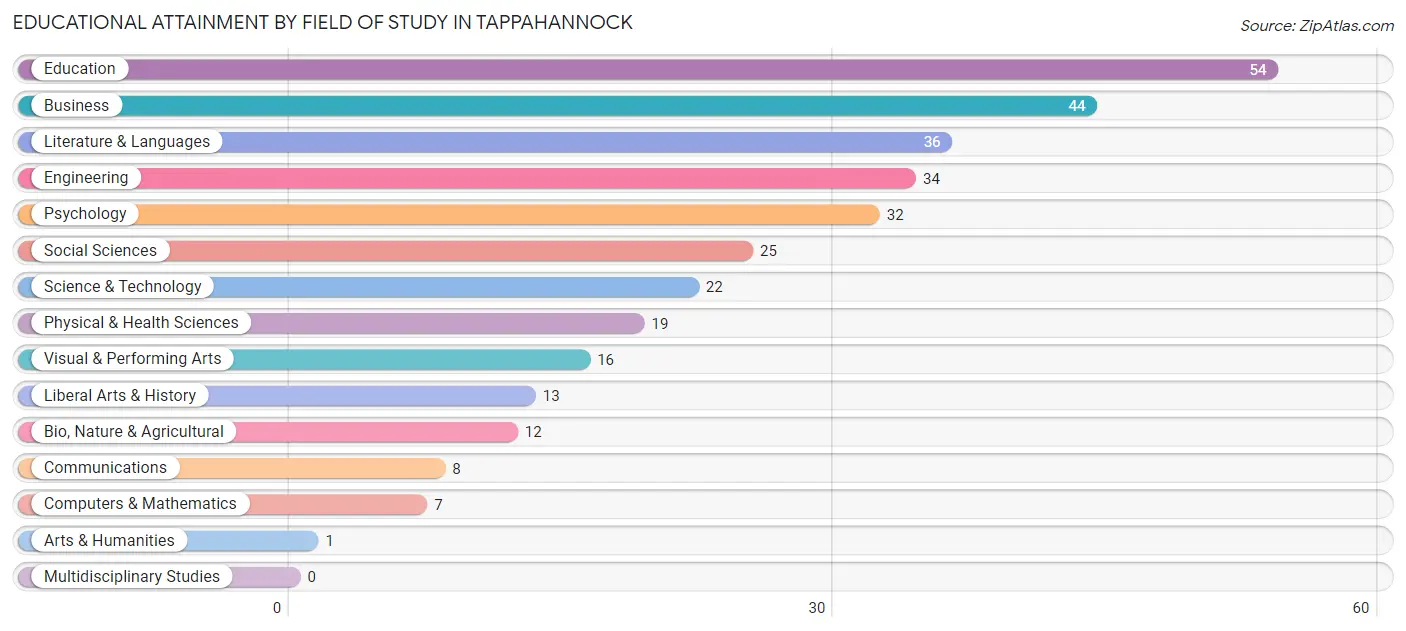
| Field of Study | # Graduates | % Graduates |
| Computers & Mathematics | 7 | 2.2% |
| Bio, Nature & Agricultural | 12 | 3.7% |
| Physical & Health Sciences | 19 | 5.9% |
| Psychology | 32 | 9.9% |
| Social Sciences | 25 | 7.7% |
| Engineering | 34 | 10.5% |
| Multidisciplinary Studies | 0 | 0.0% |
| Science & Technology | 22 | 6.8% |
| Business | 44 | 13.6% |
| Education | 54 | 16.7% |
| Literature & Languages | 36 | 11.2% |
| Liberal Arts & History | 13 | 4.0% |
| Visual & Performing Arts | 16 | 5.0% |
| Communications | 8 | 2.5% |
| Arts & Humanities | 1 | 0.3% |
| Total | 323 | 100.0% |
Transportation & Commute in Tappahannock
Vehicle Availability by Sex in Tappahannock
The most prevalent vehicle ownership categories in Tappahannock are males with 1 vehicle (84, accounting for 23.4%) and females with 1 vehicle (150, making up 24.1%).
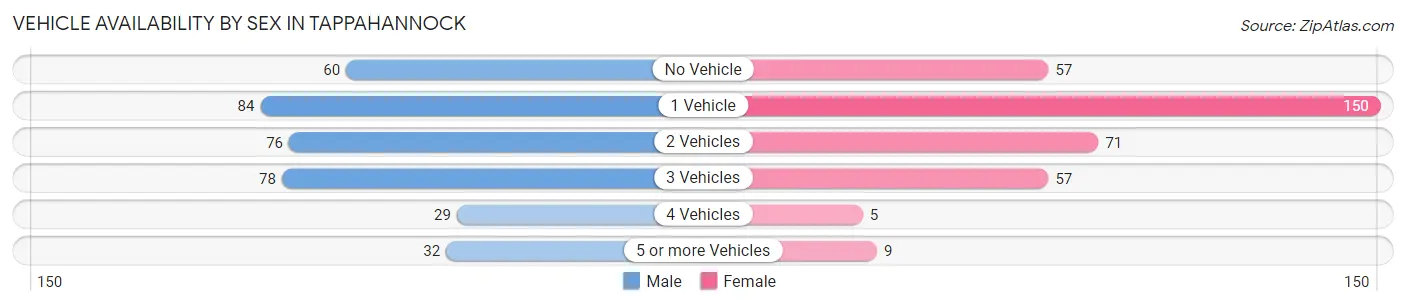
| Vehicles Available | Male | Female |
| No Vehicle | 60 (16.7%) | 57 (16.3%) |
| 1 Vehicle | 84 (23.4%) | 150 (43.0%) |
| 2 Vehicles | 76 (21.2%) | 71 (20.3%) |
| 3 Vehicles | 78 (21.7%) | 57 (16.3%) |
| 4 Vehicles | 29 (8.1%) | 5 (1.4%) |
| 5 or more Vehicles | 32 (8.9%) | 9 (2.6%) |
| Total | 359 (100.0%) | 349 (100.0%) |
Commute Time in Tappahannock
The most frequently occuring commute durations in Tappahannock are 60 to 89 minutes (108 commuters, 16.6%), 5 to 9 minutes (101 commuters, 15.5%), and 10 to 14 minutes (95 commuters, 14.6%).
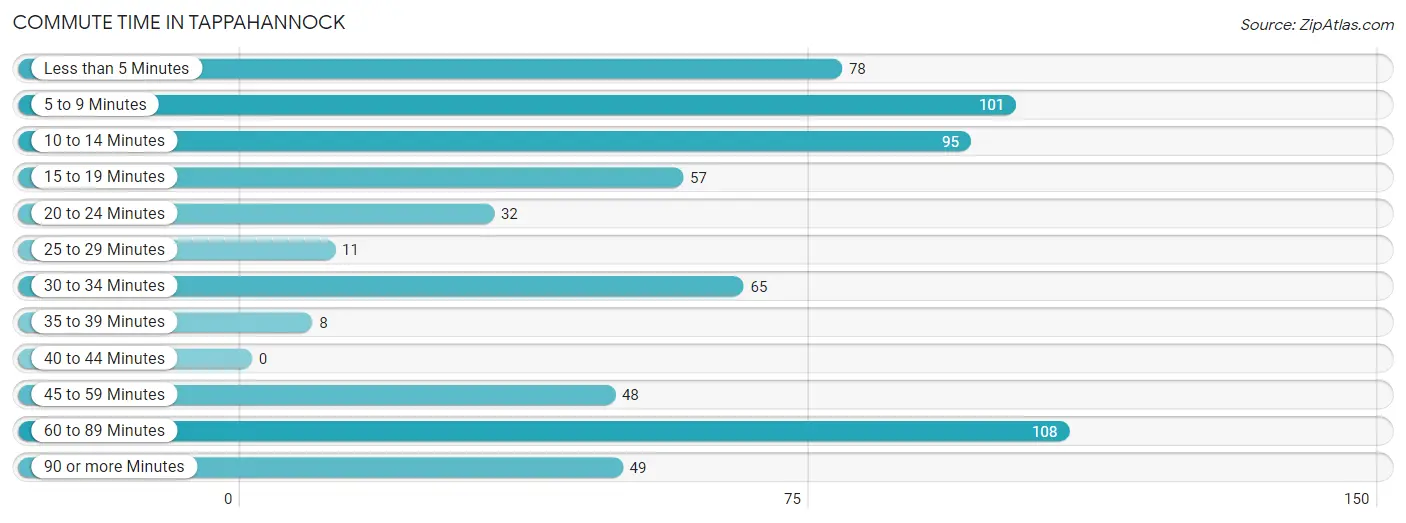
| Commute Time | # Commuters | % Commuters |
| Less than 5 Minutes | 78 | 12.0% |
| 5 to 9 Minutes | 101 | 15.5% |
| 10 to 14 Minutes | 95 | 14.6% |
| 15 to 19 Minutes | 57 | 8.7% |
| 20 to 24 Minutes | 32 | 4.9% |
| 25 to 29 Minutes | 11 | 1.7% |
| 30 to 34 Minutes | 65 | 10.0% |
| 35 to 39 Minutes | 8 | 1.2% |
| 40 to 44 Minutes | 0 | 0.0% |
| 45 to 59 Minutes | 48 | 7.4% |
| 60 to 89 Minutes | 108 | 16.6% |
| 90 or more Minutes | 49 | 7.5% |
Commute Time by Sex in Tappahannock
The most common commute times in Tappahannock are 10 to 14 minutes (65 commuters, 21.4%) for males and 5 to 9 minutes (70 commuters, 20.1%) for females.
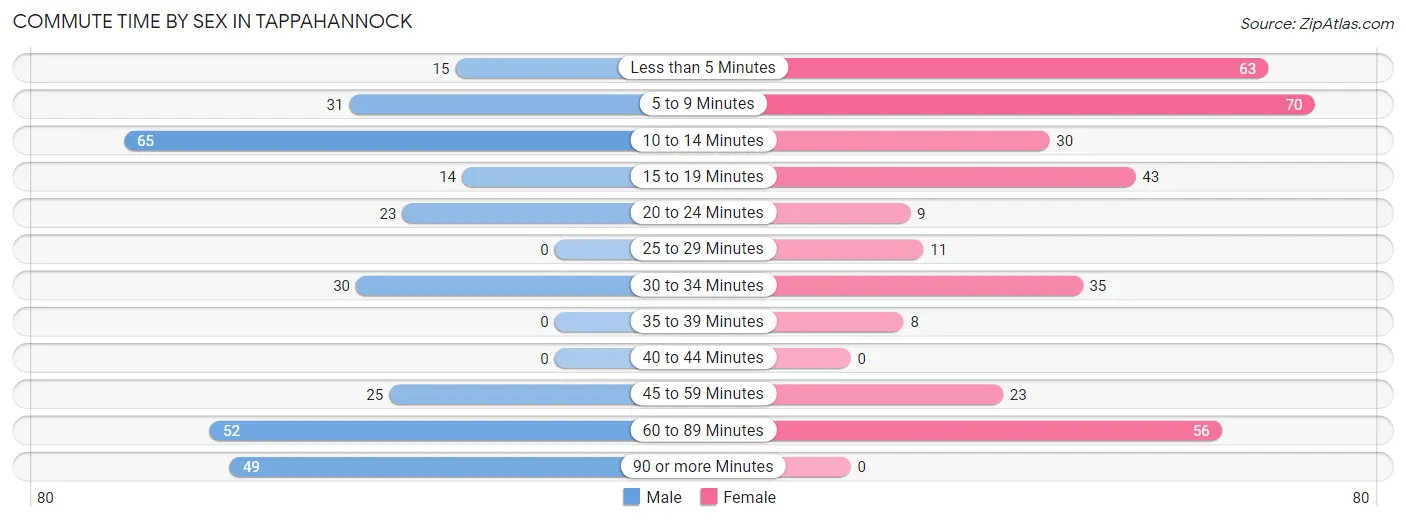
| Commute Time | Male | Female |
| Less than 5 Minutes | 15 (4.9%) | 63 (18.1%) |
| 5 to 9 Minutes | 31 (10.2%) | 70 (20.1%) |
| 10 to 14 Minutes | 65 (21.4%) | 30 (8.6%) |
| 15 to 19 Minutes | 14 (4.6%) | 43 (12.4%) |
| 20 to 24 Minutes | 23 (7.6%) | 9 (2.6%) |
| 25 to 29 Minutes | 0 (0.0%) | 11 (3.2%) |
| 30 to 34 Minutes | 30 (9.9%) | 35 (10.1%) |
| 35 to 39 Minutes | 0 (0.0%) | 8 (2.3%) |
| 40 to 44 Minutes | 0 (0.0%) | 0 (0.0%) |
| 45 to 59 Minutes | 25 (8.2%) | 23 (6.6%) |
| 60 to 89 Minutes | 52 (17.1%) | 56 (16.1%) |
| 90 or more Minutes | 49 (16.1%) | 0 (0.0%) |
Time of Departure to Work by Sex in Tappahannock
The most frequent times of departure to work in Tappahannock are 5:30 AM to 5:59 AM (47, 15.5%) for males and 8:30 AM to 8:59 AM (54, 15.5%) for females.
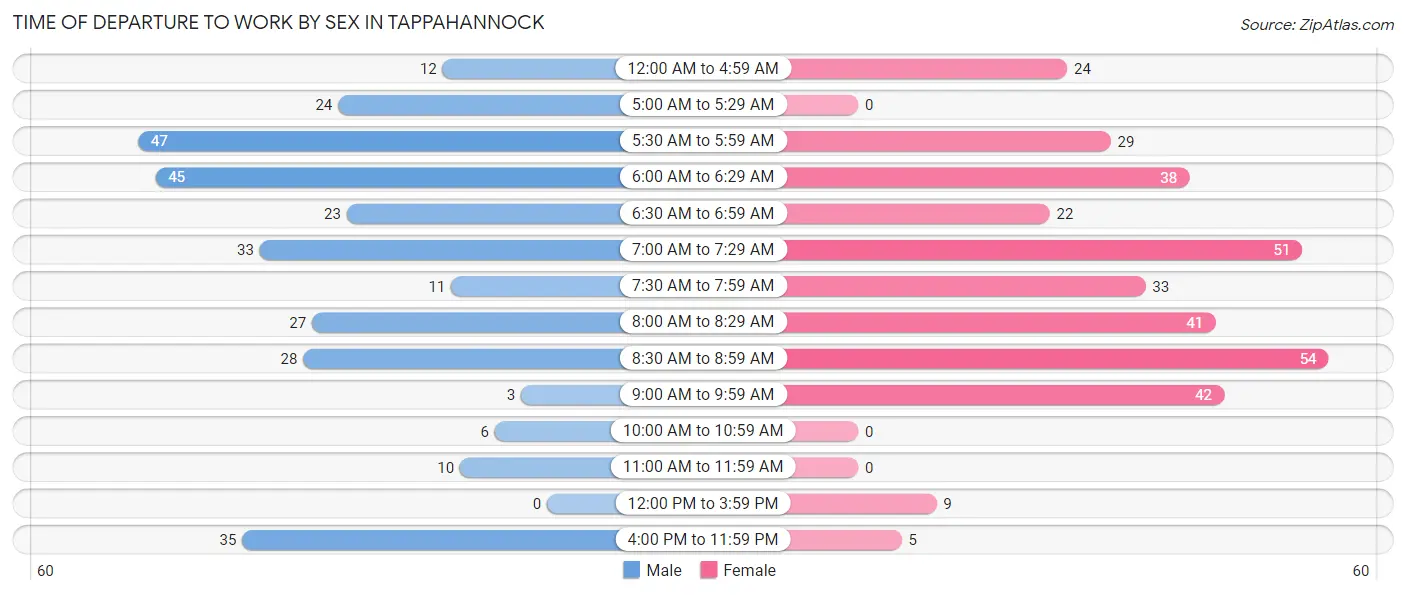
| Time of Departure | Male | Female |
| 12:00 AM to 4:59 AM | 12 (4.0%) | 24 (6.9%) |
| 5:00 AM to 5:29 AM | 24 (7.9%) | 0 (0.0%) |
| 5:30 AM to 5:59 AM | 47 (15.5%) | 29 (8.3%) |
| 6:00 AM to 6:29 AM | 45 (14.8%) | 38 (10.9%) |
| 6:30 AM to 6:59 AM | 23 (7.6%) | 22 (6.3%) |
| 7:00 AM to 7:29 AM | 33 (10.9%) | 51 (14.7%) |
| 7:30 AM to 7:59 AM | 11 (3.6%) | 33 (9.5%) |
| 8:00 AM to 8:29 AM | 27 (8.9%) | 41 (11.8%) |
| 8:30 AM to 8:59 AM | 28 (9.2%) | 54 (15.5%) |
| 9:00 AM to 9:59 AM | 3 (1.0%) | 42 (12.1%) |
| 10:00 AM to 10:59 AM | 6 (2.0%) | 0 (0.0%) |
| 11:00 AM to 11:59 AM | 10 (3.3%) | 0 (0.0%) |
| 12:00 PM to 3:59 PM | 0 (0.0%) | 9 (2.6%) |
| 4:00 PM to 11:59 PM | 35 (11.5%) | 5 (1.4%) |
| Total | 304 (100.0%) | 348 (100.0%) |
Housing Occupancy in Tappahannock
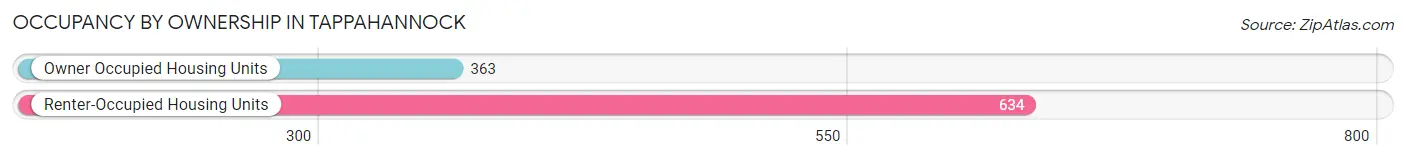
Occupancy by Ownership in Tappahannock
Of the total 997 dwellings in Tappahannock, owner-occupied units account for 363 (36.4%), while renter-occupied units make up 634 (63.6%).
| Occupancy | # Housing Units | % Housing Units |
| Owner Occupied Housing Units | 363 | 36.4% |
| Renter-Occupied Housing Units | 634 | 63.6% |
| Total Occupied Housing Units | 997 | 100.0% |
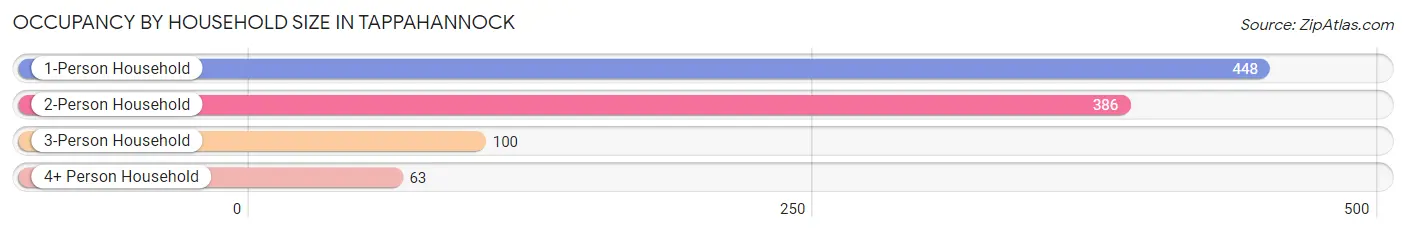
Occupancy by Household Size in Tappahannock
| Household Size | # Housing Units | % Housing Units |
| 1-Person Household | 448 | 44.9% |
| 2-Person Household | 386 | 38.7% |
| 3-Person Household | 100 | 10.0% |
| 4+ Person Household | 63 | 6.3% |
| Total Housing Units | 997 | 100.0% |
Occupancy by Ownership by Household Size in Tappahannock
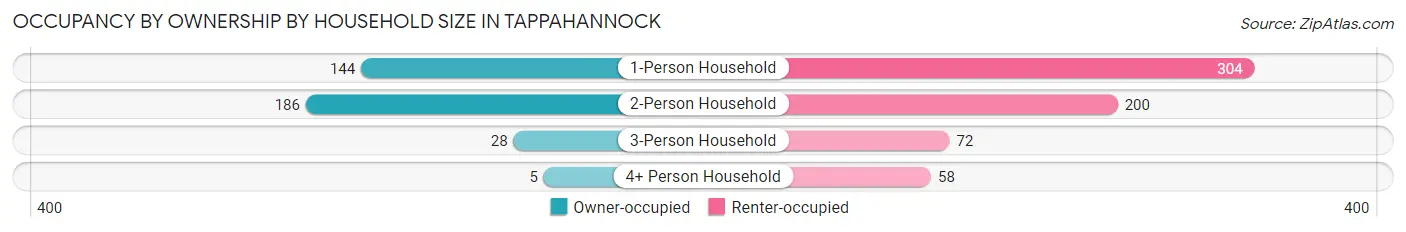
| Household Size | Owner-occupied | Renter-occupied |
| 1-Person Household | 144 (32.1%) | 304 (67.9%) |
| 2-Person Household | 186 (48.2%) | 200 (51.8%) |
| 3-Person Household | 28 (28.0%) | 72 (72.0%) |
| 4+ Person Household | 5 (7.9%) | 58 (92.1%) |
| Total Housing Units | 363 (36.4%) | 634 (63.6%) |
Occupancy by Educational Attainment in Tappahannock
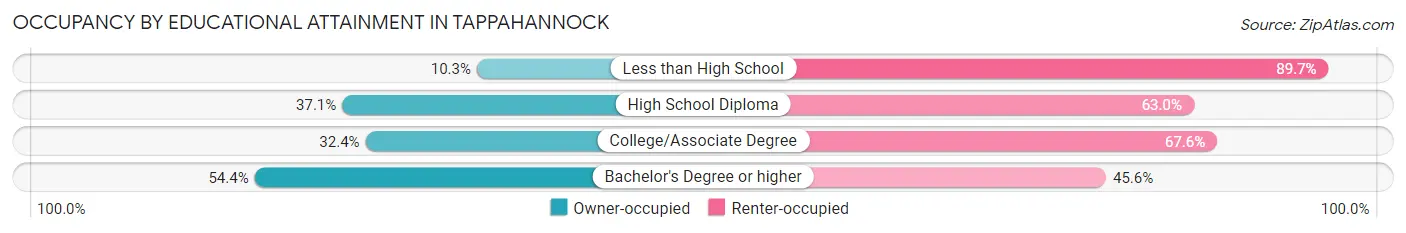
| Household Size | Owner-occupied | Renter-occupied |
| Less than High School | 9 (10.3%) | 78 (89.7%) |
| High School Diploma | 93 (37.0%) | 158 (62.9%) |
| College/Associate Degree | 144 (32.4%) | 300 (67.6%) |
| Bachelor's Degree or higher | 117 (54.4%) | 98 (45.6%) |
Occupancy by Age of Householder in Tappahannock
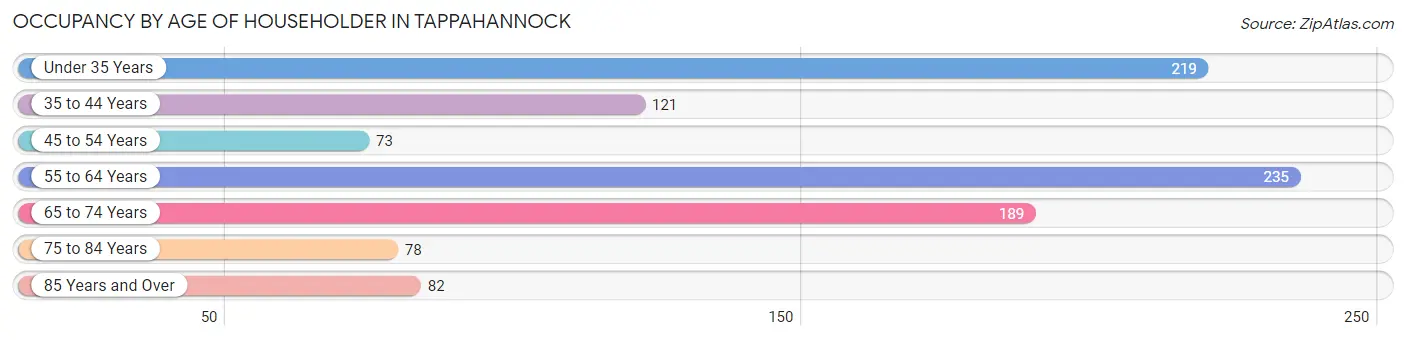
| Age Bracket | # Households | % Households |
| Under 35 Years | 219 | 22.0% |
| 35 to 44 Years | 121 | 12.1% |
| 45 to 54 Years | 73 | 7.3% |
| 55 to 64 Years | 235 | 23.6% |
| 65 to 74 Years | 189 | 19.0% |
| 75 to 84 Years | 78 | 7.8% |
| 85 Years and Over | 82 | 8.2% |
| Total | 997 | 100.0% |
Housing Finances in Tappahannock
Median Income by Occupancy in Tappahannock
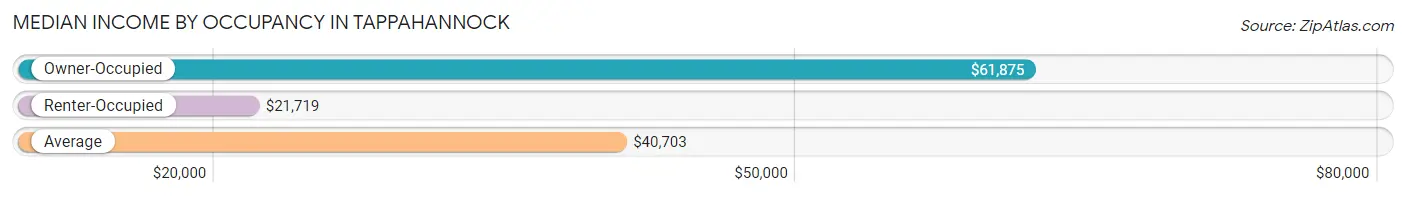
| Occupancy Type | # Households | Median Income |
| Owner-Occupied | 363 (36.4%) | $61,875 |
| Renter-Occupied | 634 (63.6%) | $21,719 |
| Average | 997 (100.0%) | $40,703 |
Occupancy by Householder Income Bracket in Tappahannock
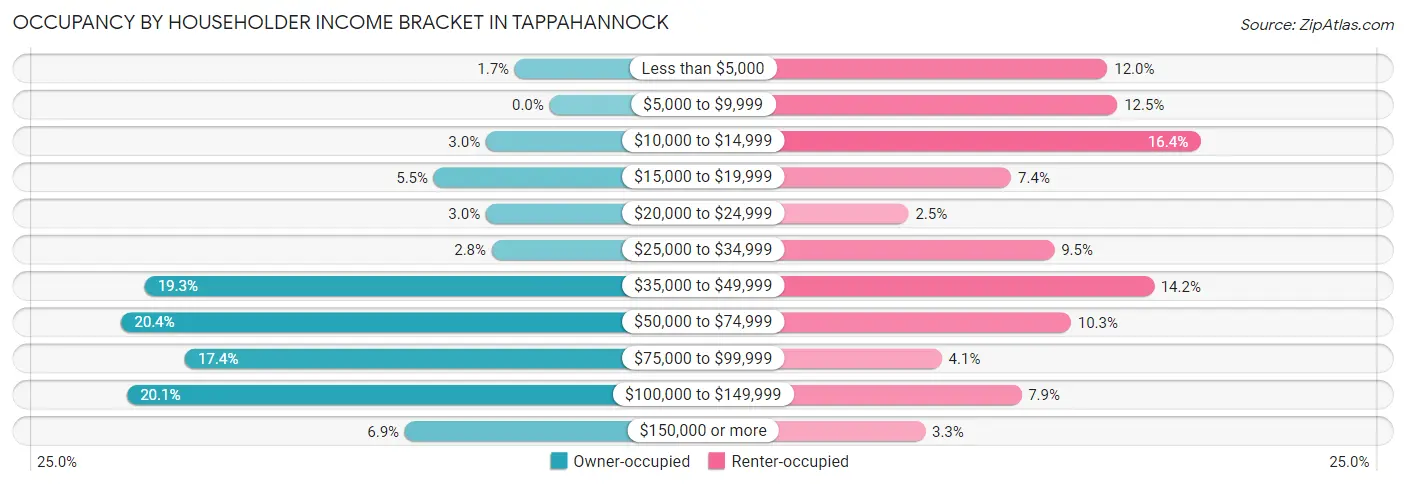
| Income Bracket | Owner-occupied | Renter-occupied |
| Less than $5,000 | 6 (1.7%) | 76 (12.0%) |
| $5,000 to $9,999 | 0 (0.0%) | 79 (12.5%) |
| $10,000 to $14,999 | 11 (3.0%) | 104 (16.4%) |
| $15,000 to $19,999 | 20 (5.5%) | 47 (7.4%) |
| $20,000 to $24,999 | 11 (3.0%) | 16 (2.5%) |
| $25,000 to $34,999 | 10 (2.8%) | 60 (9.5%) |
| $35,000 to $49,999 | 70 (19.3%) | 90 (14.2%) |
| $50,000 to $74,999 | 74 (20.4%) | 65 (10.2%) |
| $75,000 to $99,999 | 63 (17.4%) | 26 (4.1%) |
| $100,000 to $149,999 | 73 (20.1%) | 50 (7.9%) |
| $150,000 or more | 25 (6.9%) | 21 (3.3%) |
| Total | 363 (100.0%) | 634 (100.0%) |
Monthly Housing Cost Tiers in Tappahannock
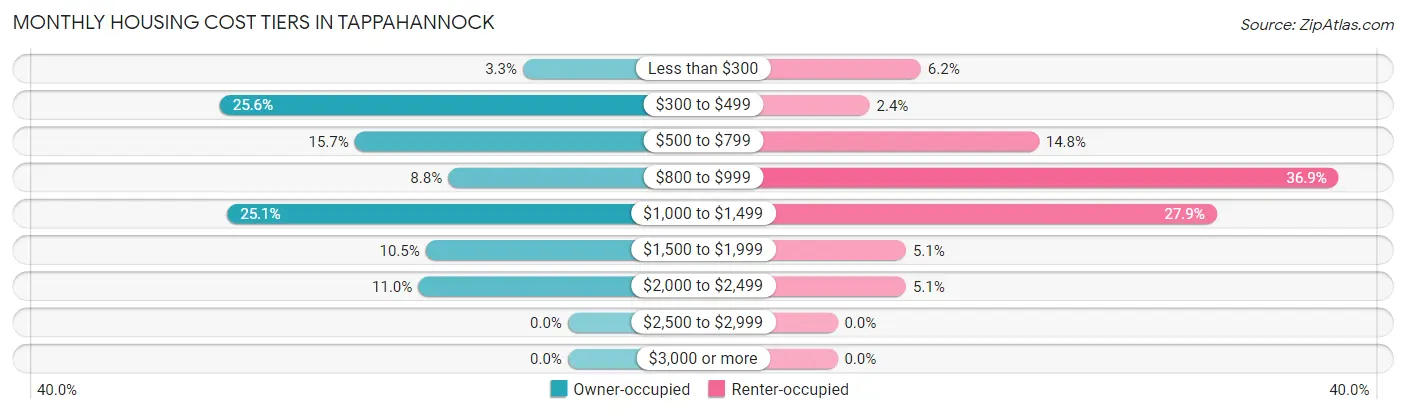
| Monthly Cost | Owner-occupied | Renter-occupied |
| Less than $300 | 12 (3.3%) | 39 (6.1%) |
| $300 to $499 | 93 (25.6%) | 15 (2.4%) |
| $500 to $799 | 57 (15.7%) | 94 (14.8%) |
| $800 to $999 | 32 (8.8%) | 234 (36.9%) |
| $1,000 to $1,499 | 91 (25.1%) | 177 (27.9%) |
| $1,500 to $1,999 | 38 (10.5%) | 32 (5.1%) |
| $2,000 to $2,499 | 40 (11.0%) | 32 (5.1%) |
| $2,500 to $2,999 | 0 (0.0%) | 0 (0.0%) |
| $3,000 or more | 0 (0.0%) | 0 (0.0%) |
| Total | 363 (100.0%) | 634 (100.0%) |
Physical Housing Characteristics in Tappahannock
Housing Structures in Tappahannock
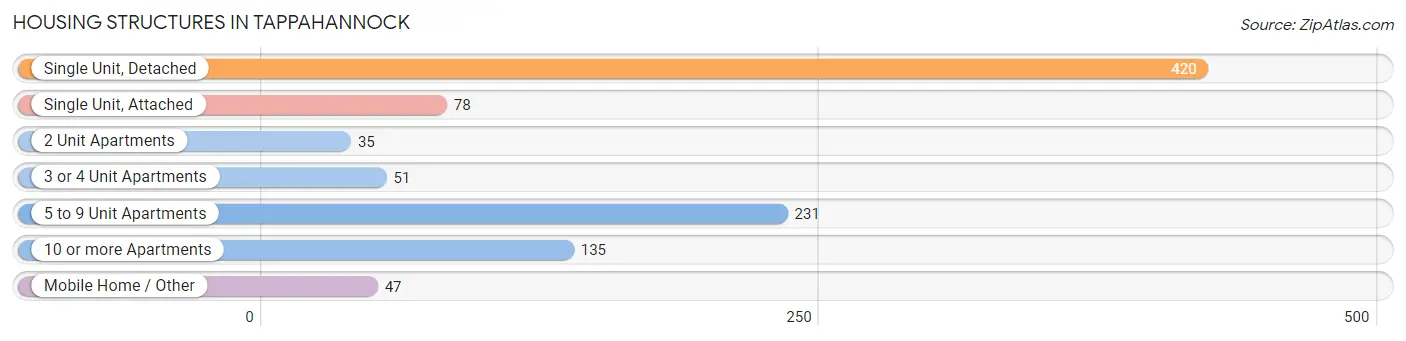
| Structure Type | # Housing Units | % Housing Units |
| Single Unit, Detached | 420 | 42.1% |
| Single Unit, Attached | 78 | 7.8% |
| 2 Unit Apartments | 35 | 3.5% |
| 3 or 4 Unit Apartments | 51 | 5.1% |
| 5 to 9 Unit Apartments | 231 | 23.2% |
| 10 or more Apartments | 135 | 13.5% |
| Mobile Home / Other | 47 | 4.7% |
| Total | 997 | 100.0% |
Housing Structures by Occupancy in Tappahannock
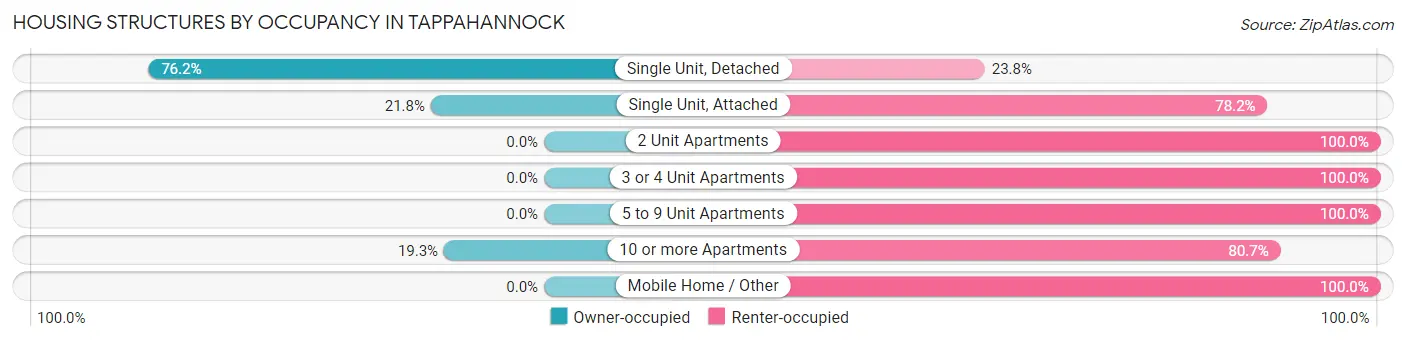
| Structure Type | Owner-occupied | Renter-occupied |
| Single Unit, Detached | 320 (76.2%) | 100 (23.8%) |
| Single Unit, Attached | 17 (21.8%) | 61 (78.2%) |
| 2 Unit Apartments | 0 (0.0%) | 35 (100.0%) |
| 3 or 4 Unit Apartments | 0 (0.0%) | 51 (100.0%) |
| 5 to 9 Unit Apartments | 0 (0.0%) | 231 (100.0%) |
| 10 or more Apartments | 26 (19.3%) | 109 (80.7%) |
| Mobile Home / Other | 0 (0.0%) | 47 (100.0%) |
| Total | 363 (36.4%) | 634 (63.6%) |
Housing Structures by Number of Rooms in Tappahannock
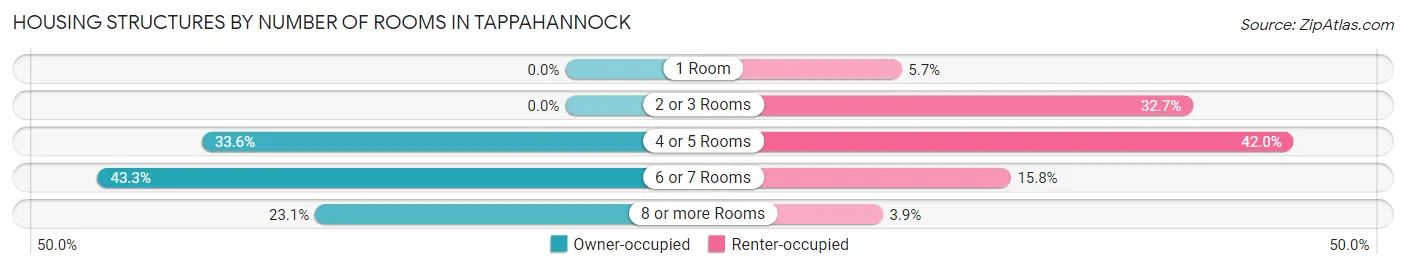
| Number of Rooms | Owner-occupied | Renter-occupied |
| 1 Room | 0 (0.0%) | 36 (5.7%) |
| 2 or 3 Rooms | 0 (0.0%) | 207 (32.7%) |
| 4 or 5 Rooms | 122 (33.6%) | 266 (42.0%) |
| 6 or 7 Rooms | 157 (43.2%) | 100 (15.8%) |
| 8 or more Rooms | 84 (23.1%) | 25 (3.9%) |
| Total | 363 (100.0%) | 634 (100.0%) |
Housing Structure by Heating Type in Tappahannock
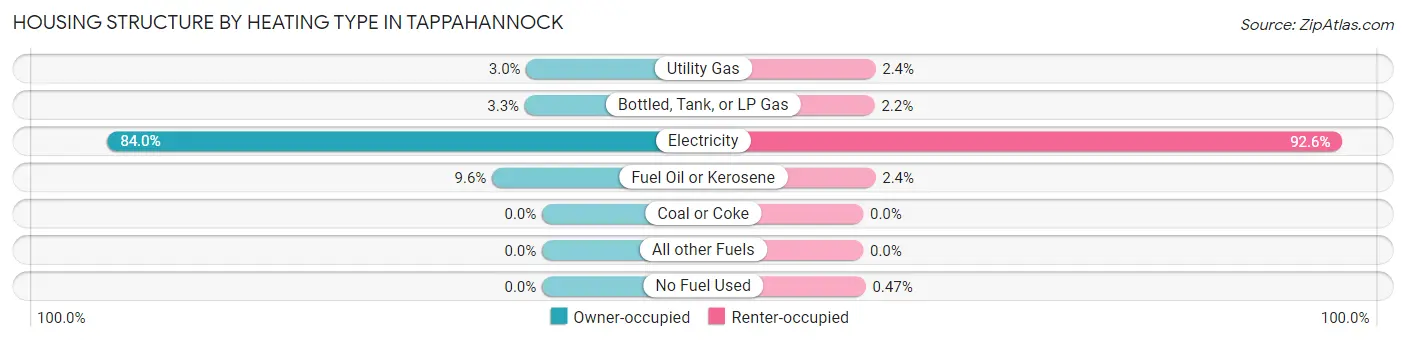
| Heating Type | Owner-occupied | Renter-occupied |
| Utility Gas | 11 (3.0%) | 15 (2.4%) |
| Bottled, Tank, or LP Gas | 12 (3.3%) | 14 (2.2%) |
| Electricity | 305 (84.0%) | 587 (92.6%) |
| Fuel Oil or Kerosene | 35 (9.6%) | 15 (2.4%) |
| Coal or Coke | 0 (0.0%) | 0 (0.0%) |
| All other Fuels | 0 (0.0%) | 0 (0.0%) |
| No Fuel Used | 0 (0.0%) | 3 (0.5%) |
| Total | 363 (100.0%) | 634 (100.0%) |
Household Vehicle Usage in Tappahannock
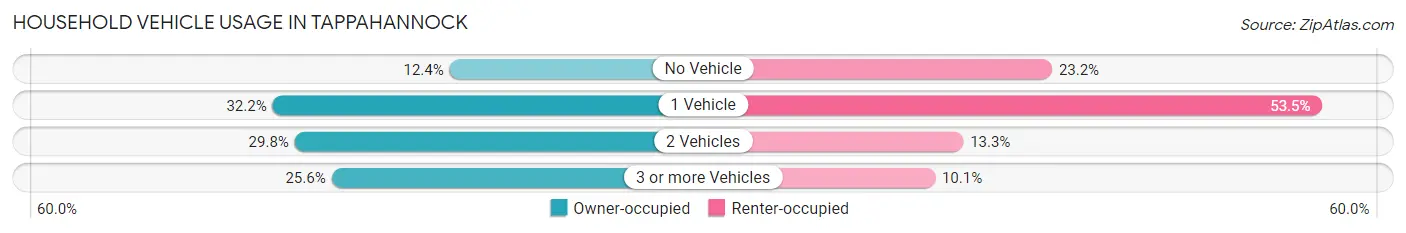
| Vehicles per Household | Owner-occupied | Renter-occupied |
| No Vehicle | 45 (12.4%) | 147 (23.2%) |
| 1 Vehicle | 117 (32.2%) | 339 (53.5%) |
| 2 Vehicles | 108 (29.7%) | 84 (13.3%) |
| 3 or more Vehicles | 93 (25.6%) | 64 (10.1%) |
| Total | 363 (100.0%) | 634 (100.0%) |
Real Estate & Mortgages in Tappahannock
Real Estate and Mortgage Overview in Tappahannock
| Characteristic | Without Mortgage | With Mortgage |
| Housing Units | 176 | 187 |
| Median Property Value | $166,200 | $199,000 |
| Median Household Income | $59,231 | $6 |
| Monthly Housing Costs | $451 | $0 |
| Real Estate Taxes | $1,161 | $0 |
Property Value by Mortgage Status in Tappahannock
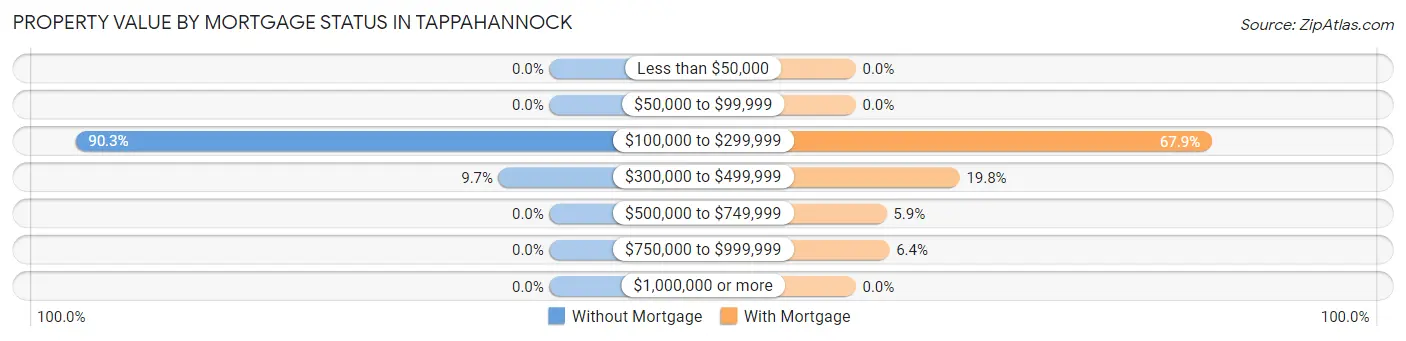
| Property Value | Without Mortgage | With Mortgage |
| Less than $50,000 | 0 (0.0%) | 0 (0.0%) |
| $50,000 to $99,999 | 0 (0.0%) | 0 (0.0%) |
| $100,000 to $299,999 | 159 (90.3%) | 127 (67.9%) |
| $300,000 to $499,999 | 17 (9.7%) | 37 (19.8%) |
| $500,000 to $749,999 | 0 (0.0%) | 11 (5.9%) |
| $750,000 to $999,999 | 0 (0.0%) | 12 (6.4%) |
| $1,000,000 or more | 0 (0.0%) | 0 (0.0%) |
| Total | 176 (100.0%) | 187 (100.0%) |
Household Income by Mortgage Status in Tappahannock
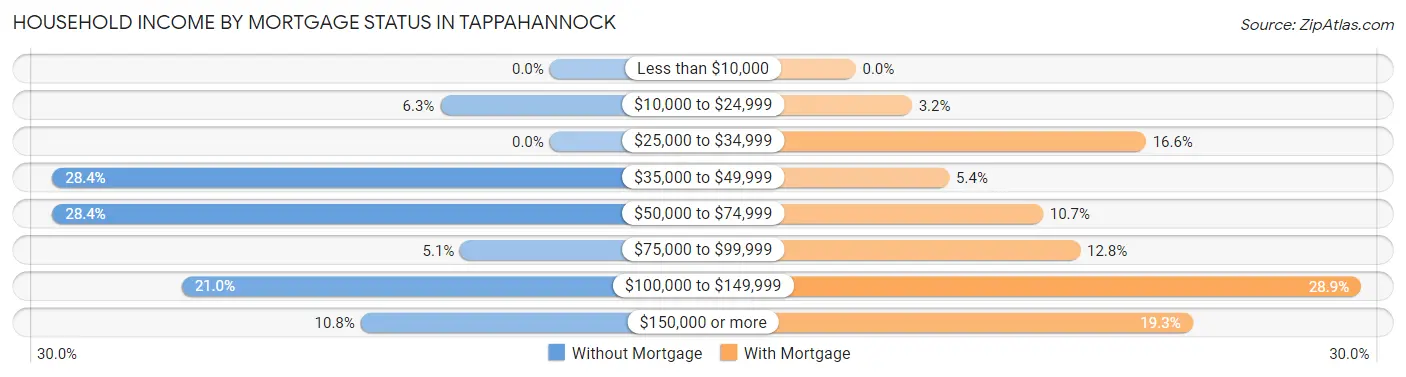
| Household Income | Without Mortgage | With Mortgage |
| Less than $10,000 | 0 (0.0%) | 0 (0.0%) |
| $10,000 to $24,999 | 11 (6.2%) | 6 (3.2%) |
| $25,000 to $34,999 | 0 (0.0%) | 31 (16.6%) |
| $35,000 to $49,999 | 50 (28.4%) | 10 (5.3%) |
| $50,000 to $74,999 | 50 (28.4%) | 20 (10.7%) |
| $75,000 to $99,999 | 9 (5.1%) | 24 (12.8%) |
| $100,000 to $149,999 | 37 (21.0%) | 54 (28.9%) |
| $150,000 or more | 19 (10.8%) | 36 (19.3%) |
| Total | 176 (100.0%) | 187 (100.0%) |
Property Value to Household Income Ratio in Tappahannock
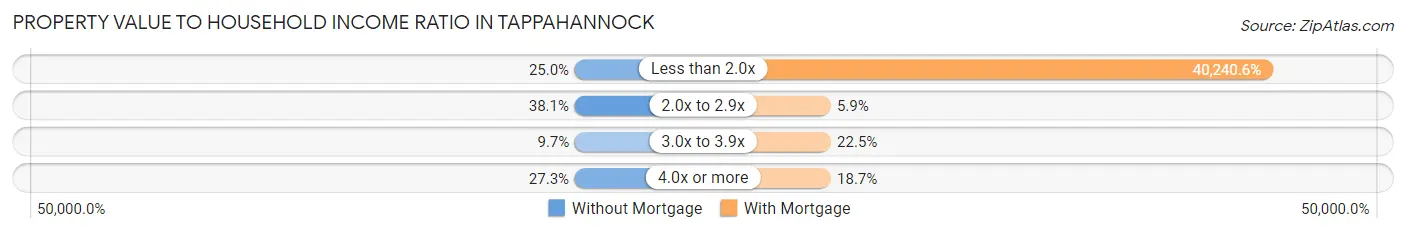
| Value-to-Income Ratio | Without Mortgage | With Mortgage |
| Less than 2.0x | 44 (25.0%) | 75,250 (40,240.6%) |
| 2.0x to 2.9x | 67 (38.1%) | 11 (5.9%) |
| 3.0x to 3.9x | 17 (9.7%) | 42 (22.5%) |
| 4.0x or more | 48 (27.3%) | 35 (18.7%) |
| Total | 176 (100.0%) | 187 (100.0%) |
Real Estate Taxes by Mortgage Status in Tappahannock
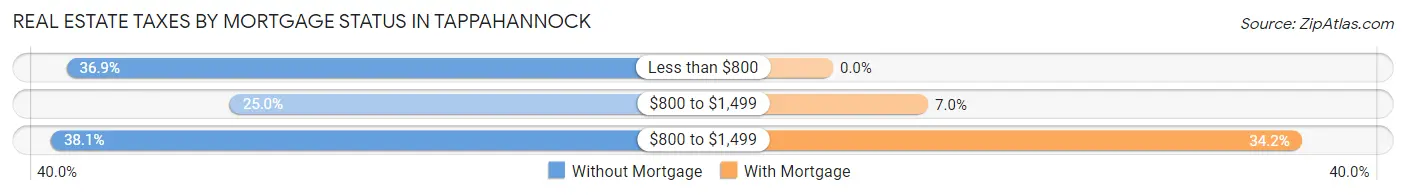
| Property Taxes | Without Mortgage | With Mortgage |
| Less than $800 | 65 (36.9%) | 0 (0.0%) |
| $800 to $1,499 | 44 (25.0%) | 13 (7.0%) |
| $800 to $1,499 | 67 (38.1%) | 64 (34.2%) |
| Total | 176 (100.0%) | 187 (100.0%) |
Health & Disability in Tappahannock
Health Insurance Coverage by Age in Tappahannock
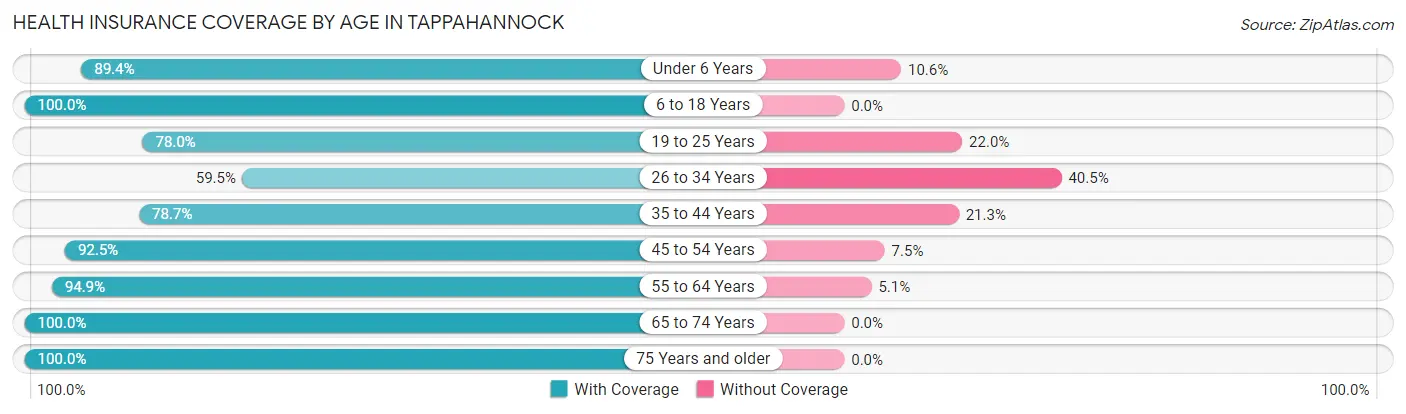
| Age Bracket | With Coverage | Without Coverage |
| Under 6 Years | 93 (89.4%) | 11 (10.6%) |
| 6 to 18 Years | 303 (100.0%) | 0 (0.0%) |
| 19 to 25 Years | 71 (78.0%) | 20 (22.0%) |
| 26 to 34 Years | 144 (59.5%) | 98 (40.5%) |
| 35 to 44 Years | 129 (78.7%) | 35 (21.3%) |
| 45 to 54 Years | 172 (92.5%) | 14 (7.5%) |
| 55 to 64 Years | 281 (94.9%) | 15 (5.1%) |
| 65 to 74 Years | 228 (100.0%) | 0 (0.0%) |
| 75 Years and older | 224 (100.0%) | 0 (0.0%) |
| Total | 1,645 (89.5%) | 193 (10.5%) |
Health Insurance Coverage by Citizenship Status in Tappahannock
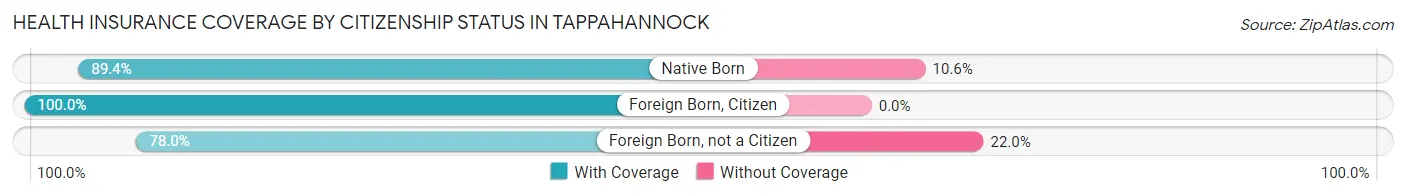
| Citizenship Status | With Coverage | Without Coverage |
| Native Born | 93 (89.4%) | 11 (10.6%) |
| Foreign Born, Citizen | 303 (100.0%) | 0 (0.0%) |
| Foreign Born, not a Citizen | 71 (78.0%) | 20 (22.0%) |
Health Insurance Coverage by Household Income in Tappahannock
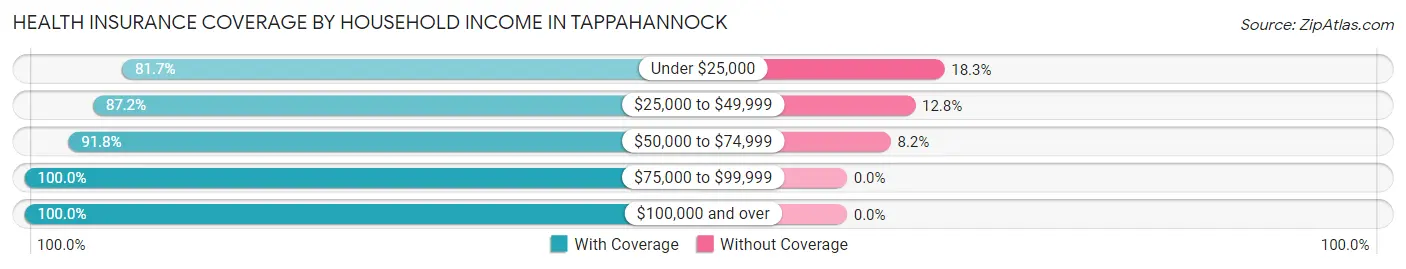
| Household Income | With Coverage | Without Coverage |
| Under $25,000 | 479 (81.7%) | 107 (18.3%) |
| $25,000 to $49,999 | 423 (87.2%) | 62 (12.8%) |
| $50,000 to $74,999 | 269 (91.8%) | 24 (8.2%) |
| $75,000 to $99,999 | 154 (100.0%) | 0 (0.0%) |
| $100,000 and over | 276 (100.0%) | 0 (0.0%) |
Public vs Private Health Insurance Coverage by Age in Tappahannock
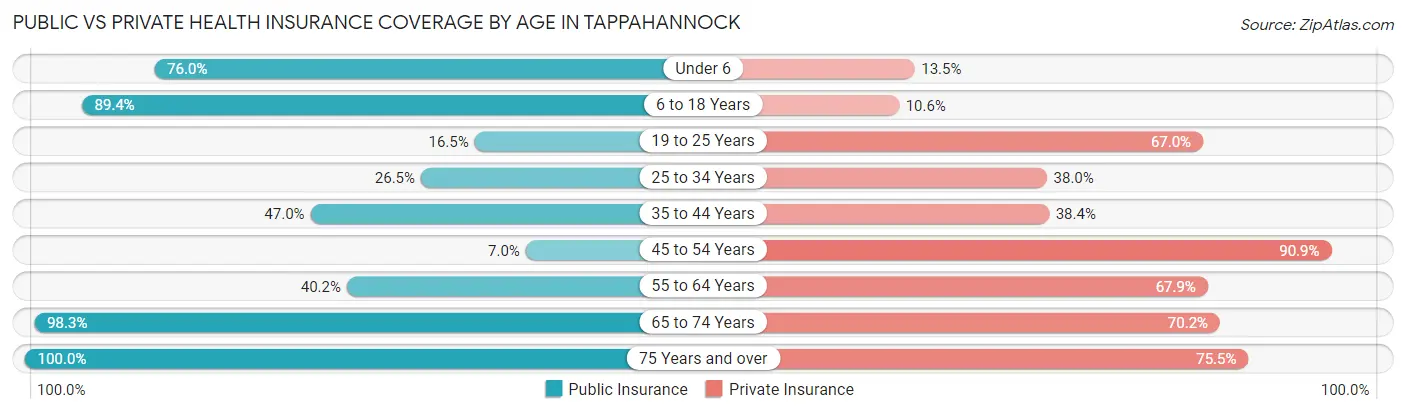
| Age Bracket | Public Insurance | Private Insurance |
| Under 6 | 79 (76.0%) | 14 (13.5%) |
| 6 to 18 Years | 271 (89.4%) | 32 (10.6%) |
| 19 to 25 Years | 15 (16.5%) | 61 (67.0%) |
| 25 to 34 Years | 64 (26.5%) | 92 (38.0%) |
| 35 to 44 Years | 77 (46.9%) | 63 (38.4%) |
| 45 to 54 Years | 13 (7.0%) | 169 (90.9%) |
| 55 to 64 Years | 119 (40.2%) | 201 (67.9%) |
| 65 to 74 Years | 224 (98.3%) | 160 (70.2%) |
| 75 Years and over | 224 (100.0%) | 169 (75.4%) |
| Total | 1,086 (59.1%) | 961 (52.3%) |
Disability Status by Sex by Age in Tappahannock
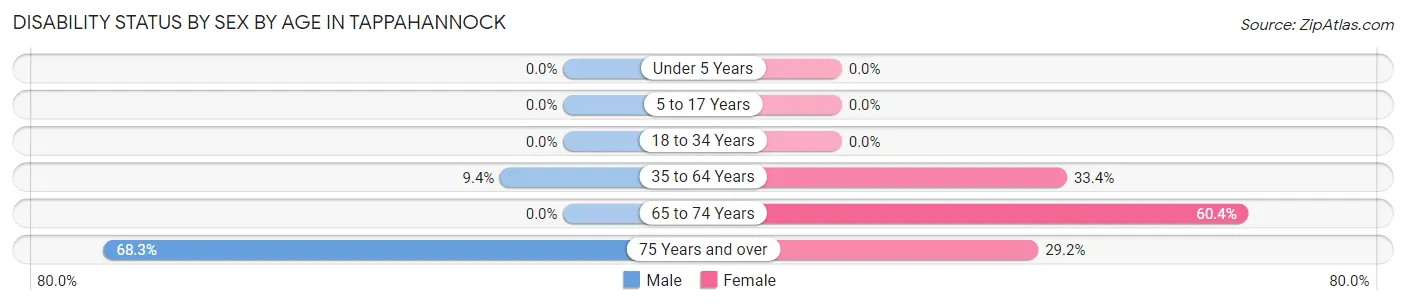
| Age Bracket | Male | Female |
| Under 5 Years | 0 (0.0%) | 0 (0.0%) |
| 5 to 17 Years | 0 (0.0%) | 0 (0.0%) |
| 18 to 34 Years | 0 (0.0%) | 0 (0.0%) |
| 35 to 64 Years | 32 (9.4%) | 102 (33.4%) |
| 65 to 74 Years | 0 (0.0%) | 93 (60.4%) |
| 75 Years and over | 71 (68.3%) | 35 (29.2%) |
Disability Class by Sex by Age in Tappahannock
Disability Class: Hearing Difficulty
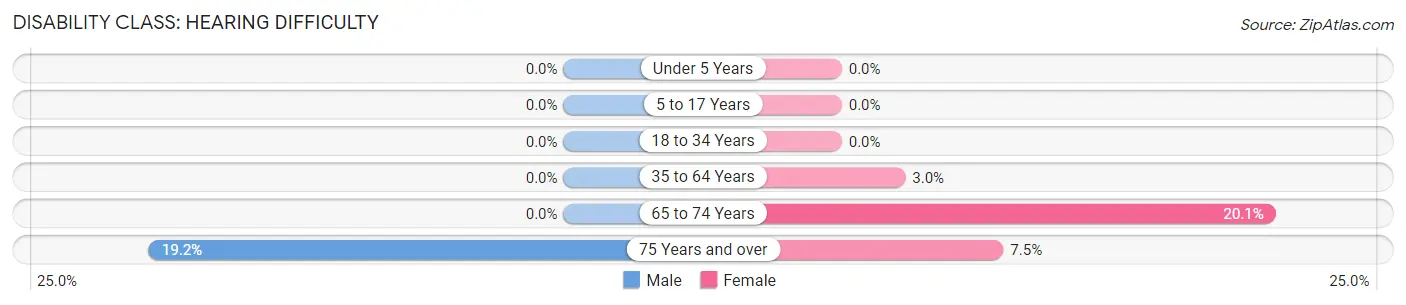
| Age Bracket | Male | Female |
| Under 5 Years | 0 (0.0%) | 0 (0.0%) |
| 5 to 17 Years | 0 (0.0%) | 0 (0.0%) |
| 18 to 34 Years | 0 (0.0%) | 0 (0.0%) |
| 35 to 64 Years | 0 (0.0%) | 9 (2.9%) |
| 65 to 74 Years | 0 (0.0%) | 31 (20.1%) |
| 75 Years and over | 20 (19.2%) | 9 (7.5%) |
Disability Class: Vision Difficulty
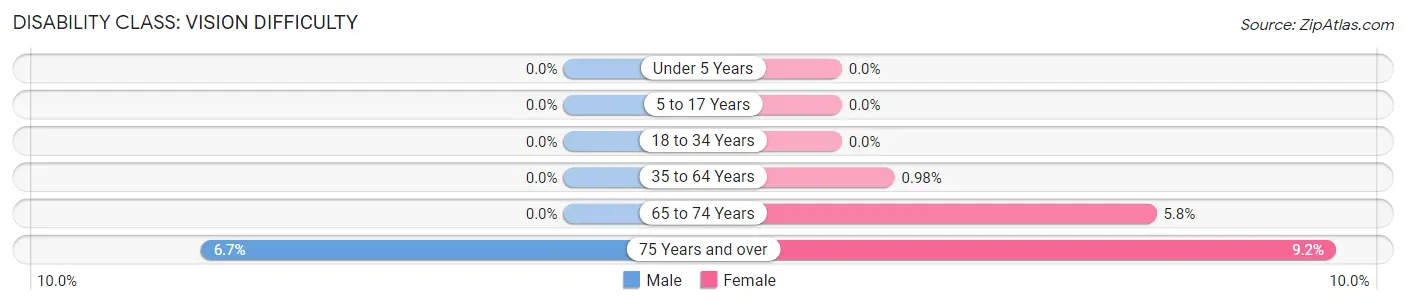
| Age Bracket | Male | Female |
| Under 5 Years | 0 (0.0%) | 0 (0.0%) |
| 5 to 17 Years | 0 (0.0%) | 0 (0.0%) |
| 18 to 34 Years | 0 (0.0%) | 0 (0.0%) |
| 35 to 64 Years | 0 (0.0%) | 3 (1.0%) |
| 65 to 74 Years | 0 (0.0%) | 9 (5.8%) |
| 75 Years and over | 7 (6.7%) | 11 (9.2%) |
Disability Class: Cognitive Difficulty
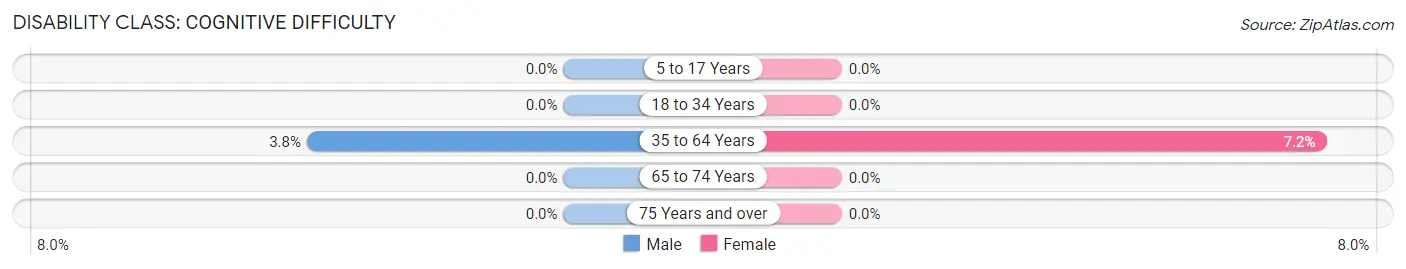
| Age Bracket | Male | Female |
| 5 to 17 Years | 0 (0.0%) | 0 (0.0%) |
| 18 to 34 Years | 0 (0.0%) | 0 (0.0%) |
| 35 to 64 Years | 13 (3.8%) | 22 (7.2%) |
| 65 to 74 Years | 0 (0.0%) | 0 (0.0%) |
| 75 Years and over | 0 (0.0%) | 0 (0.0%) |
Disability Class: Ambulatory Difficulty
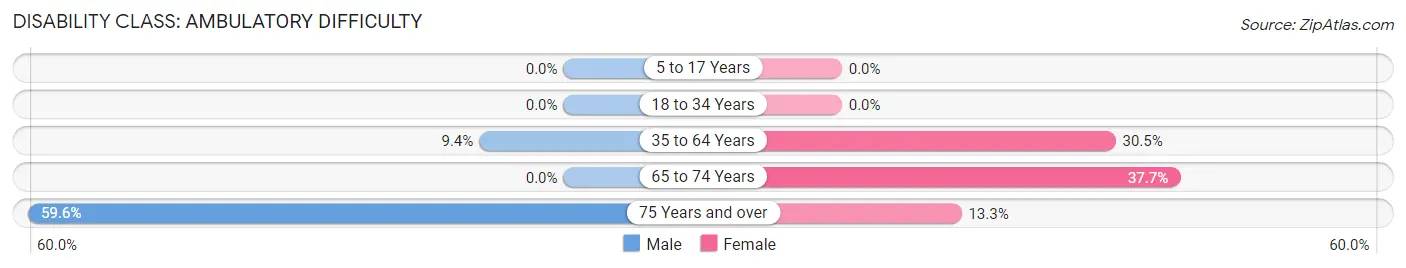
| Age Bracket | Male | Female |
| 5 to 17 Years | 0 (0.0%) | 0 (0.0%) |
| 18 to 34 Years | 0 (0.0%) | 0 (0.0%) |
| 35 to 64 Years | 32 (9.4%) | 93 (30.5%) |
| 65 to 74 Years | 0 (0.0%) | 58 (37.7%) |
| 75 Years and over | 62 (59.6%) | 16 (13.3%) |
Disability Class: Self-Care Difficulty
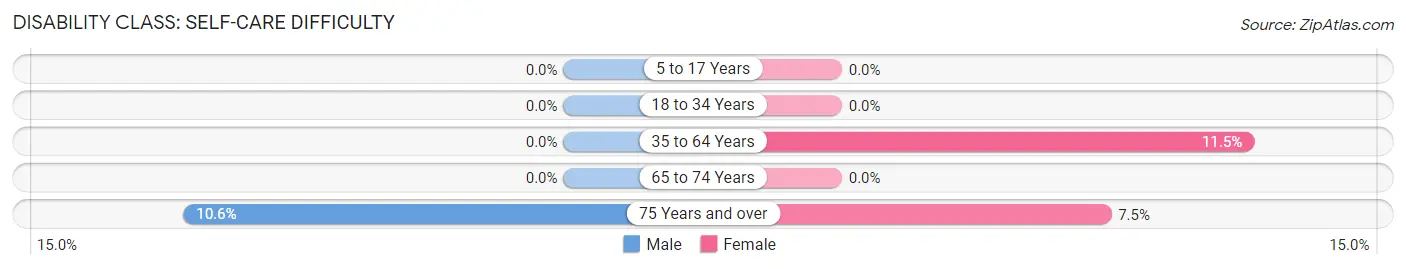
| Age Bracket | Male | Female |
| 5 to 17 Years | 0 (0.0%) | 0 (0.0%) |
| 18 to 34 Years | 0 (0.0%) | 0 (0.0%) |
| 35 to 64 Years | 0 (0.0%) | 35 (11.5%) |
| 65 to 74 Years | 0 (0.0%) | 0 (0.0%) |
| 75 Years and over | 11 (10.6%) | 9 (7.5%) |
Technology Access in Tappahannock
Computing Device Access in Tappahannock
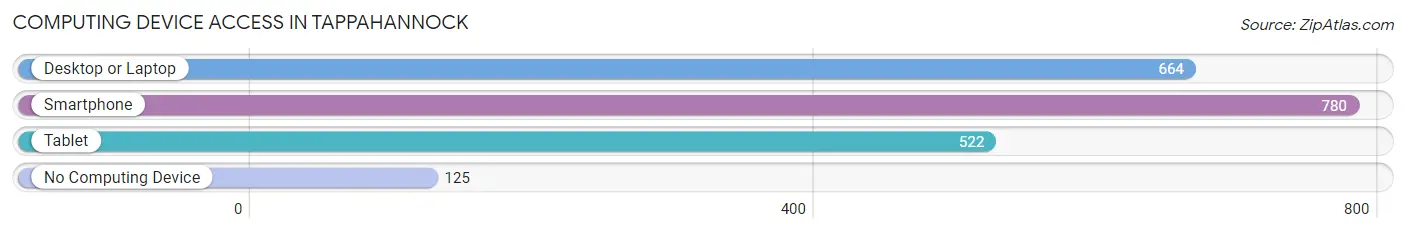
| Device Type | # Households | % Households |
| Desktop or Laptop | 664 | 66.6% |
| Smartphone | 780 | 78.2% |
| Tablet | 522 | 52.4% |
| No Computing Device | 125 | 12.5% |
| Total | 997 | 100.0% |
Internet Access in Tappahannock
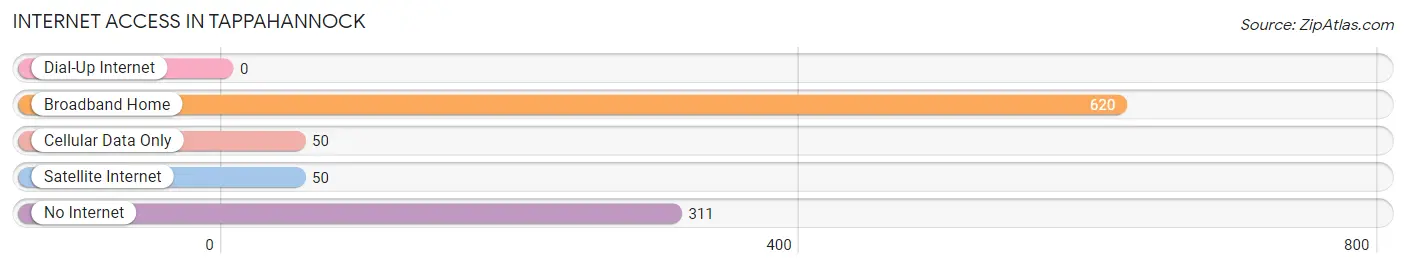
| Internet Type | # Households | % Households |
| Dial-Up Internet | 0 | 0.0% |
| Broadband Home | 620 | 62.2% |
| Cellular Data Only | 50 | 5.0% |
| Satellite Internet | 50 | 5.0% |
| No Internet | 311 | 31.2% |
| Total | 997 | 100.0% |
Tappahannock Summary
Tappahannock, Virginia is a small town located in Essex County, Virginia, on the Rappahannock River. It is the county seat of Essex County and is located about 70 miles east of Richmond. The population of Tappahannock was 2,375 as of the 2010 census.
History
Tappahannock was founded in 1608 by Captain John Smith and was originally known as Tappahannock Towne. The town was named after the Native American tribe of the same name, who were the original inhabitants of the area. The town was incorporated in 1761 and was the county seat of Essex County.
During the American Revolution, Tappahannock was a major port for the British Navy. The town was also the site of a major battle between the British and American forces in 1781. The British were defeated and the town was burned to the ground.
In the 19th century, Tappahannock became a major port for the Chesapeake Bay oyster industry. The town was also a major center for shipbuilding and the production of naval stores.
Geography
Tappahannock is located in the northern part of Essex County, Virginia, on the Rappahannock River. The town is situated on a peninsula between the Rappahannock and Potomac Rivers. The town is bordered by the towns of Tappahannock, White Stone, and Weems.
The town has a total area of 1.3 square miles, all of which is land. The town is located at an elevation of 16 feet above sea level.
Economy
Tappahannock’s economy is largely based on tourism and the service industry. The town is home to several restaurants, hotels, and other tourist attractions. The town is also home to several marinas and boatyards.
The town is also home to several manufacturing companies, including a paper mill, a furniture factory, and a boatbuilding company.
Demographics
As of the 2010 census, the population of Tappahannock was 2,375. The racial makeup of the town was 79.3% White, 17.2% African American, 0.7% Native American, 0.3% Asian, 0.1% Pacific Islander, 0.7% from other races, and 1.9% from two or more races. Hispanic or Latino of any race were 2.2% of the population.
The median income for a household in Tappahannock was $37,917, and the median income for a family was $45,000. The per capita income for the town was $20,945. About 11.2% of families and 14.2% of the population were below the poverty line, including 18.2% of those under age 18 and 8.3% of those age 65 or over.
Common Questions
What is Per Capita Income in Tappahannock?
Per Capita income in Tappahannock is $27,503.
What is the Median Family Income in Tappahannock?
Median Family Income in Tappahannock is $46,225.
What is the Median Household income in Tappahannock?
Median Household Income in Tappahannock is $40,703.
What is Income or Wage Gap in Tappahannock?
Income or Wage Gap in Tappahannock is 48.4%.
Women in Tappahannock earn 51.6 cents for every dollar earned by a man.
What is Family Income Deficit in Tappahannock?
Family Income Deficit in Tappahannock is $8,893.
Families that are below poverty line in Tappahannock earn $8,893 less on average than the poverty threshold level.
What is Inequality or Gini Index in Tappahannock?
Inequality or Gini Index in Tappahannock is 0.51.
What is the Total Population of Tappahannock?
Total Population of Tappahannock is 1,919.
What is the Total Male Population of Tappahannock?
Total Male Population of Tappahannock is 878.
What is the Total Female Population of Tappahannock?
Total Female Population of Tappahannock is 1,041.
What is the Ratio of Males per 100 Females in Tappahannock?
There are 84.34 Males per 100 Females in Tappahannock.
What is the Ratio of Females per 100 Males in Tappahannock?
There are 118.56 Females per 100 Males in Tappahannock.
What is the Median Population Age in Tappahannock?
Median Population Age in Tappahannock is 48.2 Years.
What is the Average Family Size in Tappahannock
Average Family Size in Tappahannock is 2.4 People.
What is the Average Household Size in Tappahannock
Average Household Size in Tappahannock is 1.8 People.
How Large is the Labor Force in Tappahannock?
There are 776 People in the Labor Forcein in Tappahannock.
What is the Percentage of People in the Labor Force in Tappahannock?
51.3% of People are in the Labor Force in Tappahannock.
What is the Unemployment Rate in Tappahannock?
Unemployment Rate in Tappahannock is 5.7%.