Chilhowie, VA Map & Demographics
Chilhowie Map
Chilhowie Overview
$28,761
PER CAPITA INCOME
$76,452
AVG FAMILY INCOME
$60,313
AVG HOUSEHOLD INCOME
11.5%
WAGE / INCOME GAP [ % ]
88.5¢/ $1
WAGE / INCOME GAP [ $ ]
0.40
INEQUALITY / GINI INDEX
2,371
TOTAL POPULATION
1,053
MALE POPULATION
1,318
FEMALE POPULATION
79.89
MALES / 100 FEMALES
125.17
FEMALES / 100 MALES
47.1
MEDIAN AGE
3.0
AVG FAMILY SIZE
2.5
AVG HOUSEHOLD SIZE
1,120
LABOR FORCE [ PEOPLE ]
56.2%
PERCENT IN LABOR FORCE
2.7%
UNEMPLOYMENT RATE
Chilhowie Zip Codes
Chilhowie Area Codes
Income in Chilhowie
Income Overview in Chilhowie
Per Capita Income in Chilhowie is $28,761, while median incomes of families and households are $76,452 and $60,313 respectively.
| Characteristic | Number | Measure |
| Per Capita Income | 2,371 | $28,761 |
| Median Family Income | 586 | $76,452 |
| Mean Family Income | 586 | $84,923 |
| Median Household Income | 855 | $60,313 |
| Mean Household Income | 855 | $71,650 |
| Income Deficit | 586 | $0 |
| Wage / Income Gap (%) | 2,371 | 11.48% |
| Wage / Income Gap ($) | 2,371 | 88.52¢ per $1 |
| Gini / Inequality Index | 2,371 | 0.40 |
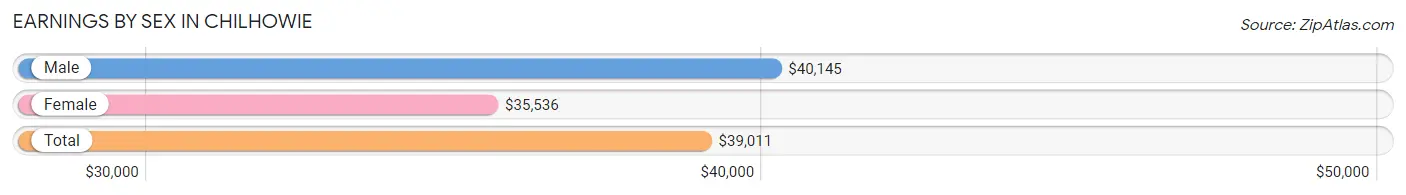
Earnings by Sex in Chilhowie
Average Earnings in Chilhowie are $39,011, $40,145 for men and $35,536 for women, a difference of 11.5%.
| Sex | Number | Average Earnings |
| Male | 548 (49.2%) | $40,145 |
| Female | 565 (50.8%) | $35,536 |
| Total | 1,113 (100.0%) | $39,011 |
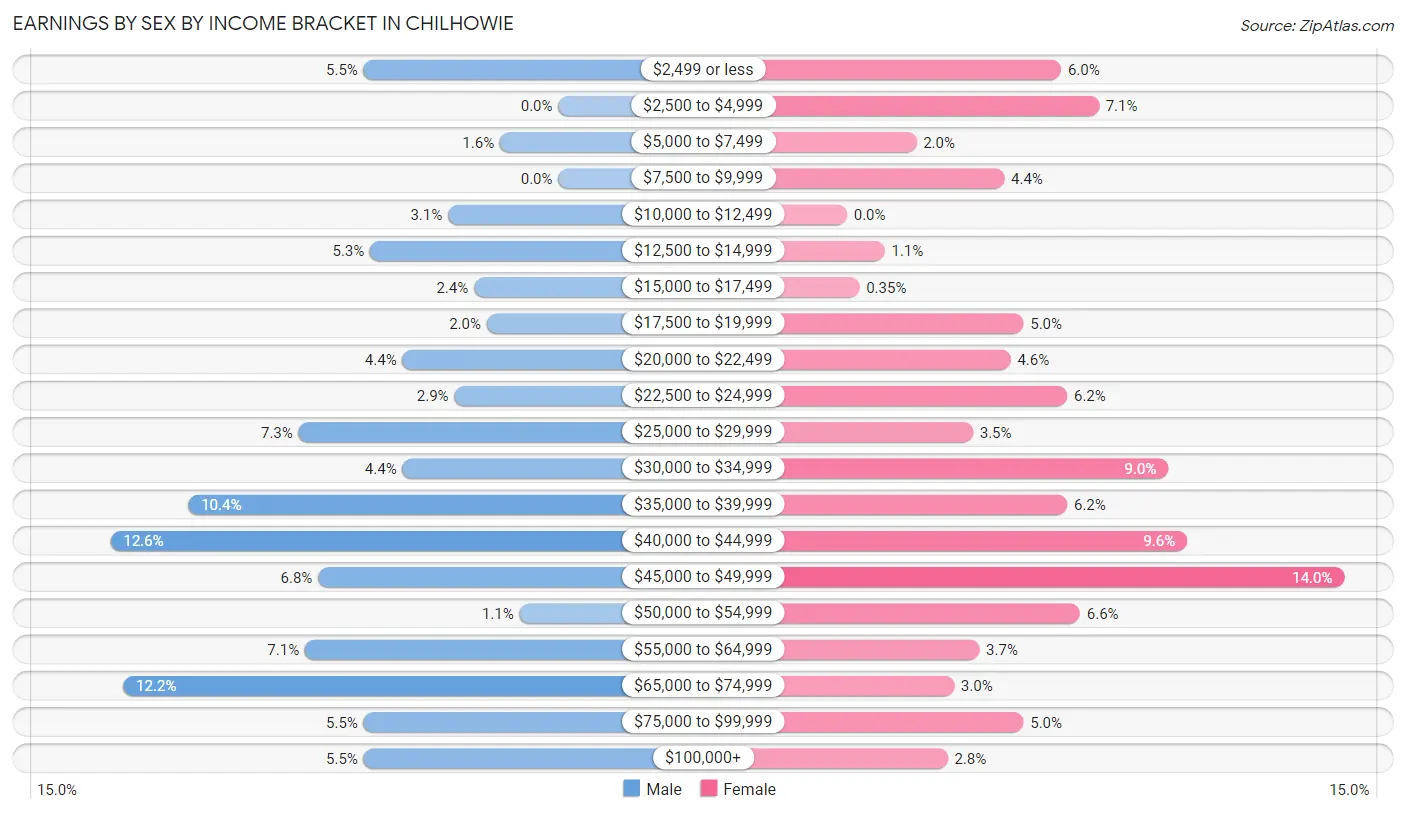
Earnings by Sex by Income Bracket in Chilhowie
The most common earnings brackets in Chilhowie are $40,000 to $44,999 for men (69 | 12.6%) and $45,000 to $49,999 for women (79 | 14.0%).
| Income | Male | Female |
| $2,499 or less | 30 (5.5%) | 34 (6.0%) |
| $2,500 to $4,999 | 0 (0.0%) | 40 (7.1%) |
| $5,000 to $7,499 | 9 (1.6%) | 11 (1.9%) |
| $7,500 to $9,999 | 0 (0.0%) | 25 (4.4%) |
| $10,000 to $12,499 | 17 (3.1%) | 0 (0.0%) |
| $12,500 to $14,999 | 29 (5.3%) | 6 (1.1%) |
| $15,000 to $17,499 | 13 (2.4%) | 2 (0.4%) |
| $17,500 to $19,999 | 11 (2.0%) | 28 (5.0%) |
| $20,000 to $22,499 | 24 (4.4%) | 26 (4.6%) |
| $22,500 to $24,999 | 16 (2.9%) | 35 (6.2%) |
| $25,000 to $29,999 | 40 (7.3%) | 20 (3.5%) |
| $30,000 to $34,999 | 24 (4.4%) | 51 (9.0%) |
| $35,000 to $39,999 | 57 (10.4%) | 35 (6.2%) |
| $40,000 to $44,999 | 69 (12.6%) | 54 (9.6%) |
| $45,000 to $49,999 | 37 (6.8%) | 79 (14.0%) |
| $50,000 to $54,999 | 6 (1.1%) | 37 (6.6%) |
| $55,000 to $64,999 | 39 (7.1%) | 21 (3.7%) |
| $65,000 to $74,999 | 67 (12.2%) | 17 (3.0%) |
| $75,000 to $99,999 | 30 (5.5%) | 28 (5.0%) |
| $100,000+ | 30 (5.5%) | 16 (2.8%) |
| Total | 548 (100.0%) | 565 (100.0%) |
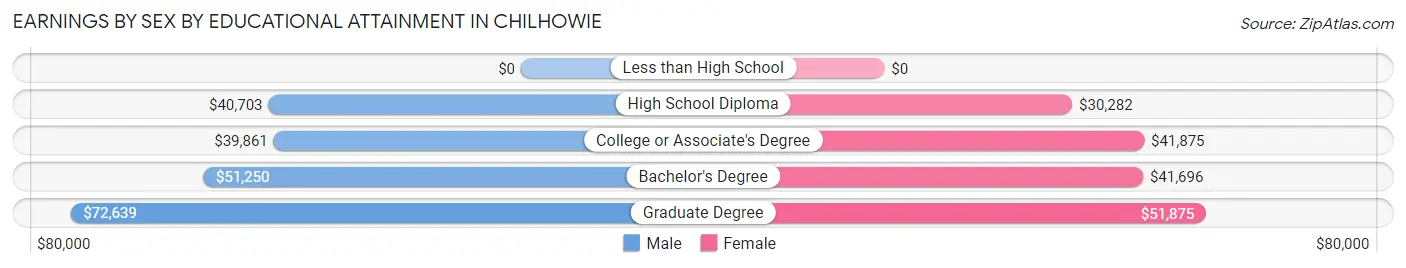
Earnings by Sex by Educational Attainment in Chilhowie
Average earnings in Chilhowie are $41,417 for men and $39,732 for women, a difference of 4.1%. Men with an educational attainment of graduate degree enjoy the highest average annual earnings of $72,639, while those with college or associate's degree education earn the least with $39,861. Women with an educational attainment of graduate degree earn the most with the average annual earnings of $51,875, while those with high school diploma education have the smallest earnings of $30,282.
| Educational Attainment | Male Income | Female Income |
| Less than High School | - | - |
| High School Diploma | $40,703 | $30,282 |
| College or Associate's Degree | $39,861 | $41,875 |
| Bachelor's Degree | $51,250 | $41,696 |
| Graduate Degree | $72,639 | $51,875 |
| Total | $41,417 | $39,732 |
Family Income in Chilhowie
Family Income Brackets in Chilhowie
According to the Chilhowie family income data, there are 125 families falling into the $75,000 to $99,999 income range, which is the most common income bracket and makes up 21.3% of all families. Conversely, the $10,000 to $14,999 income bracket is the least frequent group with only 7 families (1.2%) belonging to this category.
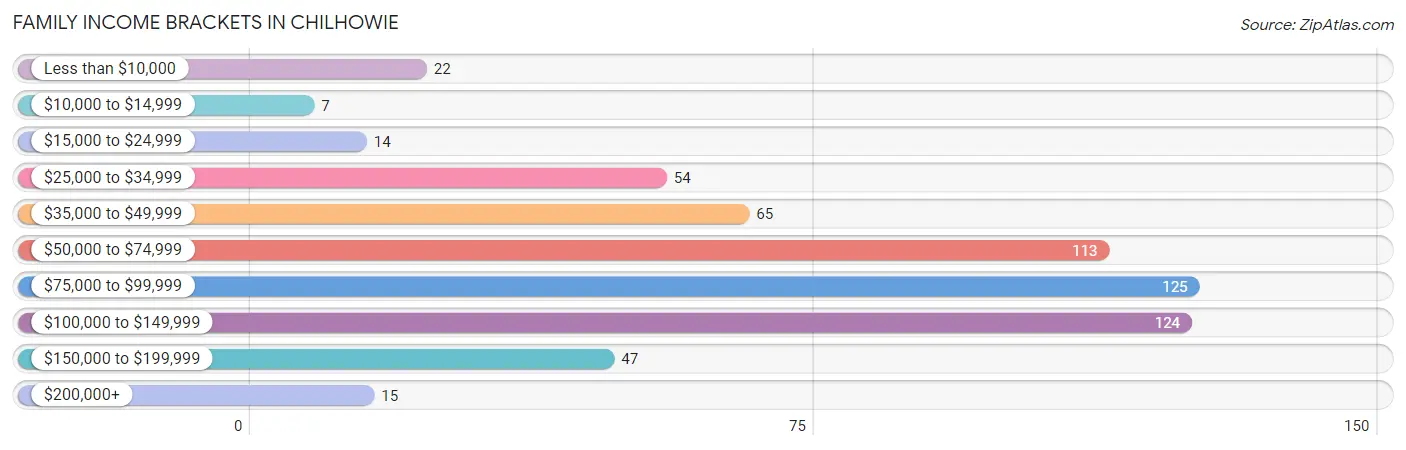
| Income Bracket | # Families | % Families |
| Less than $10,000 | 22 | 3.8% |
| $10,000 to $14,999 | 7 | 1.2% |
| $15,000 to $24,999 | 14 | 2.4% |
| $25,000 to $34,999 | 54 | 9.2% |
| $35,000 to $49,999 | 65 | 11.1% |
| $50,000 to $74,999 | 113 | 19.3% |
| $75,000 to $99,999 | 125 | 21.3% |
| $100,000 to $149,999 | 124 | 21.2% |
| $150,000 to $199,999 | 47 | 8.0% |
| $200,000+ | 15 | 2.6% |
Family Income by Famaliy Size in Chilhowie
5-person families (45 | 7.7%) account for the highest median family income in Chilhowie with $94,830 per family, while 2-person families (294 | 50.2%) have the highest median income of $36,875 per family member.
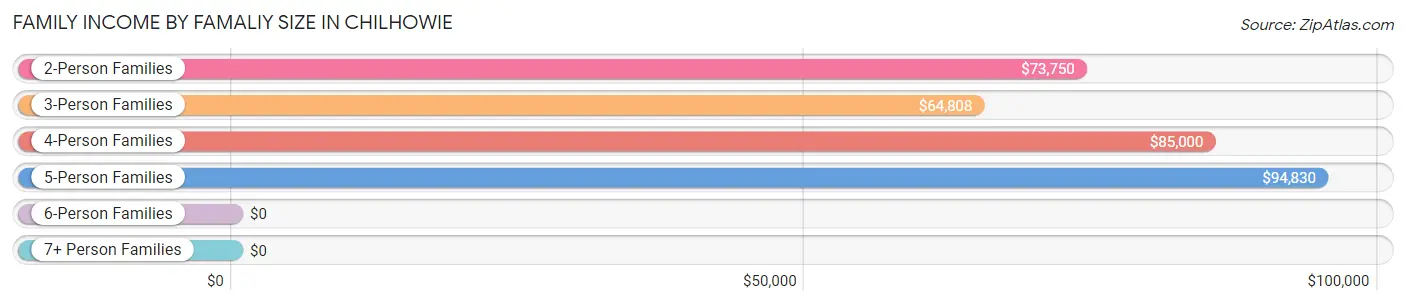
| Income Bracket | # Families | Median Income |
| 2-Person Families | 294 (50.2%) | $73,750 |
| 3-Person Families | 138 (23.5%) | $64,808 |
| 4-Person Families | 94 (16.0%) | $85,000 |
| 5-Person Families | 45 (7.7%) | $94,830 |
| 6-Person Families | 15 (2.6%) | $0 |
| 7+ Person Families | 0 (0.0%) | $0 |
| Total | 586 (100.0%) | $76,452 |
Family Income by Number of Earners in Chilhowie
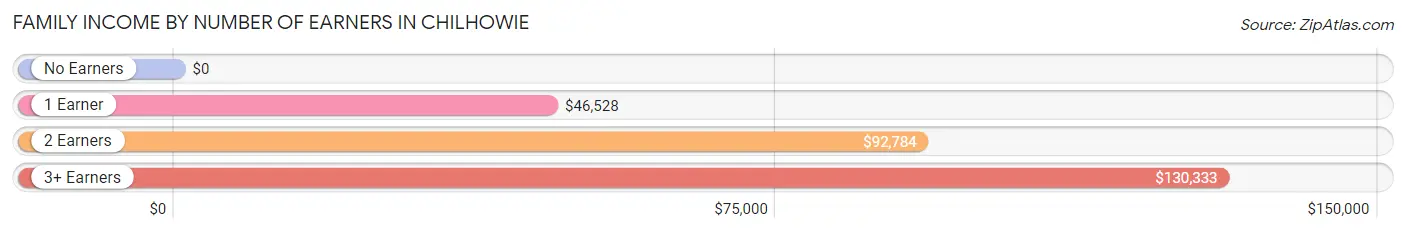
| Number of Earners | # Families | Median Income |
| No Earners | 89 (15.2%) | $0 |
| 1 Earner | 210 (35.8%) | $46,528 |
| 2 Earners | 199 (34.0%) | $92,784 |
| 3+ Earners | 88 (15.0%) | $130,333 |
| Total | 586 (100.0%) | $76,452 |
Household Income in Chilhowie
Household Income Brackets in Chilhowie
With 163 households falling in the category, the $100,000 to $149,999 income range is the most frequent in Chilhowie, accounting for 19.1% of all households. In contrast, only 15 households (1.8%) fall into the $200,000+ income bracket, making it the least populous group.
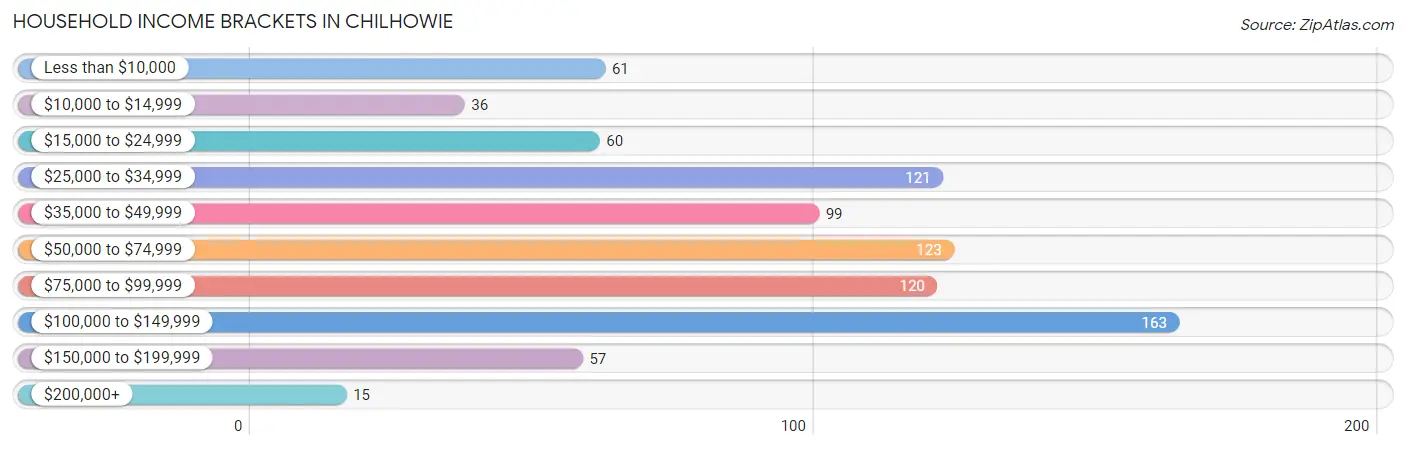
| Income Bracket | # Households | % Households |
| Less than $10,000 | 61 | 7.1% |
| $10,000 to $14,999 | 36 | 4.2% |
| $15,000 to $24,999 | 60 | 7.0% |
| $25,000 to $34,999 | 121 | 14.2% |
| $35,000 to $49,999 | 99 | 11.6% |
| $50,000 to $74,999 | 123 | 14.4% |
| $75,000 to $99,999 | 120 | 14.0% |
| $100,000 to $149,999 | 163 | 19.1% |
| $150,000 to $199,999 | 57 | 6.7% |
| $200,000+ | 15 | 1.8% |
Household Income by Householder Age in Chilhowie
The median household income in Chilhowie is $60,313, with the highest median household income of $105,227 found in the 25 to 44 years age bracket for the primary householder. A total of 174 households (20.3%) fall into this category. Meanwhile, the 15 to 24 years age bracket for the primary householder has the lowest median household income of $0, with 31 households (3.6%) in this group.
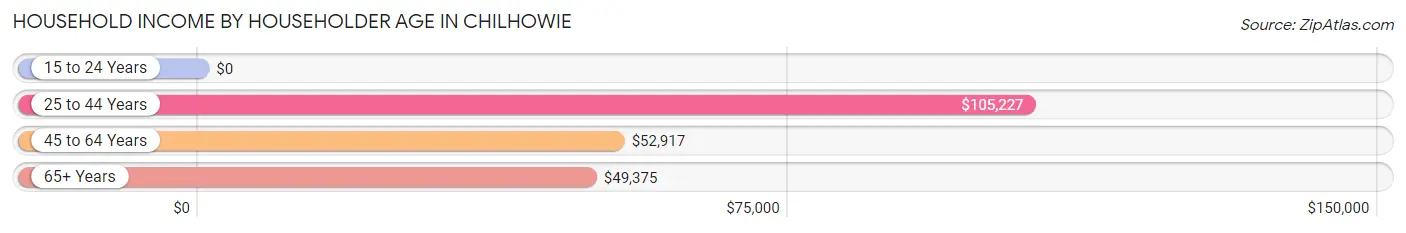
| Income Bracket | # Households | Median Income |
| 15 to 24 Years | 31 (3.6%) | $0 |
| 25 to 44 Years | 174 (20.3%) | $105,227 |
| 45 to 64 Years | 398 (46.6%) | $52,917 |
| 65+ Years | 252 (29.5%) | $49,375 |
| Total | 855 (100.0%) | $60,313 |
Poverty in Chilhowie
Income Below Poverty by Sex and Age in Chilhowie
With 13.8% poverty level for males and 8.8% for females among the residents of Chilhowie, 75 year old and over males and under 5 year old females are the most vulnerable to poverty, with 18 males (41.9%) and 16 females (44.4%) in their respective age groups living below the poverty level.
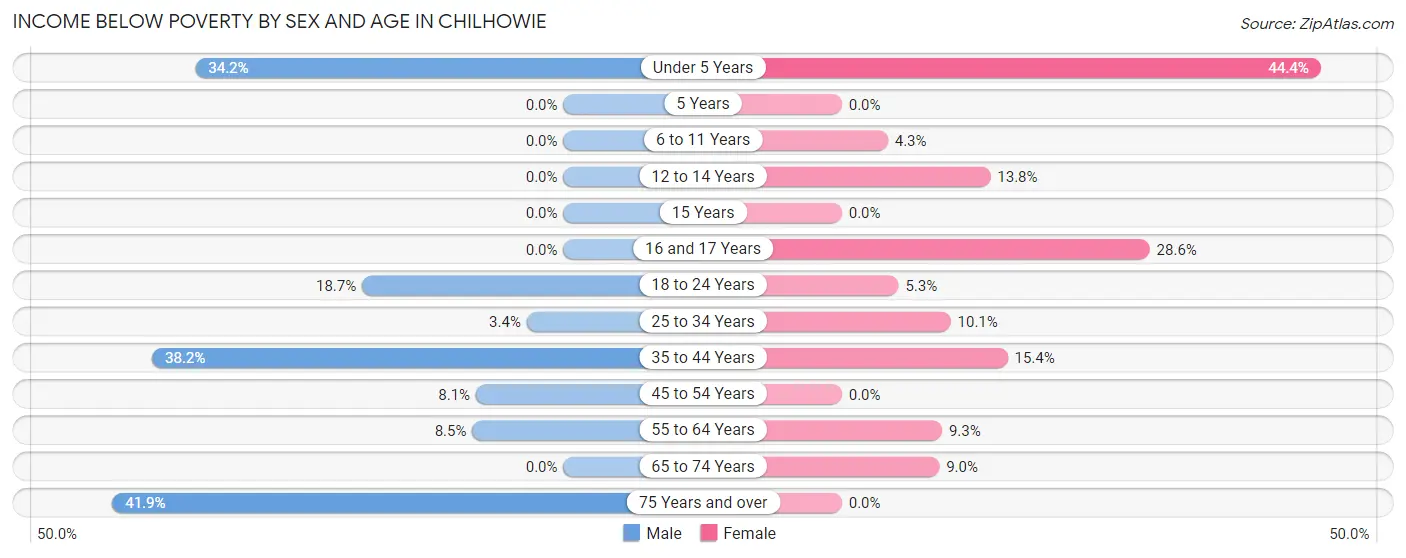
| Age Bracket | Male | Female |
| Under 5 Years | 14 (34.2%) | 16 (44.4%) |
| 5 Years | 0 (0.0%) | 0 (0.0%) |
| 6 to 11 Years | 0 (0.0%) | 5 (4.3%) |
| 12 to 14 Years | 0 (0.0%) | 8 (13.8%) |
| 15 Years | 0 (0.0%) | 0 (0.0%) |
| 16 and 17 Years | 0 (0.0%) | 12 (28.6%) |
| 18 to 24 Years | 17 (18.7%) | 5 (5.3%) |
| 25 to 34 Years | 5 (3.4%) | 10 (10.1%) |
| 35 to 44 Years | 58 (38.2%) | 20 (15.4%) |
| 45 to 54 Years | 12 (8.1%) | 0 (0.0%) |
| 55 to 64 Years | 12 (8.5%) | 12 (9.3%) |
| 65 to 74 Years | 0 (0.0%) | 15 (9.0%) |
| 75 Years and over | 18 (41.9%) | 0 (0.0%) |
| Total | 136 (13.8%) | 103 (8.8%) |
Income Above Poverty by Sex and Age in Chilhowie
According to the poverty statistics in Chilhowie, males aged 5 years and females aged 5 years are the age groups that are most secure financially, with 100.0% of males and 100.0% of females in these age groups living above the poverty line.
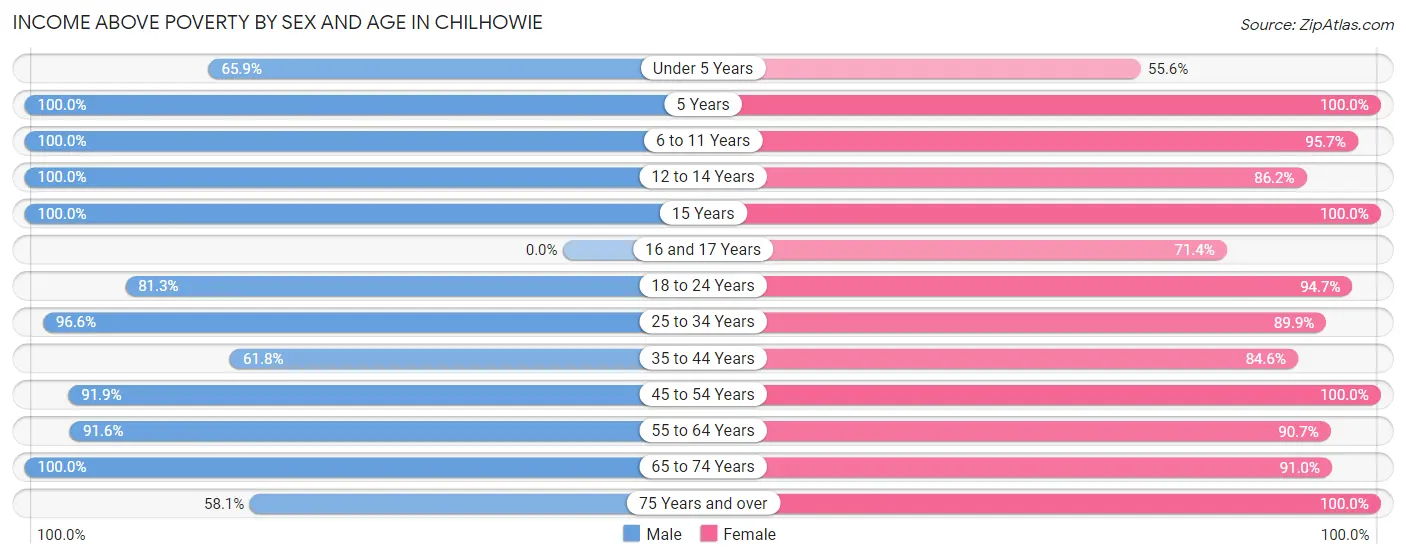
| Age Bracket | Male | Female |
| Under 5 Years | 27 (65.8%) | 20 (55.6%) |
| 5 Years | 18 (100.0%) | 4 (100.0%) |
| 6 to 11 Years | 25 (100.0%) | 112 (95.7%) |
| 12 to 14 Years | 53 (100.0%) | 50 (86.2%) |
| 15 Years | 5 (100.0%) | 19 (100.0%) |
| 16 and 17 Years | 0 (0.0%) | 30 (71.4%) |
| 18 to 24 Years | 74 (81.3%) | 90 (94.7%) |
| 25 to 34 Years | 142 (96.6%) | 89 (89.9%) |
| 35 to 44 Years | 94 (61.8%) | 110 (84.6%) |
| 45 to 54 Years | 136 (91.9%) | 210 (100.0%) |
| 55 to 64 Years | 130 (91.5%) | 117 (90.7%) |
| 65 to 74 Years | 123 (100.0%) | 151 (91.0%) |
| 75 Years and over | 25 (58.1%) | 60 (100.0%) |
| Total | 852 (86.2%) | 1,062 (91.2%) |
Income Below Poverty Among Married-Couple Families in Chilhowie
The poverty statistics for married-couple families in Chilhowie show that 2.6% or 10 of the total 386 families live below the poverty line. Families with 1 or 2 children have the highest poverty rate of 8.7%, comprising of 7 families. On the other hand, families with 3 or 4 children have the lowest poverty rate of 0.0%, which includes 0 families.
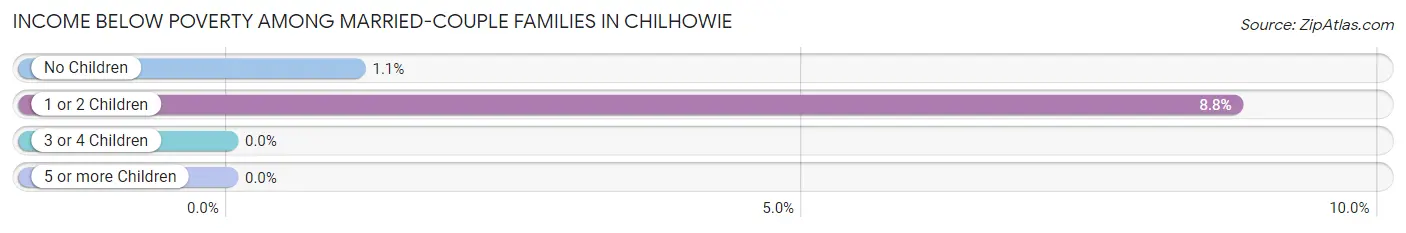
| Children | Above Poverty | Below Poverty |
| No Children | 267 (98.9%) | 3 (1.1%) |
| 1 or 2 Children | 73 (91.2%) | 7 (8.7%) |
| 3 or 4 Children | 36 (100.0%) | 0 (0.0%) |
| 5 or more Children | 0 (0.0%) | 0 (0.0%) |
| Total | 376 (97.4%) | 10 (2.6%) |
Income Below Poverty Among Single-Parent Households in Chilhowie
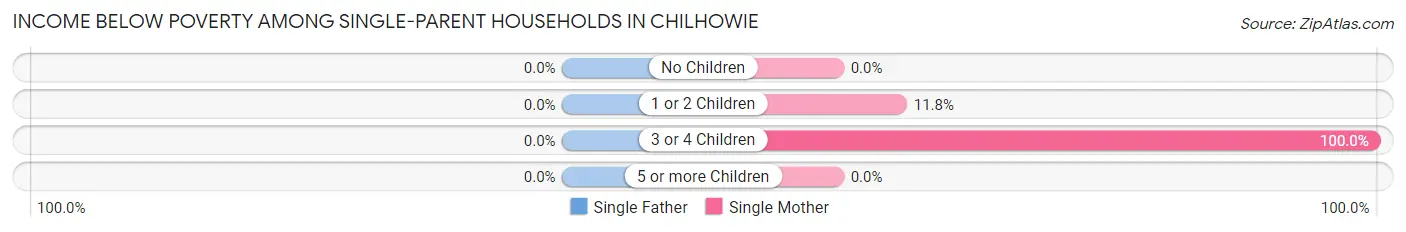
| Children | Single Father | Single Mother |
| No Children | 0 (0.0%) | 0 (0.0%) |
| 1 or 2 Children | 0 (0.0%) | 12 (11.8%) |
| 3 or 4 Children | 0 (0.0%) | 10 (100.0%) |
| 5 or more Children | 0 (0.0%) | 0 (0.0%) |
| Total | 0 (0.0%) | 22 (13.2%) |
Income Below Poverty Among Married-Couple vs Single-Parent Households in Chilhowie
The poverty data for Chilhowie shows that 10 of the married-couple family households (2.6%) and 22 of the single-parent households (11.0%) are living below the poverty level. Within the married-couple family households, those with 1 or 2 children have the highest poverty rate, with 7 households (8.7%) falling below the poverty line. Among the single-parent households, those with 3 or 4 children have the highest poverty rate, with 10 household (100.0%) living below poverty.
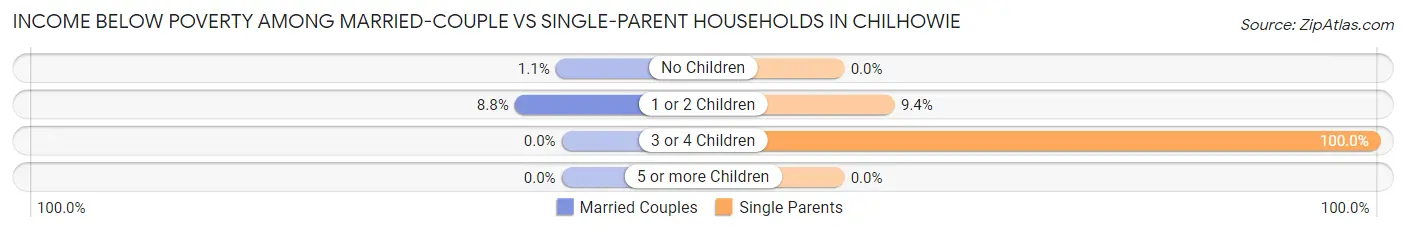
| Children | Married-Couple Families | Single-Parent Households |
| No Children | 3 (1.1%) | 0 (0.0%) |
| 1 or 2 Children | 7 (8.7%) | 12 (9.4%) |
| 3 or 4 Children | 0 (0.0%) | 10 (100.0%) |
| 5 or more Children | 0 (0.0%) | 0 (0.0%) |
| Total | 10 (2.6%) | 22 (11.0%) |
Race in Chilhowie
The most populous races in Chilhowie are White / Caucasian (2,123 | 89.5%), Two or more Races (110 | 4.6%), and Black / African American (100 | 4.2%).
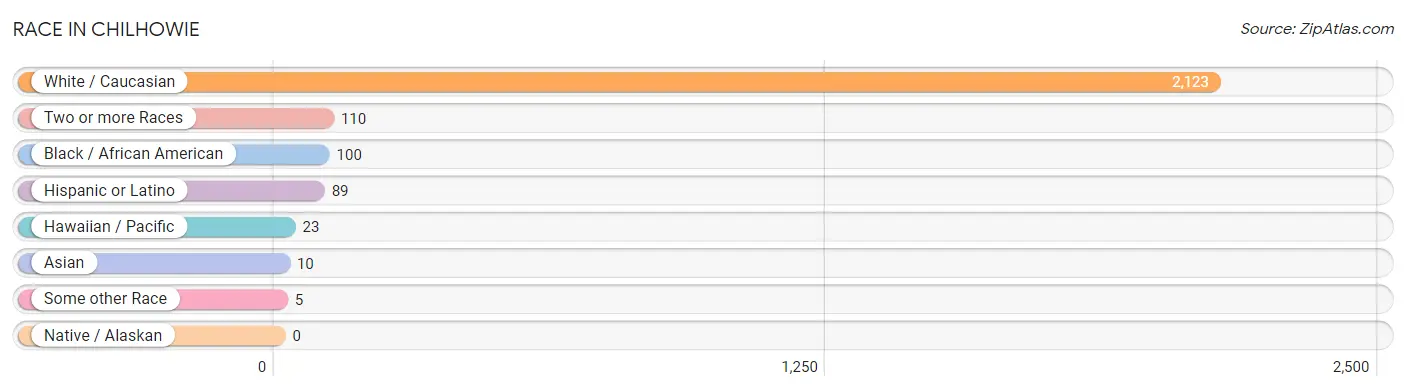
| Race | # Population | % Population |
| Asian | 10 | 0.4% |
| Black / African American | 100 | 4.2% |
| Hawaiian / Pacific | 23 | 1.0% |
| Hispanic or Latino | 89 | 3.7% |
| Native / Alaskan | 0 | 0.0% |
| White / Caucasian | 2,123 | 89.5% |
| Two or more Races | 110 | 4.6% |
| Some other Race | 5 | 0.2% |
| Total | 2,371 | 100.0% |
Ancestry in Chilhowie
The most populous ancestries reported in Chilhowie are American (592 | 25.0%), Irish (216 | 9.1%), English (206 | 8.7%), German (204 | 8.6%), and Scottish (102 | 4.3%), together accounting for 55.7% of all Chilhowie residents.
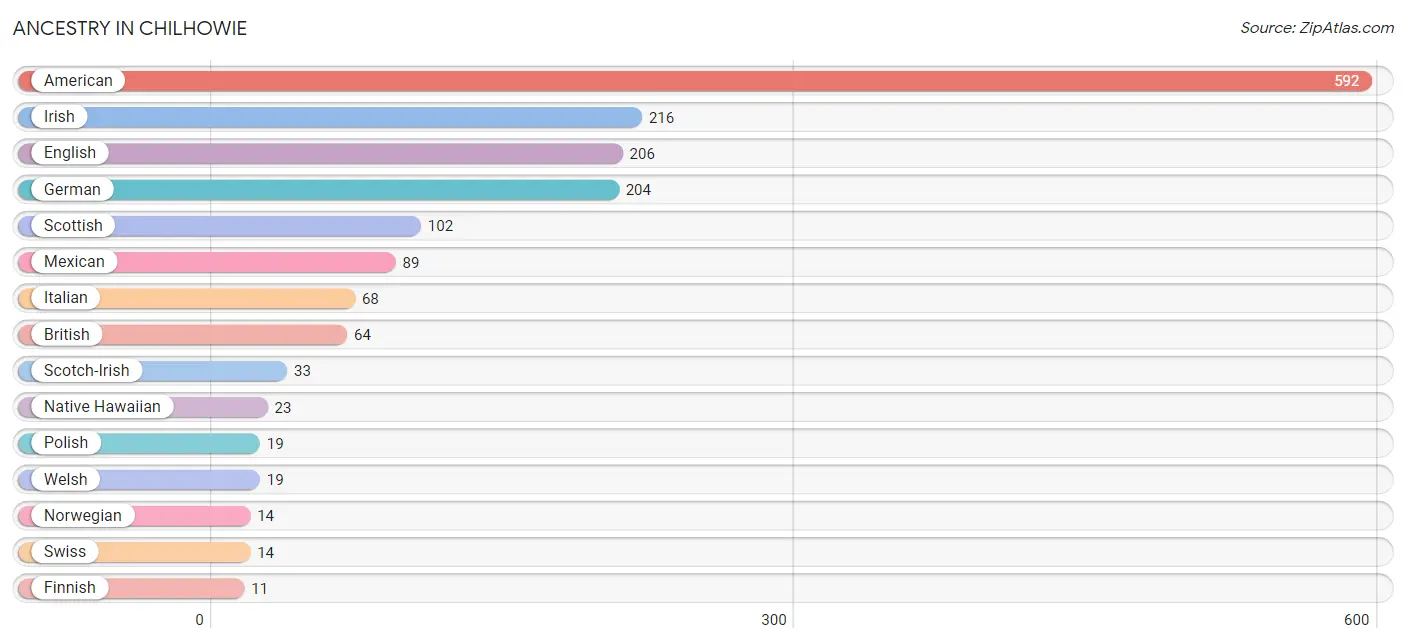
| Ancestry | # Population | % Population |
| American | 592 | 25.0% |
| British | 64 | 2.7% |
| Cherokee | 8 | 0.3% |
| Eastern European | 8 | 0.3% |
| English | 206 | 8.7% |
| European | 2 | 0.1% |
| Filipino | 10 | 0.4% |
| Finnish | 11 | 0.5% |
| French | 3 | 0.1% |
| German | 204 | 8.6% |
| Hungarian | 3 | 0.1% |
| Irish | 216 | 9.1% |
| Italian | 68 | 2.9% |
| Mexican | 89 | 3.7% |
| Native Hawaiian | 23 | 1.0% |
| Norwegian | 14 | 0.6% |
| Polish | 19 | 0.8% |
| Scotch-Irish | 33 | 1.4% |
| Scottish | 102 | 4.3% |
| Swiss | 14 | 0.6% |
| Welsh | 19 | 0.8% | View All 21 Rows |
Immigrants in Chilhowie
The most numerous immigrant groups reported in Chilhowie came from Central America (49 | 2.1%), Latin America (49 | 2.1%), Mexico (49 | 2.1%), Asia (17 | 0.7%), and China (17 | 0.7%), together accounting for 7.6% of all Chilhowie residents.
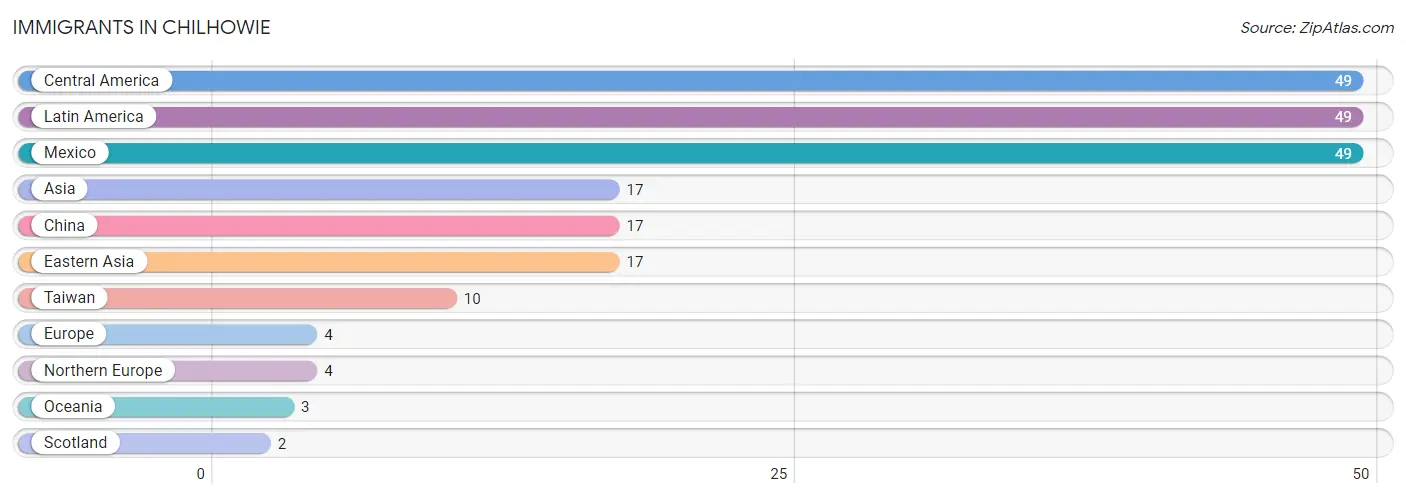
| Immigration Origin | # Population | % Population |
| Asia | 17 | 0.7% |
| Central America | 49 | 2.1% |
| China | 17 | 0.7% |
| Eastern Asia | 17 | 0.7% |
| Europe | 4 | 0.2% |
| Latin America | 49 | 2.1% |
| Mexico | 49 | 2.1% |
| Northern Europe | 4 | 0.2% |
| Oceania | 3 | 0.1% |
| Scotland | 2 | 0.1% |
| Taiwan | 10 | 0.4% | View All 11 Rows |
Sex and Age in Chilhowie
Sex and Age in Chilhowie
The most populous age groups in Chilhowie are 70 to 74 Years (99 | 9.4%) for men and 65 to 69 Years (165 | 12.5%) for women.
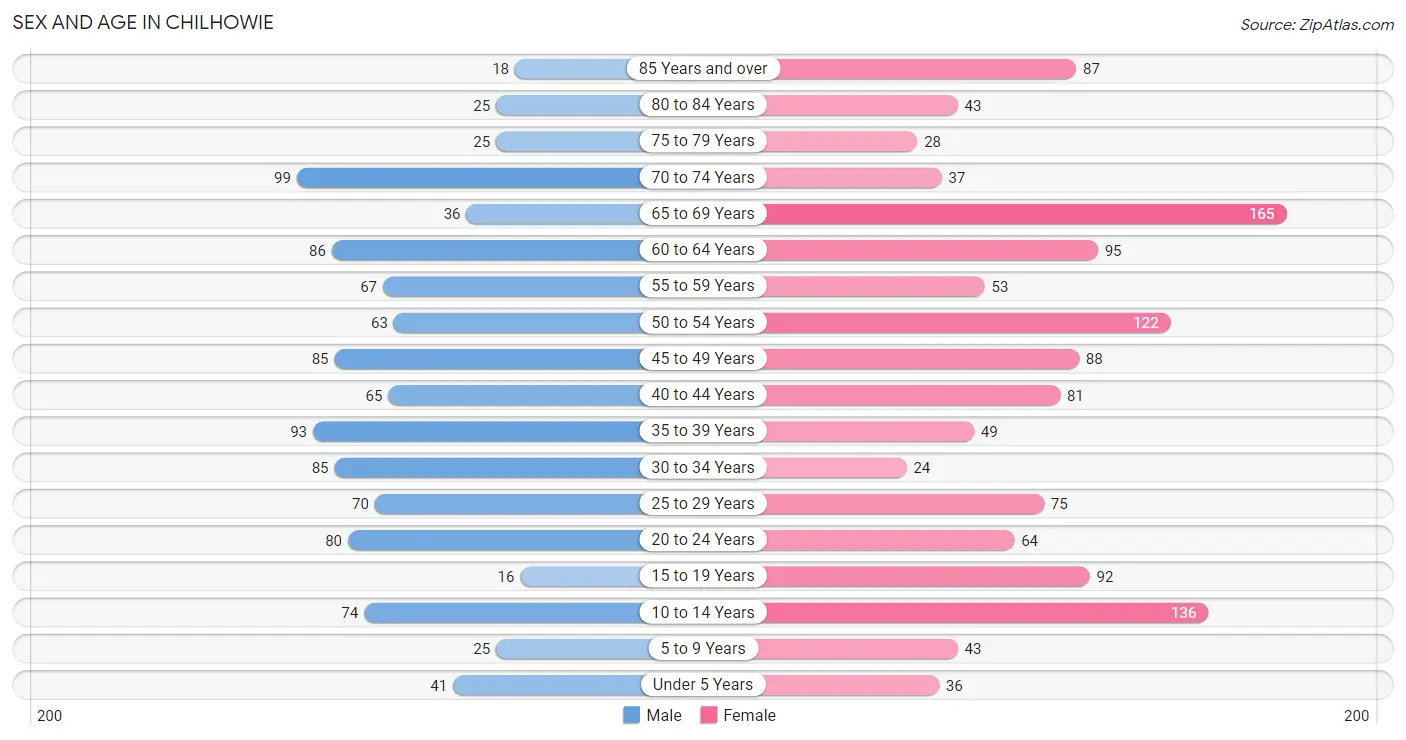
| Age Bracket | Male | Female |
| Under 5 Years | 41 (3.9%) | 36 (2.7%) |
| 5 to 9 Years | 25 (2.4%) | 43 (3.3%) |
| 10 to 14 Years | 74 (7.0%) | 136 (10.3%) |
| 15 to 19 Years | 16 (1.5%) | 92 (7.0%) |
| 20 to 24 Years | 80 (7.6%) | 64 (4.9%) |
| 25 to 29 Years | 70 (6.7%) | 75 (5.7%) |
| 30 to 34 Years | 85 (8.1%) | 24 (1.8%) |
| 35 to 39 Years | 93 (8.8%) | 49 (3.7%) |
| 40 to 44 Years | 65 (6.2%) | 81 (6.1%) |
| 45 to 49 Years | 85 (8.1%) | 88 (6.7%) |
| 50 to 54 Years | 63 (6.0%) | 122 (9.3%) |
| 55 to 59 Years | 67 (6.4%) | 53 (4.0%) |
| 60 to 64 Years | 86 (8.2%) | 95 (7.2%) |
| 65 to 69 Years | 36 (3.4%) | 165 (12.5%) |
| 70 to 74 Years | 99 (9.4%) | 37 (2.8%) |
| 75 to 79 Years | 25 (2.4%) | 28 (2.1%) |
| 80 to 84 Years | 25 (2.4%) | 43 (3.3%) |
| 85 Years and over | 18 (1.7%) | 87 (6.6%) |
| Total | 1,053 (100.0%) | 1,318 (100.0%) |
Families and Households in Chilhowie
Median Family Size in Chilhowie
The median family size in Chilhowie is 3.02 persons per family, with married-couple families (386 | 65.9%) accounting for the largest median family size of 3.21 persons per family. On the other hand, single male/father families (33 | 5.6%) represent the smallest median family size with 2.39 persons per family.
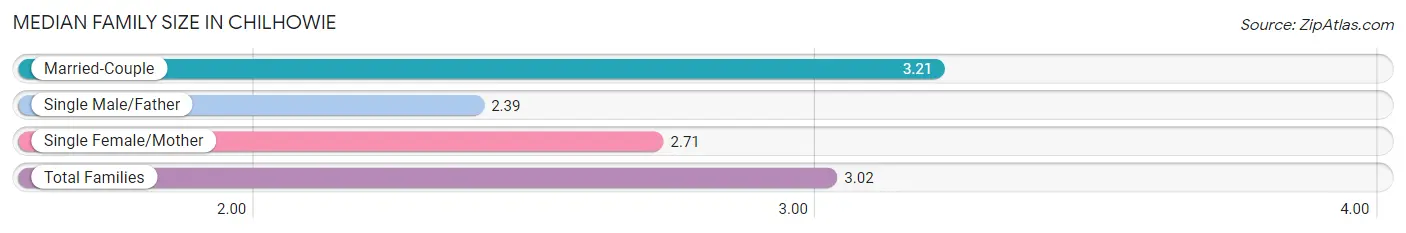
| Family Type | # Families | Family Size |
| Married-Couple | 386 (65.9%) | 3.21 |
| Single Male/Father | 33 (5.6%) | 2.39 |
| Single Female/Mother | 167 (28.5%) | 2.71 |
| Total Families | 586 (100.0%) | 3.02 |
Median Household Size in Chilhowie
The median household size in Chilhowie is 2.52 persons per household, with married-couple households (386 | 45.2%) accounting for the largest median household size of 3.29 persons per household. non-family households (269 | 31.5%) represent the smallest median household size with 1.20 persons per household.
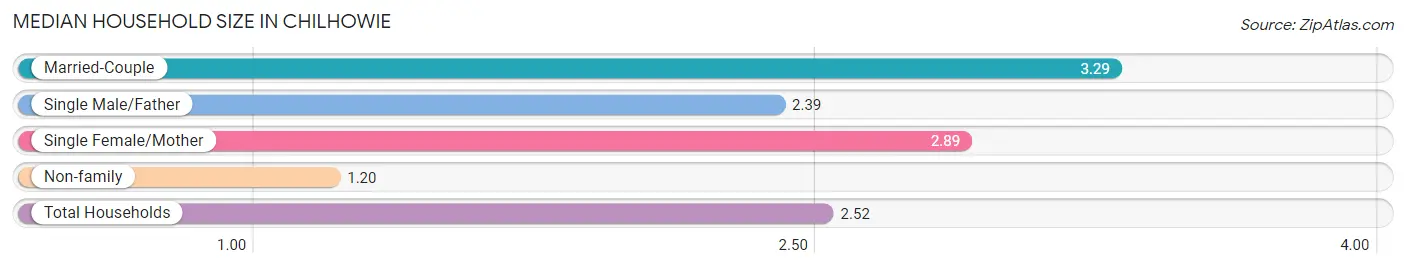
| Household Type | # Households | Household Size |
| Married-Couple | 386 (45.2%) | 3.29 |
| Single Male/Father | 33 (3.9%) | 2.39 |
| Single Female/Mother | 167 (19.5%) | 2.89 |
| Non-family | 269 (31.5%) | 1.20 |
| Total Households | 855 (100.0%) | 2.52 |
Household Size by Marriage Status in Chilhowie
Out of a total of 855 households in Chilhowie, 586 (68.5%) are family households, while 269 (31.5%) are nonfamily households. The most numerous type of family households are 2-person households, comprising 290, and the most common type of nonfamily households are 1-person households, comprising 248.
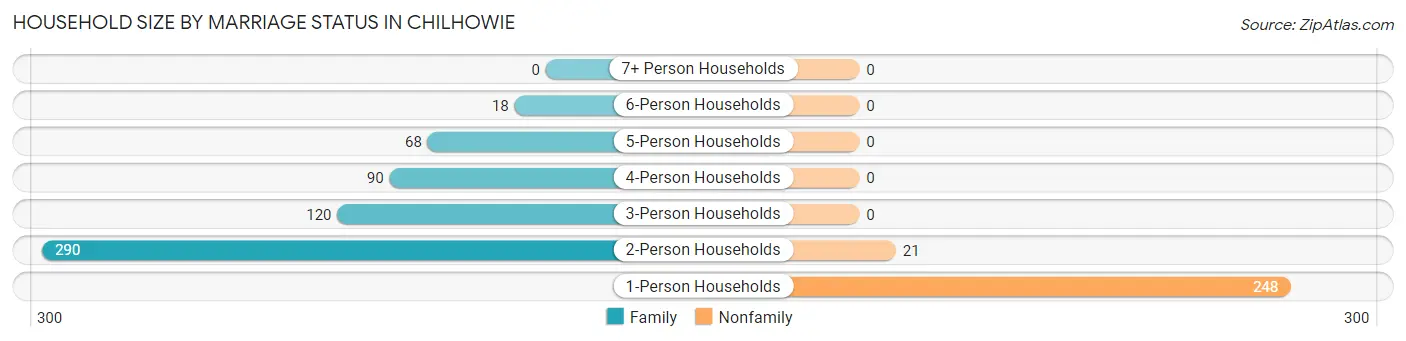
| Household Size | Family Households | Nonfamily Households |
| 1-Person Households | - | 248 (29.0%) |
| 2-Person Households | 290 (33.9%) | 21 (2.5%) |
| 3-Person Households | 120 (14.0%) | 0 (0.0%) |
| 4-Person Households | 90 (10.5%) | 0 (0.0%) |
| 5-Person Households | 68 (8.0%) | 0 (0.0%) |
| 6-Person Households | 18 (2.1%) | 0 (0.0%) |
| 7+ Person Households | 0 (0.0%) | 0 (0.0%) |
| Total | 586 (68.5%) | 269 (31.5%) |
Female Fertility in Chilhowie
Fertility by Age in Chilhowie
Average fertility rate in Chilhowie is 41.0 births per 1,000 women. Women in the age bracket of 20 to 34 years have the highest fertility rate with 129.0 births per 1,000 women. Women in the age bracket of 20 to 34 years acount for 100.0% of all women with births.
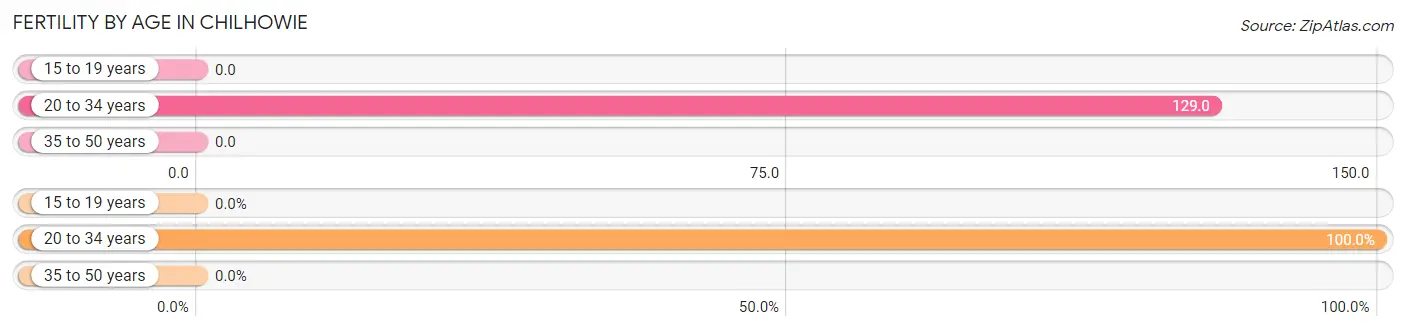
| Age Bracket | Women with Births | Births / 1,000 Women |
| 15 to 19 years | 0 (0.0%) | 0.0 |
| 20 to 34 years | 21 (100.0%) | 129.0 |
| 35 to 50 years | 0 (0.0%) | 0.0 |
| Total | 21 (100.0%) | 41.0 |
Fertility by Age by Marriage Status in Chilhowie
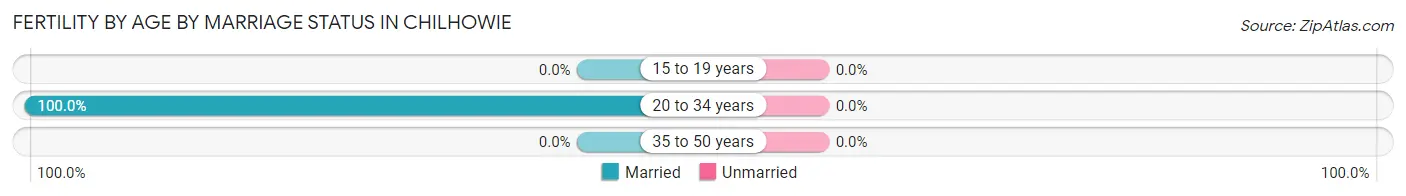
| Age Bracket | Married | Unmarried |
| 15 to 19 years | 0 (0.0%) | 0 (0.0%) |
| 20 to 34 years | 21 (100.0%) | 0 (0.0%) |
| 35 to 50 years | 0 (0.0%) | 0 (0.0%) |
| Total | 21 (100.0%) | 0 (0.0%) |
Fertility by Education in Chilhowie
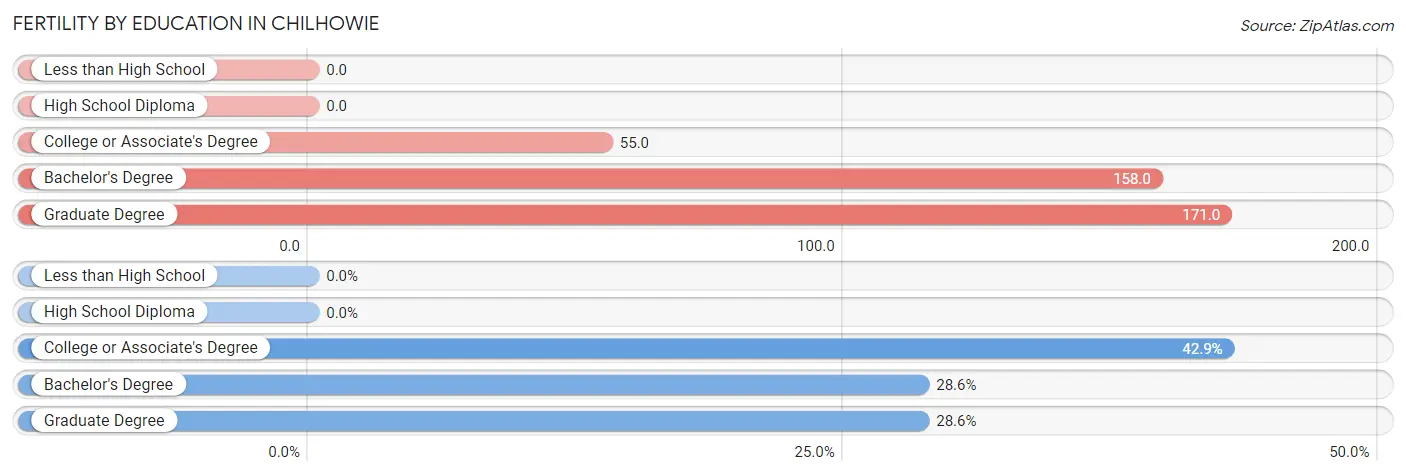
| Educational Attainment | Women with Births | Births / 1,000 Women |
| Less than High School | 0 (0.0%) | 0.0 |
| High School Diploma | 0 (0.0%) | 0.0 |
| College or Associate's Degree | 9 (42.9%) | 55.0 |
| Bachelor's Degree | 6 (28.6%) | 158.0 |
| Graduate Degree | 6 (28.6%) | 171.0 |
| Total | 21 (100.0%) | 41.0 |
Fertility by Education by Marriage Status in Chilhowie
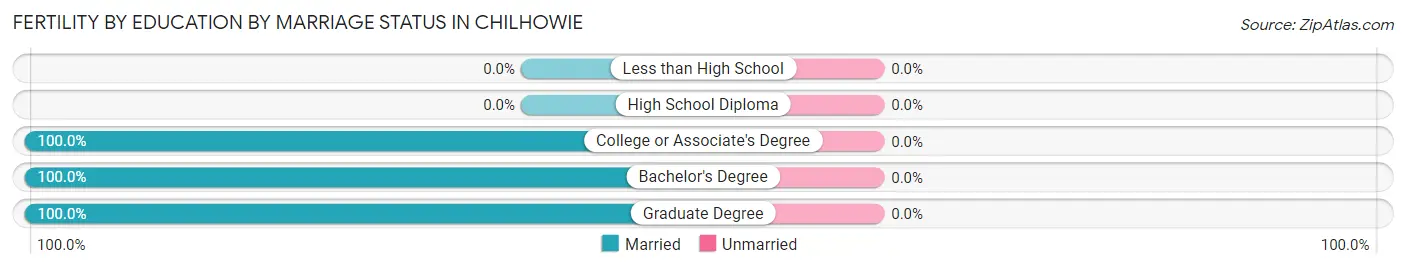
| Educational Attainment | Married | Unmarried |
| Less than High School | 0 (0.0%) | 0 (0.0%) |
| High School Diploma | 0 (0.0%) | 0 (0.0%) |
| College or Associate's Degree | 9 (100.0%) | 0 (0.0%) |
| Bachelor's Degree | 6 (100.0%) | 0 (0.0%) |
| Graduate Degree | 6 (100.0%) | 0 (0.0%) |
| Total | 21 (100.0%) | 0 (0.0%) |
Employment Characteristics in Chilhowie
Employment by Class of Employer in Chilhowie
Among the 1,068 employed individuals in Chilhowie, private company employees (784 | 73.4%), local government employees (125 | 11.7%), and not-for-profit organizations (68 | 6.4%) make up the most common classes of employment.
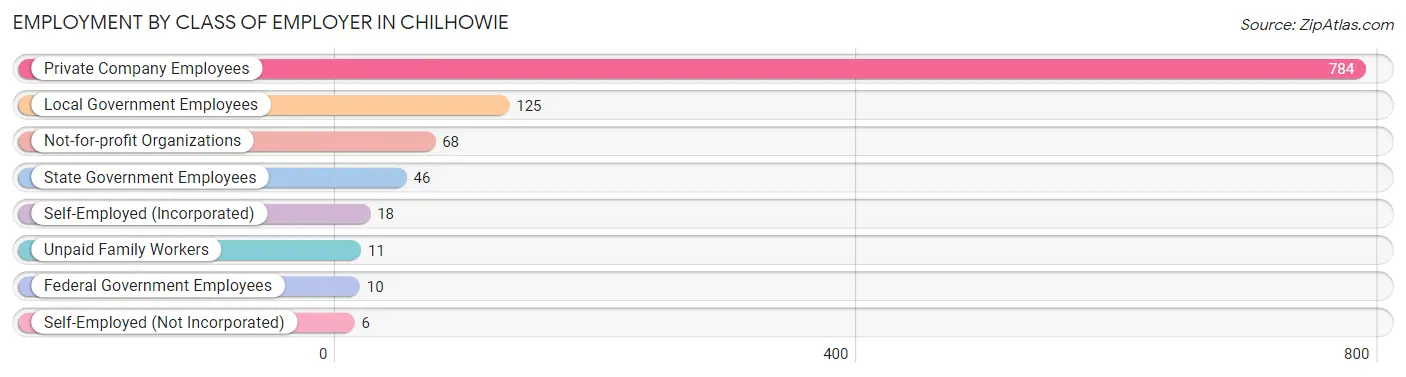
| Employer Class | # Employees | % Employees |
| Private Company Employees | 784 | 73.4% |
| Self-Employed (Incorporated) | 18 | 1.7% |
| Self-Employed (Not Incorporated) | 6 | 0.6% |
| Not-for-profit Organizations | 68 | 6.4% |
| Local Government Employees | 125 | 11.7% |
| State Government Employees | 46 | 4.3% |
| Federal Government Employees | 10 | 0.9% |
| Unpaid Family Workers | 11 | 1.0% |
| Total | 1,068 | 100.0% |
Employment Status by Age in Chilhowie
According to the labor force statistics for Chilhowie, out of the total population over 16 years of age (1,992), 56.2% or 1,120 individuals are in the labor force, with 2.7% or 30 of them unemployed. The age group with the highest labor force participation rate is 20 to 24 years, with 100.0% or 144 individuals in the labor force. Within the labor force, the 16 to 19 years age range has the highest percentage of unemployed individuals, with 12.3% or 8 of them being unemployed.
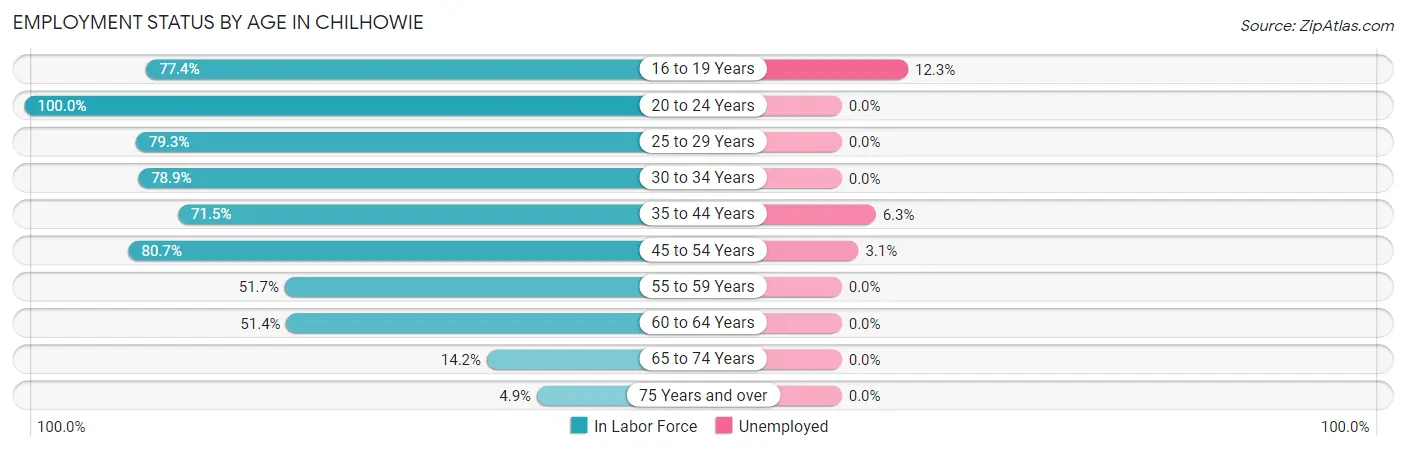
| Age Bracket | In Labor Force | Unemployed |
| 16 to 19 Years | 65 (77.4%) | 8 (12.3%) |
| 20 to 24 Years | 144 (100.0%) | 0 (0.0%) |
| 25 to 29 Years | 115 (79.3%) | 0 (0.0%) |
| 30 to 34 Years | 86 (78.9%) | 0 (0.0%) |
| 35 to 44 Years | 206 (71.5%) | 13 (6.3%) |
| 45 to 54 Years | 289 (80.7%) | 9 (3.1%) |
| 55 to 59 Years | 62 (51.7%) | 0 (0.0%) |
| 60 to 64 Years | 93 (51.4%) | 0 (0.0%) |
| 65 to 74 Years | 48 (14.2%) | 0 (0.0%) |
| 75 Years and over | 11 (4.9%) | 0 (0.0%) |
| Total | 1,120 (56.2%) | 30 (2.7%) |
Employment Status by Educational Attainment in Chilhowie
According to labor force statistics for Chilhowie, 70.9% of individuals (852) out of the total population between 25 and 64 years of age (1,201) are in the labor force, with 2.6% or 22 of them being unemployed. The group with the highest labor force participation rate are those with the educational attainment of bachelor's degree or higher, with 84.3% or 252 individuals in the labor force. Within the labor force, individuals with high school diploma education have the highest percentage of unemployment, with 6.3% or 22 of them being unemployed.
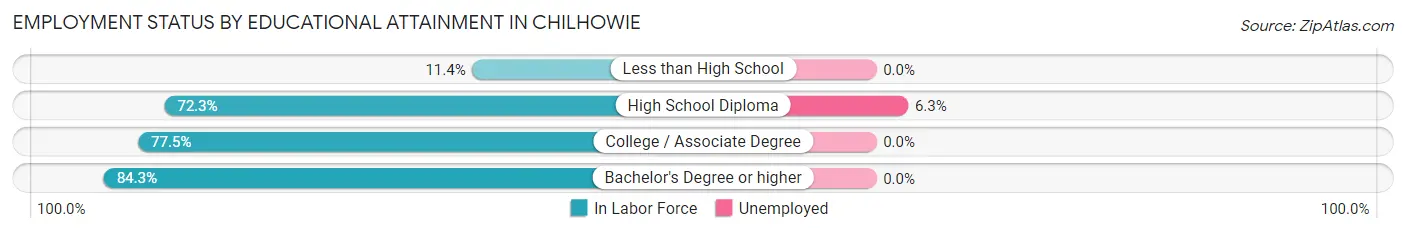
| Educational Attainment | In Labor Force | Unemployed |
| Less than High School | 13 (11.4%) | 0 (0.0%) |
| High School Diploma | 348 (72.3%) | 30 (6.3%) |
| College / Associate Degree | 238 (77.5%) | 0 (0.0%) |
| Bachelor's Degree or higher | 252 (84.3%) | 0 (0.0%) |
| Total | 852 (70.9%) | 31 (2.6%) |
Employment Occupations by Sex in Chilhowie
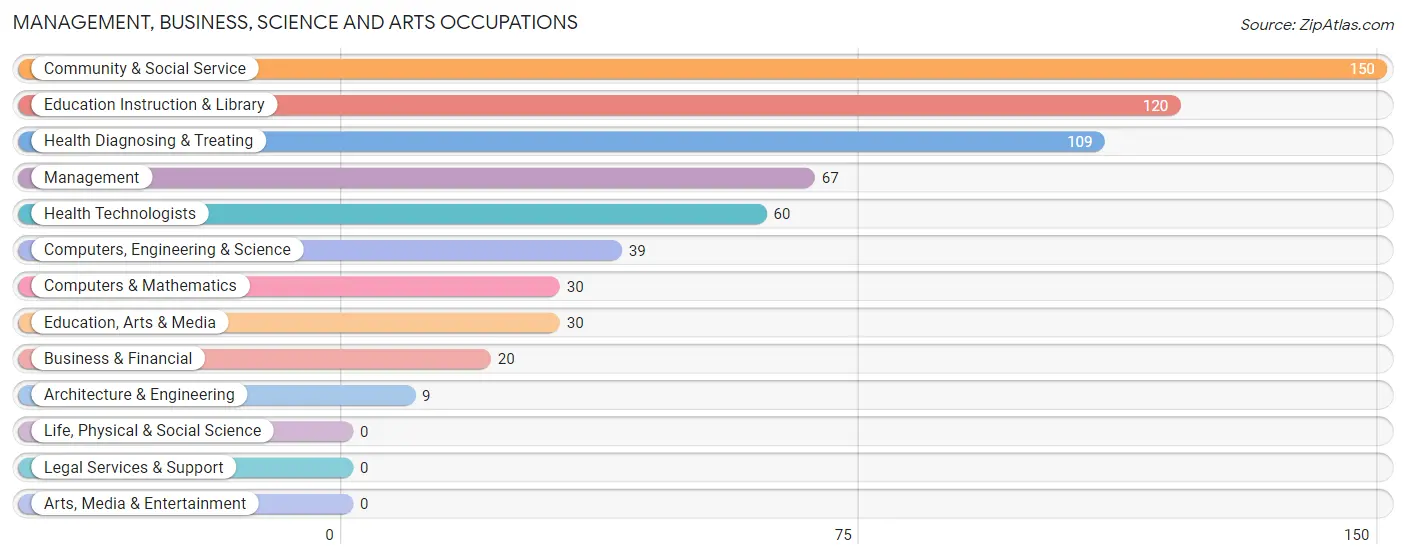
Management, Business, Science and Arts Occupations
The most common Management, Business, Science and Arts occupations in Chilhowie are Community & Social Service (150 | 13.8%), Education Instruction & Library (120 | 11.0%), Health Diagnosing & Treating (109 | 10.0%), Management (67 | 6.1%), and Health Technologists (60 | 5.5%).
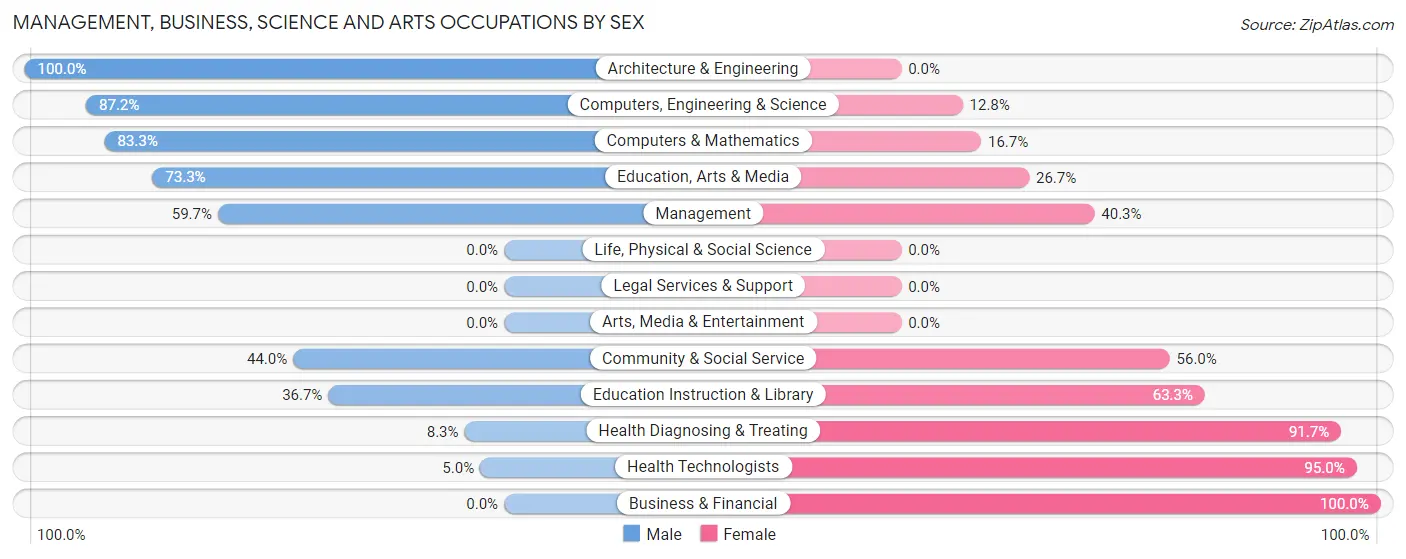
Management, Business, Science and Arts Occupations by Sex
Within the Management, Business, Science and Arts occupations in Chilhowie, the most male-oriented occupations are Architecture & Engineering (100.0%), Computers, Engineering & Science (87.2%), and Computers & Mathematics (83.3%), while the most female-oriented occupations are Business & Financial (100.0%), Health Technologists (95.0%), and Health Diagnosing & Treating (91.7%).
| Occupation | Male | Female |
| Management | 40 (59.7%) | 27 (40.3%) |
| Business & Financial | 0 (0.0%) | 20 (100.0%) |
| Computers, Engineering & Science | 34 (87.2%) | 5 (12.8%) |
| Computers & Mathematics | 25 (83.3%) | 5 (16.7%) |
| Architecture & Engineering | 9 (100.0%) | 0 (0.0%) |
| Life, Physical & Social Science | 0 (0.0%) | 0 (0.0%) |
| Community & Social Service | 66 (44.0%) | 84 (56.0%) |
| Education, Arts & Media | 22 (73.3%) | 8 (26.7%) |
| Legal Services & Support | 0 (0.0%) | 0 (0.0%) |
| Education Instruction & Library | 44 (36.7%) | 76 (63.3%) |
| Arts, Media & Entertainment | 0 (0.0%) | 0 (0.0%) |
| Health Diagnosing & Treating | 9 (8.3%) | 100 (91.7%) |
| Health Technologists | 3 (5.0%) | 57 (95.0%) |
| Total (Category) | 149 (38.7%) | 236 (61.3%) |
| Total (Overall) | 537 (49.3%) | 552 (50.7%) |
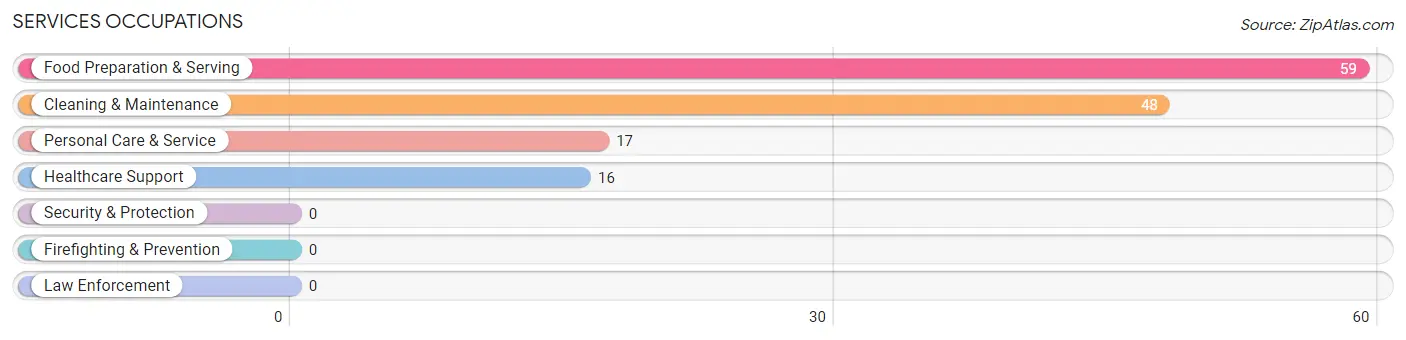
Services Occupations
The most common Services occupations in Chilhowie are Food Preparation & Serving (59 | 5.4%), Cleaning & Maintenance (48 | 4.4%), Personal Care & Service (17 | 1.6%), and Healthcare Support (16 | 1.5%).
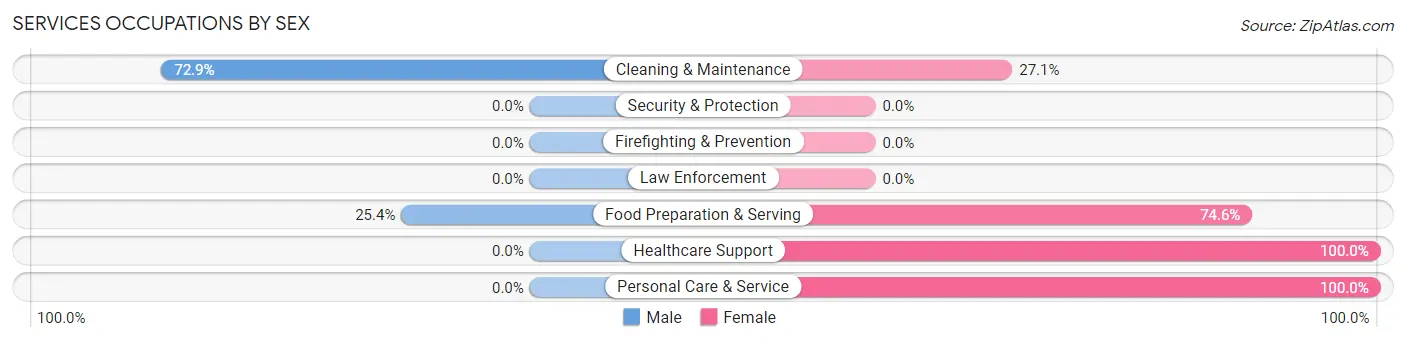
Services Occupations by Sex
Within the Services occupations in Chilhowie, the most male-oriented occupations are Cleaning & Maintenance (72.9%), and Food Preparation & Serving (25.4%), while the most female-oriented occupations are Healthcare Support (100.0%), Personal Care & Service (100.0%), and Food Preparation & Serving (74.6%).
| Occupation | Male | Female |
| Healthcare Support | 0 (0.0%) | 16 (100.0%) |
| Security & Protection | 0 (0.0%) | 0 (0.0%) |
| Firefighting & Prevention | 0 (0.0%) | 0 (0.0%) |
| Law Enforcement | 0 (0.0%) | 0 (0.0%) |
| Food Preparation & Serving | 15 (25.4%) | 44 (74.6%) |
| Cleaning & Maintenance | 35 (72.9%) | 13 (27.1%) |
| Personal Care & Service | 0 (0.0%) | 17 (100.0%) |
| Total (Category) | 50 (35.7%) | 90 (64.3%) |
| Total (Overall) | 537 (49.3%) | 552 (50.7%) |
Sales and Office Occupations
The most common Sales and Office occupations in Chilhowie are Sales & Related (172 | 15.8%), and Office & Administration (107 | 9.8%).
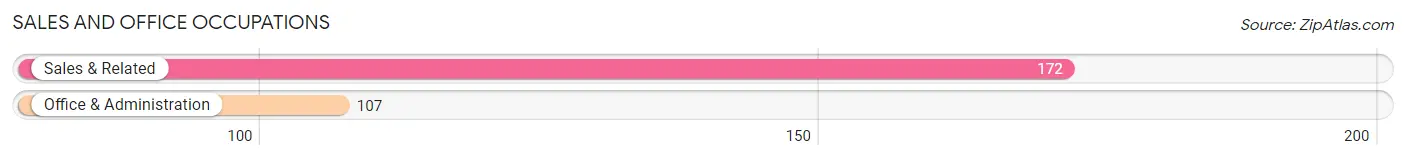
Sales and Office Occupations by Sex

| Occupation | Male | Female |
| Sales & Related | 75 (43.6%) | 97 (56.4%) |
| Office & Administration | 59 (55.1%) | 48 (44.9%) |
| Total (Category) | 134 (48.0%) | 145 (52.0%) |
| Total (Overall) | 537 (49.3%) | 552 (50.7%) |
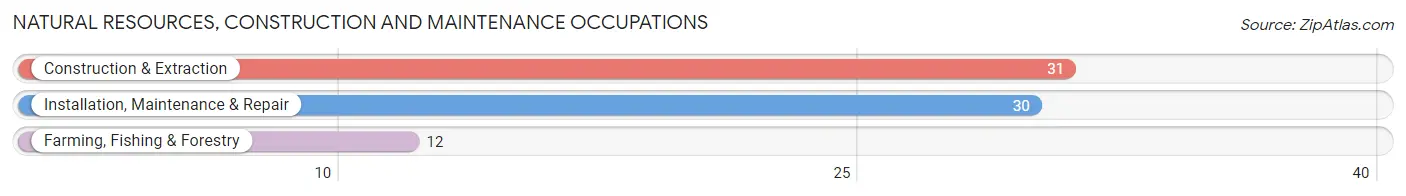
Natural Resources, Construction and Maintenance Occupations
The most common Natural Resources, Construction and Maintenance occupations in Chilhowie are Construction & Extraction (31 | 2.9%), Installation, Maintenance & Repair (30 | 2.8%), and Farming, Fishing & Forestry (12 | 1.1%).
Natural Resources, Construction and Maintenance Occupations by Sex
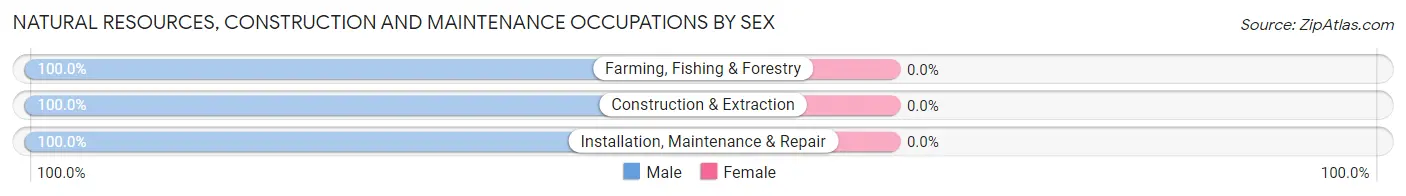
| Occupation | Male | Female |
| Farming, Fishing & Forestry | 12 (100.0%) | 0 (0.0%) |
| Construction & Extraction | 31 (100.0%) | 0 (0.0%) |
| Installation, Maintenance & Repair | 30 (100.0%) | 0 (0.0%) |
| Total (Category) | 73 (100.0%) | 0 (0.0%) |
| Total (Overall) | 537 (49.3%) | 552 (50.7%) |
Production, Transportation and Moving Occupations
The most common Production, Transportation and Moving occupations in Chilhowie are Production (167 | 15.3%), Material Moving (30 | 2.8%), and Transportation (15 | 1.4%).
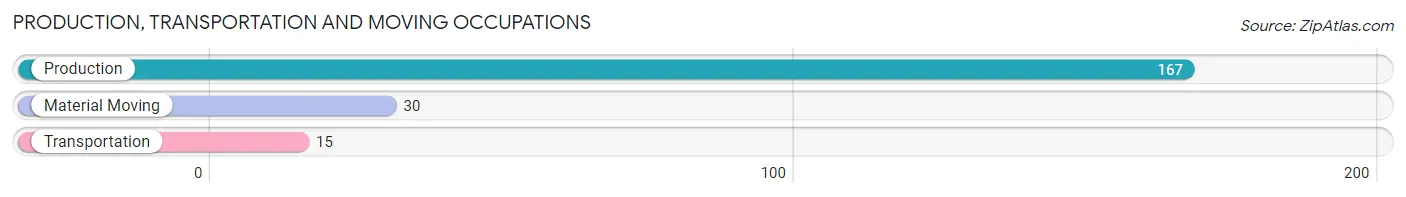
Production, Transportation and Moving Occupations by Sex
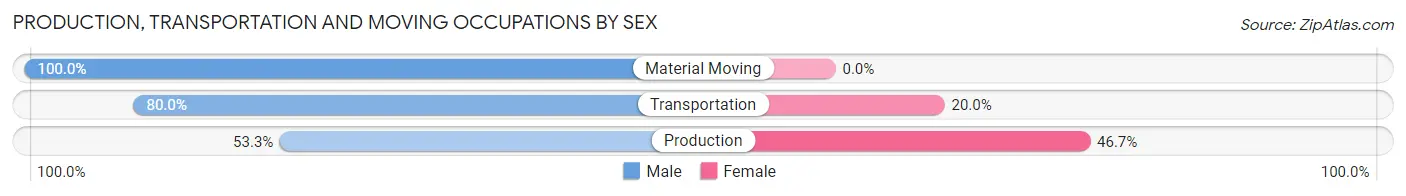
| Occupation | Male | Female |
| Production | 89 (53.3%) | 78 (46.7%) |
| Transportation | 12 (80.0%) | 3 (20.0%) |
| Material Moving | 30 (100.0%) | 0 (0.0%) |
| Total (Category) | 131 (61.8%) | 81 (38.2%) |
| Total (Overall) | 537 (49.3%) | 552 (50.7%) |
Employment Industries by Sex in Chilhowie
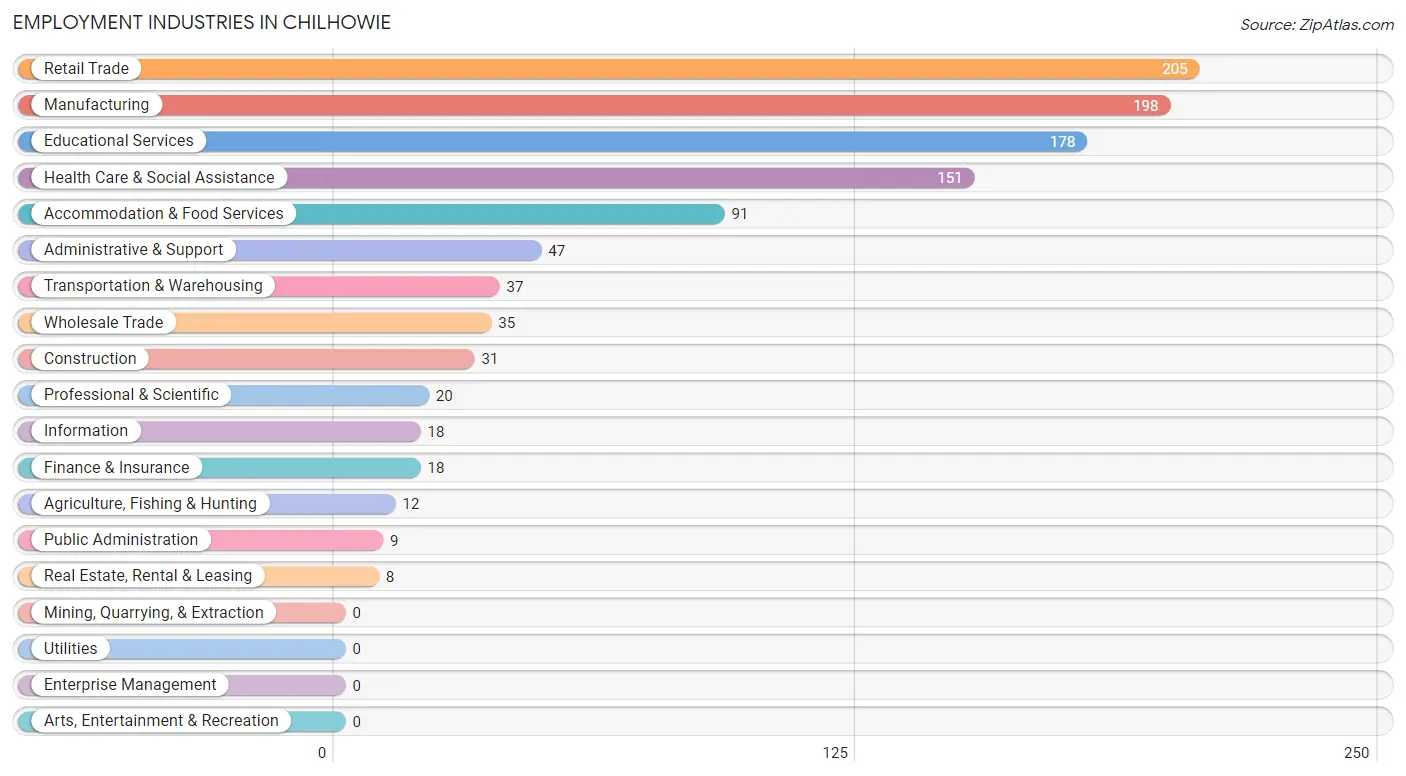
Employment Industries in Chilhowie
The major employment industries in Chilhowie include Retail Trade (205 | 18.8%), Manufacturing (198 | 18.2%), Educational Services (178 | 16.4%), Health Care & Social Assistance (151 | 13.9%), and Accommodation & Food Services (91 | 8.4%).
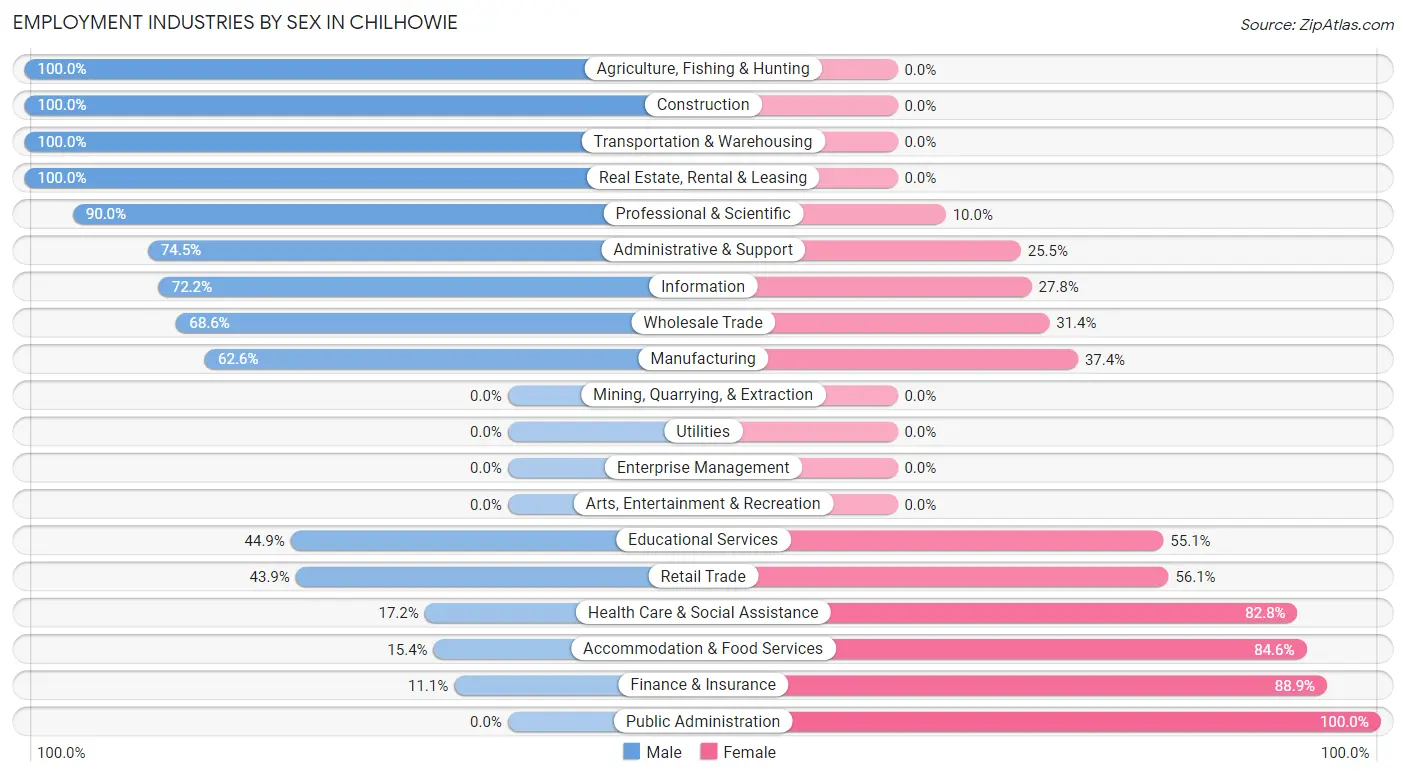
Employment Industries by Sex in Chilhowie
The Chilhowie industries that see more men than women are Agriculture, Fishing & Hunting (100.0%), Construction (100.0%), and Transportation & Warehousing (100.0%), whereas the industries that tend to have a higher number of women are Public Administration (100.0%), Finance & Insurance (88.9%), and Accommodation & Food Services (84.6%).
| Industry | Male | Female |
| Agriculture, Fishing & Hunting | 12 (100.0%) | 0 (0.0%) |
| Mining, Quarrying, & Extraction | 0 (0.0%) | 0 (0.0%) |
| Construction | 31 (100.0%) | 0 (0.0%) |
| Manufacturing | 124 (62.6%) | 74 (37.4%) |
| Wholesale Trade | 24 (68.6%) | 11 (31.4%) |
| Retail Trade | 90 (43.9%) | 115 (56.1%) |
| Transportation & Warehousing | 37 (100.0%) | 0 (0.0%) |
| Utilities | 0 (0.0%) | 0 (0.0%) |
| Information | 13 (72.2%) | 5 (27.8%) |
| Finance & Insurance | 2 (11.1%) | 16 (88.9%) |
| Real Estate, Rental & Leasing | 8 (100.0%) | 0 (0.0%) |
| Professional & Scientific | 18 (90.0%) | 2 (10.0%) |
| Enterprise Management | 0 (0.0%) | 0 (0.0%) |
| Administrative & Support | 35 (74.5%) | 12 (25.5%) |
| Educational Services | 80 (44.9%) | 98 (55.1%) |
| Health Care & Social Assistance | 26 (17.2%) | 125 (82.8%) |
| Arts, Entertainment & Recreation | 0 (0.0%) | 0 (0.0%) |
| Accommodation & Food Services | 14 (15.4%) | 77 (84.6%) |
| Public Administration | 0 (0.0%) | 9 (100.0%) |
| Total | 537 (49.3%) | 552 (50.7%) |
Education in Chilhowie
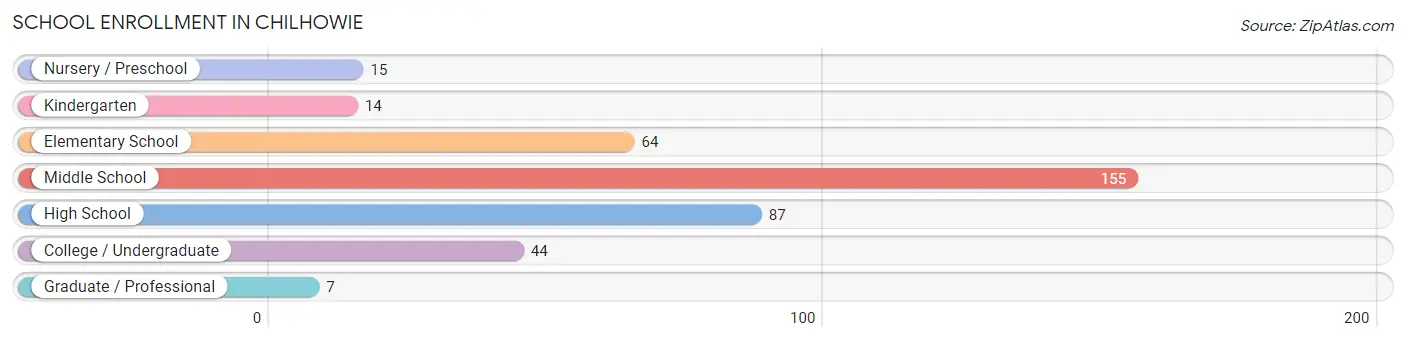
School Enrollment in Chilhowie
The most common levels of schooling among the 386 students in Chilhowie are middle school (155 | 40.2%), high school (87 | 22.5%), and elementary school (64 | 16.6%).
| School Level | # Students | % Students |
| Nursery / Preschool | 15 | 3.9% |
| Kindergarten | 14 | 3.6% |
| Elementary School | 64 | 16.6% |
| Middle School | 155 | 40.2% |
| High School | 87 | 22.5% |
| College / Undergraduate | 44 | 11.4% |
| Graduate / Professional | 7 | 1.8% |
| Total | 386 | 100.0% |
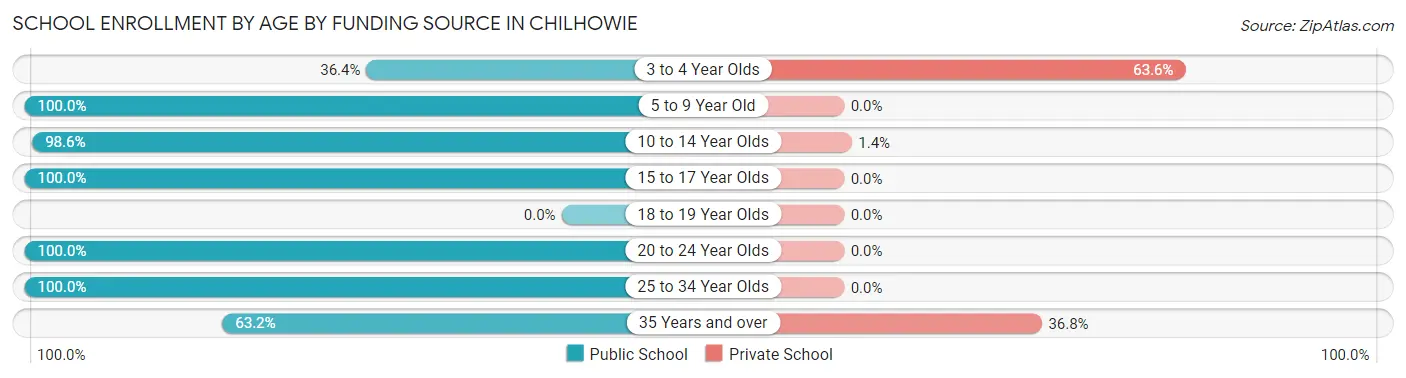
School Enrollment by Age by Funding Source in Chilhowie
Out of a total of 386 students who are enrolled in schools in Chilhowie, 17 (4.4%) attend a private institution, while the remaining 369 (95.6%) are enrolled in public schools. The age group of 3 to 4 year olds has the highest likelihood of being enrolled in private schools, with 7 (63.6% in the age bracket) enrolled. Conversely, the age group of 5 to 9 year old has the lowest likelihood of being enrolled in a private school, with 48 (100.0% in the age bracket) attending a public institution.
| Age Bracket | Public School | Private School |
| 3 to 4 Year Olds | 4 (36.4%) | 7 (63.6%) |
| 5 to 9 Year Old | 48 (100.0%) | 0 (0.0%) |
| 10 to 14 Year Olds | 207 (98.6%) | 3 (1.4%) |
| 15 to 17 Year Olds | 66 (100.0%) | 0 (0.0%) |
| 18 to 19 Year Olds | 0 (0.0%) | 0 (0.0%) |
| 20 to 24 Year Olds | 9 (100.0%) | 0 (0.0%) |
| 25 to 34 Year Olds | 23 (100.0%) | 0 (0.0%) |
| 35 Years and over | 12 (63.2%) | 7 (36.8%) |
| Total | 369 (95.6%) | 17 (4.4%) |
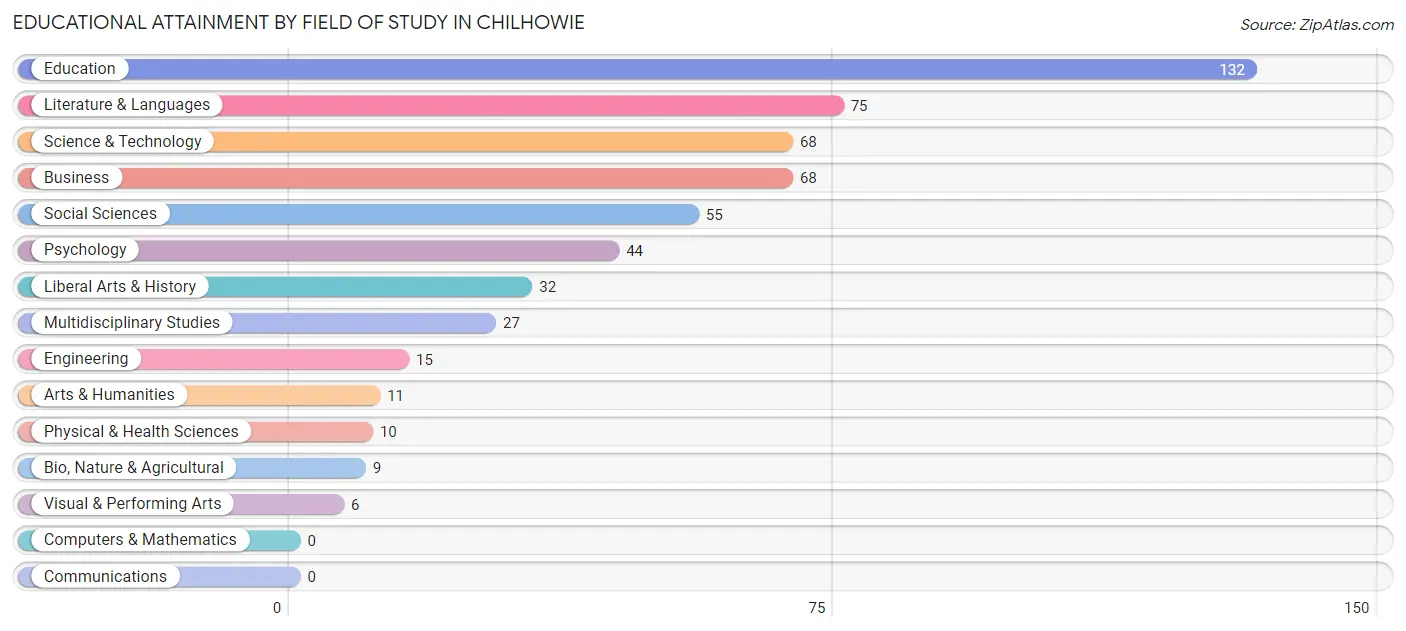
Educational Attainment by Field of Study in Chilhowie
Education (132 | 23.9%), literature & languages (75 | 13.6%), science & technology (68 | 12.3%), business (68 | 12.3%), and social sciences (55 | 10.0%) are the most common fields of study among 552 individuals in Chilhowie who have obtained a bachelor's degree or higher.
| Field of Study | # Graduates | % Graduates |
| Computers & Mathematics | 0 | 0.0% |
| Bio, Nature & Agricultural | 9 | 1.6% |
| Physical & Health Sciences | 10 | 1.8% |
| Psychology | 44 | 8.0% |
| Social Sciences | 55 | 10.0% |
| Engineering | 15 | 2.7% |
| Multidisciplinary Studies | 27 | 4.9% |
| Science & Technology | 68 | 12.3% |
| Business | 68 | 12.3% |
| Education | 132 | 23.9% |
| Literature & Languages | 75 | 13.6% |
| Liberal Arts & History | 32 | 5.8% |
| Visual & Performing Arts | 6 | 1.1% |
| Communications | 0 | 0.0% |
| Arts & Humanities | 11 | 2.0% |
| Total | 552 | 100.0% |
Transportation & Commute in Chilhowie
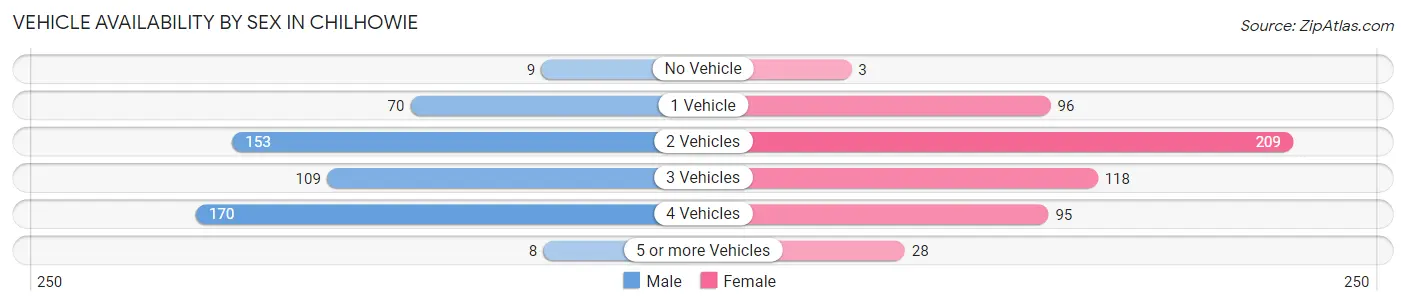
Vehicle Availability by Sex in Chilhowie
The most prevalent vehicle ownership categories in Chilhowie are males with 4 vehicles (170, accounting for 32.8%) and females with 4 vehicles (95, making up 31.0%).
| Vehicles Available | Male | Female |
| No Vehicle | 9 (1.7%) | 3 (0.5%) |
| 1 Vehicle | 70 (13.5%) | 96 (17.5%) |
| 2 Vehicles | 153 (29.5%) | 209 (38.1%) |
| 3 Vehicles | 109 (21.0%) | 118 (21.5%) |
| 4 Vehicles | 170 (32.8%) | 95 (17.3%) |
| 5 or more Vehicles | 8 (1.5%) | 28 (5.1%) |
| Total | 519 (100.0%) | 549 (100.0%) |
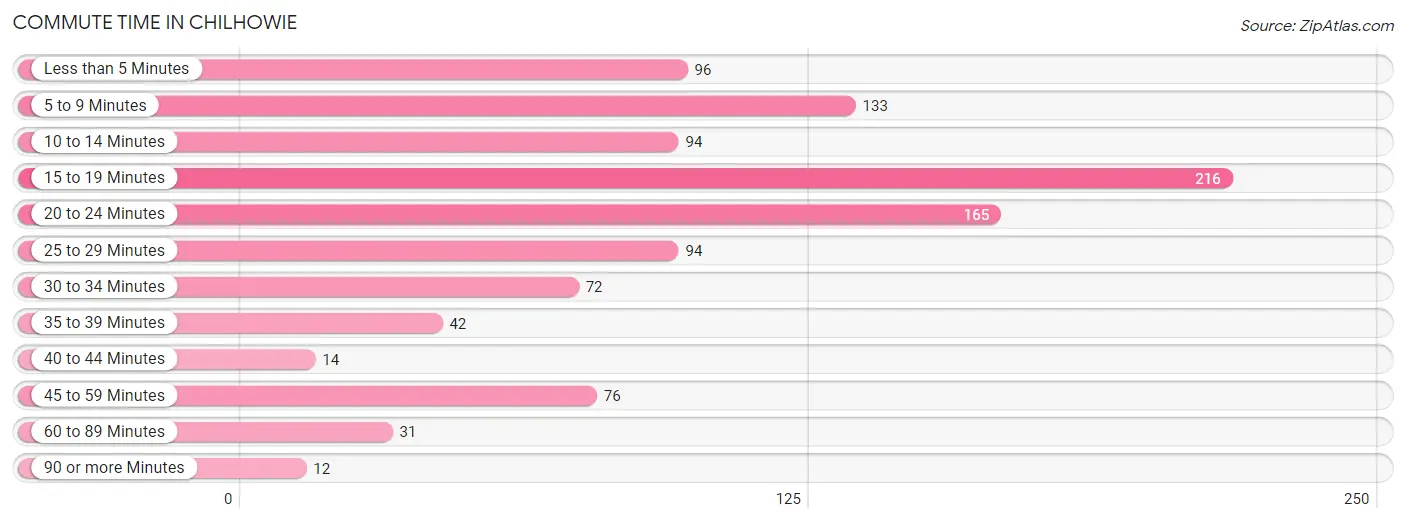
Commute Time in Chilhowie
The most frequently occuring commute durations in Chilhowie are 15 to 19 minutes (216 commuters, 20.7%), 20 to 24 minutes (165 commuters, 15.8%), and 5 to 9 minutes (133 commuters, 12.7%).
| Commute Time | # Commuters | % Commuters |
| Less than 5 Minutes | 96 | 9.2% |
| 5 to 9 Minutes | 133 | 12.7% |
| 10 to 14 Minutes | 94 | 9.0% |
| 15 to 19 Minutes | 216 | 20.7% |
| 20 to 24 Minutes | 165 | 15.8% |
| 25 to 29 Minutes | 94 | 9.0% |
| 30 to 34 Minutes | 72 | 6.9% |
| 35 to 39 Minutes | 42 | 4.0% |
| 40 to 44 Minutes | 14 | 1.3% |
| 45 to 59 Minutes | 76 | 7.3% |
| 60 to 89 Minutes | 31 | 3.0% |
| 90 or more Minutes | 12 | 1.1% |
Commute Time by Sex in Chilhowie
The most common commute times in Chilhowie are 15 to 19 minutes (118 commuters, 22.9%) for males and 15 to 19 minutes (98 commuters, 18.5%) for females.
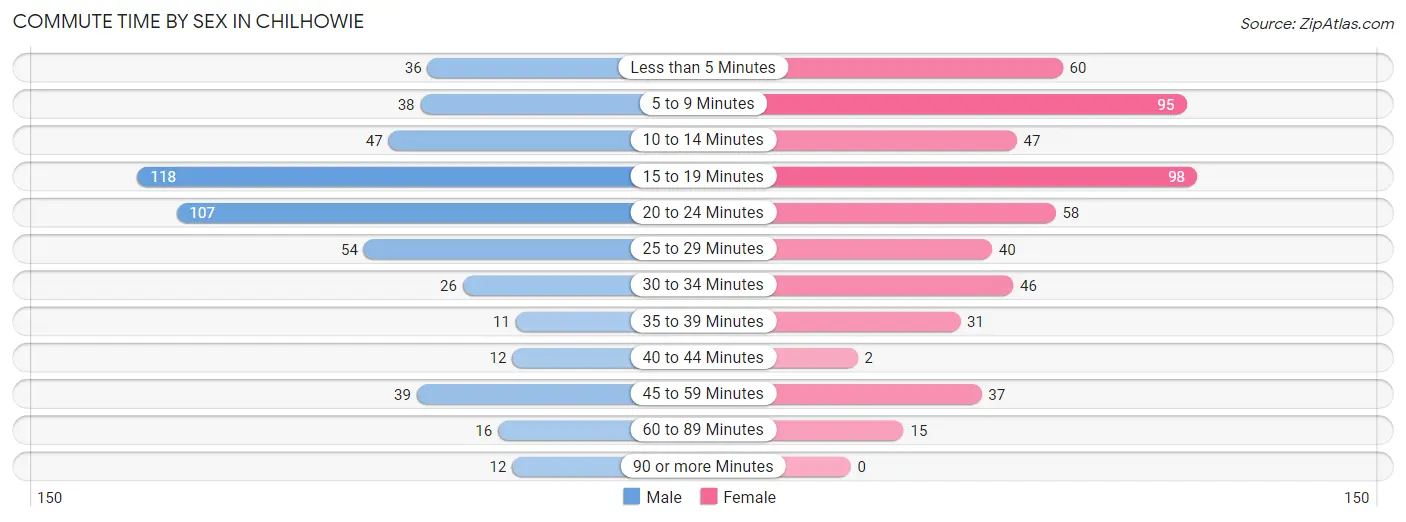
| Commute Time | Male | Female |
| Less than 5 Minutes | 36 (7.0%) | 60 (11.3%) |
| 5 to 9 Minutes | 38 (7.4%) | 95 (18.0%) |
| 10 to 14 Minutes | 47 (9.1%) | 47 (8.9%) |
| 15 to 19 Minutes | 118 (22.9%) | 98 (18.5%) |
| 20 to 24 Minutes | 107 (20.7%) | 58 (11.0%) |
| 25 to 29 Minutes | 54 (10.5%) | 40 (7.6%) |
| 30 to 34 Minutes | 26 (5.0%) | 46 (8.7%) |
| 35 to 39 Minutes | 11 (2.1%) | 31 (5.9%) |
| 40 to 44 Minutes | 12 (2.3%) | 2 (0.4%) |
| 45 to 59 Minutes | 39 (7.6%) | 37 (7.0%) |
| 60 to 89 Minutes | 16 (3.1%) | 15 (2.8%) |
| 90 or more Minutes | 12 (2.3%) | 0 (0.0%) |
Time of Departure to Work by Sex in Chilhowie
The most frequent times of departure to work in Chilhowie are 7:00 AM to 7:29 AM (112, 21.7%) for males and 7:30 AM to 7:59 AM (119, 22.5%) for females.
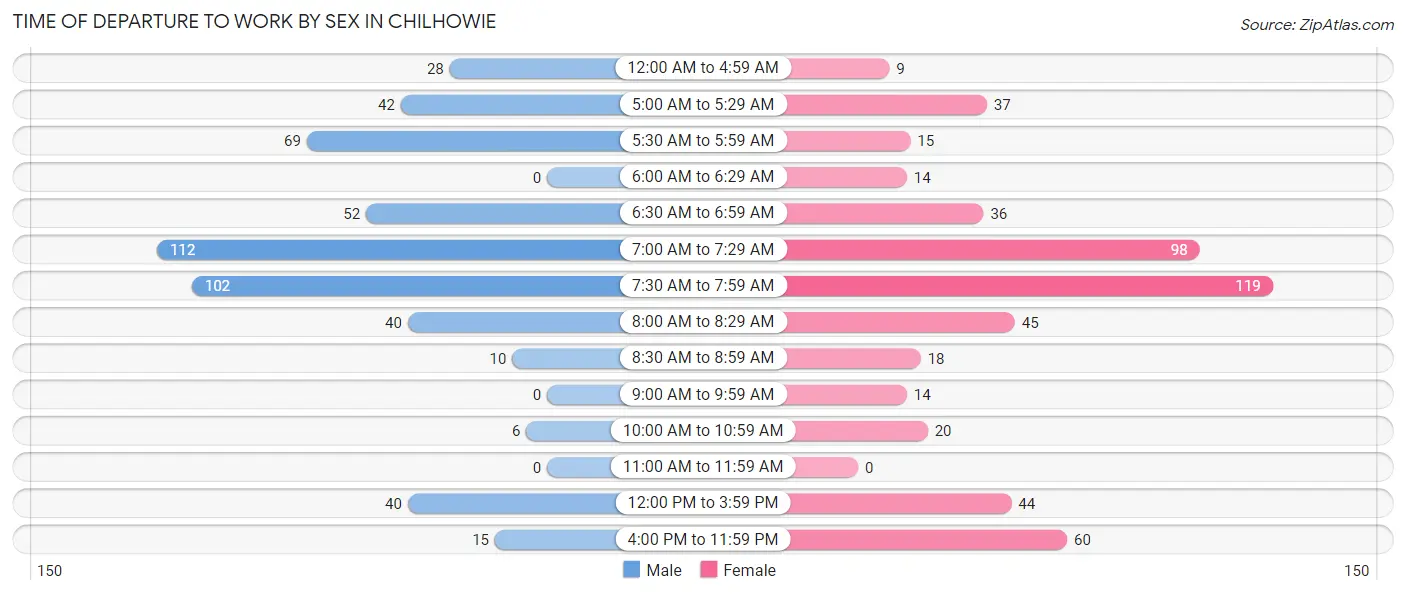
| Time of Departure | Male | Female |
| 12:00 AM to 4:59 AM | 28 (5.4%) | 9 (1.7%) |
| 5:00 AM to 5:29 AM | 42 (8.1%) | 37 (7.0%) |
| 5:30 AM to 5:59 AM | 69 (13.4%) | 15 (2.8%) |
| 6:00 AM to 6:29 AM | 0 (0.0%) | 14 (2.6%) |
| 6:30 AM to 6:59 AM | 52 (10.1%) | 36 (6.8%) |
| 7:00 AM to 7:29 AM | 112 (21.7%) | 98 (18.5%) |
| 7:30 AM to 7:59 AM | 102 (19.8%) | 119 (22.5%) |
| 8:00 AM to 8:29 AM | 40 (7.7%) | 45 (8.5%) |
| 8:30 AM to 8:59 AM | 10 (1.9%) | 18 (3.4%) |
| 9:00 AM to 9:59 AM | 0 (0.0%) | 14 (2.6%) |
| 10:00 AM to 10:59 AM | 6 (1.2%) | 20 (3.8%) |
| 11:00 AM to 11:59 AM | 0 (0.0%) | 0 (0.0%) |
| 12:00 PM to 3:59 PM | 40 (7.7%) | 44 (8.3%) |
| 4:00 PM to 11:59 PM | 15 (2.9%) | 60 (11.3%) |
| Total | 516 (100.0%) | 529 (100.0%) |
Housing Occupancy in Chilhowie
Occupancy by Ownership in Chilhowie
Of the total 855 dwellings in Chilhowie, owner-occupied units account for 509 (59.5%), while renter-occupied units make up 346 (40.5%).
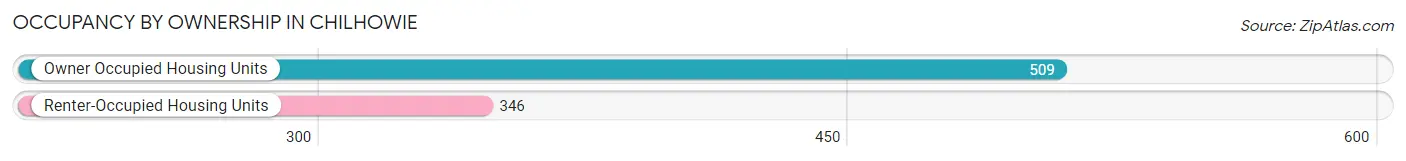
| Occupancy | # Housing Units | % Housing Units |
| Owner Occupied Housing Units | 509 | 59.5% |
| Renter-Occupied Housing Units | 346 | 40.5% |
| Total Occupied Housing Units | 855 | 100.0% |
Occupancy by Household Size in Chilhowie
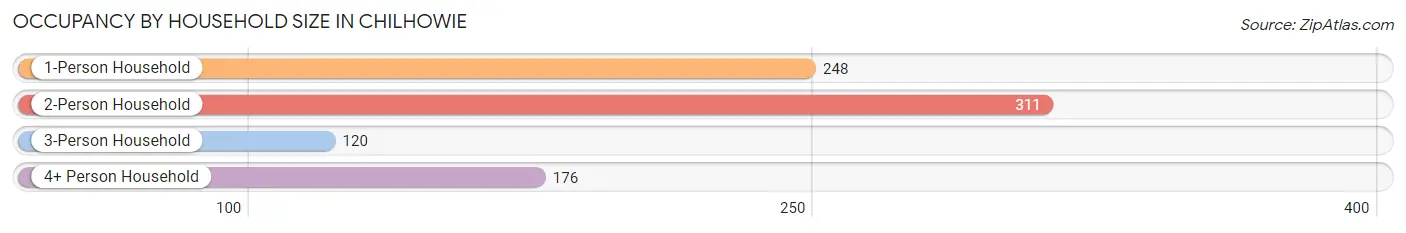
| Household Size | # Housing Units | % Housing Units |
| 1-Person Household | 248 | 29.0% |
| 2-Person Household | 311 | 36.4% |
| 3-Person Household | 120 | 14.0% |
| 4+ Person Household | 176 | 20.6% |
| Total Housing Units | 855 | 100.0% |
Occupancy by Ownership by Household Size in Chilhowie
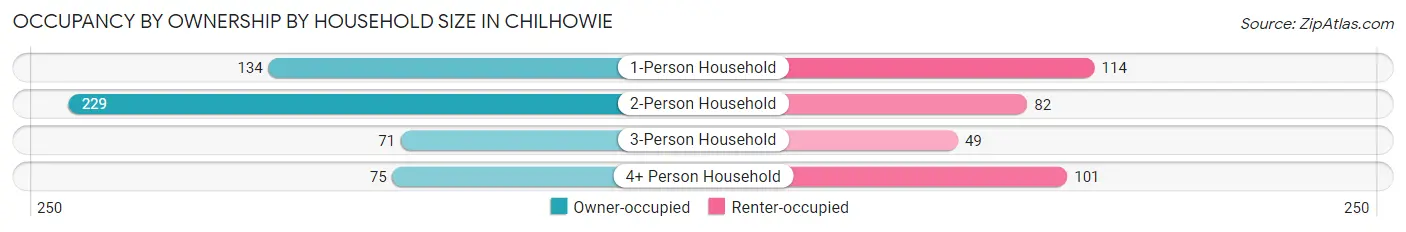
| Household Size | Owner-occupied | Renter-occupied |
| 1-Person Household | 134 (54.0%) | 114 (46.0%) |
| 2-Person Household | 229 (73.6%) | 82 (26.4%) |
| 3-Person Household | 71 (59.2%) | 49 (40.8%) |
| 4+ Person Household | 75 (42.6%) | 101 (57.4%) |
| Total Housing Units | 509 (59.5%) | 346 (40.5%) |
Occupancy by Educational Attainment in Chilhowie
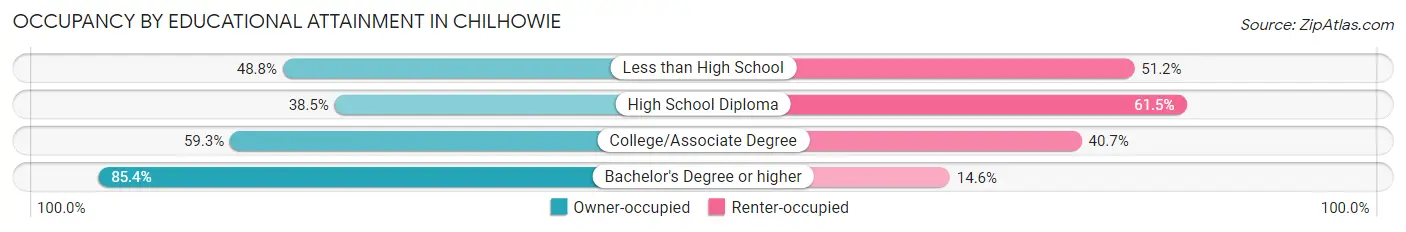
| Household Size | Owner-occupied | Renter-occupied |
| Less than High School | 41 (48.8%) | 43 (51.2%) |
| High School Diploma | 109 (38.5%) | 174 (61.5%) |
| College/Associate Degree | 131 (59.3%) | 90 (40.7%) |
| Bachelor's Degree or higher | 228 (85.4%) | 39 (14.6%) |
Occupancy by Age of Householder in Chilhowie
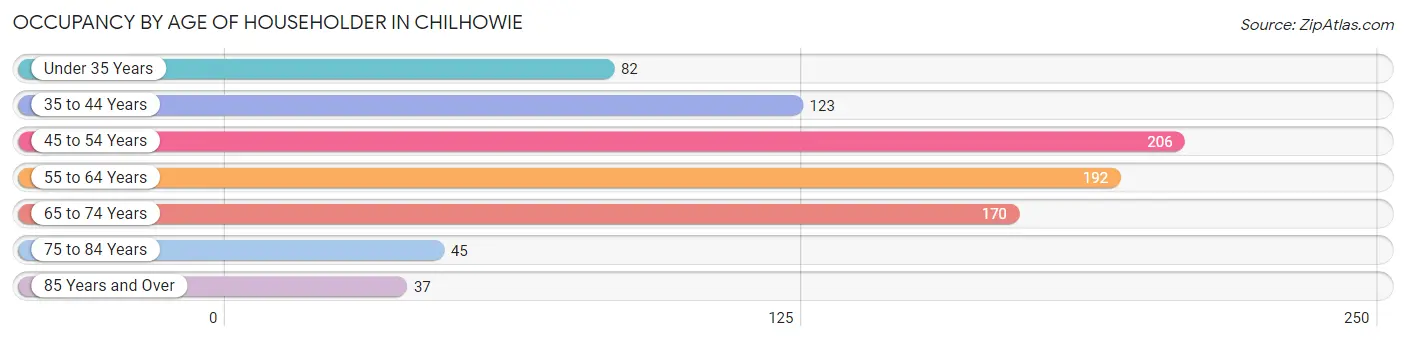
| Age Bracket | # Households | % Households |
| Under 35 Years | 82 | 9.6% |
| 35 to 44 Years | 123 | 14.4% |
| 45 to 54 Years | 206 | 24.1% |
| 55 to 64 Years | 192 | 22.5% |
| 65 to 74 Years | 170 | 19.9% |
| 75 to 84 Years | 45 | 5.3% |
| 85 Years and Over | 37 | 4.3% |
| Total | 855 | 100.0% |
Housing Finances in Chilhowie
Median Income by Occupancy in Chilhowie
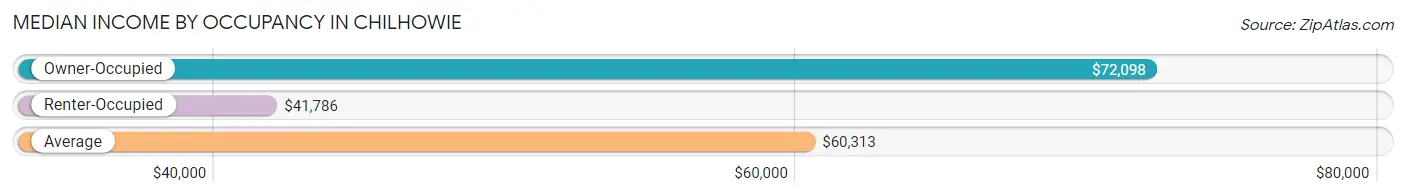
| Occupancy Type | # Households | Median Income |
| Owner-Occupied | 509 (59.5%) | $72,098 |
| Renter-Occupied | 346 (40.5%) | $41,786 |
| Average | 855 (100.0%) | $60,313 |
Occupancy by Householder Income Bracket in Chilhowie
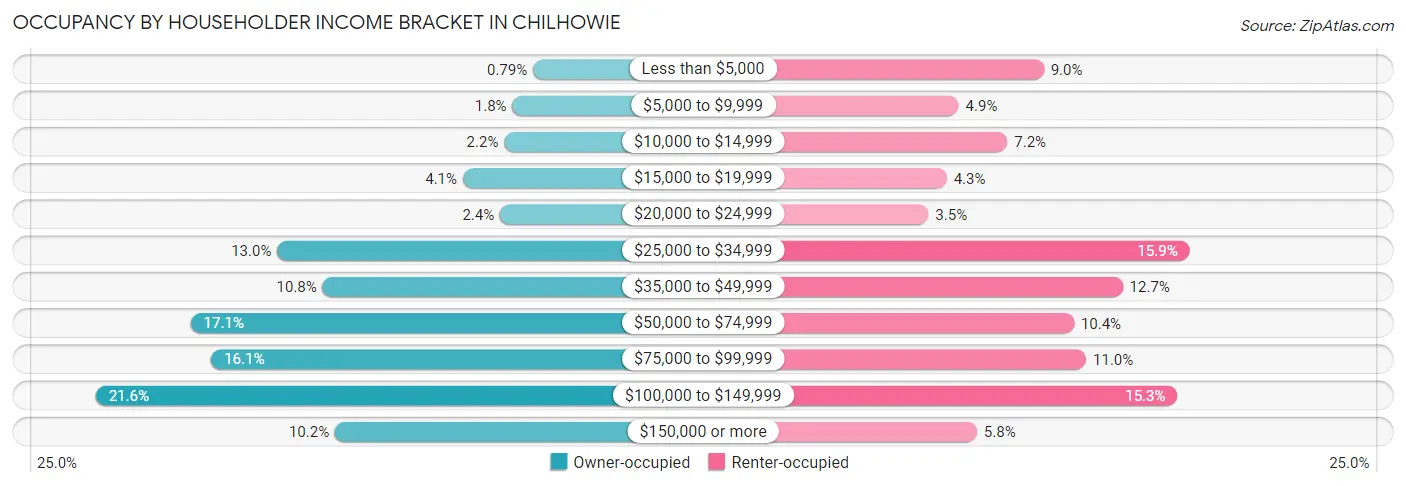
| Income Bracket | Owner-occupied | Renter-occupied |
| Less than $5,000 | 4 (0.8%) | 31 (9.0%) |
| $5,000 to $9,999 | 9 (1.8%) | 17 (4.9%) |
| $10,000 to $14,999 | 11 (2.2%) | 25 (7.2%) |
| $15,000 to $19,999 | 21 (4.1%) | 15 (4.3%) |
| $20,000 to $24,999 | 12 (2.4%) | 12 (3.5%) |
| $25,000 to $34,999 | 66 (13.0%) | 55 (15.9%) |
| $35,000 to $49,999 | 55 (10.8%) | 44 (12.7%) |
| $50,000 to $74,999 | 87 (17.1%) | 36 (10.4%) |
| $75,000 to $99,999 | 82 (16.1%) | 38 (11.0%) |
| $100,000 to $149,999 | 110 (21.6%) | 53 (15.3%) |
| $150,000 or more | 52 (10.2%) | 20 (5.8%) |
| Total | 509 (100.0%) | 346 (100.0%) |
Monthly Housing Cost Tiers in Chilhowie
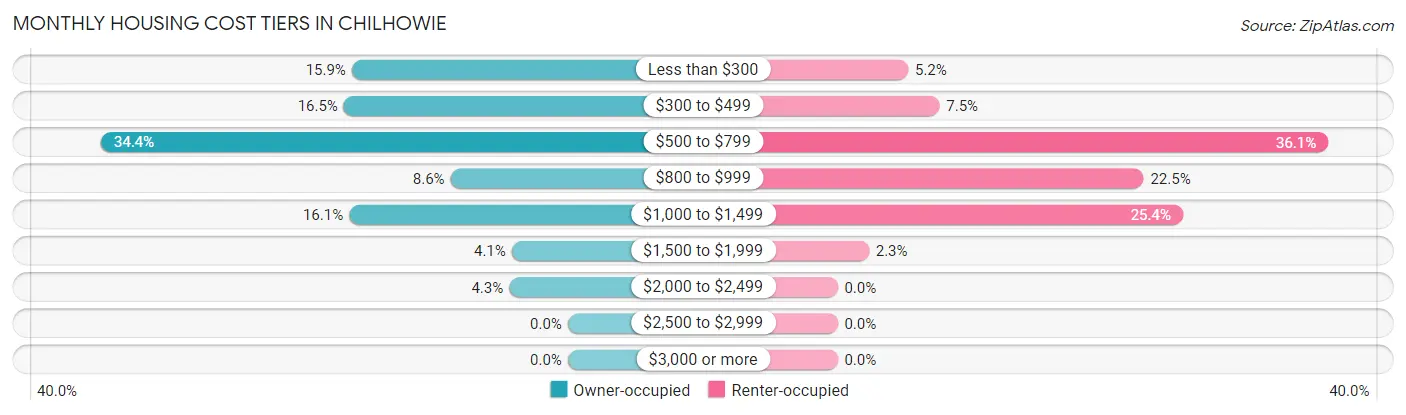
| Monthly Cost | Owner-occupied | Renter-occupied |
| Less than $300 | 81 (15.9%) | 18 (5.2%) |
| $300 to $499 | 84 (16.5%) | 26 (7.5%) |
| $500 to $799 | 175 (34.4%) | 125 (36.1%) |
| $800 to $999 | 44 (8.6%) | 78 (22.5%) |
| $1,000 to $1,499 | 82 (16.1%) | 88 (25.4%) |
| $1,500 to $1,999 | 21 (4.1%) | 8 (2.3%) |
| $2,000 to $2,499 | 22 (4.3%) | 0 (0.0%) |
| $2,500 to $2,999 | 0 (0.0%) | 0 (0.0%) |
| $3,000 or more | 0 (0.0%) | 0 (0.0%) |
| Total | 509 (100.0%) | 346 (100.0%) |
Physical Housing Characteristics in Chilhowie
Housing Structures in Chilhowie
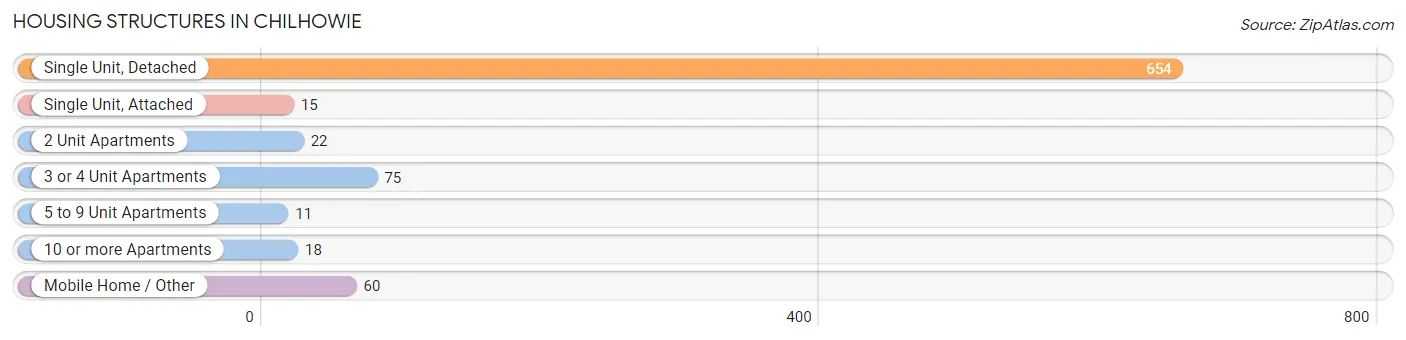
| Structure Type | # Housing Units | % Housing Units |
| Single Unit, Detached | 654 | 76.5% |
| Single Unit, Attached | 15 | 1.8% |
| 2 Unit Apartments | 22 | 2.6% |
| 3 or 4 Unit Apartments | 75 | 8.8% |
| 5 to 9 Unit Apartments | 11 | 1.3% |
| 10 or more Apartments | 18 | 2.1% |
| Mobile Home / Other | 60 | 7.0% |
| Total | 855 | 100.0% |
Housing Structures by Occupancy in Chilhowie
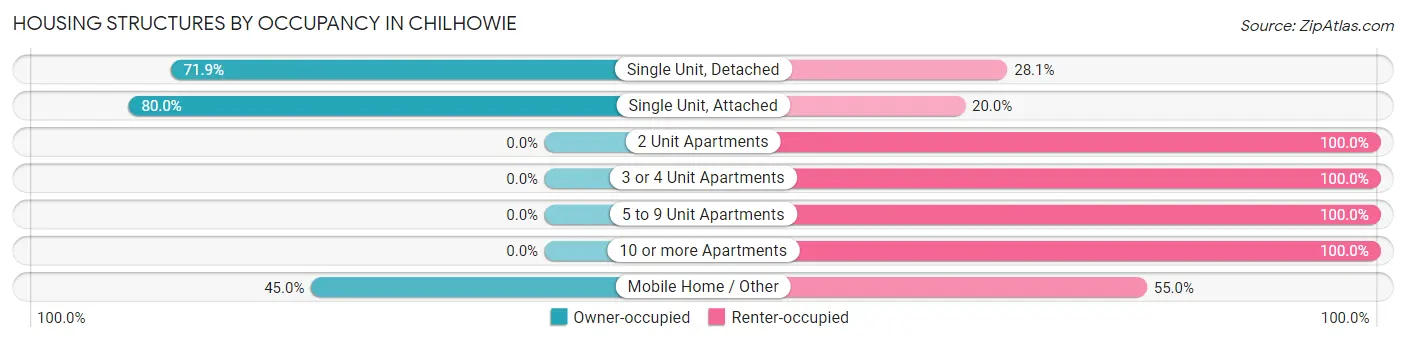
| Structure Type | Owner-occupied | Renter-occupied |
| Single Unit, Detached | 470 (71.9%) | 184 (28.1%) |
| Single Unit, Attached | 12 (80.0%) | 3 (20.0%) |
| 2 Unit Apartments | 0 (0.0%) | 22 (100.0%) |
| 3 or 4 Unit Apartments | 0 (0.0%) | 75 (100.0%) |
| 5 to 9 Unit Apartments | 0 (0.0%) | 11 (100.0%) |
| 10 or more Apartments | 0 (0.0%) | 18 (100.0%) |
| Mobile Home / Other | 27 (45.0%) | 33 (55.0%) |
| Total | 509 (59.5%) | 346 (40.5%) |
Housing Structures by Number of Rooms in Chilhowie
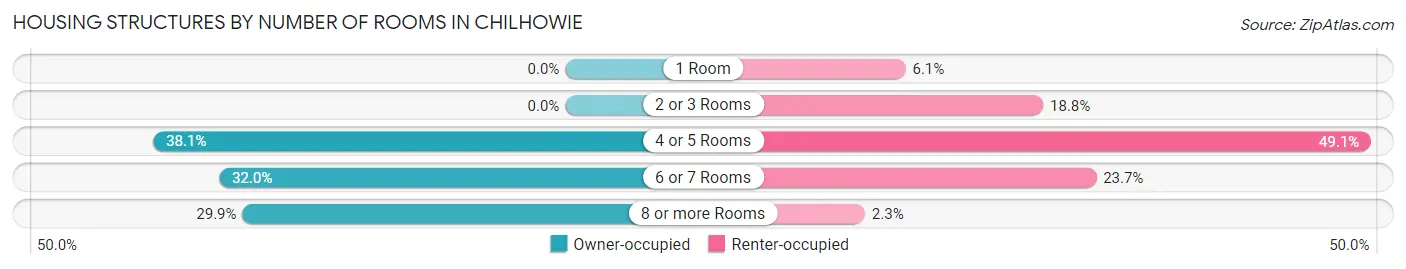
| Number of Rooms | Owner-occupied | Renter-occupied |
| 1 Room | 0 (0.0%) | 21 (6.1%) |
| 2 or 3 Rooms | 0 (0.0%) | 65 (18.8%) |
| 4 or 5 Rooms | 194 (38.1%) | 170 (49.1%) |
| 6 or 7 Rooms | 163 (32.0%) | 82 (23.7%) |
| 8 or more Rooms | 152 (29.9%) | 8 (2.3%) |
| Total | 509 (100.0%) | 346 (100.0%) |
Housing Structure by Heating Type in Chilhowie
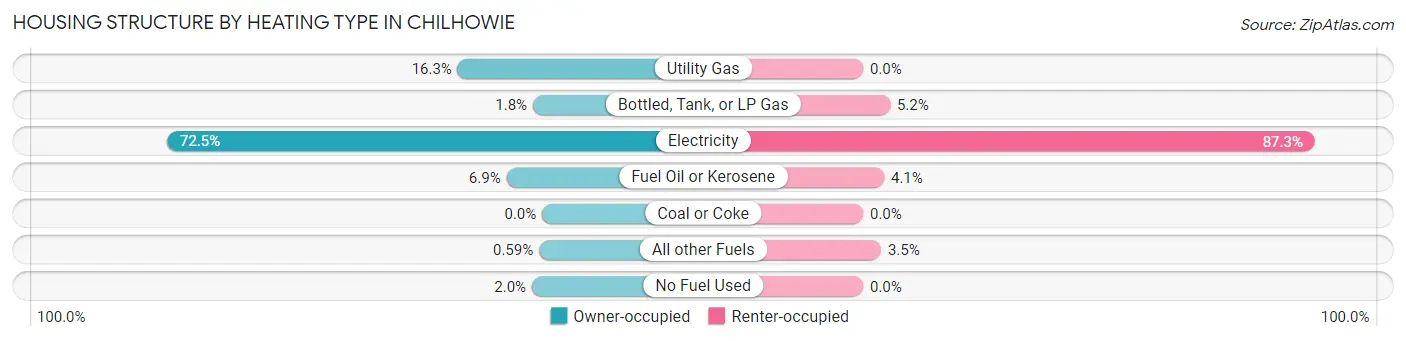
| Heating Type | Owner-occupied | Renter-occupied |
| Utility Gas | 83 (16.3%) | 0 (0.0%) |
| Bottled, Tank, or LP Gas | 9 (1.8%) | 18 (5.2%) |
| Electricity | 369 (72.5%) | 302 (87.3%) |
| Fuel Oil or Kerosene | 35 (6.9%) | 14 (4.1%) |
| Coal or Coke | 0 (0.0%) | 0 (0.0%) |
| All other Fuels | 3 (0.6%) | 12 (3.5%) |
| No Fuel Used | 10 (2.0%) | 0 (0.0%) |
| Total | 509 (100.0%) | 346 (100.0%) |
Household Vehicle Usage in Chilhowie
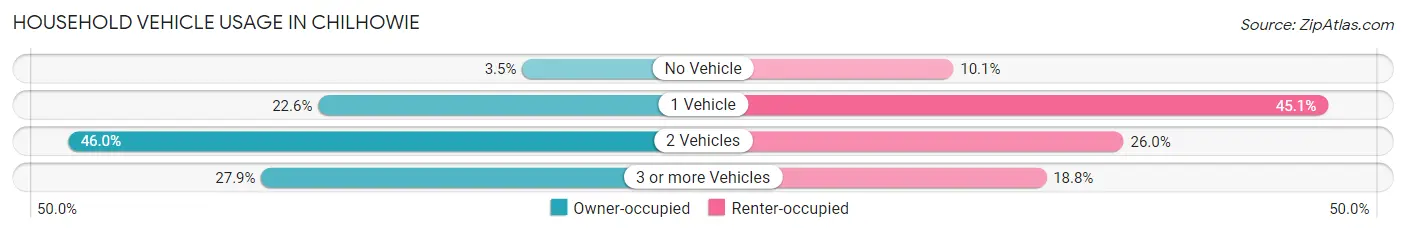
| Vehicles per Household | Owner-occupied | Renter-occupied |
| No Vehicle | 18 (3.5%) | 35 (10.1%) |
| 1 Vehicle | 115 (22.6%) | 156 (45.1%) |
| 2 Vehicles | 234 (46.0%) | 90 (26.0%) |
| 3 or more Vehicles | 142 (27.9%) | 65 (18.8%) |
| Total | 509 (100.0%) | 346 (100.0%) |
Real Estate & Mortgages in Chilhowie
Real Estate and Mortgage Overview in Chilhowie
| Characteristic | Without Mortgage | With Mortgage |
| Housing Units | 258 | 251 |
| Median Property Value | $157,300 | $159,700 |
| Median Household Income | $70,268 | $37 |
| Monthly Housing Costs | $412 | $0 |
| Real Estate Taxes | $1,060 | $12 |
Property Value by Mortgage Status in Chilhowie
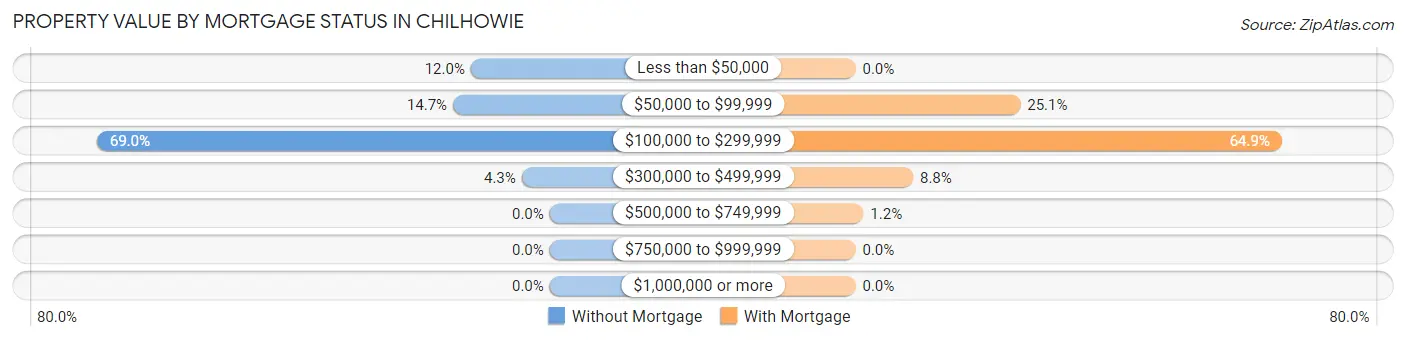
| Property Value | Without Mortgage | With Mortgage |
| Less than $50,000 | 31 (12.0%) | 0 (0.0%) |
| $50,000 to $99,999 | 38 (14.7%) | 63 (25.1%) |
| $100,000 to $299,999 | 178 (69.0%) | 163 (64.9%) |
| $300,000 to $499,999 | 11 (4.3%) | 22 (8.8%) |
| $500,000 to $749,999 | 0 (0.0%) | 3 (1.2%) |
| $750,000 to $999,999 | 0 (0.0%) | 0 (0.0%) |
| $1,000,000 or more | 0 (0.0%) | 0 (0.0%) |
| Total | 258 (100.0%) | 251 (100.0%) |
Household Income by Mortgage Status in Chilhowie
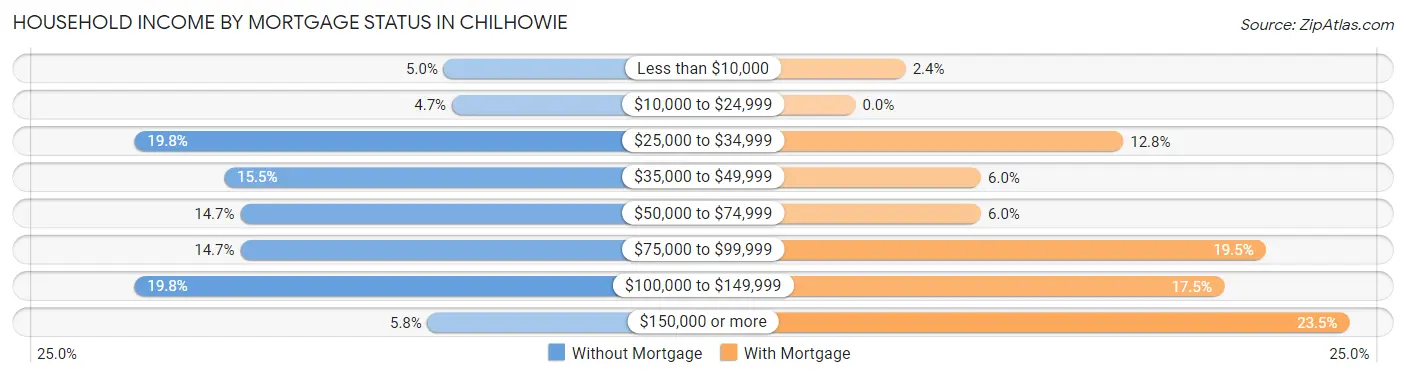
| Household Income | Without Mortgage | With Mortgage |
| Less than $10,000 | 13 (5.0%) | 6 (2.4%) |
| $10,000 to $24,999 | 12 (4.6%) | 0 (0.0%) |
| $25,000 to $34,999 | 51 (19.8%) | 32 (12.8%) |
| $35,000 to $49,999 | 40 (15.5%) | 15 (6.0%) |
| $50,000 to $74,999 | 38 (14.7%) | 15 (6.0%) |
| $75,000 to $99,999 | 38 (14.7%) | 49 (19.5%) |
| $100,000 to $149,999 | 51 (19.8%) | 44 (17.5%) |
| $150,000 or more | 15 (5.8%) | 59 (23.5%) |
| Total | 258 (100.0%) | 251 (100.0%) |
Property Value to Household Income Ratio in Chilhowie
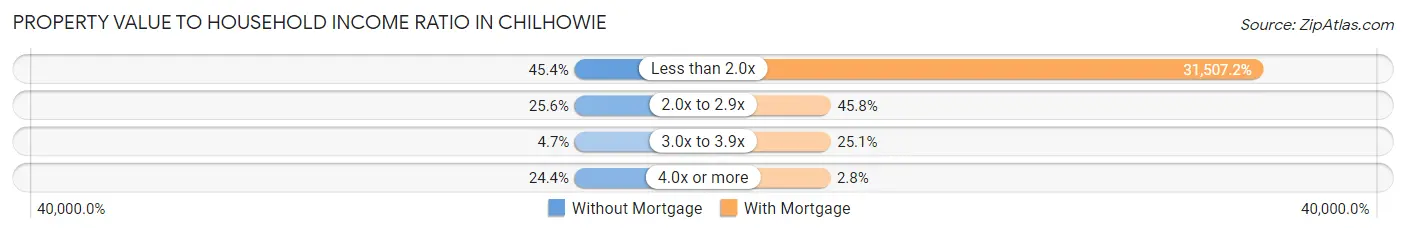
| Value-to-Income Ratio | Without Mortgage | With Mortgage |
| Less than 2.0x | 117 (45.4%) | 79,083 (31,507.2%) |
| 2.0x to 2.9x | 66 (25.6%) | 115 (45.8%) |
| 3.0x to 3.9x | 12 (4.6%) | 63 (25.1%) |
| 4.0x or more | 63 (24.4%) | 7 (2.8%) |
| Total | 258 (100.0%) | 251 (100.0%) |
Real Estate Taxes by Mortgage Status in Chilhowie
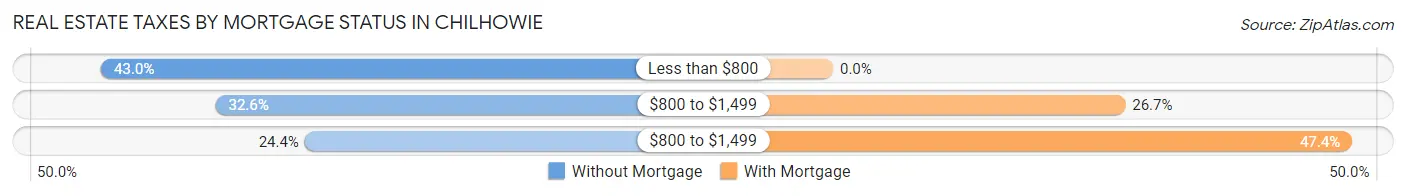
| Property Taxes | Without Mortgage | With Mortgage |
| Less than $800 | 111 (43.0%) | 0 (0.0%) |
| $800 to $1,499 | 84 (32.6%) | 67 (26.7%) |
| $800 to $1,499 | 63 (24.4%) | 119 (47.4%) |
| Total | 258 (100.0%) | 251 (100.0%) |
Health & Disability in Chilhowie
Health Insurance Coverage by Age in Chilhowie
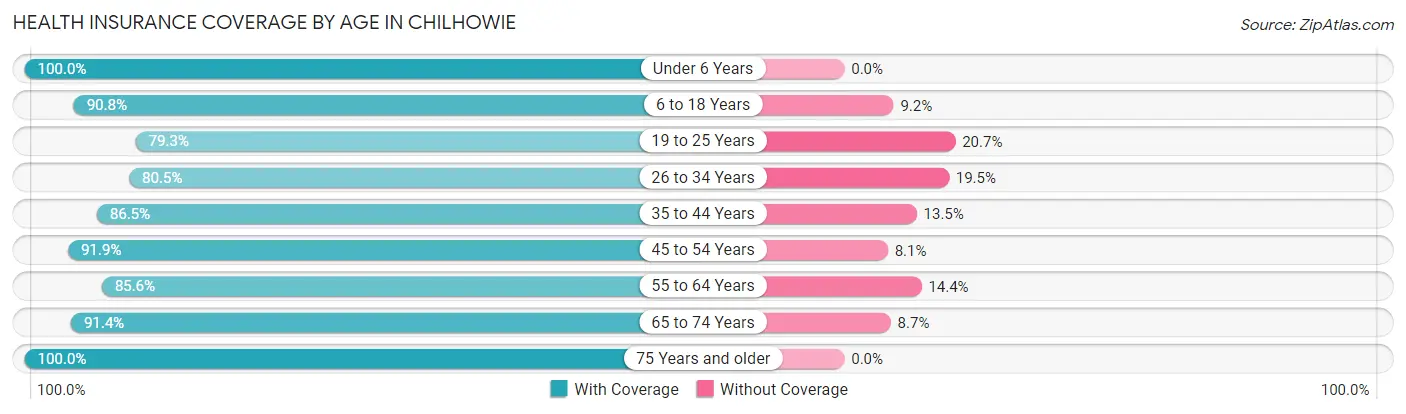
| Age Bracket | With Coverage | Without Coverage |
| Under 6 Years | 99 (100.0%) | 0 (0.0%) |
| 6 to 18 Years | 317 (90.8%) | 32 (9.2%) |
| 19 to 25 Years | 138 (79.3%) | 36 (20.7%) |
| 26 to 34 Years | 186 (80.5%) | 45 (19.5%) |
| 35 to 44 Years | 244 (86.5%) | 38 (13.5%) |
| 45 to 54 Years | 329 (91.9%) | 29 (8.1%) |
| 55 to 64 Years | 232 (85.6%) | 39 (14.4%) |
| 65 to 74 Years | 264 (91.3%) | 25 (8.6%) |
| 75 Years and older | 103 (100.0%) | 0 (0.0%) |
| Total | 1,912 (88.7%) | 244 (11.3%) |
Health Insurance Coverage by Citizenship Status in Chilhowie
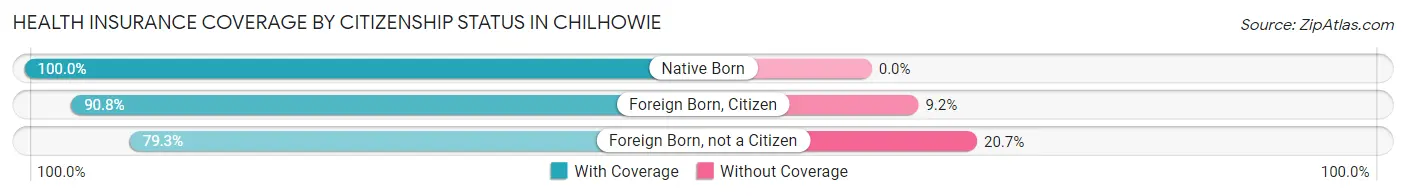
| Citizenship Status | With Coverage | Without Coverage |
| Native Born | 99 (100.0%) | 0 (0.0%) |
| Foreign Born, Citizen | 317 (90.8%) | 32 (9.2%) |
| Foreign Born, not a Citizen | 138 (79.3%) | 36 (20.7%) |
Health Insurance Coverage by Household Income in Chilhowie
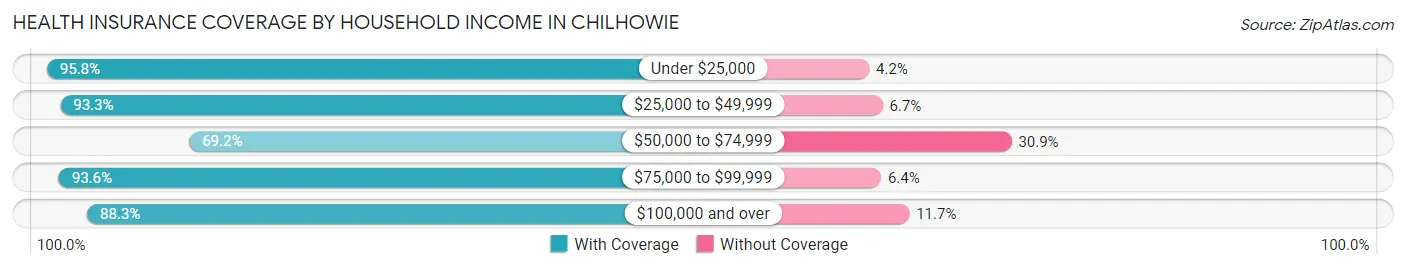
| Household Income | With Coverage | Without Coverage |
| Under $25,000 | 275 (95.8%) | 12 (4.2%) |
| $25,000 to $49,999 | 390 (93.3%) | 28 (6.7%) |
| $50,000 to $74,999 | 204 (69.2%) | 91 (30.8%) |
| $75,000 to $99,999 | 394 (93.6%) | 27 (6.4%) |
| $100,000 and over | 649 (88.3%) | 86 (11.7%) |
Public vs Private Health Insurance Coverage by Age in Chilhowie
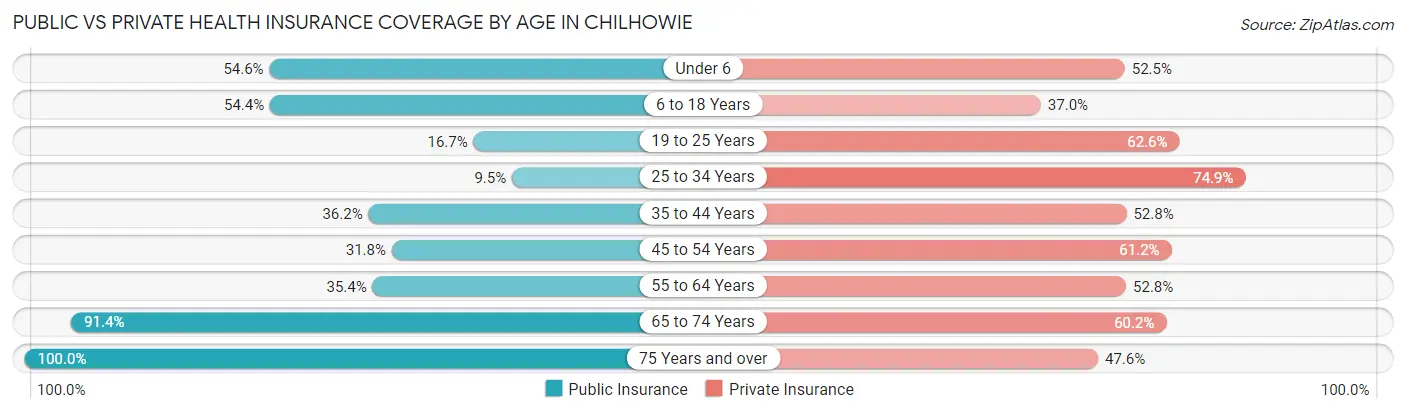
| Age Bracket | Public Insurance | Private Insurance |
| Under 6 | 54 (54.5%) | 52 (52.5%) |
| 6 to 18 Years | 190 (54.4%) | 129 (37.0%) |
| 19 to 25 Years | 29 (16.7%) | 109 (62.6%) |
| 25 to 34 Years | 22 (9.5%) | 173 (74.9%) |
| 35 to 44 Years | 102 (36.2%) | 149 (52.8%) |
| 45 to 54 Years | 114 (31.8%) | 219 (61.2%) |
| 55 to 64 Years | 96 (35.4%) | 143 (52.8%) |
| 65 to 74 Years | 264 (91.3%) | 174 (60.2%) |
| 75 Years and over | 103 (100.0%) | 49 (47.6%) |
| Total | 974 (45.2%) | 1,197 (55.5%) |
Disability Status by Sex by Age in Chilhowie
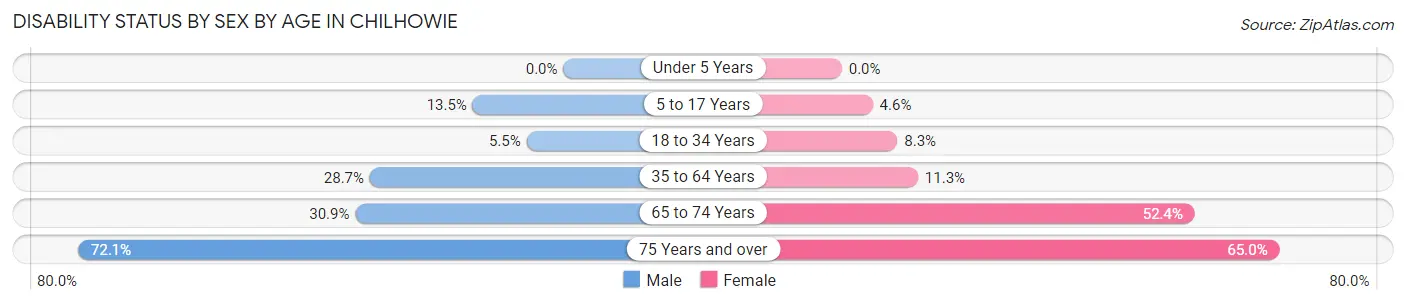
| Age Bracket | Male | Female |
| Under 5 Years | 0 (0.0%) | 0 (0.0%) |
| 5 to 17 Years | 14 (13.5%) | 11 (4.6%) |
| 18 to 34 Years | 13 (5.5%) | 16 (8.3%) |
| 35 to 64 Years | 127 (28.7%) | 53 (11.3%) |
| 65 to 74 Years | 38 (30.9%) | 87 (52.4%) |
| 75 Years and over | 31 (72.1%) | 39 (65.0%) |
Disability Class by Sex by Age in Chilhowie
Disability Class: Hearing Difficulty
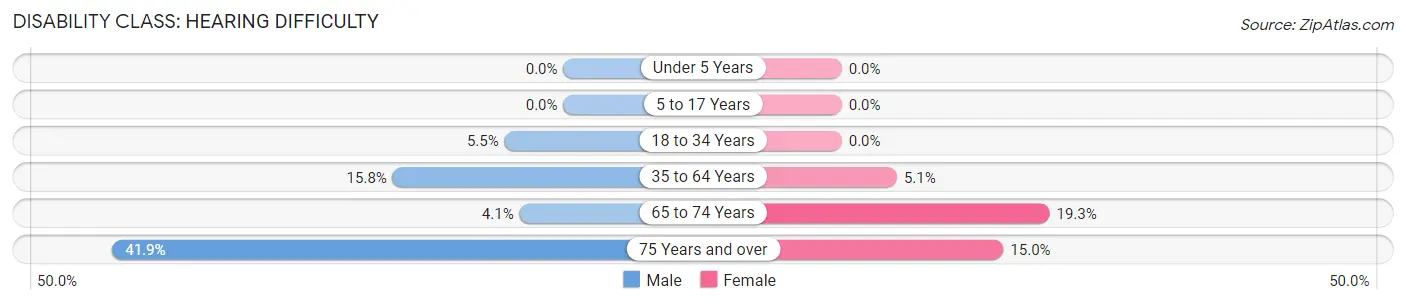
| Age Bracket | Male | Female |
| Under 5 Years | 0 (0.0%) | 0 (0.0%) |
| 5 to 17 Years | 0 (0.0%) | 0 (0.0%) |
| 18 to 34 Years | 13 (5.5%) | 0 (0.0%) |
| 35 to 64 Years | 70 (15.8%) | 24 (5.1%) |
| 65 to 74 Years | 5 (4.1%) | 32 (19.3%) |
| 75 Years and over | 18 (41.9%) | 9 (15.0%) |
Disability Class: Vision Difficulty
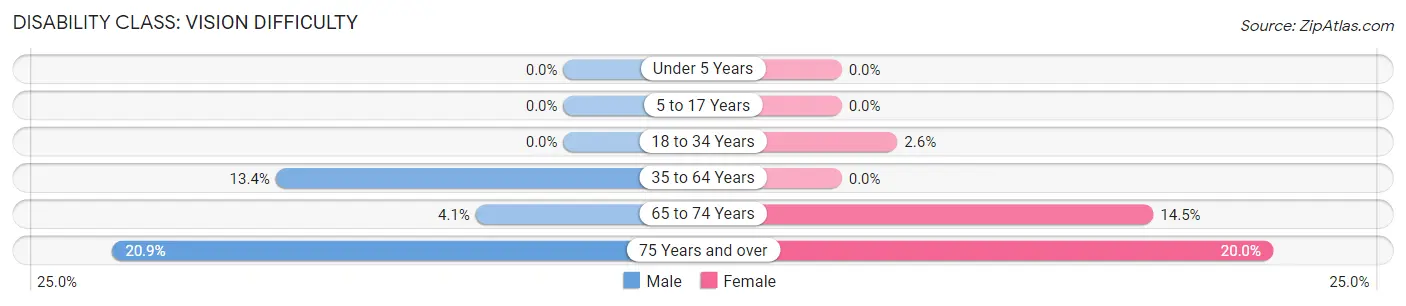
| Age Bracket | Male | Female |
| Under 5 Years | 0 (0.0%) | 0 (0.0%) |
| 5 to 17 Years | 0 (0.0%) | 0 (0.0%) |
| 18 to 34 Years | 0 (0.0%) | 5 (2.6%) |
| 35 to 64 Years | 59 (13.4%) | 0 (0.0%) |
| 65 to 74 Years | 5 (4.1%) | 24 (14.5%) |
| 75 Years and over | 9 (20.9%) | 12 (20.0%) |
Disability Class: Cognitive Difficulty
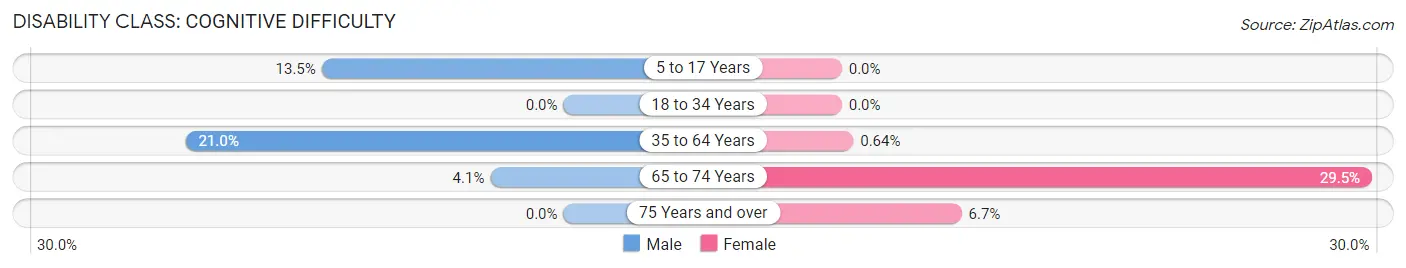
| Age Bracket | Male | Female |
| 5 to 17 Years | 14 (13.5%) | 0 (0.0%) |
| 18 to 34 Years | 0 (0.0%) | 0 (0.0%) |
| 35 to 64 Years | 93 (21.0%) | 3 (0.6%) |
| 65 to 74 Years | 5 (4.1%) | 49 (29.5%) |
| 75 Years and over | 0 (0.0%) | 4 (6.7%) |
Disability Class: Ambulatory Difficulty
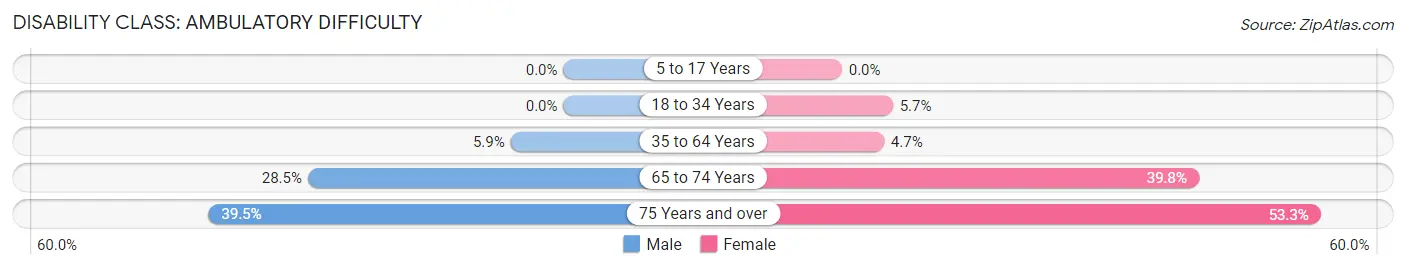
| Age Bracket | Male | Female |
| 5 to 17 Years | 0 (0.0%) | 0 (0.0%) |
| 18 to 34 Years | 0 (0.0%) | 11 (5.7%) |
| 35 to 64 Years | 26 (5.9%) | 22 (4.7%) |
| 65 to 74 Years | 35 (28.5%) | 66 (39.8%) |
| 75 Years and over | 17 (39.5%) | 32 (53.3%) |
Disability Class: Self-Care Difficulty
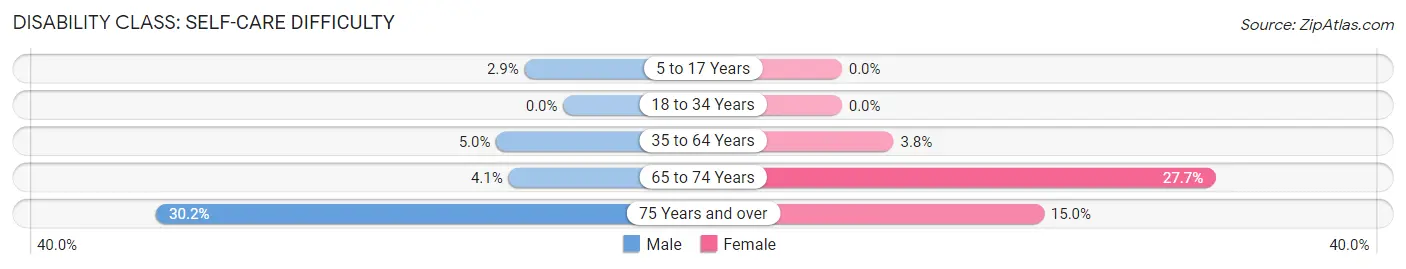
| Age Bracket | Male | Female |
| 5 to 17 Years | 3 (2.9%) | 0 (0.0%) |
| 18 to 34 Years | 0 (0.0%) | 0 (0.0%) |
| 35 to 64 Years | 22 (5.0%) | 18 (3.8%) |
| 65 to 74 Years | 5 (4.1%) | 46 (27.7%) |
| 75 Years and over | 13 (30.2%) | 9 (15.0%) |
Technology Access in Chilhowie
Computing Device Access in Chilhowie
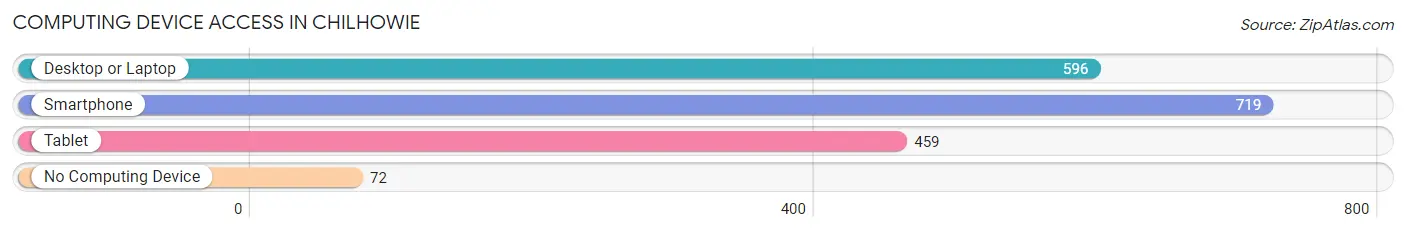
| Device Type | # Households | % Households |
| Desktop or Laptop | 596 | 69.7% |
| Smartphone | 719 | 84.1% |
| Tablet | 459 | 53.7% |
| No Computing Device | 72 | 8.4% |
| Total | 855 | 100.0% |
Internet Access in Chilhowie
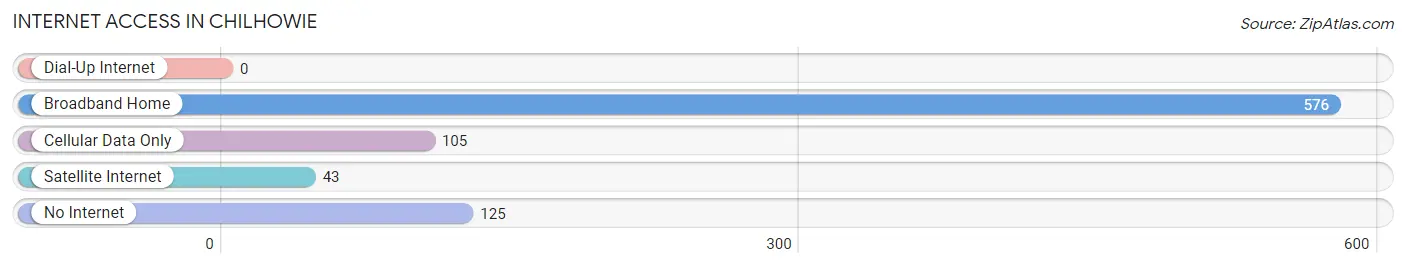
| Internet Type | # Households | % Households |
| Dial-Up Internet | 0 | 0.0% |
| Broadband Home | 576 | 67.4% |
| Cellular Data Only | 105 | 12.3% |
| Satellite Internet | 43 | 5.0% |
| No Internet | 125 | 14.6% |
| Total | 855 | 100.0% |
Chilhowie Summary
Chilhowie is a town located in Smyth County, Virginia, United States. It is the county seat of Smyth County and is part of the Kingsport–Bristol (TN)–Bristol (VA) Metropolitan Statistical Area, which is a component of the Johnson City–Kingsport–Bristol, TN-VA Combined Statistical Area – commonly known as the "Tri-Cities" region. The population was 1,781 at the 2010 census.
History
The area that is now Chilhowie was first settled in the late 1700s by Scots-Irish immigrants. The town was originally known as "Chilhowie Springs" and was established in 1848. The name is derived from the Cherokee word "Chilhowee," which means "valley of many deer."
The town was incorporated in 1872 and was the county seat of Smyth County. In the late 19th century, Chilhowie was a major stop on the Norfolk and Western Railway. The town was also home to a number of manufacturing businesses, including a woolen mill, a furniture factory, and a canning factory.
Geography
Chilhowie is located at 36 41 25 North 81 37 17 West 36 690278 81 621389
According to the United States Census Bureau, the town has a total area of 1.2 square miles (3.1 km2), all of it land.
Economy
Chilhowie is home to a number of small businesses, including a grocery store, a hardware store, a pharmacy, and a number of restaurants. The town is also home to a number of manufacturing businesses, including a furniture factory, a canning factory, and a woolen mill.
Demographics
As of the census of 2000, there were 1,845 people, 790 households, and 517 families residing in the town. The population density was 1,541.2 people per square mile (595.2/km2). There were 860 housing units at an average density of 709.2 per square mile (274.3/km2). The racial makeup of the town was 97.45% White, 0.76% African American, 0.05% Native American, 0.05% Asian, 0.05% Pacific Islander, 0.60% from other races, and 1.04% from two or more races. Hispanic or Latino of any race were 0.60% of the population.
There were 790 households, out of which 28.2% had children under the age of 18 living with them, 48.1% were married couples living together, 13.3% had a female householder with no husband present, and 34.6% were non-families. 31.3% of all households were made up of individuals, and 15.3% had someone living alone who was 65 years of age or older. The average household size was 2.33 and the average family size was 2.90.
In the town, the population was spread out, with 23.2% under the age of 18, 8.2% from 18 to 24, 27.2% from 25 to 44, 24.2% from 45 to 64, and 17.2% who were 65 years of age or older. The median age was 39 years. For every 100 females, there were 87.2 males. For every 100 females age 18 and over, there were 82.2 males.
The median income for a household in the town was $27,917, and the median income for a family was $35,000. Males had a median income of $27,500 versus $20,000 for females. The per capita income for the town was $15,945. About 11.2% of families and 14.2% of the population were below the poverty line, including 17.2% of those under age 18 and 16.2% of those age 65 or over.
Common Questions
What is Per Capita Income in Chilhowie?
Per Capita income in Chilhowie is $28,761.
What is the Median Family Income in Chilhowie?
Median Family Income in Chilhowie is $76,452.
What is the Median Household income in Chilhowie?
Median Household Income in Chilhowie is $60,313.
What is Income or Wage Gap in Chilhowie?
Income or Wage Gap in Chilhowie is 11.5%.
Women in Chilhowie earn 88.5 cents for every dollar earned by a man.
What is Inequality or Gini Index in Chilhowie?
Inequality or Gini Index in Chilhowie is 0.40.
What is the Total Population of Chilhowie?
Total Population of Chilhowie is 2,371.
What is the Total Male Population of Chilhowie?
Total Male Population of Chilhowie is 1,053.
What is the Total Female Population of Chilhowie?
Total Female Population of Chilhowie is 1,318.
What is the Ratio of Males per 100 Females in Chilhowie?
There are 79.89 Males per 100 Females in Chilhowie.
What is the Ratio of Females per 100 Males in Chilhowie?
There are 125.17 Females per 100 Males in Chilhowie.
What is the Median Population Age in Chilhowie?
Median Population Age in Chilhowie is 47.1 Years.
What is the Average Family Size in Chilhowie
Average Family Size in Chilhowie is 3.0 People.
What is the Average Household Size in Chilhowie
Average Household Size in Chilhowie is 2.5 People.
How Large is the Labor Force in Chilhowie?
There are 1,120 People in the Labor Forcein in Chilhowie.
What is the Percentage of People in the Labor Force in Chilhowie?
56.2% of People are in the Labor Force in Chilhowie.
What is the Unemployment Rate in Chilhowie?
Unemployment Rate in Chilhowie is 2.7%.