Zip Codes with the Highest Percentage of Households with Income Above $200,000 in Abingdon, VA
RELATED REPORTS & OPTIONS
Household Income | $200k+
Abingdon
Compare Zip Codes
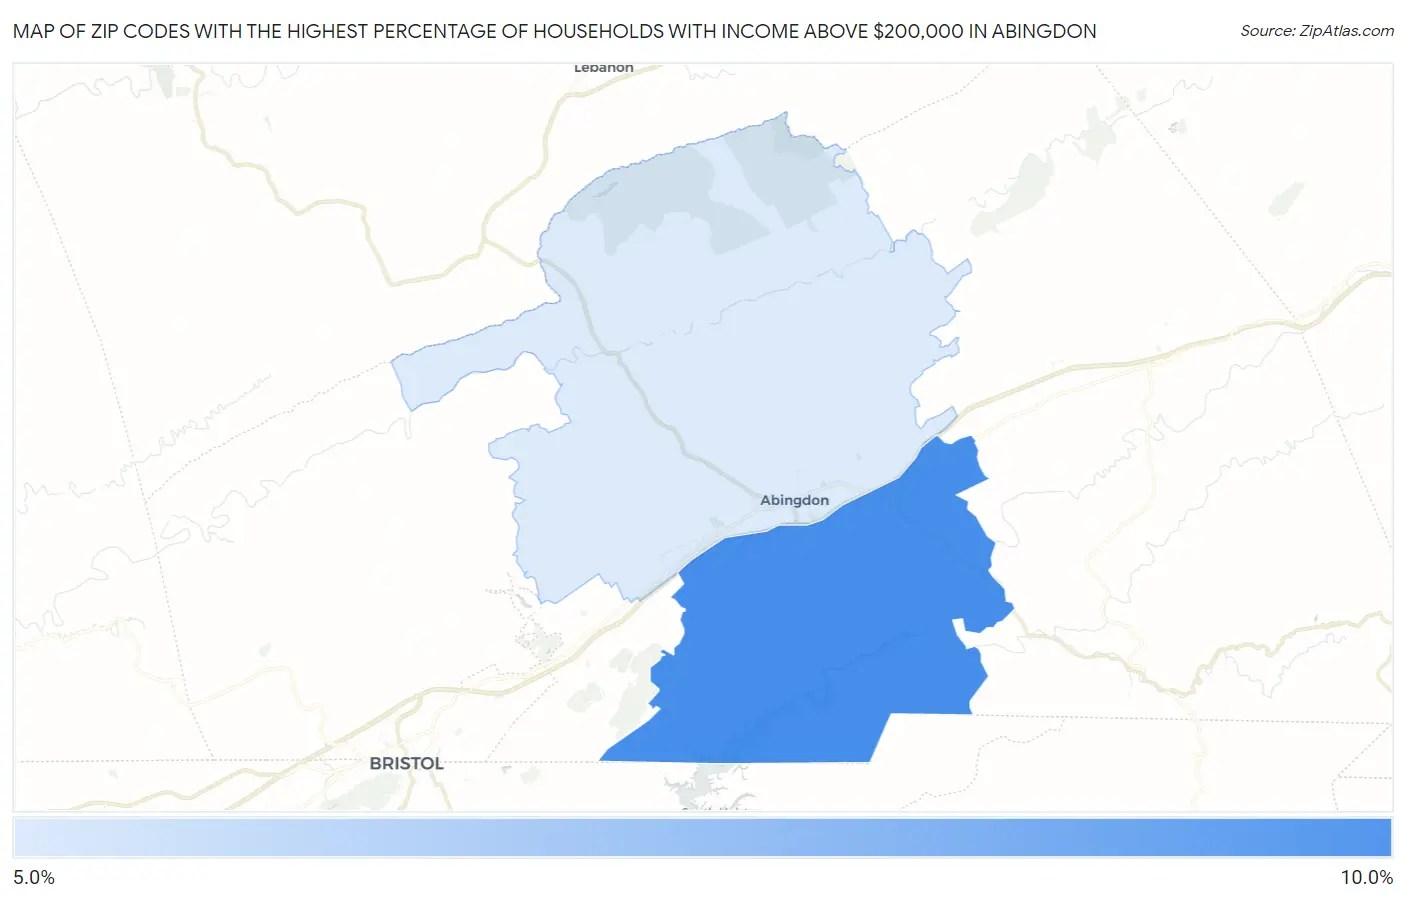
Map of Zip Codes with the Highest Percentage of Households with Income Above $200,000 in Abingdon
5.6%
8.7%
Zip Codes with the Highest Percentage of Households with Income Above $200,000 in Abingdon, VA
| Zip Code | Households with Income > $200k | vs State | vs National | |
| 1. | 24211 | 8.7% | 15.6%(-6.90)#317 | 11.4%(-2.70)#9,559 |
| 2. | 24210 | 5.6% | 15.6%(-10.00)#426 | 11.4%(-5.80)#14,301 |
1
Common Questions
What are the Top Zip Codes with the Highest Percentage of Households with Income Above $200,000 in Abingdon, VA?
Top Zip Codes with the Highest Percentage of Households with Income Above $200,000 in Abingdon, VA are:
What zip code has the Highest Percentage of Households with Income Above $200,000 in Abingdon, VA?
24211 has the Highest Percentage of Households with Income Above $200,000 in Abingdon, VA with 8.7%.
What is the Percentage of Households with Income Above $200,000 in Abingdon, VA?
Percentage of Households with Income Above $200,000 in Abingdon is 7.1%.
What is the Percentage of Households with Income Above $200,000 in Virginia?
Percentage of Households with Income Above $200,000 in Virginia is 15.6%.
What is the Percentage of Households with Income Above $200,000 in the United States?
Percentage of Households with Income Above $200,000 in the United States is 11.4%.