Zip Codes with the Highest Percentage of State Government Employees in Abingdon, VA
RELATED REPORTS & OPTIONS
State Government Employees
Abingdon
Compare Zip Codes
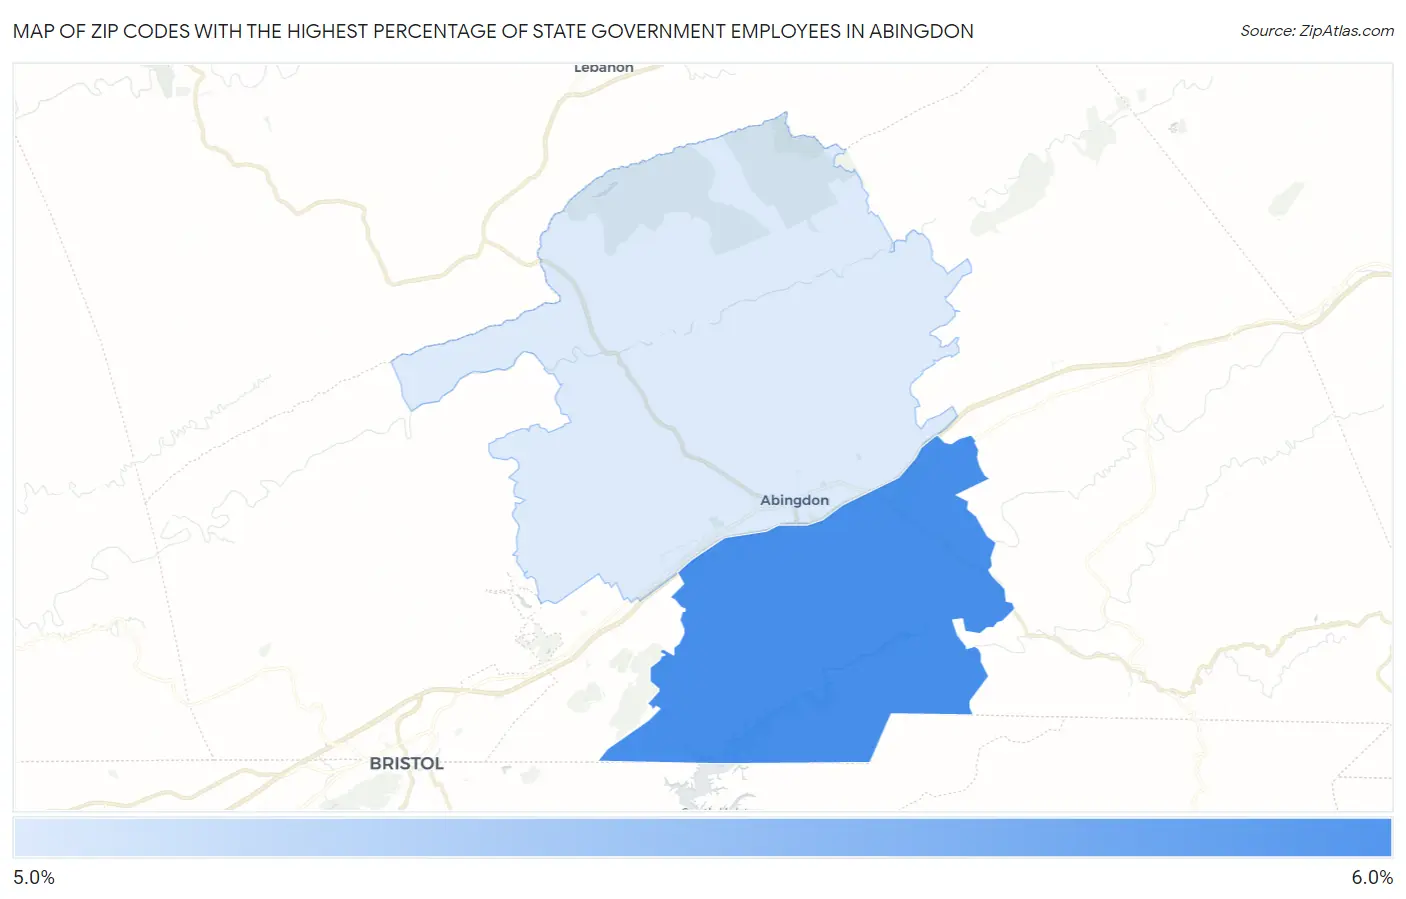
Map of Zip Codes with the Highest Percentage of State Government Employees in Abingdon
5.6%
6.0%
Zip Codes with the Highest Percentage of State Government Employees in Abingdon, VA
| Zip Code | % State Government Employees | vs State | vs National | |
| 1. | 24211 | 6.0% | 4.1%(+1.92)#271 | 4.2%(+1.74)#8,755 |
| 2. | 24210 | 5.6% | 4.1%(+1.53)#299 | 4.2%(+1.35)#9,534 |
1
Common Questions
What are the Top Zip Codes with the Highest Percentage of State Government Employees in Abingdon, VA?
Top Zip Codes with the Highest Percentage of State Government Employees in Abingdon, VA are:
What zip code has the Highest Percentage of State Government Employees in Abingdon, VA?
24211 has the Highest Percentage of State Government Employees in Abingdon, VA with 6.0%.
What is the Percentage of State Government Employees in Abingdon, VA?
Percentage of State Government Employees in Abingdon is 6.7%.
What is the Percentage of State Government Employees in Virginia?
Percentage of State Government Employees in Virginia is 4.1%.
What is the Percentage of State Government Employees in the United States?
Percentage of State Government Employees in the United States is 4.2%.