Zip Codes with the Highest Percentage of Population Employed in Food Preparation & Serving in Abingdon, VA
RELATED REPORTS & OPTIONS
Food Preparation & Serving
Abingdon
Compare Zip Codes
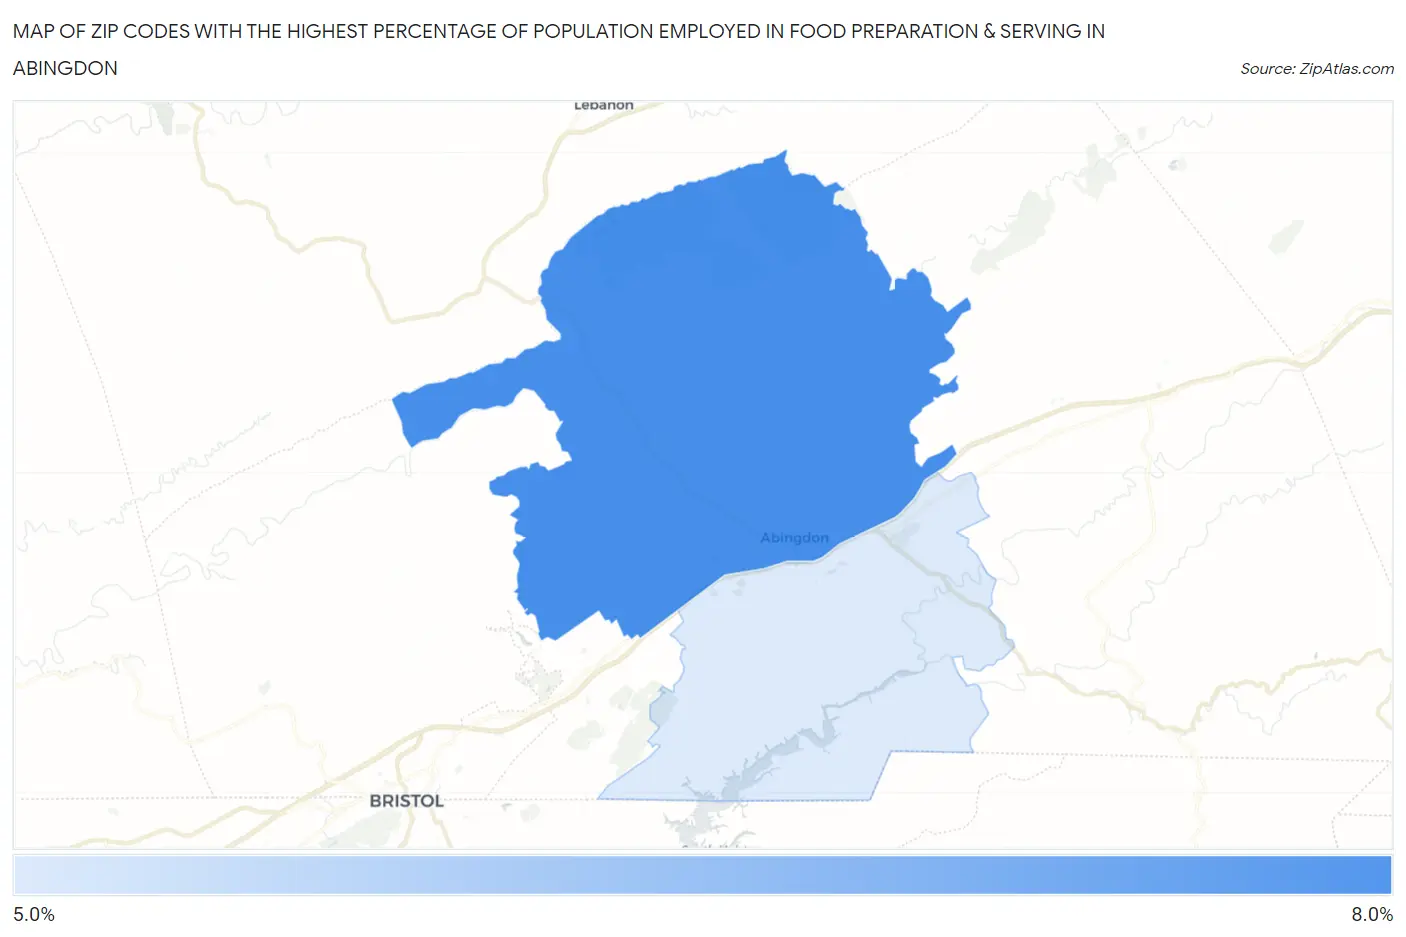
Map of Zip Codes with the Highest Percentage of Population Employed in Food Preparation & Serving in Abingdon
5.3%
7.6%
Zip Codes with the Highest Percentage of Population Employed in Food Preparation & Serving in Abingdon, VA
| Zip Code | % Employed | vs State | vs National | |
| 1. | 24210 | 7.6% | 4.8%(+2.84)#130 | 5.3%(+2.34)#5,343 |
| 2. | 24211 | 5.3% | 4.8%(+0.536)#263 | 5.3%(+0.036)#11,682 |
1
Common Questions
What are the Top Zip Codes with the Highest Percentage of Population Employed in Food Preparation & Serving in Abingdon, VA?
Top Zip Codes with the Highest Percentage of Population Employed in Food Preparation & Serving in Abingdon, VA are:
What zip code has the Highest Percentage of Population Employed in Food Preparation & Serving in Abingdon, VA?
24210 has the Highest Percentage of Population Employed in Food Preparation & Serving in Abingdon, VA with 7.6%.
What is the Percentage of Population Employed in Food Preparation & Serving in Abingdon, VA?
Percentage of Population Employed in Food Preparation & Serving in Abingdon is 9.5%.
What is the Percentage of Population Employed in Food Preparation & Serving in Virginia?
Percentage of Population Employed in Food Preparation & Serving in Virginia is 4.8%.
What is the Percentage of Population Employed in Food Preparation & Serving in the United States?
Percentage of Population Employed in Food Preparation & Serving in the United States is 5.3%.