Zip Codes with the Highest Percentage of Households with Income Above $200,000 in Chantilly, VA
RELATED REPORTS & OPTIONS
Household Income | $200k+
Chantilly
Compare Zip Codes
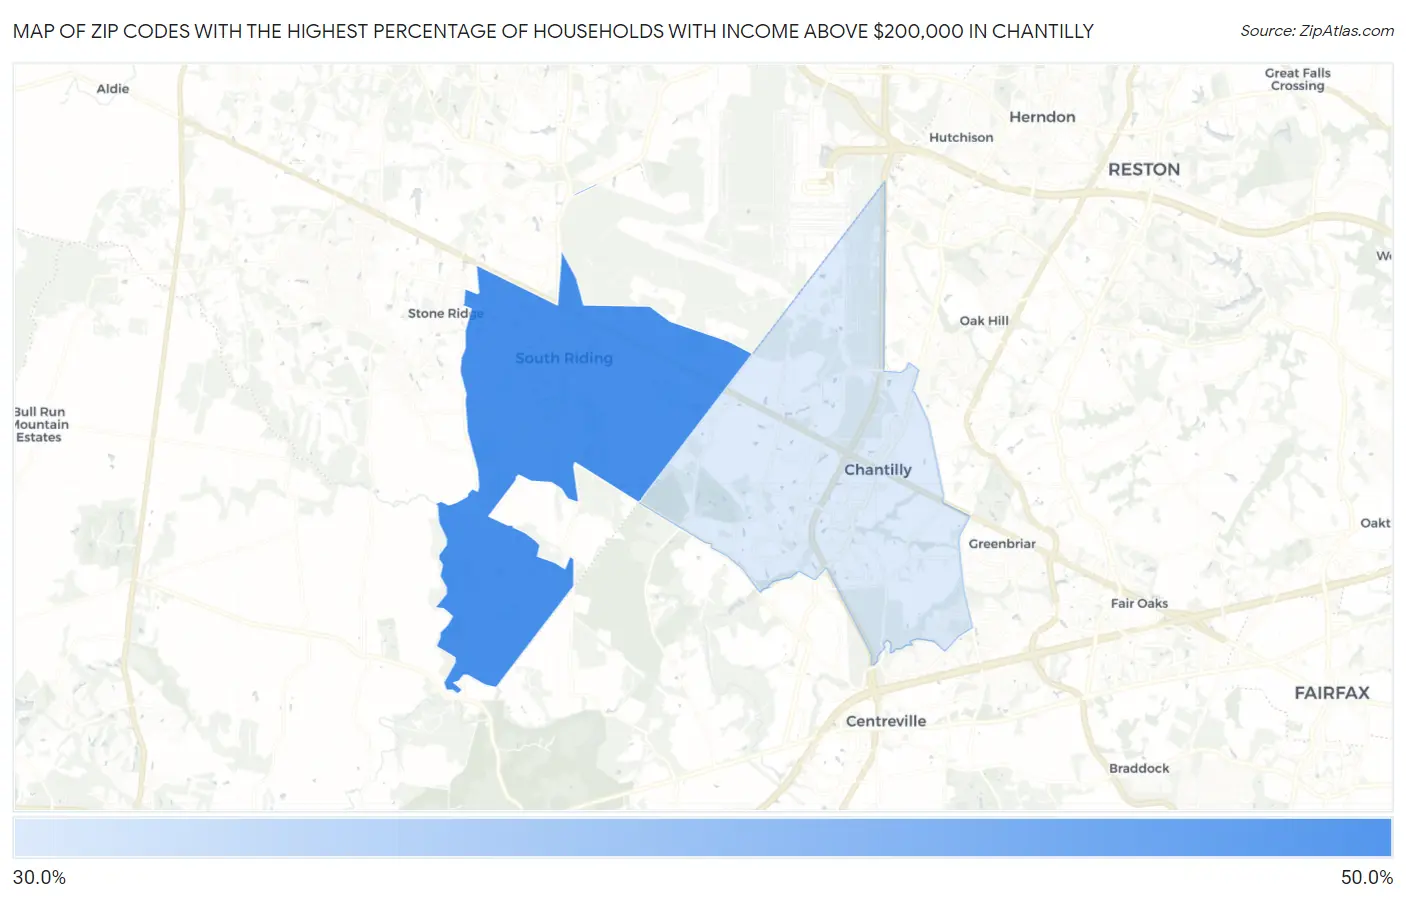
Map of Zip Codes with the Highest Percentage of Households with Income Above $200,000 in Chantilly
33.3%
45.3%
Zip Codes with the Highest Percentage of Households with Income Above $200,000 in Chantilly, VA
| Zip Code | Households with Income > $200k | vs State | vs National | |
| 1. | 20152 | 45.3% | 15.6%(+29.7)#22 | 11.4%(+33.9)#415 |
| 2. | 20151 | 33.3% | 15.6%(+17.7)#63 | 11.4%(+21.9)#1,126 |
1
Common Questions
What are the Top Zip Codes with the Highest Percentage of Households with Income Above $200,000 in Chantilly, VA?
Top Zip Codes with the Highest Percentage of Households with Income Above $200,000 in Chantilly, VA are:
What zip code has the Highest Percentage of Households with Income Above $200,000 in Chantilly, VA?
20152 has the Highest Percentage of Households with Income Above $200,000 in Chantilly, VA with 45.3%.
What is the Percentage of Households with Income Above $200,000 in Chantilly, VA?
Percentage of Households with Income Above $200,000 in Chantilly is 33.4%.
What is the Percentage of Households with Income Above $200,000 in Virginia?
Percentage of Households with Income Above $200,000 in Virginia is 15.6%.
What is the Percentage of Households with Income Above $200,000 in the United States?
Percentage of Households with Income Above $200,000 in the United States is 11.4%.