Zip Codes with the Highest Percentage of Families with Income Above $200,000 in Abingdon, VA
RELATED REPORTS & OPTIONS
Family Income | $200k+
Abingdon
Compare Zip Codes
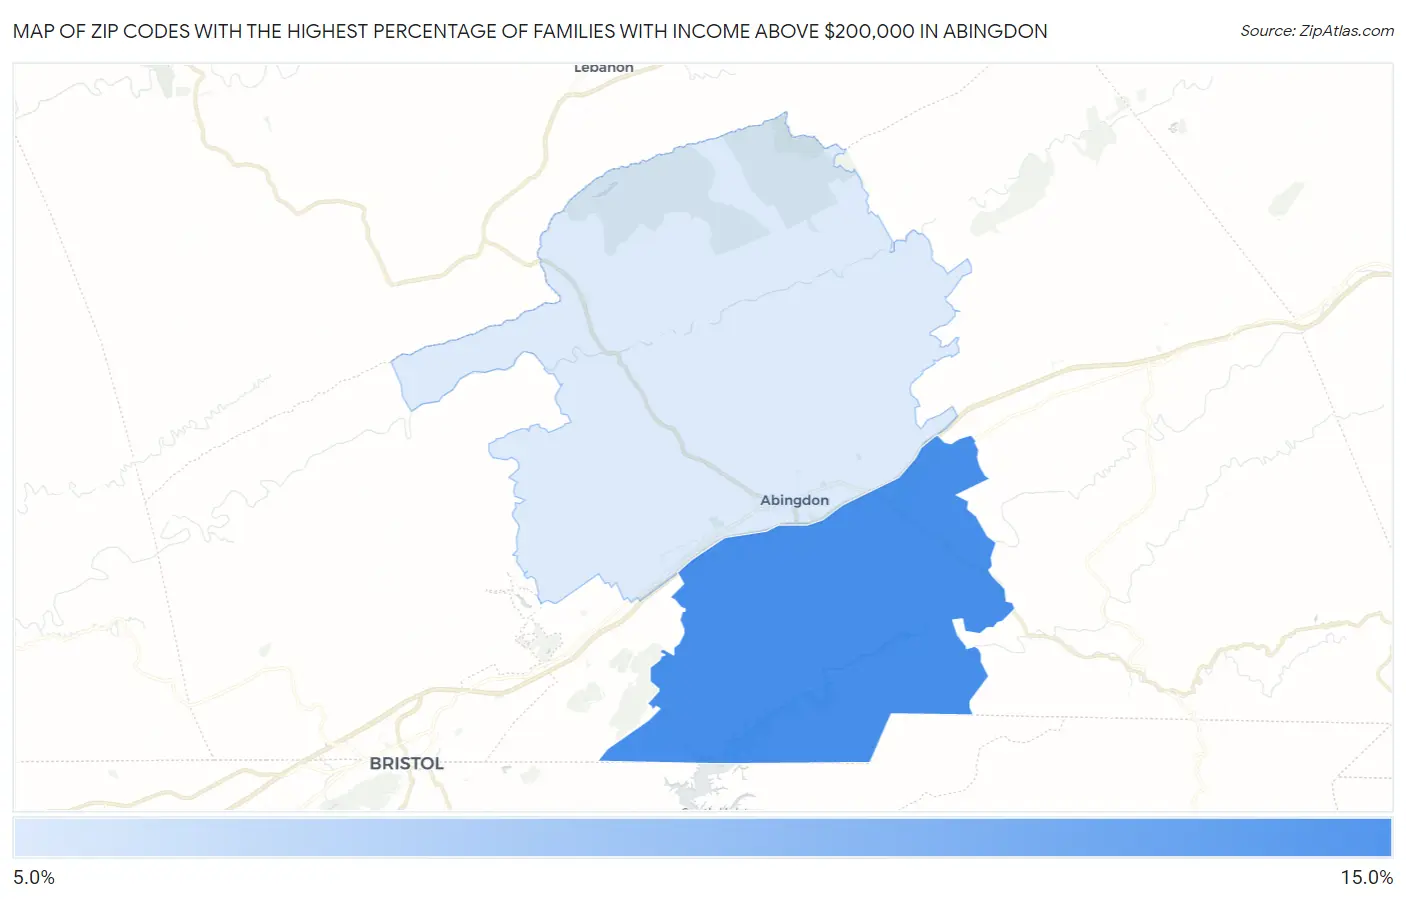
Map of Zip Codes with the Highest Percentage of Families with Income Above $200,000 in Abingdon
8.3%
12.4%
Zip Codes with the Highest Percentage of Families with Income Above $200,000 in Abingdon, VA
| Zip Code | Families with Income > $200k | vs State | vs National | |
| 1. | 24211 | 12.4% | 20.4%(-8.00)#295 | 14.8%(-2.40)#8,666 |
| 2. | 24210 | 8.3% | 20.4%(-12.1)#399 | 14.8%(-6.50)#12,799 |
1
Common Questions
What are the Top Zip Codes with the Highest Percentage of Families with Income Above $200,000 in Abingdon, VA?
Top Zip Codes with the Highest Percentage of Families with Income Above $200,000 in Abingdon, VA are:
What zip code has the Highest Percentage of Families with Income Above $200,000 in Abingdon, VA?
24211 has the Highest Percentage of Families with Income Above $200,000 in Abingdon, VA with 12.4%.
What is the Percentage of Families with Income Above $200,000 in Abingdon, VA?
Percentage of Families with Income Above $200,000 in Abingdon is 13.7%.
What is the Percentage of Families with Income Above $200,000 in Virginia?
Percentage of Families with Income Above $200,000 in Virginia is 20.4%.
What is the Percentage of Families with Income Above $200,000 in the United States?
Percentage of Families with Income Above $200,000 in the United States is 14.8%.